Article

The Determination of Priority Areas for the Restoration of Degraded Tropical Peatland Using Hydrological, Topographical, and Remote Sensing Approaches

Department of Geodetic Engineering, Faculty of Engineering, Universitas Gadjah Mada, Jalan Grafika No. 2, Yogyakarta 55284, Indonesia
*
Author to whom correspondence should be addressed.
Land 2022, 11(7), 1094; https://doi.org/10.3390/land11071094
Submission received: 15 June 2022 / Revised: 8 July 2022 / Accepted: 8 July 2022 / Published: 18 July 2022
(This article belongs to the Special Issue Peatland Restoration – towards an Integrated Approach)

Abstract

:
Degraded peatland is caused by forest clearing and the construction of artificial water networks. When water management is not implemented across land uses in the entire peatland landscape, then it will be a big issue that causes a water deficit and leads to increasing droughts and fires. Effective restoration must first identify the part of Peatland Hydrological system Units (PHUs) with insufficient water storage and resources. This study used intercorrelated factors of water balance, deficit months, NDMI-NDVI indices, dry periods, recurrent fires, peat depth, and water loss conditions, as the evaluation parameters, within individual sub-PHUs to determine the most degraded areas that require intervention and restoration. Sub-PHU was determined based on the peat hydrological unity concept by identifying streamline, outlet channels, peat-depth, slopes, and network connectivity. Global hydrological data using TerraClimate and CHIRPS, combined with field observations, were used to validate and calculate each sub-PHU’s water balance and dry periods. Soil moisture (NDMI), vegetation density (NDVI), and fire frequency were extracted from multispectral satellite images (e.g., Landsat 8, MODIS-Terra, and MODIS-Aqua). Each parameter was ranked by the score for each sub-PHU. The parameters that can be ranked are only the ordinal type of number. The lowest ranks indicated the most degraded sub-PHUs requiring peat rewetting interventions.

1. Introduction

Tropical peatland tends to be flat and wide in topography, bounded by rivers, straits, or sea, and provides open water storage as a unit of a hydrological system [1]. In tropical peatland, the highest areas with a thick peat layer are peat domes [2]. As water storage, peat domes supply water to the entire area within its hydrological unit [3]. The ability to store water makes peat soil an essential factor for the continuity of a peatland ecosystem [4]. Peat soil is formed from the remains of decayed and weathered plants that have been buried, in some regions, for millions of years [5]. Therefore, peatland is an excellent source of carbon stock [6]. Nevertheless, it can also be used as a cultivation area for a range of crops [7]. As a result, there have been many attempts to convert peatlands into planting areas [1].
Limited expanses of tropical peatlands have been used for agricultural purposes over the years by local cultures to meet their needs. However, to date, land use changes in tropical peatland areas have been more expansive due to advancements in the agricultural, planting, and forestry industries [8,9,10]. In Indonesia, several historical government programs caused peat areas to be opened and degraded. The initiatives included the transmigration program and the Mega Rice Project, which attempted to relocate people from the city to the country and transform peatlands into agricultural planting areas, respectively [1]. These projects degraded the Indonesian peatland by constructing wide drainage canals in the peatland areas [11].
The damage and degradation of these tropical peatlands have also worsened due to the issuance of acacia and palm oil concession permits for peatland areas [11]. This has resulted in most of the primary forests on peatland being cut down and cleared in order to transform them for agricultural use [1]. Massive, structured ditch networks have been built in these concession areas to lower the groundwater level, which is expected to increase the load-carrying capacity of the peatland [1,2].
The clearing of primary forests and the construction of massive canal networks in entire concession areas seriously threaten the sustainability of the tropical peatland itself [2]. It has significantly reduced the water storage capacity of the peat soil [10]. The other effects have been drought, decreased groundwater levels, peatland subsidence [12], and an increased risk of fires during dry periods [13,14].
Partial water management that only focuses on the concession areas and not the entire Peatland Hydrological Units (PHU) area has disrupted the natural hydrological balance. It has caused an increase in water run-off and a reduction in water storage capacity [11]. This condition has amplified the degradation of peat soils. Therefore, flooding is a consistent issue during the rainy season, while drought remains a challenge during the dry periods for land outside the concession areas [7]. The nature of peat soil is irreversible, and it will lose its ability to absorb and store water [15].
Water management and the design of drainage networks in peat areas should consider the condition of the whole PHU. Therefore, it is necessary to identify the entire PHU area on a detailed map [16]. The resultant maps can then be used for the restoration and water management of peatlands. Restoration has been achieved through several activities, including the re-establishment of conservation–cultivation areas [17,18]; the revegetation of damaged forests [6]; vegetation management and forest planting [7,19]; rewetting and water management [8,20,21]; and restoring the livelihoods of local communities [12,15].
These restorative activities need to be implemented according to a high-resolution map for the entire landscape of the PHU [16]. As the map will cover an extensive area, the restoration of the whole PHU area be costly as well as require high levels of energy, and time [22]. Therefore, it may be necessary to divide the tropical PHU into individual sub-PHUs (sub-domes or mini-domes), independently identifying a smaller space but still part of the whole hydrological system [15]. The method of dividing the PHU into smaller areas for rewetting operations has never been fully explored. When studying this challenge, previous studies have typically applied the watershed concept [23,24] or a geomorphological concept [25] instead of a PHU concept. However, researchers have initiated the division of sub-PHUs of tropical peatland based on the boundaries created by rivers and canals as well as peat domes (e.g., [15,26]), and the method chosen to identify the sub-PHU boundaries is essential.
The division of sub-PHUs has been conducted using conditions and parameters that are believed to correlate with sub-PHU patterns. These parameters have included topography [26,27], surface water flow [28], stream of rivers [26,29], peat depth, and gravity [30,31] across the PHU area. Determination of the sub-PHU area based on the topographical elevation of the ground surface has been used by most researchers. The convex point between the peatlands has been identified as the peak of peat domes [27]. The boundary between the two sub-PHUs has been a river or main canal located between the two sub-PHUs [26]. These rivers and canals have been the estuaries of water flow on the ground surface and the outlet of groundwater flow [32]. To simplify the identification of the border of the sub-PHUs, peat depth data has been used. Generally, thinner peat soil is located on the border area and close to the canal or river [27,33].
The sub-PHU area is then considered a unit area to evaluate the degradation of the whole PHU and determine which sub-area should be prioritized in the restoration process. The determination of priority areas for restoration based on the level of damage to peat soil has never been conducted. Typically, treatment has restored partially degraded areas without considering the hydrological integrity as a whole. By determining priority areas for restoration, future interventions can be more focused and structured. The priority areas were determined by considering several conditions: water balance [32,34], dry period [24], recurrent fires [11,35], large-scale agricultural and/or industrial plantations [11] as indicated by the artificial canal networks [23,36], and soil moisture [2,37]. Hydrogeological conditions can also be a parameter in identifying dry areas that need to be saved, especially by observing the groundwater conditions [38] and the connectivity pattern of underwater flow [35]. However, in this paper, hydrogeological identification is not included in the damage analysis.
Therefore, the objective of this paper is to determine the priority restoration areas for degraded tropical peatland based on water balance and deficit month data, dry periods, recurrent fires, vegetation density index, and soil moisture index obtained from remote sensing data using optical, radar, and Light Detection and Ranging (LiDAR) sensors.

2. Materials and Methods

2.1. Study Area

This research was located in Kahayan River–Sebangau River PHU (as known as Kahayan–Sebangau PHU), which is administratively located in the Pulangpisau Regency and Palangkaraya City, Central Kalimantan Province, Indonesia. The Kahayan–Sebangau PHU is a peatland area bordered by Kahayan River, Sebangau River, and the Java Sea, and covers an area of 451,507.2 hectares. An overview of the Kahayan–Sebangau PHU area is shown in Figure 1.
This PHU is a topographically flat area, and there are no steep and extreme topographical changes. The height difference from the shore area to the highest part (in Palangkaraya City) does not exceed 10 m. The shoreline and riversides are the lowest areas while the highest part is in the middle area, which is also the peat dome area of the PHU. This PHU has a few conserved natural forest areas in one of its domes, but it was originally part of the Mega Rice Project. The condition of this PHU has been significantly impacted by the massive canal networks that were constructed for rice fields and industrial planting areas. The massive network of artificial canals marked the existence of the concession areas and the active paddy fields. There are also a few residential areas located in Palangkaraya City and the paddy field areas.

2.2. Materials

The data used for this research consisted of the following: (1) a Digital Terrain Model (DTM) based on filtered points of cloud LiDAR measurement data with a ground sampling distance of 50 cm; (2) high-resolution aerial orthophotographs taken during LiDAR measurements using a medium-format metric camera and relief displacement was corrected using the Digital Surface Model (DSM) LiDAR data with a resolution of 20 cm; (3) peat soil mapping generated according to ground-based peat probe survey data with a transect pattern for each 500 m between drilling points and 1-kilometer interval distances between the transects; (4) ground water level and hydrological data, continuously measured on peatland water monitoring systems (SIPALAGA); (5) position of hotspot data collected using Moderate Resolution Imaging Spectroradiometer (MODIS)-Terra and MODIS-Aqua satellite images with a spatial resolution of 1 km (accessed at https://earthdata.nasa.gov/firms, accessed on 21 October 2021) [39,40]; (6) Landsat-8 to analyze the wetness and vegetation index using Normalized Difference Vegetation Index (NDVI), Normalized Difference Moisture Index (NDMI), and Tasseled Cap transformation (https://sentinels.copernicus.eu/web/sentinel/missions/sentinel-2, accessed on 22 October 2021) [41]; and (7) global hydrological data collected from TerraClimate (accessed at http://www.climatologylab.org/terraclimate.html, accessed on 25 September 2021) [42] and Climate Hazards Group InfraRed Precipitation with Station (CHIRPS) daily rainfall data (https://www.chc.ucsb.edu/ data/chirps, accessed on 4 November 2021) [43]. Points 1–4 were measured by the Peatland and Mangrove Restoration Agency of the Republic of Indonesia (BRGM-RI) and processed by the authors; Points 5–7 were collected and processed using Google Earth Engine (accessed at https://code.earthengine.google.com, accessed on September to November 2021).
The DTM-LiDAR data coverage did not cover all PHU areas; the identification of some primary outlet channels which were not covered by LiDAR data was only done using a DTM filtered from a WorldDEM. Although this did not provide the same level of detail as LiDAR data, the position of the main outlet canal was identified in DTM–WorldDEM.
The determination of the runoff coefficient value in the peatland was calculated based on the observation of rainfall data and the changes in groundwater levels [44]. The principle of runoff coefficient calculation was the ratio between the volume of rain in a specific area to the volume of runoff to the channel during a rain event [45]. The calculation of the average peatland flow coefficient at each location during the selected rain event was conducted using several approximation formulas. Several stations of the SIPALAGA are located on the east side of the Kahayan–Sebangau PHU (Figure 4). Even though the distribution of the SIPALAGA stations was not ideal, it was representative of the conditions across the entire PHU.
Water balance calculations were conducted using hydrological satellite data from TerraClimate, including the monthly precipitation and evapotranspiration data. These data were chosen due to having sufficient spatial resolution, as compared to the coverage area of the mapped PHU (the ground spatial distance of TerraClimate data was 2.5 arc-minute or approximately ± 4638.3 m) [42]. This spatial resolution could accurately indicate which areas had higher rainfall than others.
The daily rain identification was based on the CHIRPS data that was processed and accessed via Google Earth Engine. The CHIRPS data provided satellite-based daily rainfall data with a spatial resolution of 0.05° or approximately 5.566 m [43]. Using this ground spatial resolution, rain events and their intensity were identified in every part of the Kahayan–Sebangau PHU.

2.3. Determination of Streamline and Outlet

DTM data provided information on ground-level elevation that was obtained based on field measurement data using various methods. The method used to create this DTM would significantly determine the accuracy of the resulting topographic information. The most frequently used DTM was based on the global Digital Elevation Models (DEMs). Included in these global DEMs are the United States Geological Survey digital elevation model (USGS DEM) [46], the Shuttle Radar Topography Mission digital surface model (SRTM DSM) [26,47], and the Advanced Spaceborne Thermal Emission and Reflection Radiometer global digital elevation model (ASTER GDEM) [48]. The DEMs had a low spatial resolution below 30 m. However, several other DEM data sources have been more promising and commonly used to produce DTMs with better spatial resolution. They included the Advanced Land Observing Satellite of the Phased Array type L-band Synthetic Aperture Radar (ALOS PALSAR), which had a resolution of 12.5 m; Sentinel-1 satellite images (resolution of 10 m) [33]; stereo aerial photographs, which yielded up to sub-meter resolution; and LiDAR, with a resolution of up to sub-meters [49]. The more accurate the resulting DTM was, the more comprehensive the ground surface elevation data would be.
The DEMs were transformed into DTMs in order to obtain the ground surface elevation for use in surface hydrological flow analysis. The conversion of DEM to DTM was based on the deflection angle of ground-to-land-cover surfaces [50]; based on a reduction in the average height of land cover identified from optical satellite images [26]; or by reducing points of cloud elevation of canopies based on the points of cloud elevation of ground [49]. Based on an accurate DTM, the canals could be accurately identified [51]. The identification of canals and patterns of water surface runoff was beneficial for water-flow modeling. This water-flow modeling was performed using a hydrological flow analysis with Geographic Information System (GIS) tools. The hydrological flow analysis involved identifying depression-less DTMs and determining the flow direction of each pixel. The following stages defined the accumulation of water flow, the structure of flow patterns, and the order of surface water flow [52,53].
Based on the streamline of water flow and the order of surface water flow, it was possible to identify which canals and rivers could be used as boundaries between sub-PHUs. This streamline was usually a natural river or canal with a large order with a high discharge level on rainy days in peatland areas. The river is an outlet for water flow in peatlands, both for surface water flow and groundwater flow [54]. Field verification and identification based on high-resolution images were necessary to ensure that the channel was the outlet. In general, the sub-PHU boundaries formed a pattern of connected outlet canals as a closed network [15,26].

2.4. Calculation of Precipitation and Hydrological Data

Precipitation and hydrological data in this study were sourced from two types of data sources: global satellite data and field observational data. Satellite data, in this case, was used to determine the global hydrological conditions in all PHU areas. The field observational data was used to obtain the reference values and calibrations determined the relationship between the data.
The first satellite data used in this research was global daily rainfall data from the CHIRPS satellite data. CHIRPS has provided global daily rainfall data for over 30 years. CHIRPS combines data from satellite imagery with a resolution of 0.05° and field observational data [43]. Based on daily precipitation data, the rain conditions throughout the PHU area were identified in terms of intensity and the amount of consecutive dry days without rain. Another satellite data used in this study was TerraClimate. Similar to CHIRPS, TerraClimate also combines satellite data and field station observational data. However, TerraClimate provides monthly accumulation data with more complex varieties. For example, it has provided data on precipitation, evapotranspiration, run-off, soil moisture, etc. [42]. In this study, the data was necessary for analyzing the rainfall characteristics, consecutive dry days, and the water balance.
The research area was a peatland where runoff occurs on and below the peat soil surface. As a result, lateral and vertical water infiltration occurred in the peat soil column [24,32]. Therefore, direct observation of changes in groundwater level, rainfall intensity, and evapotranspiration in the field was crucial. The observations were conducted at several locations in the PHU area with data-recording intervals of 10 min using an Automatic Rain Recorder (ARR). The ARR sensor was installed in SIPALAGA station. In this research, only three SIPALAGA stations were used, namely the Dandang, Jabiren_1, and Tanjung Taruna stations. The analysis of observational data was performed to obtain accurate data, so the relationship between precipitation, groundwater level fluctuations, evapotranspiration, and the volume of runoff and water infiltration in the peat soil could be accurately determined [24,32].

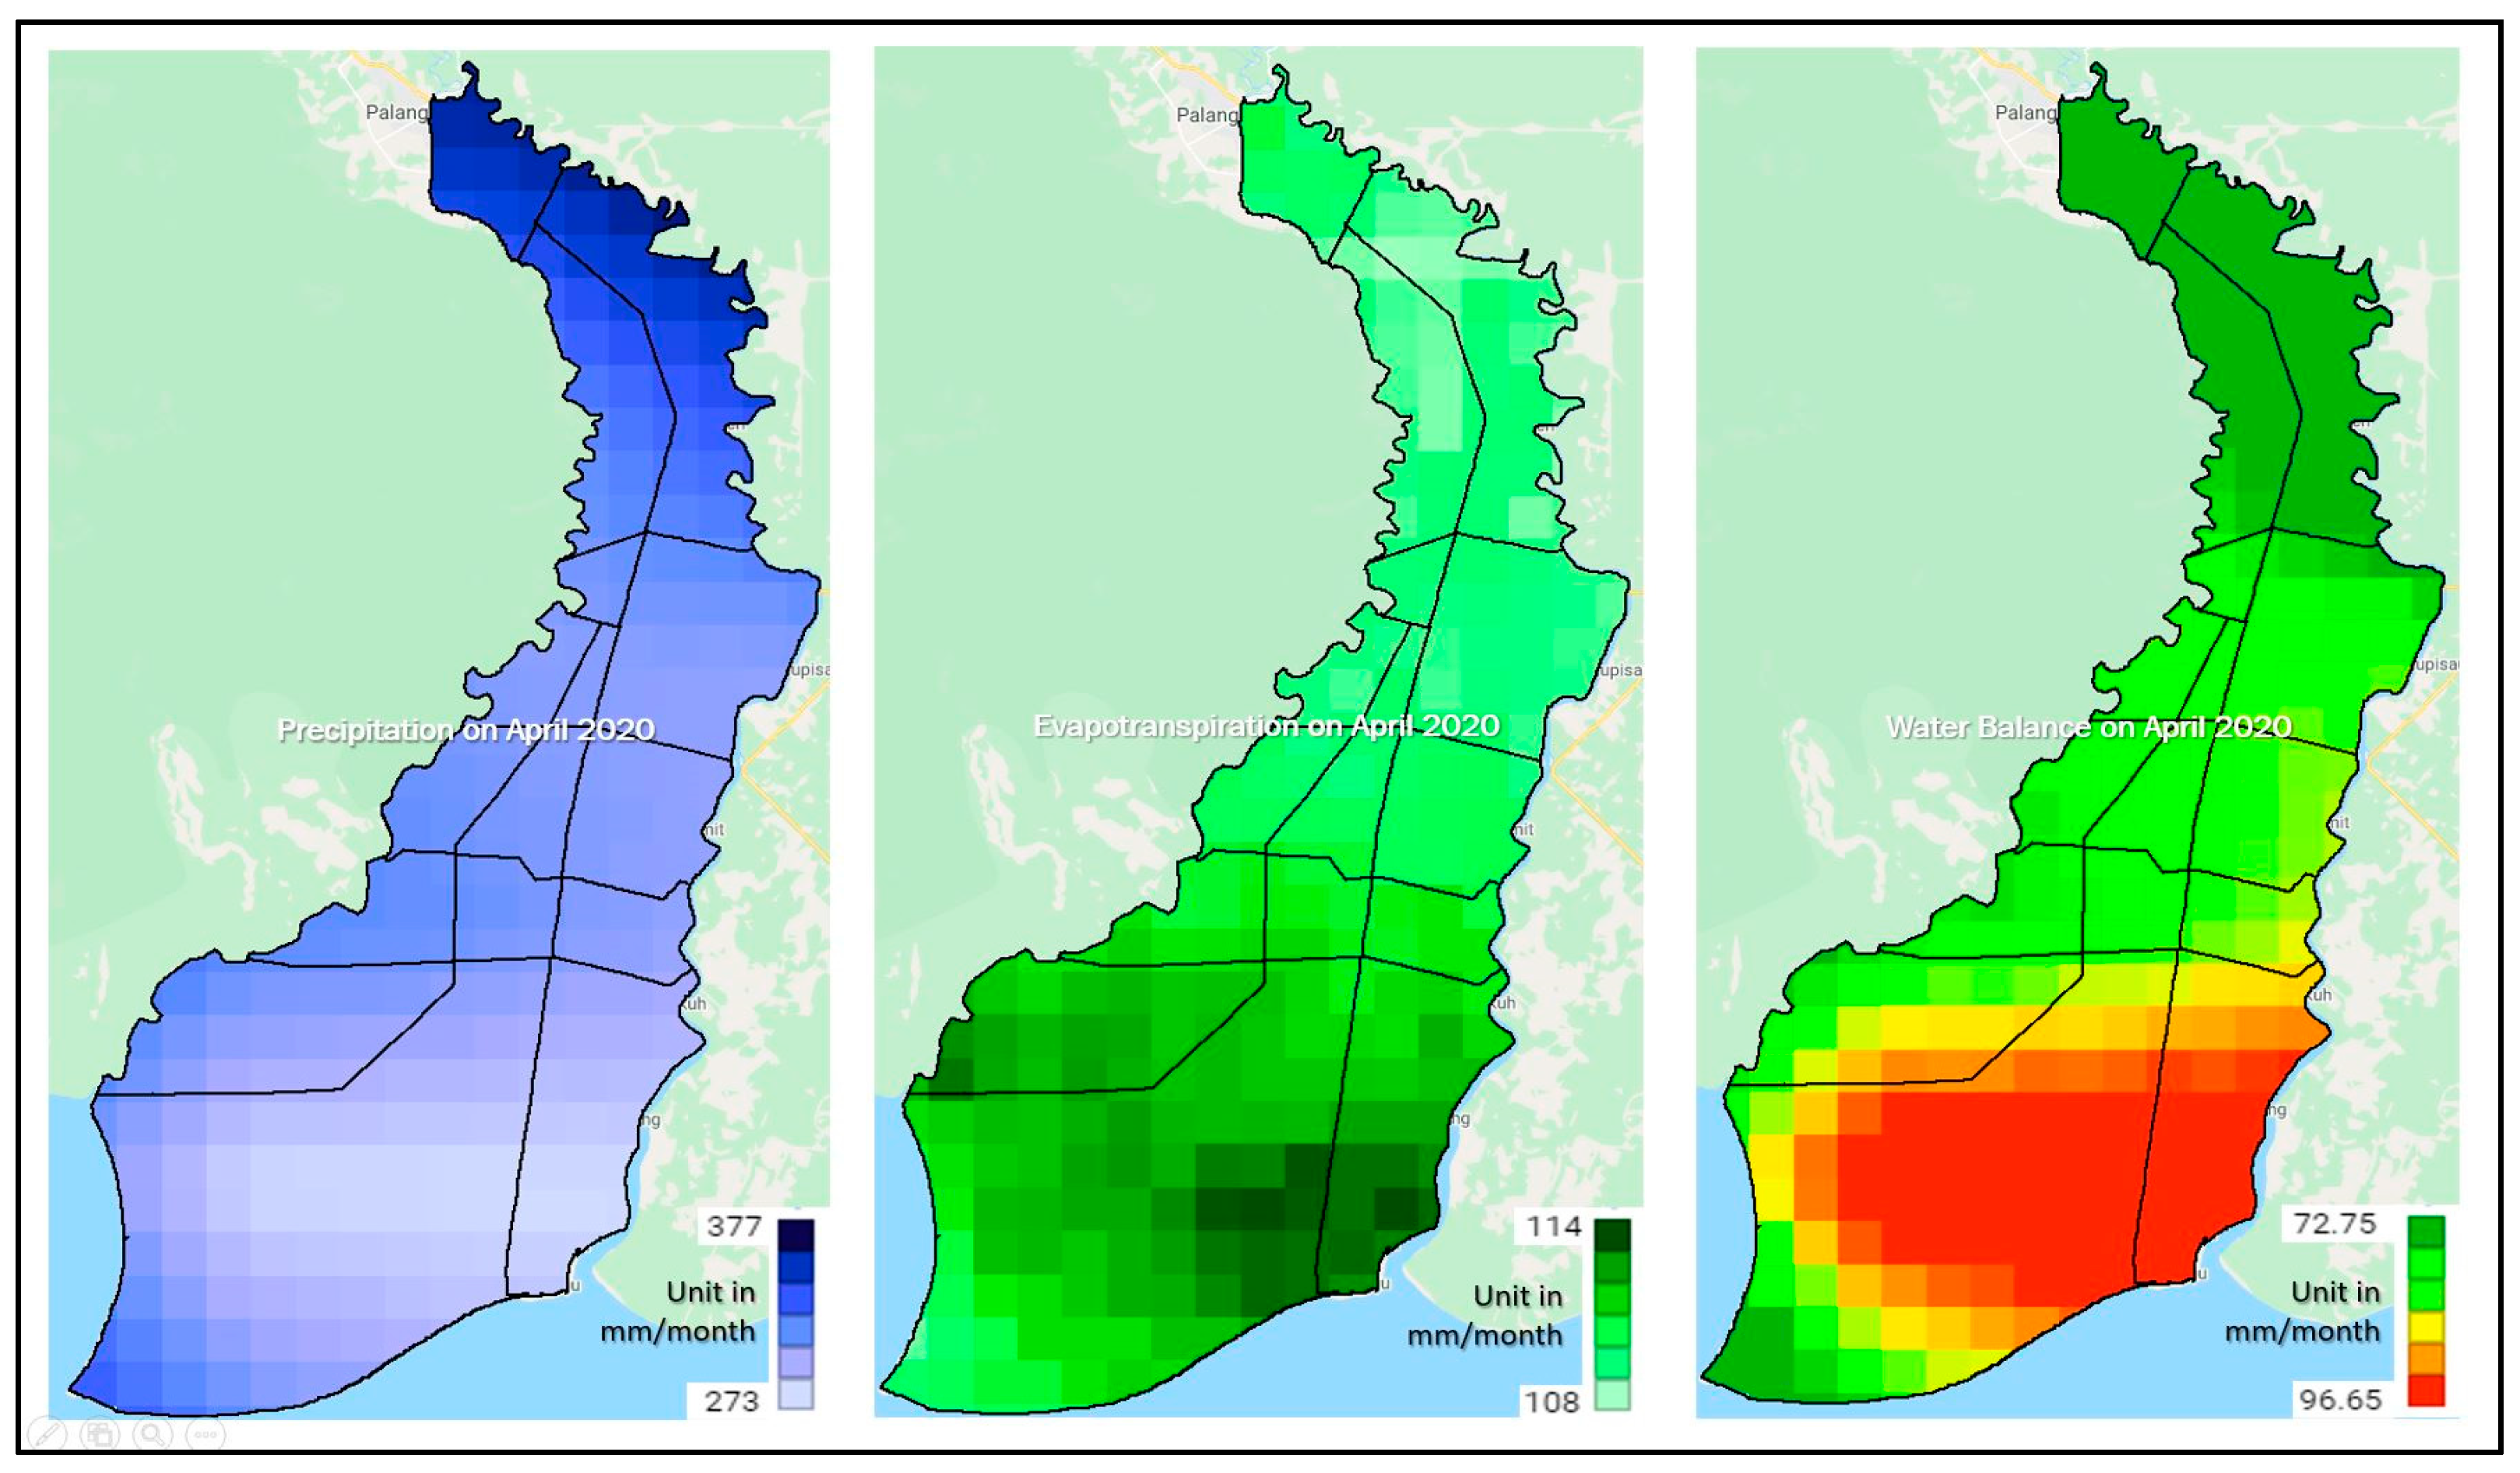
2.5. Calculation of Water Balance

Water balance analysis was performed on every sub-PHU area in the Kahayan–Sebangau PHU by considering the existence of an artificial canal network in each sub-PHU. The analysis was calculated based on the characteristics of precipitation, evaporation, transpiration, and changes in the groundwater level over a monthly period. The groundwater elevation changes were the representation of infiltration, percolation, surface, and sub-surface runoff conditions. The water balance conditions were different for peatlands with a canal network system, as compared to those without, due to the canal significantly affecting the rate of groundwater drying by the sub-surface runoff process [24,32].
The water balance calculation results were used to predict the elevation of the groundwater table of the sub-PHUs. Several factors that influenced the changes in groundwater storage and groundwater level were [24,32,34]:
  • Local rainfall intensity (P).
  • The evaporation (E) and transpiration (T) that occurred in the sub-PHU.
  • Water runoff on the soil surface (SRO).
  • Subsurface infiltration and water flow (SSRO).
The general equation for the water balance calculation in peatland based on the hydrological cycle is described in Equation (1) [24,32,34]:
Δ S = P E T S R O S S R O
Typically, the values of E and T are combined in the calculations to become the value of ET (evapotranspiration). The larger the opened area (converted from natural forest to planting areas and bare land) is, the higher the value of the evapotranspiration will be [32]. In addition, the presence of open ditches and canals also increased the water runoff that occurred on the peatlands [24,34]. The total volume of runoff to the canal (VRO) is equal to the volume of runoff above the land surface (SRO), plus the volume of runoff below the land surface (SSRO). Therefore, the change in groundwater storage can be expressed as mentioned in Equations (2) and (3) [24,32,34]:
Δ S = Σ i n f l o w Σ o u t f l o w
Δ S = V P ( V R O + V E T )
In order to evaluate the changing water sufficiency conditions in the peat hydrological system so that we could determine which sub-PHUs should be prioritized for immediate restoration, a calculation approach for the variability of the runoff coefficient (C) value in peatlands was critical [44]. The runoff coefficient of a particular area is calculated by dividing the total runoff (VRO) by the ratio of the total precipitation (VP) for a certain period of time [45]. The C value is distinguished for evaluating continuous flow conditions in the event of low rain (Clow) and peak load when there is extreme rain with high intensity (Cpeak). The Cpeak value is required to calculate the runoff load from peatlands leading to the canal [44]. This value is also required in the calculation of hydraulic simulations in terms of unsteady flow, channel layout design, and dimensional design of optimal canal blocking to minimize the flooding that occurred due to overflowing water from the canals.

2.6. Calculation of Wetness and Vegetation Indices

Remote sensing has been used extensively in peatland mapping. Satellite images play an essential role in analysis and management of peatlands [16]. The use of multispectral satellite images has been able to identify features overlooked by optical images (visible light vs. Red-Green-Glue (RGB)). Multispectral images are recorded using sensors that identify electromagnetic waves on a certain spectrum. Each spectrum can identify certain characteristics as well, for example, the blue band, sensitive to shallow water; the green band to emphasize vegetation; the red band for sand and vegetation health; Near Infra-Red (NIR) band to emphasize biomass and shoreline; Short Wave Infra-Red (SWIR) band for soil moisture and canopy moisture; and Thermal Infra-Red (TIR) band for precise for thermal mapping [55]. These multispectral images have various spatial resolutions: MODIS images at 250 m, Landsat at 30 m, Sentinel 2 at 20 m, Satellite Pour l’Observation de la Terre (SPOT) at 2.5 m, and QuickBird resolution at 2.4 m [16].
In peatland mapping, the identification of the degraded peat conditions was indicated by the appearance of opened areas and drought conditions. This identification in the entire PHU area was optimized by using Sentinel 2 imagery with different index methods. By utilizing visible and infrared bands, the appearance of open areas could be monitored by observing the plant density index extracted using the NDVI [55,56]. At the same time, drought areas were identified by observing the soil moisture index using the NDMI [55,57]. The calculation of the NDVI and NDMI values for each pixel was conducted following Equations (4) and (5), according to [55,56,57]:
N D V I = N I R R e d N I R + R e d
N D M I = N I R S W I R 1 N I R + S W I R 1
By considering the characteristics of each spectrum/band in multispectral images, a combination of bands provided better extraction of the physical peatland information [55]. In addition to the NDVI and NDMI, other methods can also be used to identify the physical conditions of peatland, including the Tasseled Cap transformation (TCT). TCT was able to compress spectral data to extract physical information on peatlands by combining blue, green, red, NIR, SWIR1, and SWIR2 bands [55,58]. TCT was divided into six different classes: TC-wetness, TC-greenness, TC-brightness, TC-fourth, TC-fifth, and TC-sixth [48,58]. The most frequently used in the physical condition characteristics of peat areas were TC-wetness, TC-greenness, TC-brightness. Calculation of each pixel value for TC-wetness, TC-greenness, TC-brightness was conducted by following Equations (6)–(8), according to [55,58]:
T C w e t n e s s = ( B l u e   ×   C B l u e ) + ( G r e e n   ×   C G r e e n ) + ( R e d   ×   C R e d ) + ( N I R   ×   C N I R ) + ( S W I R 1   ×   C S W I R 1 ) ( S W I R 2   ×   C S W I R 2 )
T C g r e e n n e s s = ( B l u e   ×   C B l u e ) ( G r e e n   ×   C G r e e n ) ( R e d   ×   C R e d ) ( N I R   ×   C N I R ) + ( S W I R 1   ×   C S W I R 1 ) ( S W I R 2   ×   C S W I R 2 )
T C b r i g h t n e s s = ( B l u e   ×   C B l u e ) + ( G r e e n   ×   C G r e e n ) + ( R e d   ×   C R e d ) + ( N I R   ×   C N I R ) + ( S W I R 1   ×   C S W I R 1 ) ( S W I R 2   ×   C S W I R 2 )
Note that C B l u e , C G r e e n , C R e d , C N I R , C S W I R 1 , and C S W I R 2 are coefficient values for each band. The values for those coefficients are different for TC-wetness, TC-greenness, and TC-brightness.

2.7. Identification of Fire History

The identification of areas that had been most severely affected by peat degradation involved reviewing the fire history of each sub-PHU area. By considering these conditions, we ascertained that an area with frequent fires would the driest and the most degraded area [13]. Remote sensing methods strongly supported this identification by utilizing MODIS-Terra and MODIS-Aqua satellite images. The MODIS system is capable of detecting the location of active fires (commonly called “hotspots”), which occur in peatland areas [13,59]. The MODIS images had a spatial resolution of 1 km in tropical areas [13]. Therefore, if several hotspots occurred at a certain time in an area of 1 × 1 km2, they would be considered one event. We assumed that each fire event affected an area of 1 sq km [59].
Hotspot location data generated from this image had different levels of confidence. The level of confidence showed the accuracy of the occurrence of fires for each pixel, which were classified as low (0–30%), nominal (30–80%), and high (80–100%) [40]. To obtain more accurate information regarding the hotspot data, some researchers set a threshold for the level of confidence. For example, a researcher set a confidence level threshold at 60%, which was applied to cropland areas in Russia [60]. Other researchers have used a 70% threshold in tropical peat areas of Sumatra and Kalimantan [61]. Another set a threshold value at 73% for MODIS-Aqua and 66% for MODIS-Terra in the United States [62]. This study used a 70% threshold for MODIS-Terra and MODIS-Aqua data in the Kahayan–Sebangau PHU. This filtered out the noise data caused by the appearance of clouds and thin smoke that could obscure fires in a small fire area [62].

3. Results

3.1. Sub-PHU Determination
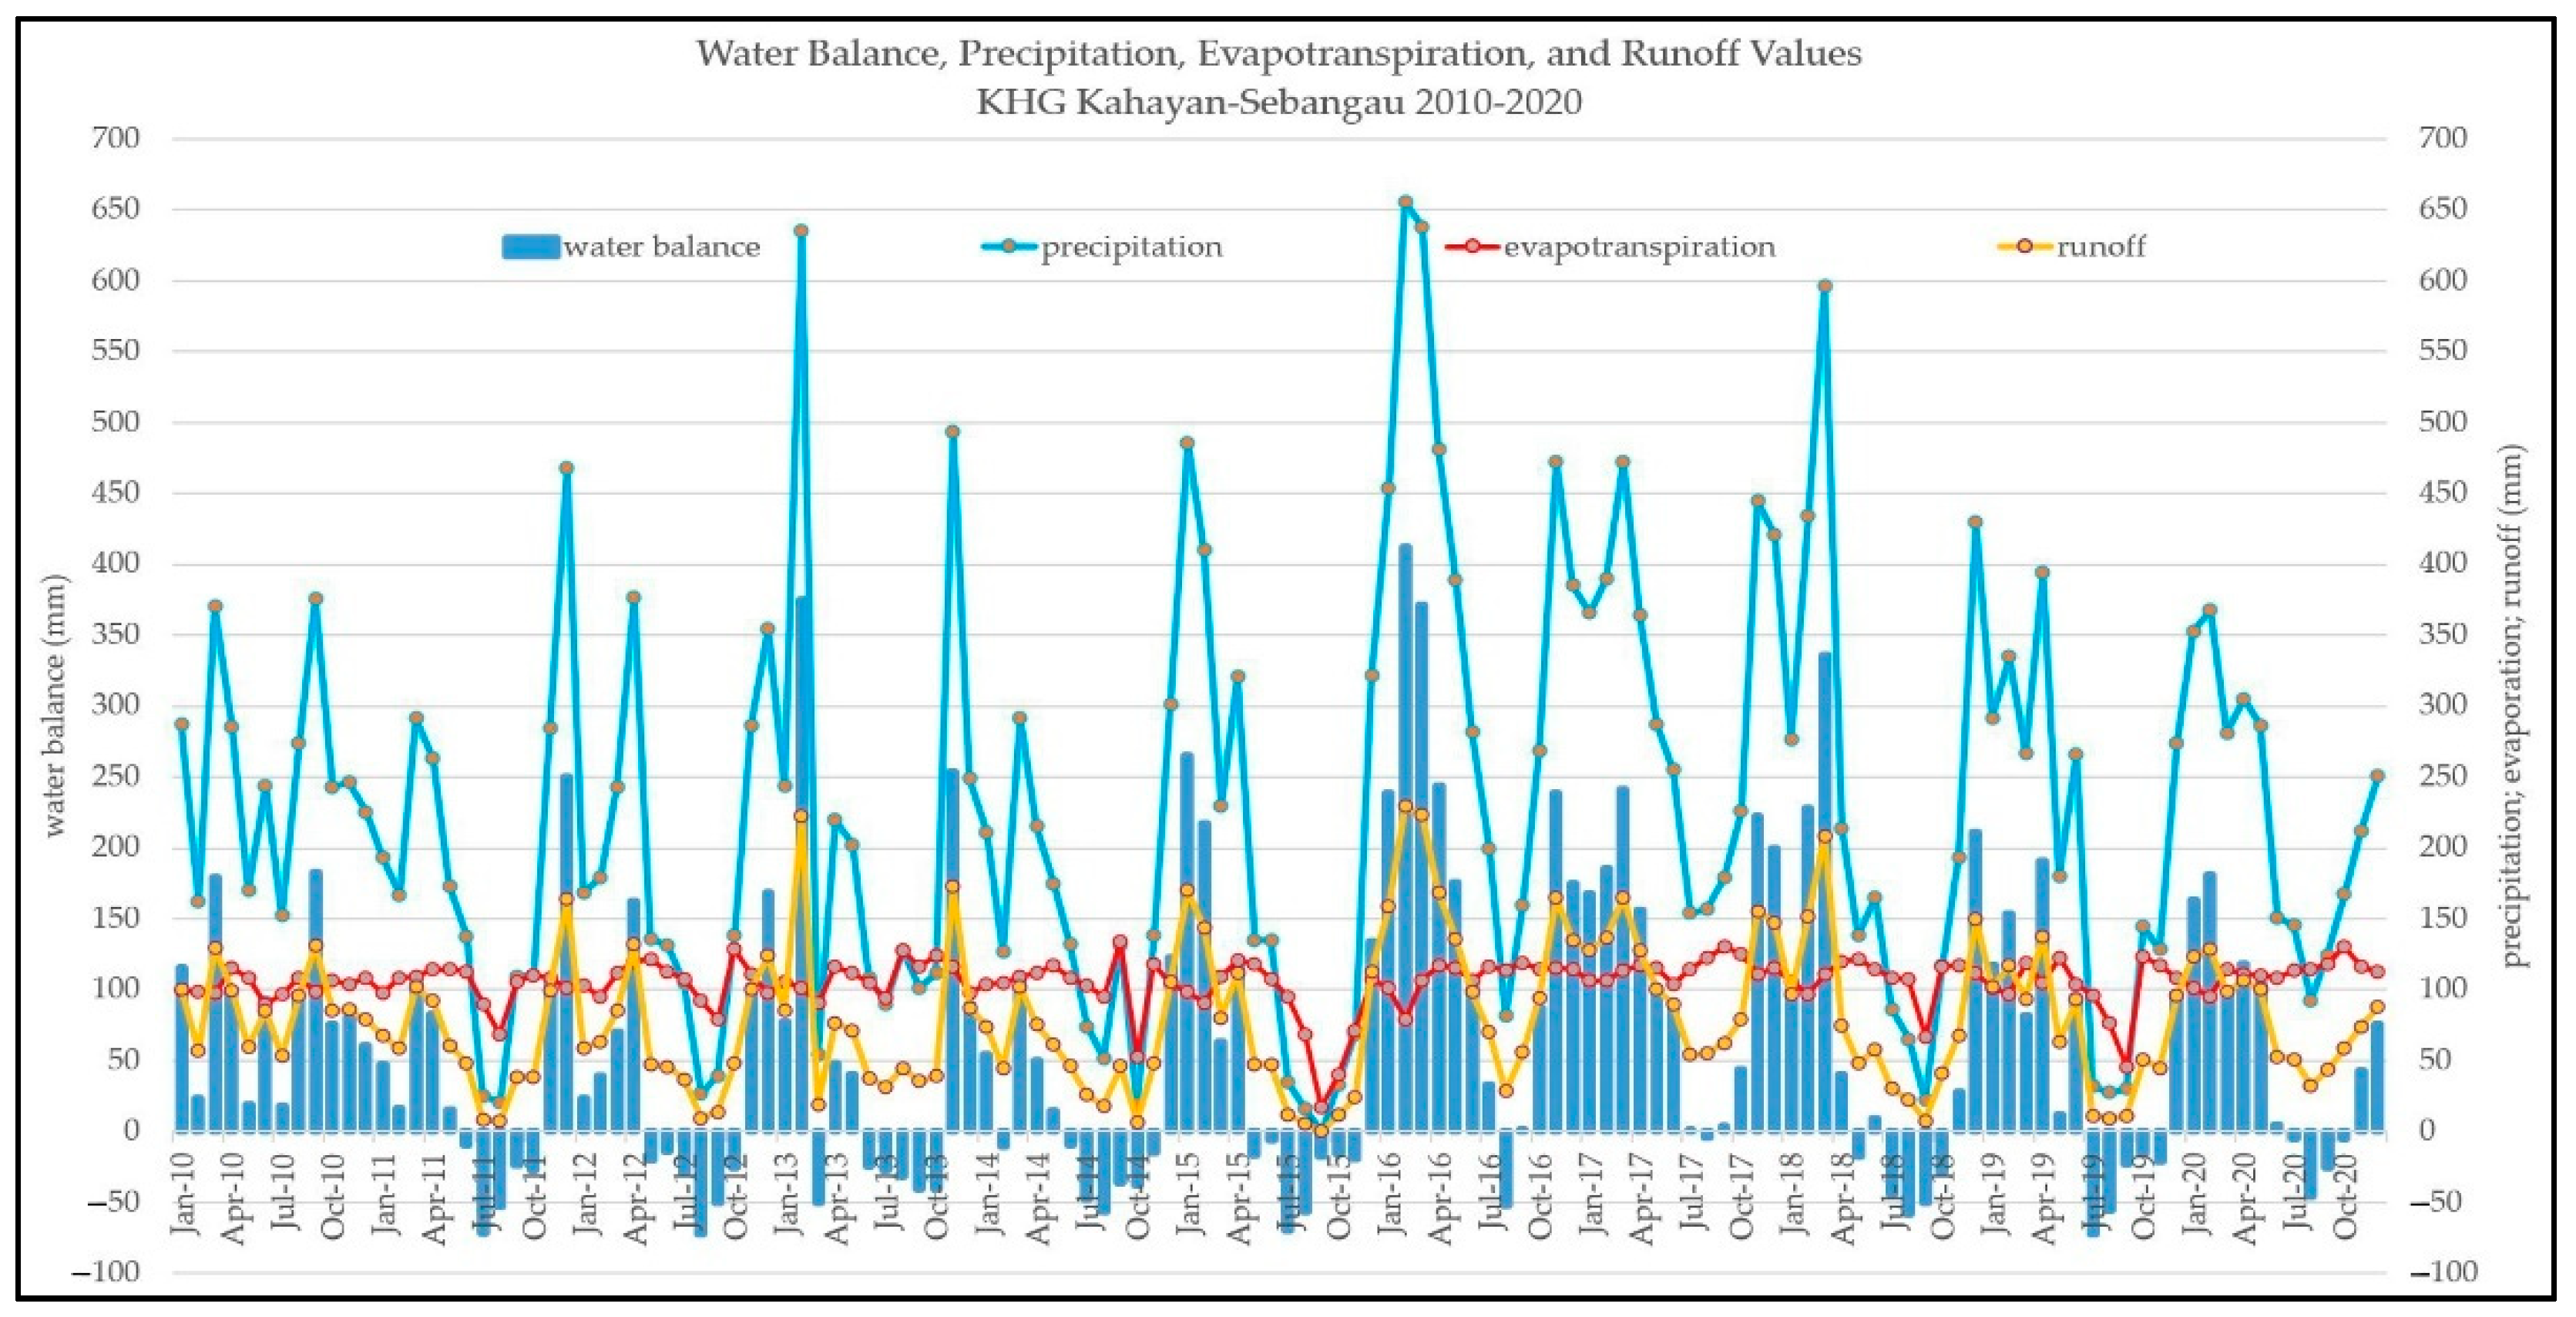
The sub-PHU boundaries were determined by delineating rivers and canals that were in either circular or closed patterns, which served as an outlet for the water flow from the peat domes [15,26]. This water flow pattern was derived from the highly accurate DTM-LiDAR data, which were able to identify tiny elevation differences in peatland areas. Water flows naturally from a higher to a lower place. The flow that occurred at the ground surface led to a natural river or main canal as an outlet. It also represented the flow of the groundwater. Therefore, the water in the peat soil would seep out through the canal and flow along the existing canal network [35]. The direction of the water flow (i.e., streamline) of the peatland was determined by performing a hydrological flow analysis using GIS [52,53]. The results of the surface water flow patterns and the stream orders throughout the Kahayan–Sebangau PHU area based on LiDAR and WorldDEM data are presented in Figure 2 (using Universal Transverse Mercator (UTM) projective coordinate system, zone 49 South (49 S)).
Based on the topographical conditions, as presented in Figure 1 and Figure 2, this type of peat was an ombrogenous peatland that had a dome shape and the peak area in the middle of the sub-PHU [26]. The ombrogenous peatland was the characteristic of most Indonesian peatland [1]. Therefore, the streamline pattern of water flow would form a radial pattern that flowed from the middle (i.e., the highest elevation) to the outlet canal at the edge of the sub-PHU. Typically, the outlet was a large canal or natural river [23]. The canal that became the estuary for water flow from the left and right areas was an outlet canal [23], which flowed directly out of the PHU into a sea or river. The appearance of natural rivers indicated a general pattern of sub-PHU division, which was further clarified using a precise streamline. The radial streamline pattern of water flow in determining the sub-PHU is shown in Figure 3 (in UTM zone 49 S coordinate system).
Verification had to be performed to ensure the channel used as the sub-PHU boundary was wide and deep. Validation of the boundary channel condition was performed by analyzing the depth and the dimension of the channel using DTM LiDAR data and visiting the field. In addition, this verification also ensured that the direction of the water flow in the canal continued towards the sea or river. Verification was performed by tracing the channel, following its appearance on aerial orthophoto images that showed detailed field conditions.
By observing the division of the sub-PHU areas in the Kahayan–Sebangau PHU, we found that the most extensive area was sub-PHU 16 and the narrowest area was sub-PHU 6. In nearly every sub-PHU, there was a concession area for oil palm plantations and paddy fields (except sub-PHUs 3, 5, 6, 7, and 10). The existence of a massive canal network indicated plantation concessions and ex-Mega Rice Project areas. These canal networks accelerated the drainage around the peat domes and caused the peat to be degraded. The channel network appeared to be disconnected at every sub-PHU boundary, which indicated that the water system had been hydrologically separated for each sub-PHU.
Twenty years ago, there was a large lake in the border area between sub-PHU 15 and sub-PHU 16. The lake’s existence suggested that the area close to the peak of the peat dome had been preserved [46,54]. Unfortunately, it had since disappeared due to the changes in land cover and the growth of the artificial canal networks. This change generated peatland subsidence and drought [1,10]. Therefore, expansive conversion to large concession planting areas should be controlled. It will trigger degradation in the next few years due to the subsidence and drought [10].
Applying the division unit area based on the boundaries of the sub-PHU area that was determined for the entire Kahayan–Sebangau PHU indicated the land use and land cover (LULC) for each sub-PHU, as presented in Figure 4. Therefore, the (LULC) and the total area for each sub-PHU are presented in Table 1.

3.2. Water Balance

The runoff coefficient values in the concession planting area, which had massive artificial canals, are higher than those in the community area. Therefore, even though the Cpeak values were only 0.209 in the residential area and 0.314 in the concession area, for design purposes, the runoff coefficient value was set to 0.25 in local residential settlements and 0.35 in concession planting areas. This value considered that rainy conditions with extreme intensity would produce a greater total runoff load to the channel network [45].
Then the value of the runoff coefficient, together with the value of precipitation and evapotranspiration, are input into the water balance analysis. Because these data have suitable spatial units, they can produce water balance conditions for each part of the sub-PHU being evaluated. An example of the spatial distribution of water balance, precipitation, and evapotranspiration as the result of data processing using Google Earth Engine in April 2020 is presented in Figure 5.
By utilizing the TerraClimate hydrological data for the last several years, the conditions of precipitation, evapotranspiration, and water balance were identified well. We extracted the water balance calculations and hydrological data observations for the previous 11 years (2010–2020). These provided the evapotranspiration conditions that occurred across all land cover in the Kahayan–Sebangau PHU. Furthermore, using the runoff coefficient (as previously calculated) and rainfall data that occurred every month, the value of total runoff in the Kahayan–Sebangau PHU was calculated. Finally, the condition of monthly water availability in the Kahayan–Sebangau PHU was also calculated through the water balance analysis. The results for all four conditions in the Kahayan–Sebangau PHU are presented in Figure 6.
The data, as presented in Figure 6, showed that the dry periods typically occurred in July and October (peak of dry season in July–August). At the same time, the rainy season occurred in December–April. The average monthly rainfall in the Kahayan–Sebangau PHU was 228.76 mm (7.63 mm per day). The average monthly evapotranspiration value was 105.57 mm (3.52 mm per day). Meanwhile, the monthly average water balance value in the Kahayan–Sebangau PHU was 66.00 mm, or 2.20 mm per day for the entire area.
Obtaining accurate information on hydrological conditions was required in order to compare the conditions among the sub-PHUs. Therefore, the calculations and evaluations of hydrological conditions were conducted in the sub-PHUs as individual unit areas to identify those that were the most degraded and urgently needed to be restored. The rainfall conditions, the land cover including the surface and sub-surface runoff, the monthly and annual water balances, and the dry and rainy seasons in each sub-PHU were considered. A dry month was determined by a negative monthly water balance (deficit). Frequent deficits in the water balance indicated that the sub-PHU would be prone to drought. Furthermore, the lower the value of the calculated water balance was, the worse the hydrological conditions of the sub-PHU would be.
Using the observational data for 2010–2020, the patterns and characteristics of the water balance in each sub-PHU were analyzed. The results of the average monthly water balance for each sub-PHU are shown in Table 2. The drought seasons occurred in July–October for most sub-PHUs. The monthly average water balance values showed that sub-PHU 3, sub-PHU 5, sub-PHU 6, sub-PHU 7, sub-PHU 9, and sub-PHU 10 had the best hydrological conditions. Meanwhile, the worst were sub-PHU 2, sub-PHU 4, sub-PHU 8, sub-PHU 11, and sub-PHU 14. Based on the frequency of water deficits, sub-PHU 14 was determined to have the worst conditions, followed by sub-PHU 16, sub-PHU 11, sub-PHU 12, and sub-PHU 8. Sub-PHU 3 had the most frequent surplus in monthly water balance, followed by sub-PHU 5, sub-PHU 6, sub-PHU 7, and sub-PHU 9.

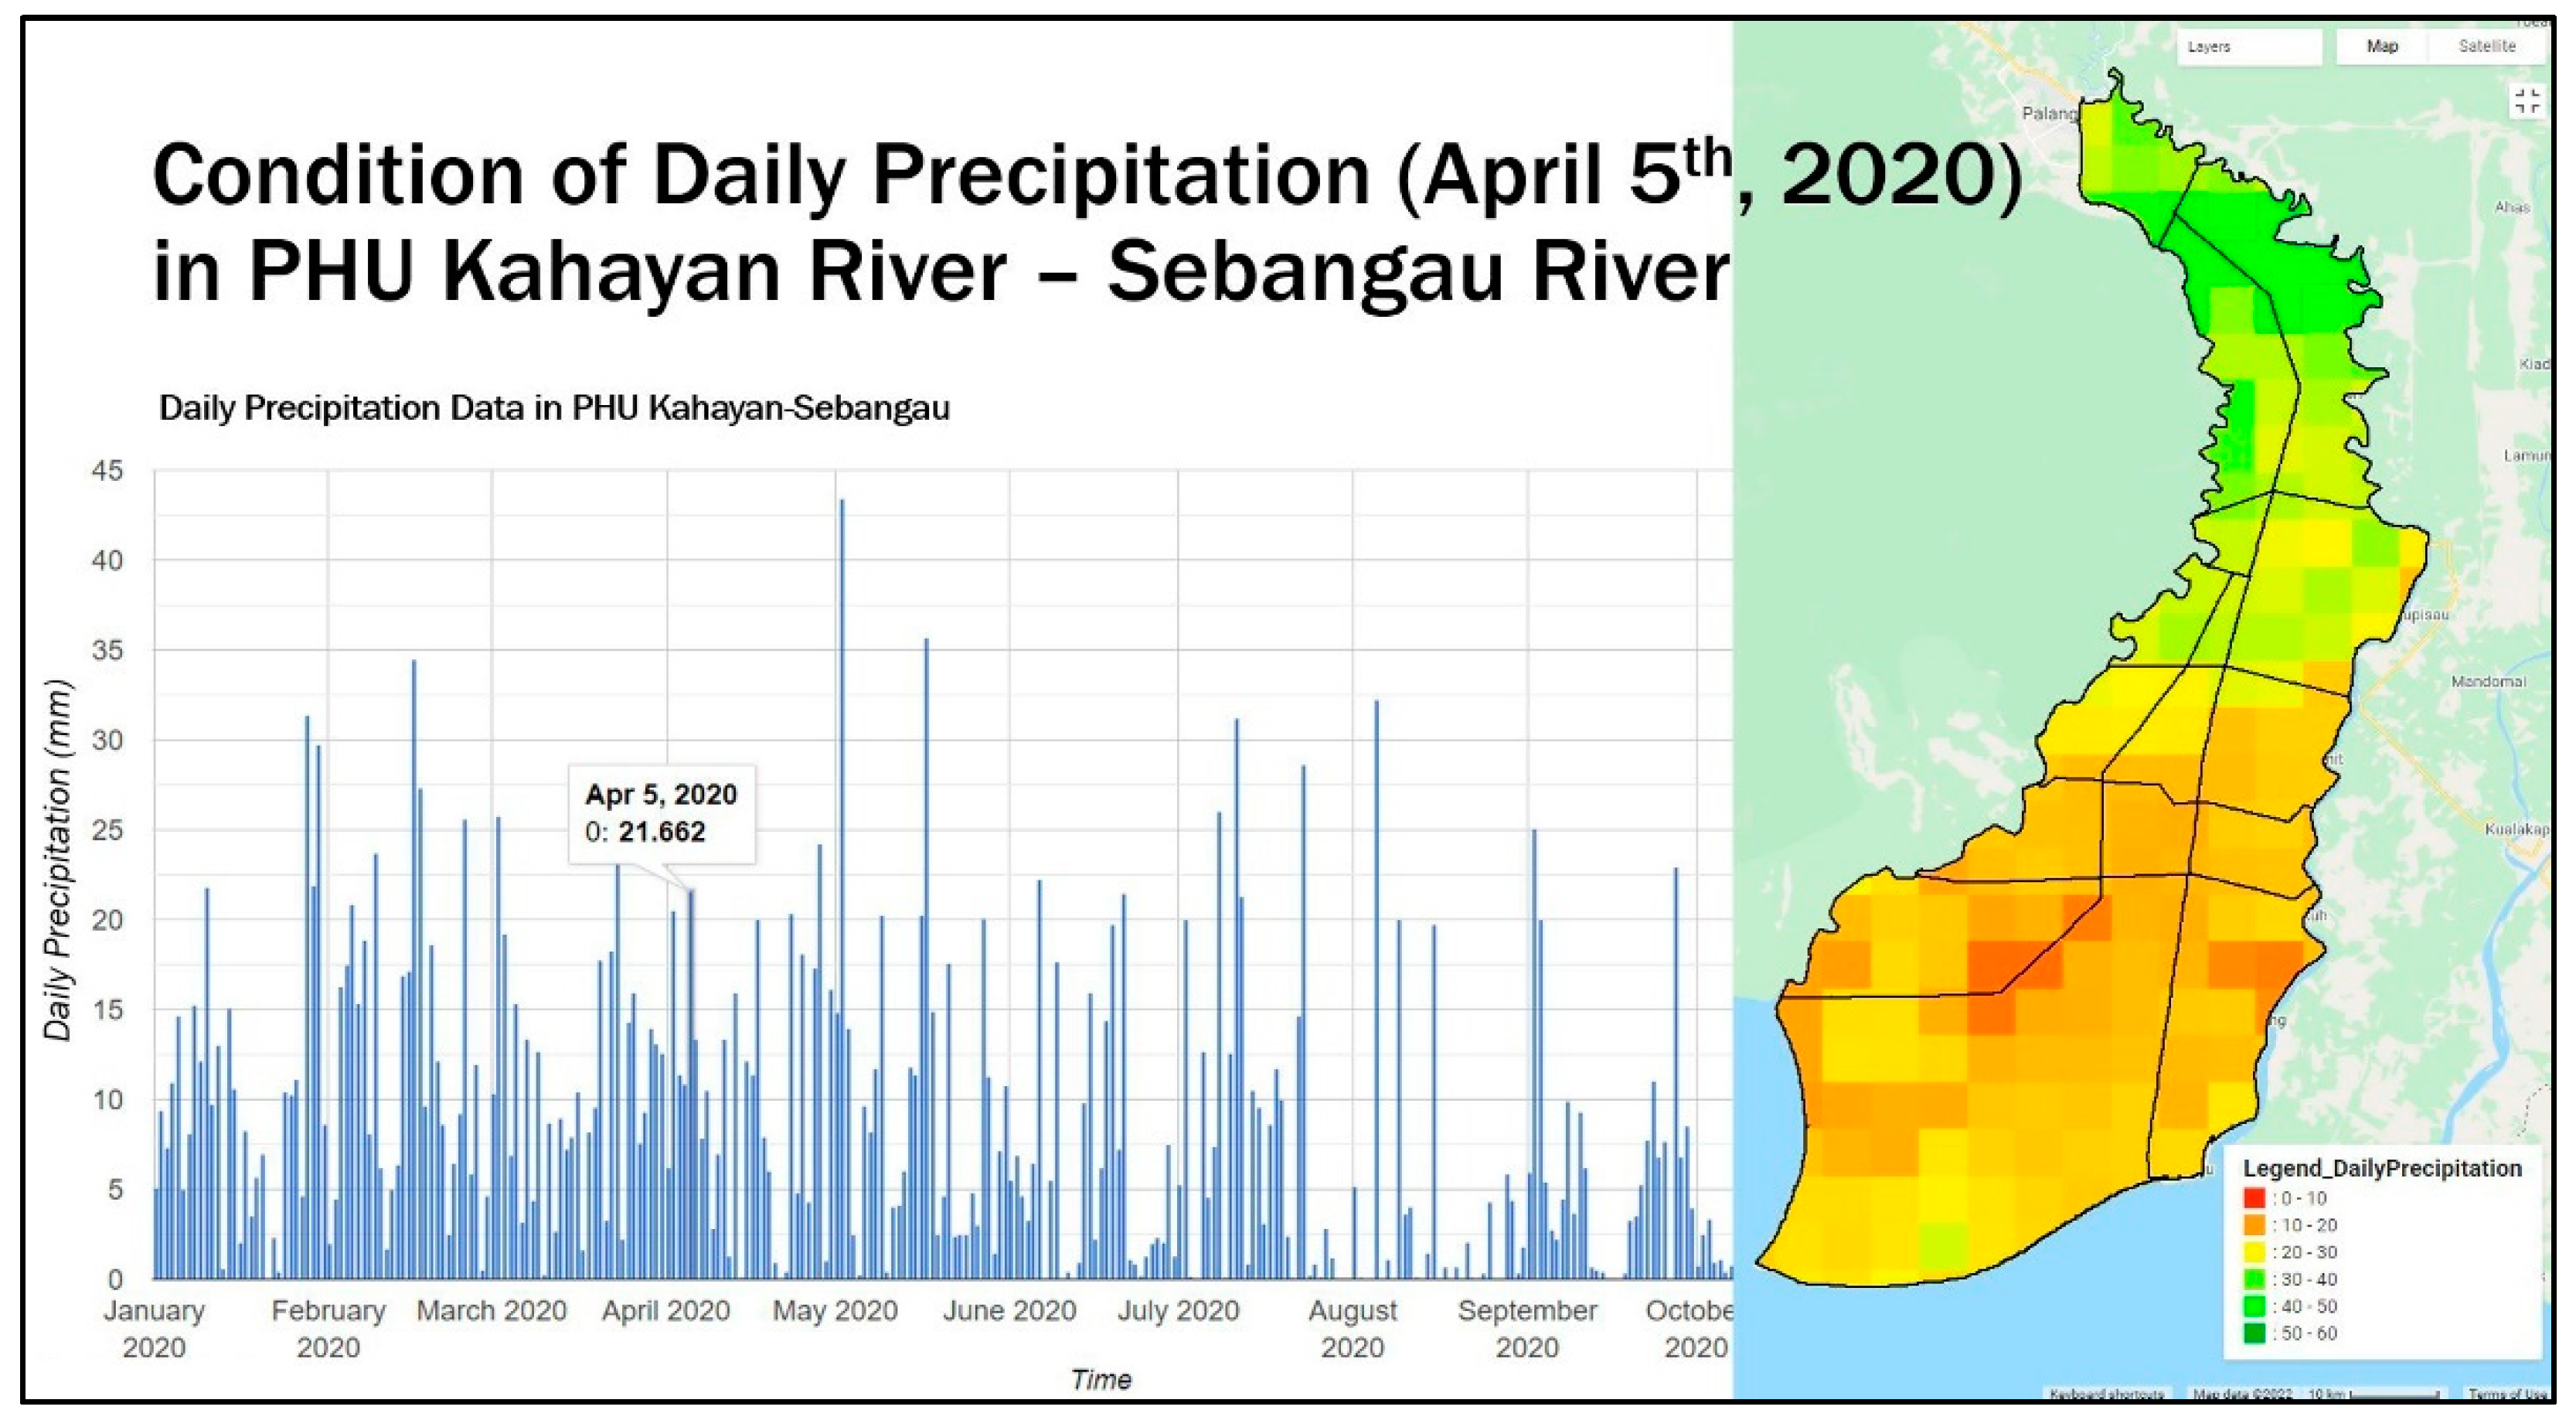
3.3. Precipitation, and Dry Days

Rain is the main source of clean water for ombrogenous peatlands [24,32]. Therefore, the absence of rain for an extended period increases the risk of drought, as water in the peatlands decreases due to infiltration, runoff, evaporation, and transpiration as a result of the conversion of natural forests into concession areas with massive canals [1]. Therefore, identifying the trend of dry periods, especially those occurring consecutively in each sub-PHU, could identify which sub-PHU would be most prone to drought.
CHIRPS daily precipitation data have appropriate spatial units. Therefore, it is possible to identify rain intensity for each part of the PHU. We could see which areas had high-intensity rain and low precipitation intensity on the same day. An example of the precipitation data in chart form and their spatial distributions are presented in Figure 7.
The dry periods for each sub-PHU were calculated by limiting the calculation of precipitation based on the existing sub-PHU boundary. By identifying the rainfall data, we identified the occurrence of dry days for each sub-PHU, as the consecutive dry days were of concern due to the risk of drought from evaporation, transpiration, and infiltration. The dry periods for each sub-PHU per month in 2010–2020 are presented in Table 3.
As shown in Table 3, June–September were the months with the longest dry periods in the Kahayan–Sebangau PHU, and sub-PHU 5 had the longest duration of consecutive dry days in the last 11 years. Sub-PHU 5 had the longest dry periods in September 2019, for 25 consecutive days. Based on the frequency of the average of the longest monthly dry days during 2010–2020, sub-PHU 6 was the driest sub-PHU, with an average of 4.98 consecutive dry days, followed by sub-PHU 5, sub-PHU 7, sub-PHU 4, and sub-PHU 11. In contrast, the sub-PHUs with the lowest average of consecutive dry days were sub-PHU 2, sub-PHU 14, sub-PHU3, sub-PHU 1, and sub-PHU 8. However, when the assessment was performed based on the longest consecutive dry periods during the last 11 years, the top six sub-PHUs are sub-PHU 8, sub-PHU 11, sub-PHU 12, sub-PHU 13, sub-PHU 14, and sub-PHU 15. Therefore, the dry day events would be significant when determining which sub-PHUs to prioritize as urgent.

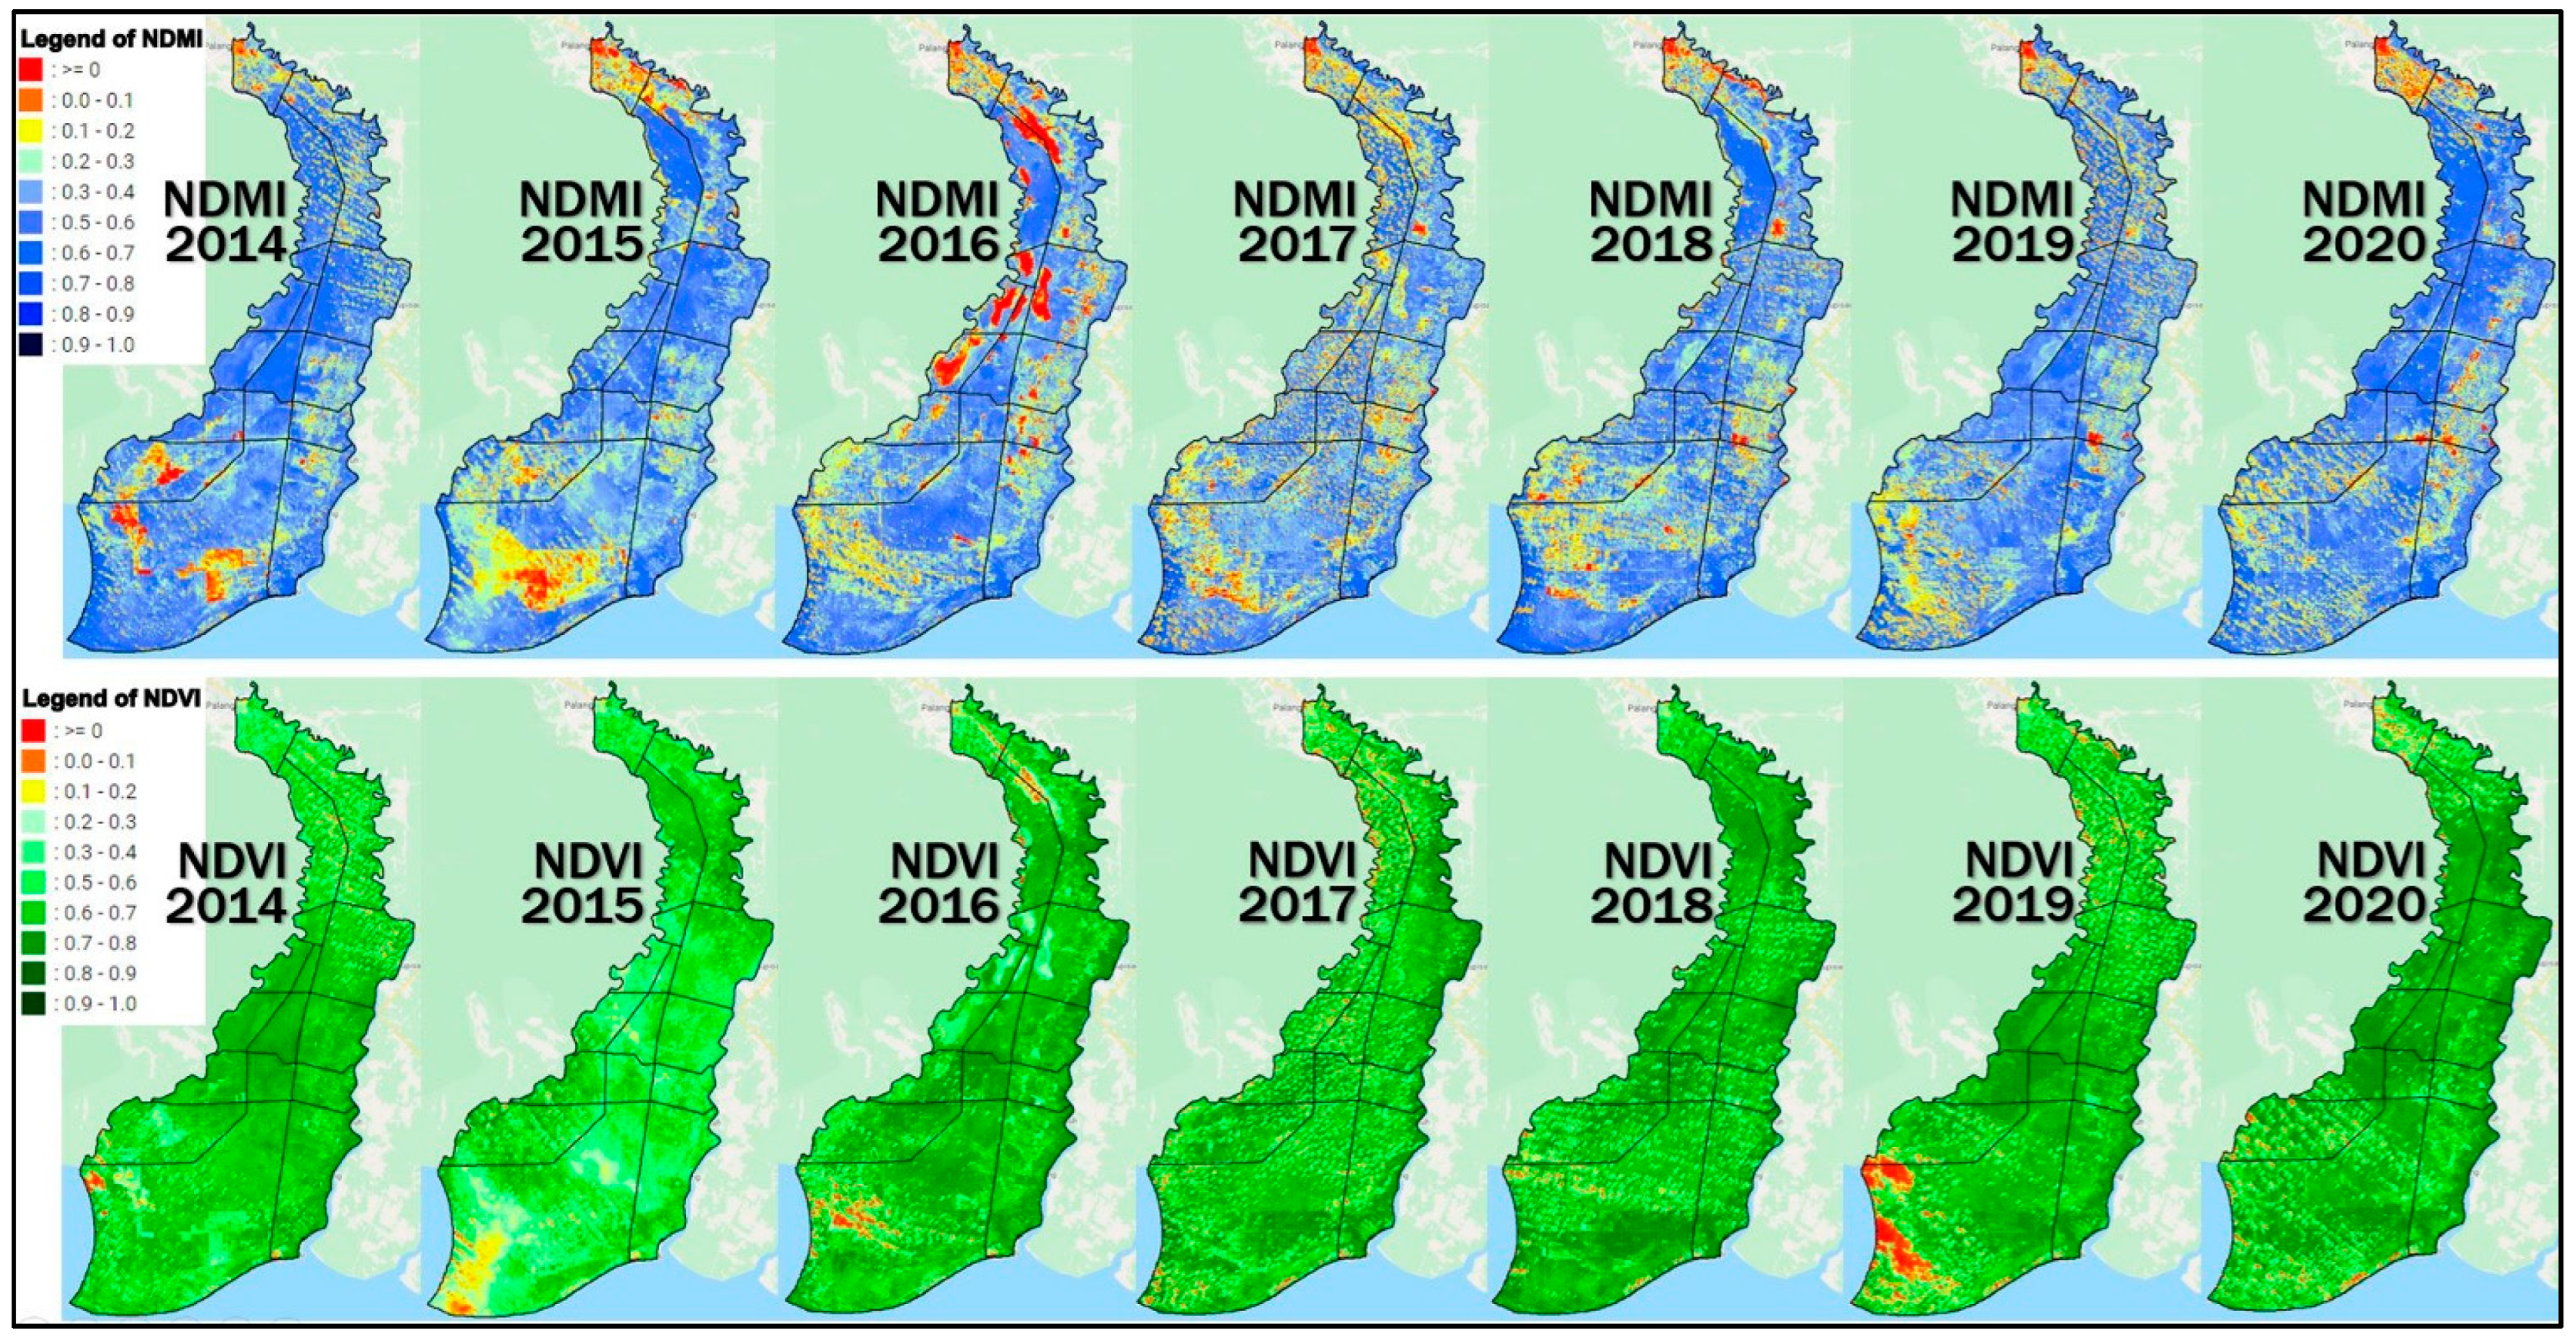
3.4. Wetness and Vegetation Indices

Identification of dry and wet areas of the entire Kahayan–Sebangau PHU were assessed based on each area’s soil moisture and vegetation density [55,56]. To obtain accurate information regarding these conditions, an analysis of the NDMI and the NDVI was generated using multispectral satellite images. In this study, Landsat-8 images were used as optical images that presented detailed spatial information captured using several types of sensors, including sensors that were sensitive to red, green, and blue light as well as near-infrared and short-wave infrared bands [41,55,57]. These images presented images of the whole earth’s surface were freely accessible and had a sufficient spatial resolution. Landsat-8 Operational Land Imager (OLI) had sufficient resolution at 15 m for the panchromatic band; red, green, blue, near-infrared, and short-wave infrared bands had a resolution of 30 m while the thermal infrared was 100 m [55].
The use of these types of imagery was due to the large area of the Kahayan–Sebangau PHU. Not all years had been fully recorded by Landsat-8 images alone. The cloud cover on some images was extensive and obscured the peatland surface. The availability of the Landsat-8 imagery informed the accuracy of the NDMI and the NDVI for Kahayan–Sebangau PHU. The results of the NDMI analysis presented the peat soil moisture data throughout the PHU. By providing a contrasting color for the highest and lowest values, NDMI directly identified areas there were wet/humid vs. dry. Based on this identification, the natural forest areas were identified as having soil moisture index values that were much higher than the concession planting areas.
The NDVI presented data for the vegetation density on the peatlands. A high NDVI value indicated the evaluated area had sufficient vegetation density. Meanwhile, areas with low NDVI values were open or converted areas with fewer plants, including roads, settlements, fields, or bodies of water (i.e., rivers, canals, and lakes). By providing contrasting colors for the highest and lowest values, the vegetation density could be identified directly. An example of the results of the analysis of NDMI and NDVI for the Kahayan–Sebangau PHU is presented in Figure 8.
Based on the NDMI and NDVI data presented in Figure 8, areas with natural forests and peat swamps had NDMI values that were relatively high. Meanwhile, the open spaces in concession and nearby residential areas had low wetness values. When viewed from the perspective of vegetation density (NDVI), the greenness index of natural forests and peat swamp areas was greener (i.e., higher index value) than the concession planting areas (with massive canals), as well as in the community planting areas. In the Kahayan–Sebangau PHU, in general, the overall NDVI values were relatively high, but the NDMI value was low. The condition of the open area in 2014 was a result of the land cover change that, at that time, had recently been implemented in Kahayan–Sebangau PHU. The NDMI and NDVI values were significantly lower than in the other areas. By comparing the changes from year to year, we obtained the general wetness level of the soil for each sub-PHU as well as the average value of their NDMI and NDVI. The results of these calculations are presented in Table 4.
The data presented in Figure 8 and Table 4 indicated the sub-PHU areas that were in the best condition in terms of wetness/dryness and greenness, as well as those that were the most degraded and should be prioritized for restoration. Therefore, we needed to determine the priority areas by also identifying the impacts of droughts, including the speed of peat water loss and the occurrence of fires.

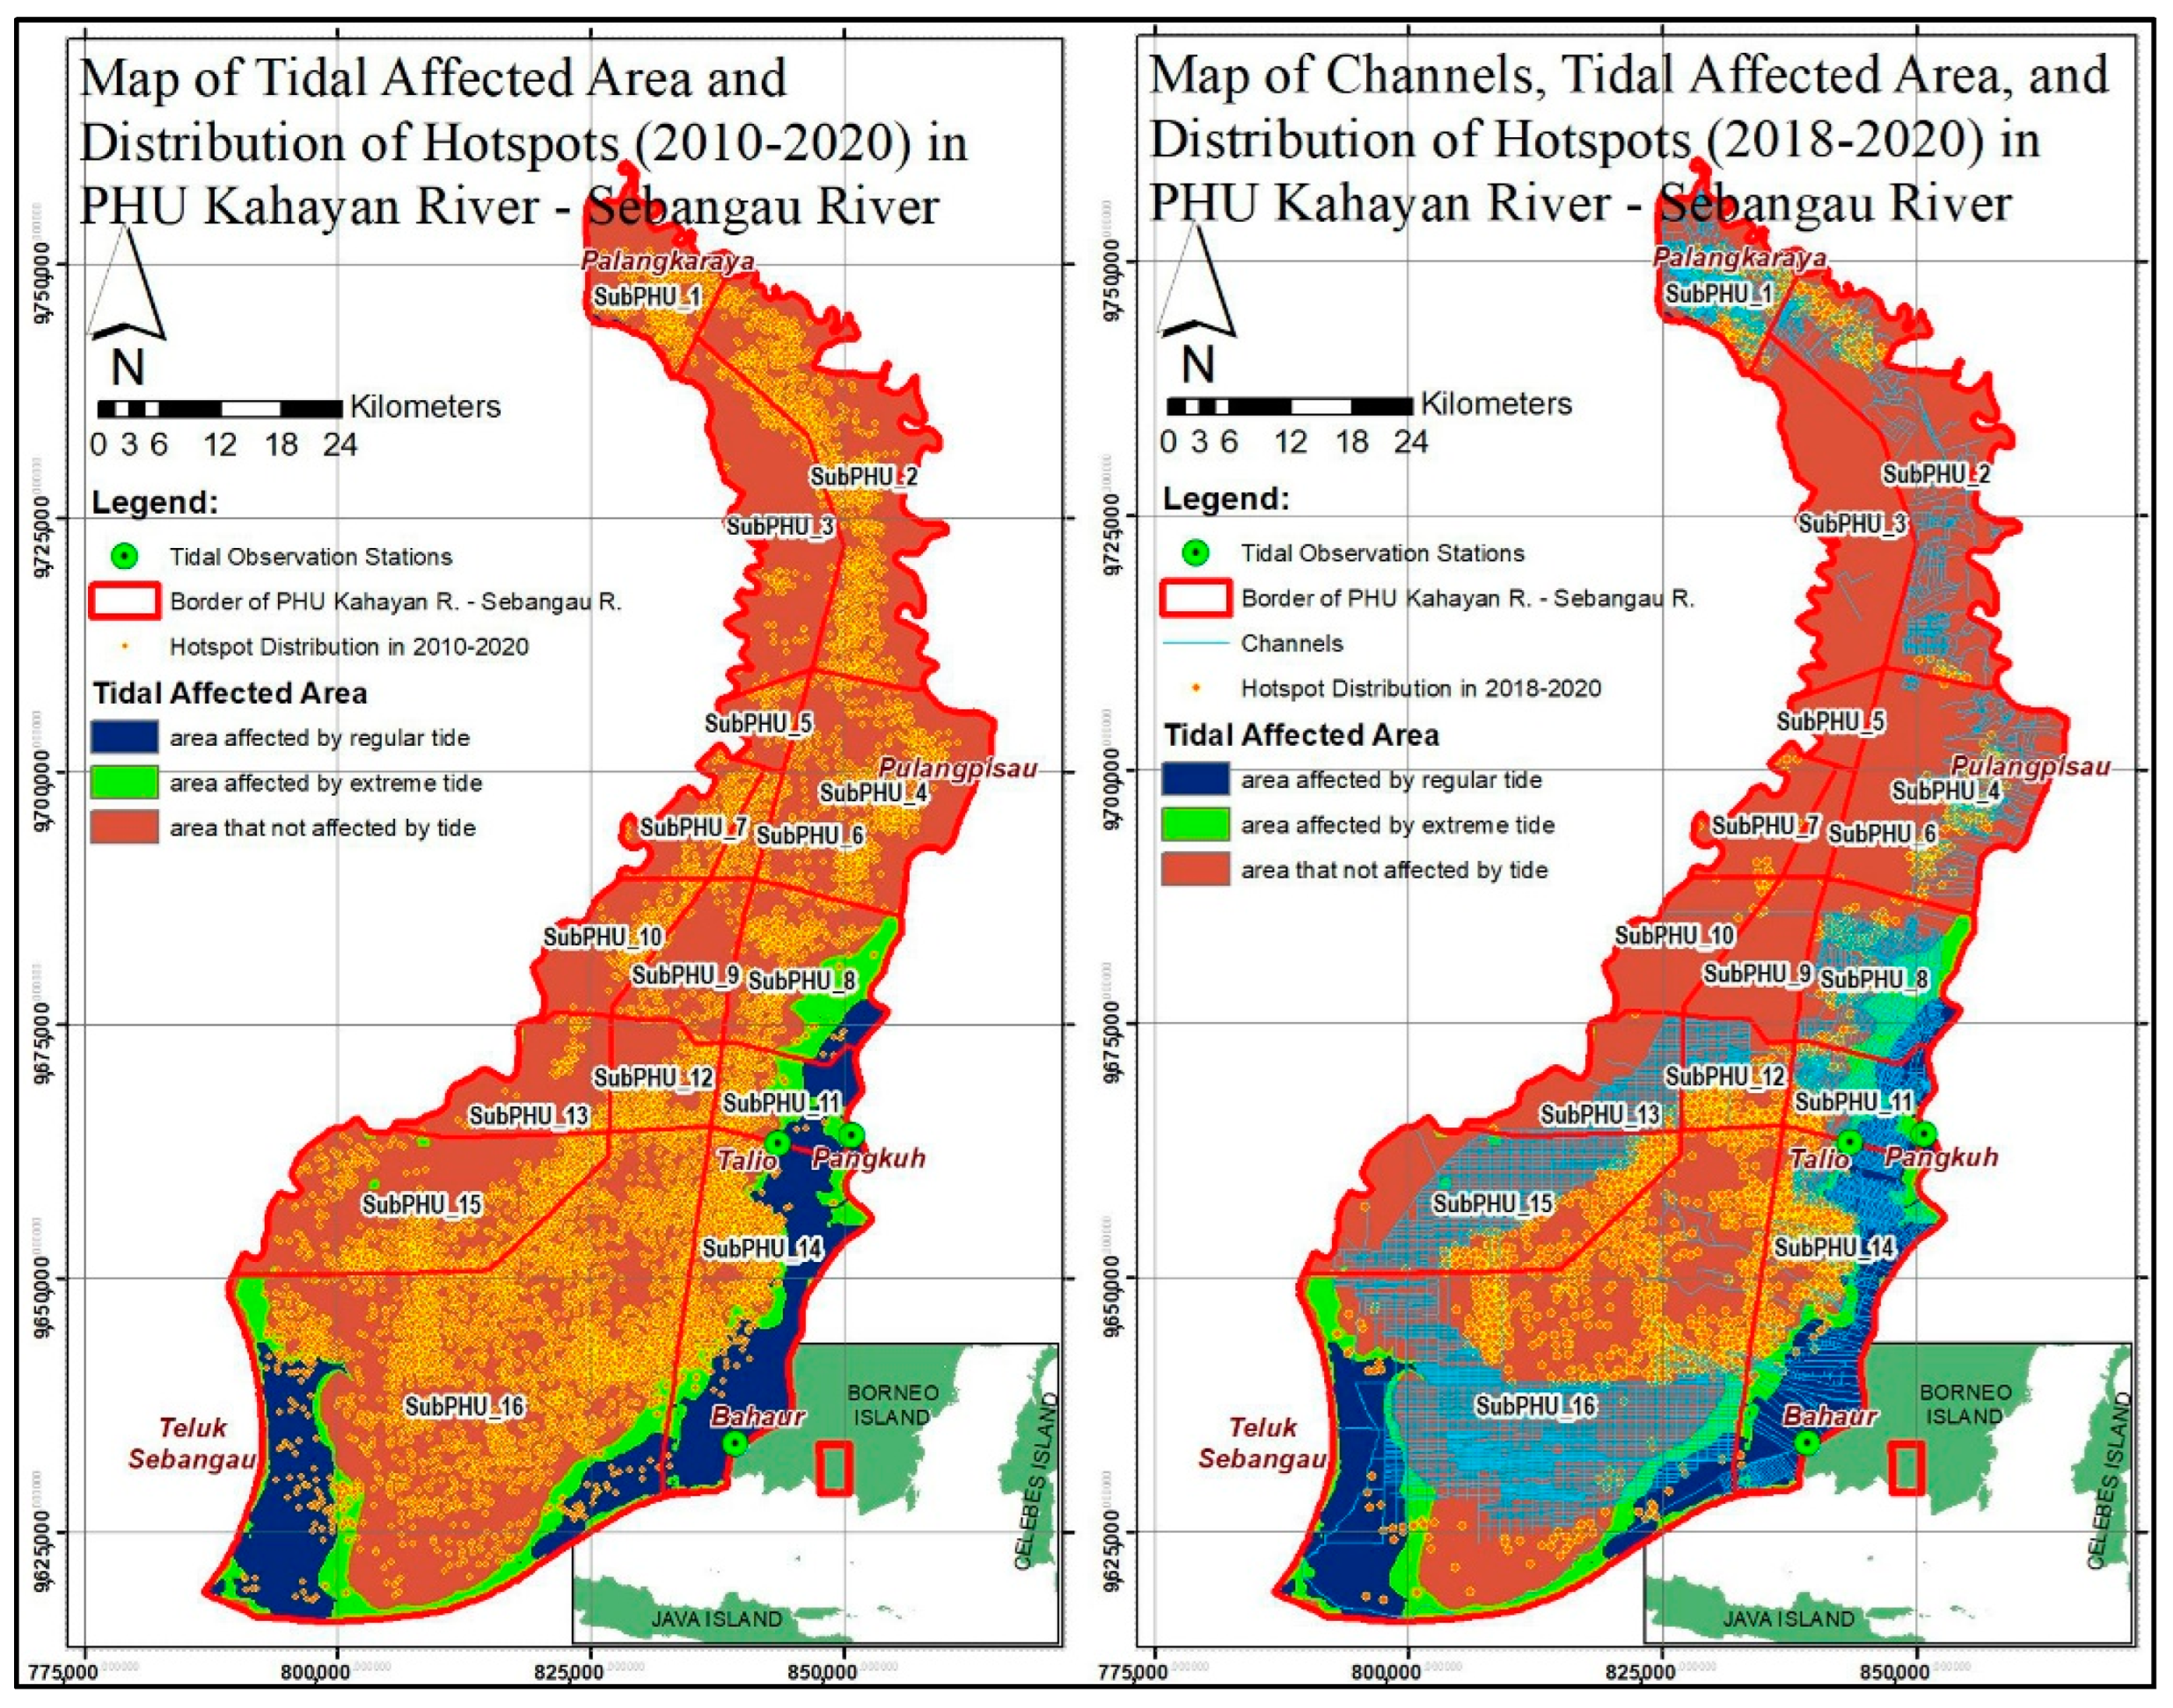
3.5. Fire History and Tidal-Affected Area

Long dry periods are devastating to peat soil. The river and seawater in the Kahayan–Sebangau PHU were a significant factor involved in maintaining the moisture of the peat soil in nearby regions. The water level at the time of the highest tide determined the broadness of the tidal influence. In this study, the tidal observation data was recorded by three tidal observation stations, namely in Bahaur, Pangkuh, and Talio (see Figure 9). The Bahaur station was located near the estuary of the Kahayan River (+/− 4 km); the Pangkuh station was located on the Kahayan River, approximately 37 km from the estuary; and the Talio station was at the Primary canal, located 7 km from the Kahayan River. Each observation had been conducted for 15 days. Furthermore, a tidal harmonic analysis was performed to obtain data on the highest monthly water tide during the full moon (highest water spring) and predicted the highest water for 18.6 years (highest astronomical tide). The results of the tidal analysis are presented in Table 5.
Based on the data presented in Table 5, the Kahayan–Sebangau PHU had diurnal tides (i.e., in 24 h, there is only one high tide and one low tide), which should be sufficient to wet the affected area all day. The maximum monthly water level that occurred between the full moon and the new moon was 1.387 m. The highest water level in 18.6 years, which was the result of astronomical conditions and the position of the moon and sun, was a high tide of 1.701 m. After obtaining the high-water elevation data (Highest Astronomical Tide–HAT and Highest Water Springs–HWS) based on the tidal observations of three stations, the identification of areas affected by the tides was performed. The rest of the region was dependent on rainwater for its moisture. The tidal-affected area is presented in Figure 9.
In areas that were only affected by rainwater as a source of clean water, dryness was indicated by the distribution and location of fires during the study period. Frequent fires in an area suggested that more damage and drought had occurred. To identify the most degraded sub-PHU, we examined the distribution of the recurrent fires.
In this study, fire data were obtained based on the information recorded by MODIS-Terra and MODIS-Aqua images between 2010–2020. By considering the confidence levels of the fire incident data, the fire events in the PHU area were identified. Previous researchers had set a range of confidence levels for the hotspot data [40,60,61,62]; however, considering the similarity of peat types as well as the environmental and climatic conditions, we set a 70% confidence level as the threshold [61]. The distribution of the fire incidents in Kahayan–Sebangau PHU during 2010–2020 is presented in Figure 9.
In 2010–2020, the incidences of fire were grouped into two periods: 2010–2015 (the fire peak occurred in 2015) and 2016–2020 (the fire peak occurred in 2019). Based on the data presented in Figure 9, few fires occurred in tidal-affected areas. Between 2010 and 2015, fires occurred in most sub-PHUs, especially those in the north, east, and south regions. Recurrent fires occurred in several places. However, only a few areas were not burned (with natural forests). In 2016–2020, fire incidents occurred, but there were fewer, as compared to the previous period. The pattern observed was that fires did not occur in the planting concession and the tidal-affected areas, and fires most often occurred close to the planting concession and residential areas. It indicated that canal networks and human activities had increased the droughts and the loss of water in the peat soil. During the second fire period, fire events occurred in the north area (sub-PHUs 1 and 2) as well as in the South area (sub-PHUs 14, 15, and 16). The number of fire incidents per year for each sub-PHU is presented in Table 6.
Based on the data presented in Table 6, sub-PHU 16 had the most frequent fires. However, in the last three years of the study period, all sub-PHUs had significantly fewer fires. The worst five areas in terms of fire incidents were sub-PHU 16, sub-PHU 14, sub-PHU 15, sub-PHU 4, and sub-PHU 1. In contrast, the best six areas in terms of fire incidents were sub-PHU 5, sub-PHU 6, sub-PHU 3, sub-PHU 9, sub-PHU 10, and sub-PHU 7. Improvements in the overall frequency of fires in these areas might have been due to improved public awareness regarding peat soil protection and improvements in water management.

3.6. Peat Water Volume and Peat Water Loss

To calculate the volume of the peat water contained in each sub-PHU and the acceleration of water loss, the volume of the peat soil had to first be estimated. The peat soil volume was calculated based on an analysis of peat depth measurement data from the field survey using the transect method and the peat auger. Furthermore, for the calculation and the presentation of the peat depth data, the mineral soil and the topographic surface elevations of the peatland were determined. The visualization of the data is presented in Figure 10 and in an enlarged size, presented in Figure A1. Line A to I is the sampling positions of the conditions at Kahayan-Sebangau PHU, both in longitudinal section (line A) and cross profiles (line B to I). The results of the calculation of the area, the volume of the peat soil, the volume of the peat water, the average depth of the peat soil for each sub-PHU, and the rate of groundwater loss are presented in Table 7.
Based on the results presented in Table 7, the volume of peat soil for the entire Kahayan–Sebangau PHU was 11,681,987,630 m3, with an average peat thickness of 3.261 m. There were 16 permanent groundwater level observation stations (SIPALAGA) installed in the PHU and close to the Kahayan River (see Figure 10). However, only three stations were used in this study, namely the Dandang, Jabiren_1, and Tanjung Taruna stations. These three groundwater monitoring stations were chosen as they were located in deep peat areas and represented the typical drainage conditions and land use throughout the PHU. The Dandang station was located in the swamp shrub area and near the tidal-affected area. Jabiren_1 was in a swamp shrub and planting area with artificial canals networks. Tanjung Taruna station was located in planting areas and far from the tidal-affected areas. The water loss rates for Dandang, Jabiren_1, and Tanjung Taruna stations were 16 mm/day, 17 mm/day, and 22 mm/day, respectively.
The water loss rate for each station was used to determine the total runoff and evapotranspiration. The daily evapotranspiration was obtained from monthly TerraClimate data to calculate the water balance. In general, the value of groundwater subsidence for all sub-PHU in Kahayan–Sebangau PHU had approximately the same magnitude. In this calculation, we attempted to simulate groundwater level subsidence. If there was no rain for 14 days, the water level would drop by approximately 23–31 cm. In 21 consecutive days without rain, the groundwater level would decrease by 34–46 cm. The condition of dry days during the last 11 years is presented in Table 3.

3.7. Determination of the Restoration Priority Areas

Based on the results presented in the previous sections, we categorized the sub-PHUs from the best to the worst condition. In that order, the first rank was assigned to the best sub-PHU, and the last rank (sixteenth) was assigned to the worst condition. The rank according to each parameter was used as a score to determine the priority areas for restoration [63]. Ranking can only be applied to numerical attribute data of ordinal type but cannot be used for interval and ratio types [64]. The scoring matrix for determining the degradation level (priority areas) in Kahayan–Sebangau PHU is presented in Table 8, and the map of the degradation levels is provided in Figure 11.
According to Table 8, sub-PHU 16, followed by sub-PHU 15, sub-PHU 1, sub-PHU 14, and sub-PHU 11, are the five worst sub-PHUs that have the highest need for restoration. The LULC values for sub-PHU 16, and sub-PHU 15 were a result of the significant development of palm oil concession areas with a massive canal network, with a small proportion of land used as swamp scrub areas. The concession planting area was not located in the highest location in the sub-PHU. Sub-PHU 14 and sub-PHU 11 were generally used as residential and planting areas for local inhabitants. Planting areas with a dense, massive network of canals, in combination with other factors, likely caused the conditions in those sub-PHUs to worsen. Sub-PHU 1 was located in Palangkaraya City, and urban activities and residential land use dominated it.
Based on the data presented in Table 8, the best condition was in sub-PHU 9, followed by sub-PHU 3, sub-PHU 6, sub-PHU 10, sub-PHU 5, and sub-PHU 12. In sub-PHU 12, although there was a concession area with a very dense, wide artificial canal network, the peat soil was still deep and moist. Therefore, the hydrological and water balance conditions were still in the middle levels. Sub-PHU 9, although it was the sub-PHU in the best condition, appeared to have been opened for oil palm planting during our site visit. In addition, the main channel around this sub-PHU also had a fairly high discharge, which was the water channel outlet for sub-PHU 9 and the surrounding sub-PHUs.

4. Discussion

The results written in this paper are an example in tropical peat areas, which may differ from peat conditions in other locations. Determining the peat unit should require consideration of the complete hydrological system (full peat domes, sub-domes, or integral hydrological unit) [2,15]. The results of this study in determining sub-PHU still consider the peatland as a hydrological unit and conducted by identifying the highest point of elevation (a dome or a mini-dome) and bordered by the main outlet (a primary canal or natural river) with a closed pattern. The direction of the peat water flow was towards the lowest elevations, where the outlet channels were located [65,66]. This research accurately identified surface water flow direction using the DTM-LiDAR data. DTM-LiDAR data provided detailed information regarding topographic conditions, and the identification of surface streamlines, channels, and rivers [67,68].
Based on the research results, land use and land cover (LULC) in the sub-PHU areas greatly affected the hydrological conditions in the peatland areas. LULC is closely associated with water balance analysis, peat thickness, soil moisture index, vegetation density index, and fire frequency. Although it can reduce the quantity of rainwater that reaches the ground [69,70], land with high vegetation cover can also reduce the rate of evapotranspiration of water in peat soil [34]. Nevertheless, the establishment of artificial canal networks accelerates water loss in peat soil [1] due to evaporation and water run-off [24]. In the Kahayan-Sebangau PHU, canal networks in concession planting areas functioned to maintain lower groundwater levels in order to maintain the development of industrial plants and increase the carrying capacity of peat soil [1,2]. In contrast, natural forest cover retains rainwater in peat soil [24]. Therefore, the greater the area that has been converted from natural forests and peat swamps to planting areas (community and industrial concessions), the more threatened the hydrological conditions [8], as happened in the Kahayan-Sebangau PHU.
In this PHU, each sub-PHU’s condition has to be analyzed based on the relationship between land cover conditions, vegetation, fire frequency, and peat soil wetness [6,8]. Another important factor is precipitation. Rainfall is the only source of fresh water in ombrogenous peatlands. Precipitation has a significant impact on water balance, land wetness, fire frequency, and drought risk. Water balance analysis should be conducted to evaluate peatland conditions based on the amount of water storage and loss [34]. By determining the water balance, areas most at risk for droughts can be identified [24,32]. The evaluation of degraded peatland in the Kahayan-Sebangau PHU has also been conducted based on the trends of dry days in each sub-PHU area [8,23] for many years. As the climate is a cycle of repeated events [1], the observation of conditions during dry periods will be an indicator [24] in this evaluation. Dry peat soil will have a higher risk of frequent fires.
Fire incidence is the most significant indicator of peatland damage [7]. Peat soil has an irreversible characteristic, and if the level of drought is severe, the peat soil can become hydrophobic, which can increase its fire risk. Fires have increased the release of carbon elements into the atmosphere and have caused extensive damage to peat soil due to such fires being difficult to control [1]. Therefore, reducing the water loss in peat soil is crucial. To reduce the rate of peat water loss due to canal flows, it is highly recommended to block and back-fill canals [8,23].
In addition to rainwater, peatlands in the Kahayan-Sebangau PHU’s coastal areas benefit from a second water source via tidal forces on river water. Therefore, tidal-affected factors should also be considered when evaluating the wetness and damage in a sub-PHU [71]. The river water flows to the peatland through the canals, and ditches are caused by tidal force. Therefore, it maintains the wetness and moisture of the peatland [1]. In addition, peat water that has been mixed with saltwater from tidal rivers has been shown to increase the nutrients in peat soil [1].
In the Kahayan-Sebangau PHU, rewetting and revegetation in peatland have often interfered with local residents’ behaviors and customs [6] as the rivers and waterways are often used to meet their needs [7]. Therefore, it will be essential to consider the behavior and mindsets of local communities when implementing restoration initiatives. Restoration activities should not only be focused on managing the physical peatland (through water and plant management activities) but should also raise awareness in the local communities [6]. Rewetting, revegetation, and restoration of the peat soil can also rapidly and sustainably restore their livelihoods [6,7].
Determining the priority sub-PHU areas for intervention and restoration activities is an alternative solution to reduce the cost, effort, and time required to restore the entire PHU area. Identifying the worst affected sub-PHUs areas can allow for them to be restored to a similar level to others. However, in many cases, these will also be the most difficult to restore because of the massive investment in drainage infrastructure and plantation crops, and community reliance on the drained peat. Therefore, another alternative can be to focus on the restoration of sub-PHUs that are still in the medium and best categories. For the same amount of inputs, this would provide greater restoration outcomes at the landscape level.

5. Conclusions and Recommendations

5.1. Conclusions

Using the Kahayan-Sebangau PHU as an example, we have shown that sub-PHUs can be identified based on the analysis of hydrological conditions, with water flow on the surface of the peat soil forming a radial pattern from the top of a peat dome to the main outlet channel. The direction of the water flow on the surface also represented the direction of the water flow in the peat soil. According to the principle of water flows, following the force of gravity, from higher places to lower places, the main outlet channel was typically a deep, wide primary canal (or natural river), which had been interconnected and formed a closed/circular pattern connected to the PHU boundary river. Identifying land use and land cover (LULC) was an essential element for analyzing and evaluating peatland degradation. LULC had a close association with water balance, peat thickness, soil moisture index, vegetation density index, and fire frequency. In addition, an important factor in the analysis and the evaluation of peatland damage and prioritizing was precipitation. Rain is the only water source for the ombrogenous peatlands found in tropical areas. Precipitation had a close association with water balance, soil wetness, fire frequency, and dry periods. Especially for coastal areas, the influence of the tides maintained the wetness and moisture levels and thus mitigated their drought risk. The data indicated that the tidal-affected areas had few fires. Based on the analysis results of ten parameters in the Kahayan–Sebangau PHU, the most damaged sub-PHUs were prioritized for immediate restoration in the following order: sub-PHU 16, sub-PHU 15, sub-PHU 1, sub-PHU 14, and sub-PHU 11. The sub-PHUs that required hydrological improvement and increased awareness in the local communities regarding peat restoration were sub-PHU 2, sub-PHU 4, sub-PHU 8, sub-PHU 7, and sub-PHU 13. In contrast, the sub-PHUs that had the best wetness and hydrological conditions and should be maintained accordingly were sub-PHU 9, sub-PHU 3, sub-PHU 6, sub-PHU 10, sub-PHU 5, and sub-PHU 12.

5.2. Recommendation

Determining sub-PHU boundaries and identifying the damaged areas can be achieved through understanding groundwater flow, peat stratification, and other hydrogeological factors. To better focus and structure peatland management and restoration, it will be necessary to determine priority areas, as was presented in this study, so that intervention activities can be measured. To ensure that restoration activities are successful, monitoring and evaluating the peatland’s condition should be conducted regularly and frequently. It is necessary to prevent further damage to peat soil as it takes a long time to restore. Restoration activities should not only be focused on managing the physical peatland (through water and plant management activities) but should also raise awareness in the local communities. Based on the data presented in this manuscript, it is known that the peat condition in the Kahayan-Sebangau PHU has suffered intense damage in many places. One of the causes of this damage is the conversion of peatlands into an extensive industrial planting area. Therefore, the permits for land-use conversion in the Kahayan–Sebangau PHU area should be tightened to conserve the peatland water storage and to prevent further damage.

Author Contributions

Conceptualization, B.K.C., T.A. and I.; methodology, B.K.C.; software, B.K.C.; validation, B.K.C., T.A. and I.; formal analysis, B.K.C.; investigation B.K.C. and T.A.; resources, B.K.C. and T.A.; data curation, B.K.C.; writing—original draft preparation, B.K.C., T.A. and I.; writing—review and editing, B.K.C., T.A. and I.; visualization, B.K.C.; supervision, T.A. and I.; project administration, B.K.C.; funding acquisition, T.A. All authors have read and agreed to the published version of the manuscript.

Funding

This research was funded by the Final Project Recognition Program, Universitas Gadjah Mada.

Institutional Review Board Statement

Not applicable.

Informed Consent Statement

Not applicable.

Data Availability Statement

Not applicable.

Acknowledgments

We would like to thank The Peatland and Mangrove Restoration Agency of the Republic of Indonesia (BRGM-RI) for the peat depth, LiDAR DTM, aerial photographs, WorldDEM, and continuous peat water elevation (SIPALAGA) data; the Universitas Gadjah Mada for the RTA grant; and the Geodetic Engineering Department for the computer processing facilities. Additionally, we acknowledge Joko Sujono, Rachmad Jayadi, Djoko Luknanto, Akram Sripandam Prihanantya, Novitasari, Neil Andika, Ni Made Candra Partarini, and Kholifatul Husna for their comments, helps, contributions, and support for the site visit to the Kahayan–Sebangau PHU.

Conflicts of Interest

The authors declare no conflict of interest. The funders had no role in the design of the study; in the collection, analyses, or interpretation of data; in the writing of the manuscript; or in the decision to publish the results.

Appendix A

Figure A1. The visualization of peat soil thickness in cross-profiles in the Kahayan–Sebangau PHU consider the topographic position of the soil surface (blue dashed-line) and mineral soil elevation (green). (data source: BRGM-RI; processed by the authors).
Land 11 01094 g0a1

References

  1. Osaki, M.; Tsuji, N. Tropical Peatland Ecosystems; Osaki, M., Tsuji, N., Eds.; Springer: Tokyo, Japan, 2016; ISBN 978-4-431-55680-0. [Google Scholar]
  2. Jaenicke, J.; Englhart, S.; Siegert, F. Monitoring the effect of restoration measures in Indonesian peatlands by radar satellite imagery. J. Environ. Manag. 2011, 92, 630–638. [Google Scholar] [CrossRef] [PubMed]
  3. Dommain, R.; Couwenberg, J.; Joosten, H. Hydrological self-regulation of domed peatlands in south-east Asia and consequences for conservation and restoration. Mires Peat 2010, 6, 1–17. [Google Scholar]
  4. Information Centre, Alberta Environment and Sustainable Resource Development. Alberta Government Ecosystem Service Approach Pilot on Wetlands, Assessment of Water Storage and Flood Control Ecosystem Services; Information Centre, Alberta Environment and Sustainable Resource Development: Edmonton, Alberta, 2011. [Google Scholar]
  5. Posa, M.R.C.; Wijedasa, L.S.; Corlett, R.T. Biodiversity and Conservation of Tropical Peat Swamp Forests. BioScience 2011, 61, 49–57. [Google Scholar] [CrossRef]
  6. Page, S.; Hosciło, A.; Wösten, H.; Jauhiainen, J.; Silvius, M.; Rieley, J.; Ritzema, H.; Tansey, K.; Graham, L.; Vasander, H.; et al. Restoration ecology of lowland tropical peatlands in Southeast Asia: Current knowledge and future research directions. Ecosystems 2009, 12, 888–905. [Google Scholar] [CrossRef]
  7. Dohong, A.; Abdul Aziz, A.; Dargusch, P. A Review of Techniques for Effective Tropical Peatland Restoration. Wetlands 2018, 38, 275–292. [Google Scholar] [CrossRef]
  8. Grand-Clement, E.; Anderson, K.; Smith, D.; Angus, M.; Luscombe, D.J.J.; Gatis, N.; Bray, L.S.S.; Brazier, R.E.E. New approaches to the restoration of shallow marginal peatlands. J. Environ. Manag. 2015, 161, 417–430. [Google Scholar] [CrossRef] [Green Version]
  9. Afriyanti, D.; Kroeze, C.; Saad, A. Science of the Total Environment Indonesia palm oil production without deforestation and peat conversion by 2050. Sci. Total Environ. 2016, 557, 562–570. [Google Scholar] [CrossRef] [PubMed]
  10. Evans, C.D.; Williamson, J.M.; Kacaribu, F.; Irawan, D.; Suardiwerianto, Y.; Hidayat, M.F.; Laurén, A.; Page, S.E. Rates and Spatial Variability of Peat Subsidence in Acacia Plantation and Forest Landscapes in Sumatra, Indonesia. Geoderma 2019, 338, 410–421. [Google Scholar] [CrossRef]
  11. Dohong, A.; Aziz, A.A.; Dargusch, P. A review of the drivers of tropical peatland degradation in South-East Asia. Land Use Policy 2017, 69, 349–360. [Google Scholar] [CrossRef]
  12. Saputra, E. Beyond Fires and Deforestation: Tackling Land Subsidence in Peatland Areas, a Case Study from Riau, Indonesia. Land 2019, 8, 76. [Google Scholar] [CrossRef] [Green Version]
  13. Vetrita, Y.; Cochrane, M.A. Fire frequency and related land-use and land-cover changes in Indonesia’s Peatlands. Remote Sens. 2020, 12, 5. [Google Scholar] [CrossRef] [Green Version]
  14. THOHA, A.S.; SAHARJO, B.H.; BOER, R.; ARDIANSYAH, M. Characteristics and causes of forest and land fires in Kapuas District, Central Kalimantan Province, Indonesia. Biodiversitas J. Biol. Divers. 2018, 20, 110–117. [Google Scholar] [CrossRef] [Green Version]
  15. Joosten, H.; Tapio-Biström, M.-L.; Tol, S. Peatlands—Guidance for Climate Change Mitigation through Conservation, Rehabilitation, 5th ed.; FAO of the UN and Wetlands International: Rome, Italy, 2012; ISBN 9789251073025. [Google Scholar]
  16. Minasny, B.; Berglund, Ö.; Connolly, J.; Hedley, C.; de Vries, F.; Gimona, A.; Kempen, B.; Kidd, D.; Lilja, H.; Malone, B.; et al. Digital Mapping of Peatlands—A Critical Review. Earth-Sci. Rev. 2019, 18, 102870. [Google Scholar] [CrossRef]
  17. Ministry of State Secretariat, Republic of Indonesia. Ministry of State Secretariat, Government Regulation No. 57/2016 Concerning Amendments to the Government Regulation No. 71/2014 on Protection and Management of Peat Ecosystems; Ministry of State Secretariat, Republic of Indonesia: Jakarta, Indonesia, 2016; pp. 1–15. [Google Scholar]
  18. Ministry of Environment and Forestry of the Republic of Indonesia. MoEF. Ministerial Regulation of the Minister of Environment and Forestry of the Republic of Indonesia Number P.10/MENLHK/SETJEN/KUM.1/3/2019 Concerning Determination, Establishment, and Management of Peat Dome Peaks Based on Peat Hydrological Units; Ministry of Environment and Forestry of the Republic of Indonesia: Jakarta, Indonesia, 2019; pp. 1–57. [Google Scholar]
  19. NRCS-USDA. Conservation Practice Standard: Wetland Restoration; Natural Resources Conservation Service of the United States Department of Agriculture: Washington, DC, USA, 2010. [Google Scholar]
  20. Ritzema, H.; Limin, S.; Kusin, K.; Jauhiainen, J.; Wosten, H. Canal Blocking Strategies for Hydrological Restoration of Degraded Tropical Peatlands in Central Kalimantan-Indonesia. Catena 2014, 114, 11–20. [Google Scholar] [CrossRef] [Green Version]
  21. Lunt, P.; Allot, T.; Anderson, P.; Buckler, M.; Coupar, A.; Jones, P.; Labadz, J.; Worrall, P.; Evans, E.M. Impacts of Peatland Restoration. Sci. Rev. Comm. By IUCN UK Peatl. Programme Comm. Inq. Into Peatl. Restor. 2010, 3, 1–33. [Google Scholar]
  22. Luna, D.A.; Ocampo, D.V.; Quiñones, S.G.L.; Rivera, E.C.; Sejalbo, C.G.; Zara, P.R.; Hizon, K.B.M.; Reyes, J.A.V.D.; Ticzon, V.S.; Macandog, D.M. Coastal Objects: Mangrove Area Extraction Using Remote Sensing and Aerial LiDAR Data in Roxas, Oriental Mindoro. Environ. Ecol. Res. 2017, 5, 282–288. [Google Scholar] [CrossRef] [Green Version]
  23. Jaenicke, J.; Wösten, H.; Budiman, A.; Siegert, F. Planning hydrological restoration of peatlands in Indonesia to mitigate carbon dioxide emissions. Mitig. Adapt. Strateg. Glob. Chang. 2010, 15, 223–239. [Google Scholar] [CrossRef] [Green Version]
  24. Gracz, M.B.; Moffett, M.F.; Siegel, D.I.; Glaser, P.H. Analyzing peatland discharge to streams in an Alaskan watershed: An integration of end-member mixing analysis and a water balance approach. J. Hydrol. 2015, 530, 667–676. [Google Scholar] [CrossRef]
  25. Bragg, O.; Lindsay, R.; Risager, M.; Silvius, M.; Zingstra, H. Strategy and Action Plan for Mire and Peatland Conservation in Central Europe; Wetland International: Wageningen, The Netherlands, 2003; ISBN 90-5882-018-1. [Google Scholar]
  26. Minasny, B.; Setiawan, B.I.; Arif, C.; Saptomo, S.K.; Chadirin, Y. Digital mapping for cost-effective and accurate prediction of the depth and carbon stocks in Indonesian peatlands. Geoderma 2016, 272, 20–31. [Google Scholar] [CrossRef]
  27. Jaenicke, J.; Rieley, J.O.; Mott, C.; Kimman, P.; Siegert, F. Determination of the amount of carbon stored in Indonesian peatlands. Geoderma 2008, 147, 151–158. [Google Scholar] [CrossRef]
  28. Bonnett, S.A.; Ross, S.; Linstead, C.; Maltby, E. A Review of Techniques for Monitoring the Success of Peatland Restoration; Natural England: Sheffield, UK, 2009. [Google Scholar]
  29. Mirmanto, E.; Tsuyuzaki, S.; Kohyama, T. Investigation of the Effects of Distance from River and Peat Depth on Tropical Wetland Forest Communities. Tropics 2003, 12, 287–294. [Google Scholar] [CrossRef] [Green Version]
  30. Talib, A.; Khaidir, M.; Yasufuku, N. An Overview on Japan and Malaysia Peat Relating to Geotechnical Characteristic. Int. J. Integr. Eng. 2014, 6, 1–7. [Google Scholar]
  31. Kolay, P.K.; Rahman, M.A. Physico-geotechnical properties of peat and its stabilisation. Proc. Inst. Civ. Engl. Gr. Improv. 2016, 169, 206–216. [Google Scholar] [CrossRef]
  32. Edom, F.; Münch, A.; Dittrich, I.; Keßler, K.; Peters, R. Hydromorphological analysis and water balance modelling of ombro- and mesotrophic peatlands. Adv. Geosci. 2010, 27, 131–137. [Google Scholar] [CrossRef] [Green Version]
  33. Minasny, B.; Setiawan, B.I.; Saptomo, S.K.; McBratney, A.B. Open digital mapping as a cost-effective method for mapping peat thickness and assessing the carbon stock of tropical peatlands. Geoderma 2018, 313, 25–40. [Google Scholar] [CrossRef]
  34. Thompson, D.K.; Benscoter, B.W.; Waddington, J.M. Water Balance of a Burned and Unburned Forested Boreal Peatland. Hydrol. Process. 2014, 28, 5954–5964. [Google Scholar] [CrossRef]
  35. Lukenbach, M.C.; Devito, K.J.; Kettridge, N.; Petrone, R.M.; Waddington, J.M. Hydrogeological controls on post-fire moss recovery in peatlands. J. Hydrol. 2015, 530, 405–418. [Google Scholar] [CrossRef]
  36. Luscombe, D.J.; Anderson, K.; Grand-Clement, E.; Gatis, N.; Ashe, J.; Benaud, P.; Smith, D.; Brazier, R.E. How does drainage alter the hydrology of shallow degraded peatlands across multiple spatial scales? J. Hydrol. 2016, 541, 1329–1339. [Google Scholar] [CrossRef] [Green Version]
  37. Page, S.E.; Hooijer, A. In the line of fire: The peatlands of Southeast Asia. Philos. Trans. R. Soc. B Biol. Sci. 2016, 371, 20150176. [Google Scholar] [CrossRef] [Green Version]
  38. Bourgault, M.A.; Larocque, M.; Garneau, M. How do hydrogeological setting and meteorological conditions influence water table depth and fluctuations in ombrotrophic peatlands? J. Hydrol. X 2019, 4, 100032. [Google Scholar] [CrossRef]
  39. Giglio, L.; Schroeder, W.; Justice, C.O. The collection 6 MODIS active fire detection algorithm and fire products. Remote Sens. Environ. 2016, 178, 31–41. [Google Scholar] [CrossRef] [PubMed] [Green Version]
  40. Giglio, L.; Schroeder, W.; Hall, J.V.; Justice, C.O. MODIS Collection 6 Active Fire Product User ’ s Guide Revision C. Sites J. 20th Century Contemp. Fr. Stud. 2020, 2, 44. [Google Scholar]
  41. ESA. Sentinel-2 User Handbook; Rev-2; European Space Agency: Paris, France, 2015. [Google Scholar]
  42. Abatzoglou, J.T.; Dobrowski, S.Z.; Parks, S.A.; Hegewisch, K.C. TerraClimate, a high-resolution global dataset of monthly climate and climatic water balance from 1958–2015. Sci. Data 2018, 5, 170191. [Google Scholar] [CrossRef] [PubMed] [Green Version]
  43. Funk, C.; Peterson, P.; Landsfeld, M.; Pedreros, D.; Verdin, J.; Shukla, S.; Husak, G.; Rowland, J.; Harrison, L.; Hoell, A.; et al. The climate hazards infrared precipitation with stations—A new environmental record for monitoring extremes. Sci. Data 2015, 2, 150066. [Google Scholar] [CrossRef] [Green Version]
  44. Menberu, M.W.; Haghighi, A.T.; Ronkanen, A.K.; Marttila, H.; Kløve, B. Effects of Drainage and Subsequent Restoration on Peatland Hydrological Processes at Catchment Scale. Water Resour. Res. 2018, 54, 4479–4497. [Google Scholar] [CrossRef] [Green Version]
  45. Katimon, A.; Khairi, A.; Wahab, A.B.D. Hydrologic Characteristics of a Drained Tropical. J. Teknol. 2007, 38, 39–53. [Google Scholar]
  46. Buffam, I.; Carpenter, S.R.; Yeck, W.; Hanson, P.C.; Turner, M.G. Filling holes in regional carbon budgets: Predicting peat depth in a north temperate lake district. J. Geophys. Res. 2010, 115, 1–16. [Google Scholar] [CrossRef] [Green Version]
  47. Akpa, S.I.C.; Odeh, I.O.A.; Bishop, T.F.A.; Hartemink, A.E. Digital Mapping of Soil Particle-Size Fractions for Nigeria. Soil Sci. Soc. Am. J. 2014, 78, 1953–1966. [Google Scholar] [CrossRef] [Green Version]
  48. Sencaki, D.B.; Muhammad, D.J.; Sumargana, L.; Gandharum, L. Peatland Delineation Using Remote Sensing Data in Sumatera Island. In Proceedings of the 2018 IEEE Asia-Pacific Conference on Geoscience, Electronics and Remote Sensing Technology (AGERS), Bali, Indonesia, 18–19 September 2018; pp. 1–6. [Google Scholar]
  49. Smith, M.W.; Warburton, J. Microtopography of bare peat: A conceptual model and objective classification from high-resolution topographic survey data. Earth Surf. Process. Landforms 2018, 43, 1557–1574. [Google Scholar] [CrossRef] [Green Version]
  50. Thomas, K. A New Simplified DSM-to-DTM Algorithm—dsm-to-dtm-step. Preprints 2018, 1–10. [Google Scholar] [CrossRef]
  51. Karyanto, O.; Aditya, T. Multi-Sensors Remote Sensing for Mapping and Monitoring Canals on Tropical Peatland. In Proceedings of the 2018 4th International Conference on Science and Technology (ICST), Yogyakarta, Indonesia, 7–8 August 2018; Volume 1, pp. 1–5. [Google Scholar]
  52. Jenson, S.K.; Domingue, J.O. Extracting topographic structure from digital elevation data for geographic information system analysis. Photogramm. Engl. Remote Sens. 1988, 54, 1593–1600. [Google Scholar]
  53. Cahyono, B.K.; Aditya, T. The Least Square Adjustment for Estimating The Tropical Peat Depth using LiDAR Data. Remote Sens. 2020, 12, 875. [Google Scholar] [CrossRef] [Green Version]
  54. Golden, H.E.; Lane, C.R.; Amatya, D.M.; Bandilla, K.W.; Raanan Kiperwas, H.; Knightes, C.D.; Ssegane, H. Hydrologic connectivity between geographically isolated wetlands and surface water systems: A review of select modeling methods. Environ. Model. Softw. 2014, 53, 190–206. [Google Scholar] [CrossRef]
  55. Bevington, A.; Gleason, H.; Giroux-Bougard, X.; De Jong, J.T. A Review of Free Optical Satellite Imagery for Watershed-Scale Landscape Analysis. Conflu. J. Watershed Sci. Manag. 2018, 2, 1–22. [Google Scholar] [CrossRef]
  56. Phua, M.H.; Tsuyuki, S.; Lee, J.S.; Sasakawa, H. Detection of burned peat swamp forest in a heterogeneous tropical landscape: A case study of the Klias Peninsula, Sabah, Malaysia. Landsc. Urban Plan. 2007, 82, 103–116. [Google Scholar] [CrossRef]
  57. Vanderhoof, M.K.; Hawbaker, T.J.; Teske, C.; Ku, A.; Noble, J.; Picotte, J. Mapping Wetland Burned Area from Sentinel-2 across the Southeastern United States and Its Contributions Relative to Landsat-8 (2016–2019). Fire 2021, 4, 52. [Google Scholar] [CrossRef]
  58. Huang, C.; Wylie, B.; Yang, L.; Homer, C.; Zylstra, G. Derivation of a tasselled cap transformation based on Landsat 7 at-satellite reflectance. Int. J. Remote Sens. 2002, 23, 1741–1748. [Google Scholar] [CrossRef]
  59. Ballhorn, U.; Siegert, F.; Mason, M.; Limin, S. Derivation of burn scar depths and estimation of carbon emissions with LIDAR in Indonesian peatlands. Proc. Natl. Acad. Sci. USA 2009, 106, 21213–21218. [Google Scholar] [CrossRef] [Green Version]
  60. Hall, J.V.; Loboda, T.V.; Giglio, L.; McCarty, G.W. A MODIS-based burned area assessment for Russian croplands: Mapping requirements and challenges. Remote Sens. Environ. 2016, 184, 506–521. [Google Scholar] [CrossRef] [Green Version]
  61. Shofiana, D.A.; Sitanggang, I.S. Confidence Analysis of Hotspot as Peat Forest Fire Indicator. J. Phys. Conf. Ser. 2021, 1751, 012035. [Google Scholar] [CrossRef]
  62. Hawbaker, T.J.; Radeloff, V.C.; Syphard, A.D.; Zhu, Z.; Stewart, S.I. Detection rates of the MODIS active fire product in the United States. Remote Sens. Environ. 2008, 112, 2656–2664. [Google Scholar] [CrossRef]
  63. Moser, G.; Zerubia, J. Mathematical Models for Remote Sensing Image Processing. In Signals and Communication Technology; Moser, G., Zerubia, J., Eds.; Springer International Publishing: Cham, Switzerland, 2018; ISBN 978-3-319-66328-9. [Google Scholar]
  64. Tomaszewski, B. Geographic Information Systems (GIS). In A Tool for Disaster Management, 1st ed.; CRC Press: Boca Raton, FL, USA, 2015; ISBN 978-1-4822-1169-6. [Google Scholar]
  65. Ballard, C.E.; McIntyre, N.; Wheater, H.S.; Holden, J.; Wallage, Z.E. Hydrological modelling of drained blanket peatland. J. Hydrol. 2011, 407, 81–93. [Google Scholar] [CrossRef]
  66. Schumann, M.; Joosten, H. A Global Peatland Restoration Manual; Draft; UNEP-GEF: Greifswald, Germany, 2006. [Google Scholar]
  67. Murphy, P.N.; Ogilvie, J.; Meng, F.-R.; Arp, P. Stream Network Modelling using LiDAR and Photogrammetric Digital Elevation Models: A Comparison and Field Verification. Hydrol. Process. 2007, 22, 1747–1754. [Google Scholar] [CrossRef]
  68. Lang, M.; McDonough, O.; McCarty, G.; Oesterling, R.; Wilen, B. Enhanced detection of wetland-stream connectivity using lidar. Wetlands 2012, 32, 461–473. [Google Scholar] [CrossRef]
  69. Orság, M.; Fischer, M.; Trnka, M.; Pohanková, E.; Pozníková, G.; Žalud, Z. Role of interception and stem flow in water balance of short rotation poplar coppice. In Proceedings of the Environmental Changes and Adaptation Strategies, Skalica, Slovakia, 9–11 September 2013; pp. 1–4. [Google Scholar]
  70. Gerrits, A.M.J. The Role of Biodiversity in the Hydrological Cycle; Delft University of Technology: Delft, The Netherlands, 2016. [Google Scholar]
  71. FGDC. Wetlands Mapping Standard; FGDC: Reston, VA, USA, 2009. [Google Scholar]
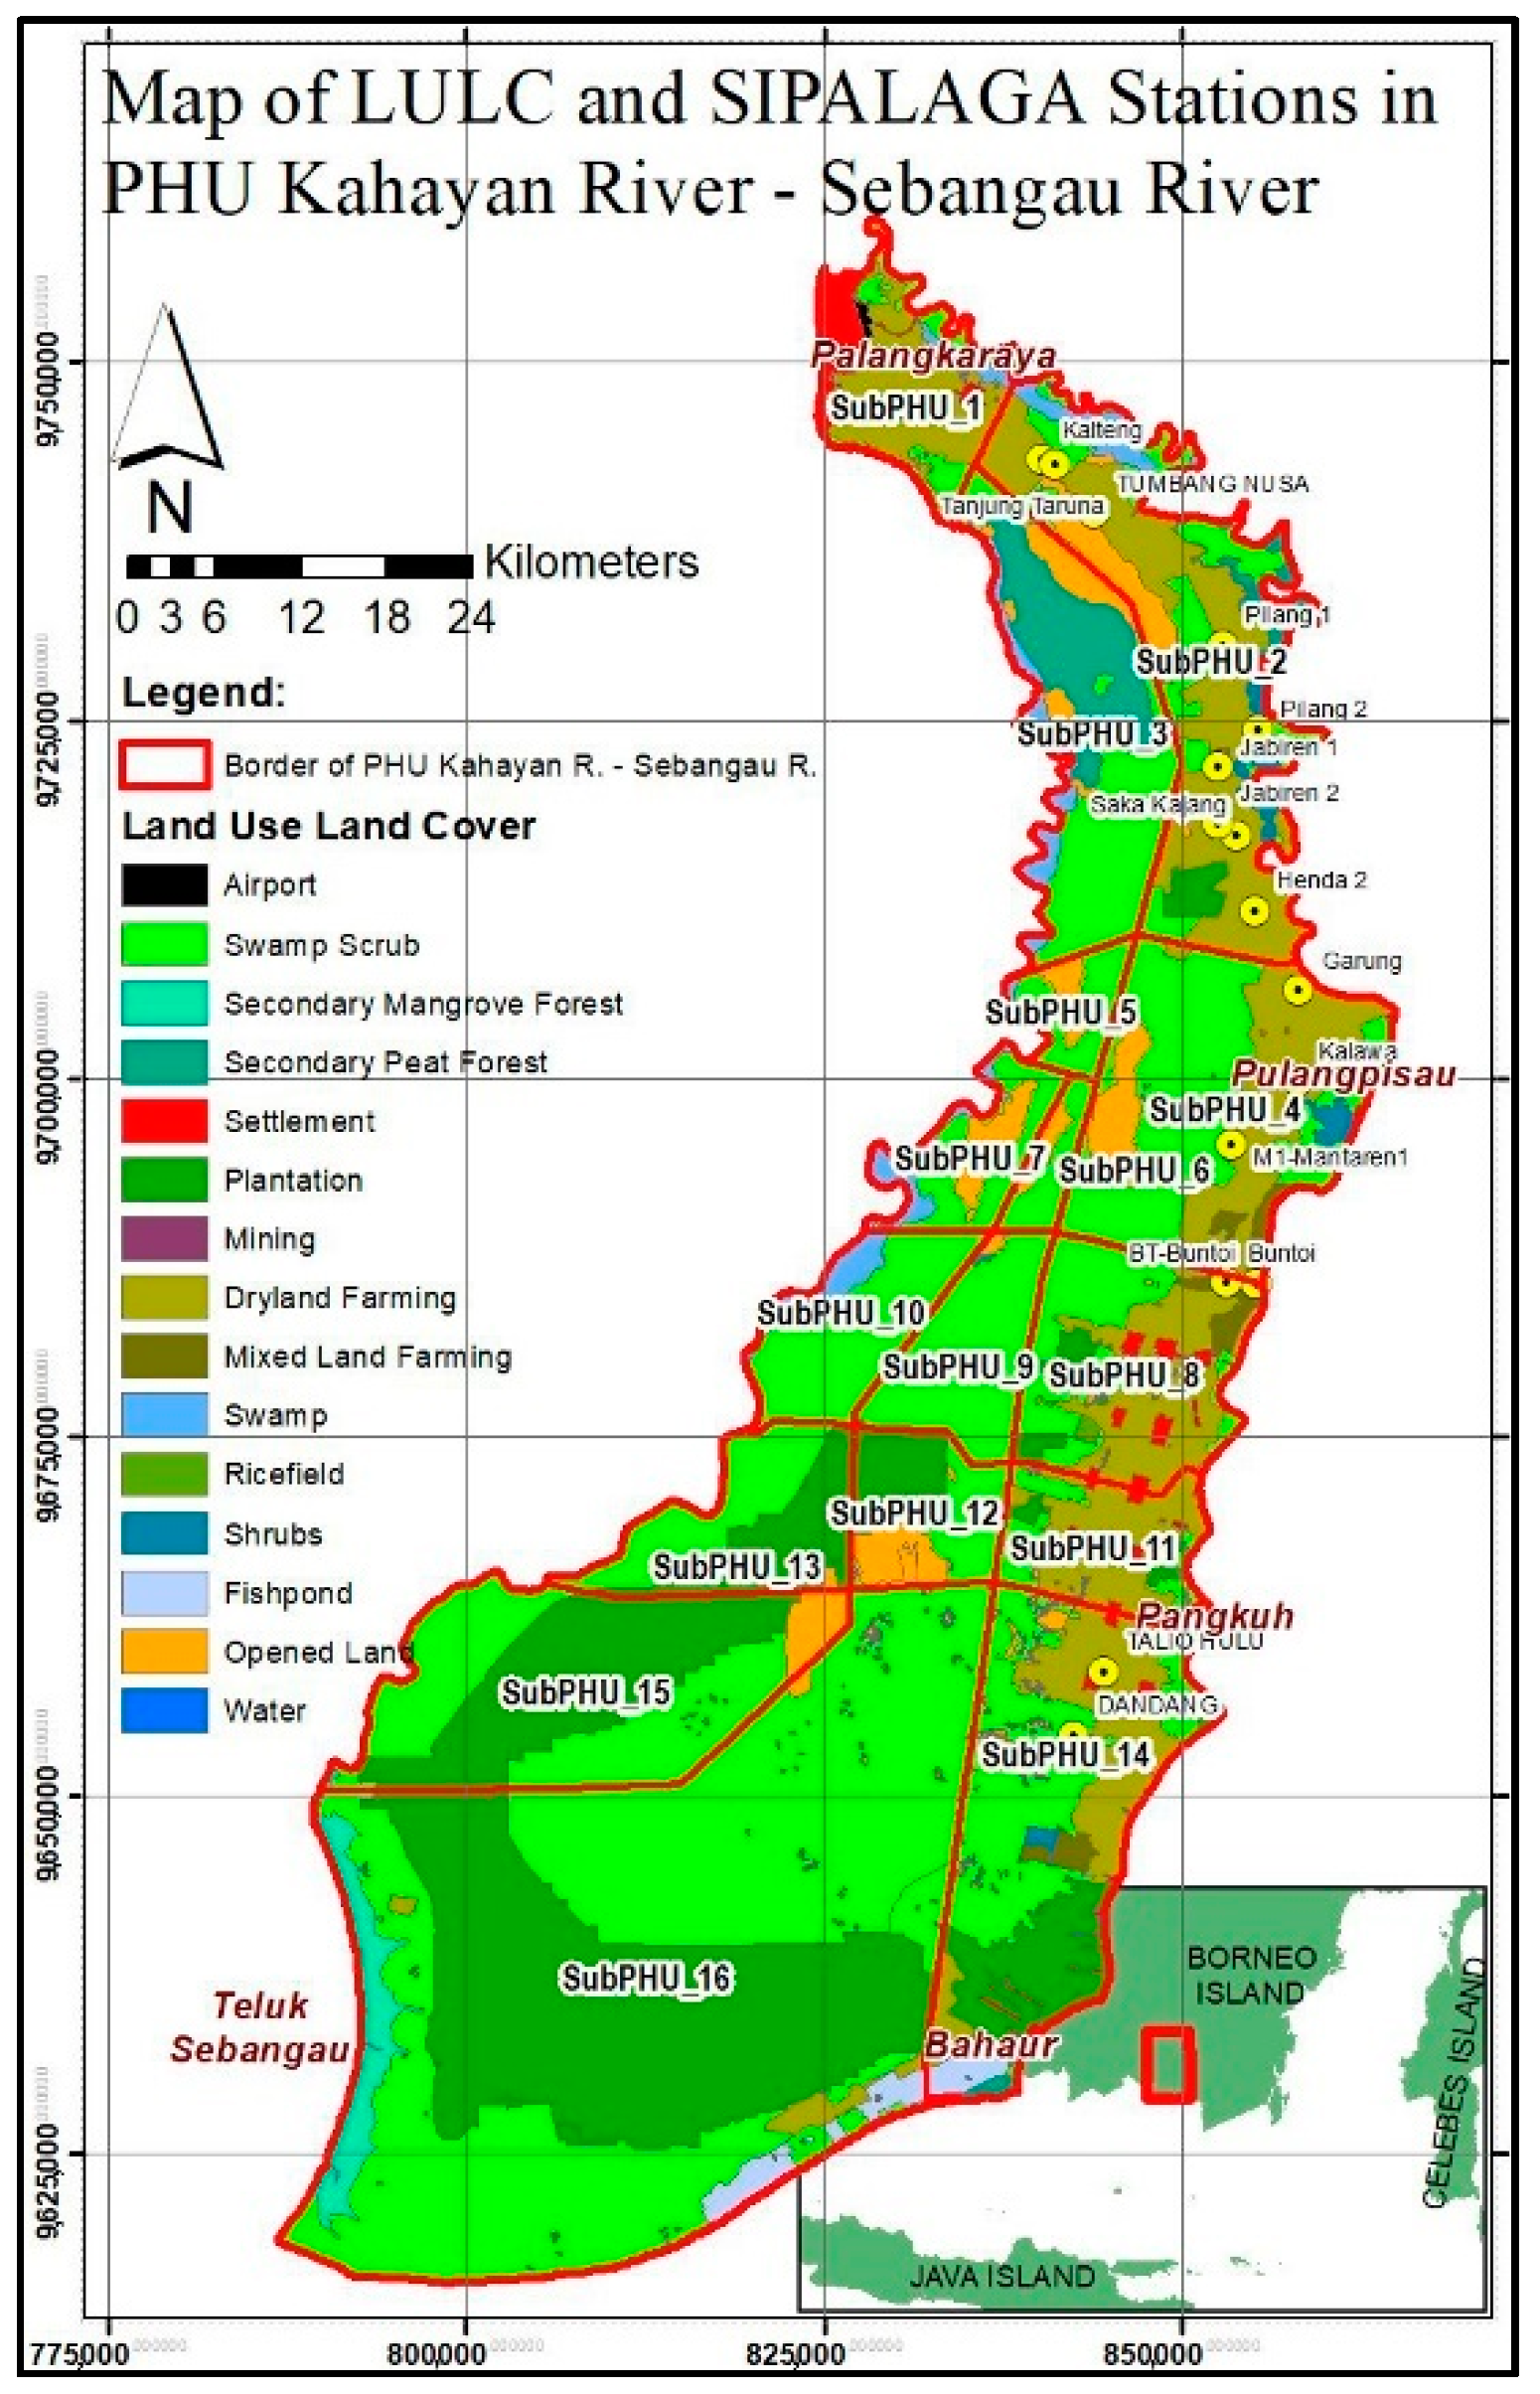
Figure 1. Overview of topographic condition on the Peat Hydrological Unit (PHU) area of Kahayan River–Sebangau River, complemented with channel networks and residential areas. The square red line shows the position of the PHU on the Borneo Island. (Data source: BRGM-RI).
Land 11 01094 g001
Figure 2. The pattern of surface water flow on peatland in the Kahayan–Sebangau PHU derived from DTM filtered from WorldDEM (left) and DTM filtered from LiDAR (right). (data source: BRGM-RI, and processed by the authors).
Land 11 01094 g002
Figure 3. The radial streamline pattern (black arrows) leading to the outlet canal in determining the boundaries of the sub-PHU, as well as the resulting sub-PHU boundaries (red lines) in the Kahayan–Sebangau PHU.
Land 11 01094 g003
Figure 4. Condition of the LULC of each sub-PHU and position of the Peatland Water Monitoring Systems (SIPALAGA) stations in the Kahayan–Sebangau PHU area (in UTM zone 49 S coordinate system). The red line shows the position of the PHU on the Borneo Island. (data source: BRGM-RI).
Land 11 01094 g004
Figure 5. An example of spatial water balance calculations (right), evapotranspiration conditions (center), and distribution of rainfall values (left) in the Kahayan–Sebangau PHU area in April 2020. (data source: TerraClimate using Google Earth Engine; processed by the authors).
Land 11 01094 g005
Figure 6. Conditions of rainfall, evapotranspiration, runoff, and water balance in Kahayan–Sebangau PHU in 2010–2020. (data source: TerraClimate using Google Earth Engine; processed by the authors).
Land 11 01094 g006
Figure 7. An example of CHIRPS rainfall data in 2020 in chart form (left) and the spatial rainfall distribution that occurred at Kahayan–Sebangau PHU (right) on 5 April 2020. (data source: CHIRPS using Google Earth Engine; processed by the authors).
Land 11 01094 g007
Figure 8. Calculation results and spatial distribution of the NDMI (top) and NDVI (bottom) in Kahayan–Sebangau PHU for 2014–2020 using Landsat-8 satellite images. (source: Landsat-8 using Google Earth Engine; processed by the authors).
Land 11 01094 g008
Figure 9. Tidal-affected area and distribution of hotspot in 2010–2020 (left), and the distribution of hotspot in 2018–2020 and position of channels (right) in Kahayan–Sebangau PHU (in UTM zone 49 S coordinate system). (Data source: FIRMS and BRGM-RI; processed by the authors).
Land 11 01094 g009
Figure 10. The map of peat depth (left) and the representation of peat soil thickness in cross-profiles (right) in the Kahayan–Sebangau PHU consider the topographic position of the soil surface (blue line) and mineral soil elevation (green). (data source: BRGM-RI; processed by the authors).
Land 11 01094 g010
Figure 11. The map of the sub-PHU degradation levels to determine the most prioritized areas (in UTM zone 49 S coordinate system).
Land 11 01094 g011
Table 1. Description of the LULC for each sub-PHU in Kahayan–Sebangau PHU.
Sub-PHULULCArea (Hectares)
Sub-PHU 1Settlements and opened agricultural areas (community planting areas) dominate the LULC.15,437.02
Sub-PHU 2It is dominated by open agricultural areas (rice fields), and some space is a natural peat swamp forest.39,436.73
Sub-PHU 3The LULC is dominated by the natural peat swamp forest and swampy shrubs.26,446.33
Sub-PHU 4The LULC in this sub-PHU is dominated by swamp scrub and opened agricultural areas (rice fields).37,063.99
Sub-PHU 5This sub-PHU is dominated by swamp scrub and opened agricultural areas (rice fields).5189.30
Sub-PHU 6The LULC in this sub-PHU is dominated by swamp scrub and opened agricultural areas (rice fields).3525.88
Sub-PHU 7This sub-PHU is also dominated by swamp scrub and opened agricultural areas (rice fields).9028.54
Sub-PHU 8Settlements and opened agricultural areas (community planting areas) dominate the LULC in this sub-PHU.22,929.31
Sub-PHU 9Almost all of this sub-PHU is covered by swamp shrubs.12,005.23
Sub-PHU 10Swamp shrub dominates the LULC in this sub-PHU. A swampy area can still be found near the Sebangau River.12,767.64
Sub-PHU 11It is dominated by open agricultural areas (rice fields) and residential areas.12,337.55
Sub-PHU 12The LULC in this sub-PHU is dominated by oil palm plantations concession, swamp shrubs, and opened areas.10,646.20
Sub-PHU 13This sub-PHU is dominated by oil palm plantation concessions and swamp scrub areas.15,474.93
Sub-PHU 14Residential areas, opened agricultural areas (rice fields), community planting areas, and swamp shrubs dominate the LULC.41,684.13
Sub-PHU 15This sub-PHU is dominated by oil palm plantation concessions, swamp scrub, and opened areas.38,023.98
Sub-PHU 16This sub-PHU is dominated by oil palm plantation concessions and swamp scrub areas.149,147.71
Table 2. Average values of monthly water balance calculations for the sub-PHUs (data source: TerraClimate using Google Earth Engine; processed by the authors).
The Average of Monthly Water Balance in 2010–2020 for Each Sub-PHU
in Kahayan–Sebangau PHU
Month-ly Avg.Deficit Months
JanFebMarAprMayJunJulAugSepOctNovDec
sub-PHU 165.7110.9109.993.834.717.1−32.5−35.0−6.5−1.874.8101.044.3448
sub-PHU 271.7111.6113.293.325.112.1−37.3−41.3−12.3−9.768.3103.241.4953
sub-PHU 398.7145.2148.7123.945.630.9−27.8−32.6−0.95.694.0132.863.6743
sub-PHU 484.6122.7118.793.015.311.5−41.3−43.9−16.2−15.164.2106.541.6656
sub-PHU 5108.1154.0152.2124.140.431.6−30.5−33.9−3.52.592.8136.064.4943
sub-PHU 6115.5159.6154.7125.338.832.0−31.0−34.0−5.20.491.0137.665.3945
sub-PHU 7112.5158.4153.6124.640.232.3−30.3−34.3−5.50.489.9134.864.7246
sub-PHU 894.7130.5118.992.813.29.4−41.9−44.6−17.9−15.164.7108.942.8157
sub-PHU 9123.2164.6153.2124.437.929.6−31.3−35.2−7.1−2.290.7139.165.5747
sub-PHU 10119.3163.9151.9123.441.231.3−30.0−34.7−7.4−1.489.7135.765.2448
sub-PHU 11100.2134.7117.991.711.17.3−42.5−45.6−19.5−16.364.3111.142.8957
sub-PHU 1298.4134.6116.891.316.911.9−39.9−44.3−19.7−16.064.6109.643.6957
sub-PHU 1395.3134.5114.189.621.314.4−38.2−43.9−20.3−16.163.7105.643.3352
sub-PHU 14107.5139.3114.286.46.35.9−43.2−47.0−20.9−16.665.7118.843.0358
sub-PHU 1598.6137.8109.986.124.015.2−35.5−43.0−20.5−13.464.2109.044.3652
sub-PHU 16105.8138.4107.281.916.912.6−36.9−45.1−21.3−13.465.8116.143.9957
Table 3. Average longest dry period within each month (where precipitation = 0 mm/day) for each sub-PHU in 2010–2020 (data source: CHIRPS using Google Earth Engine; processed by the authors).
The Average of Monthly Consecutive Dry Periods in 2010–2020 for Each Sub-PHU
in Kahayan–Sebangau PHU
Monthly Average (Days)Extreme Dry Days (Days)
JanFebMarAprMayJunJulAugSepOctNovDec
sub-PHU 12.092.821.912.453.557.008.649.827.643.092.451.364.4023
sub-PHU 22.002.271.641.913.556.458.098.277.642.821.911.363.9923
sub-PHU 31.912.451.732.093.916.828.279.368.093.272.271.364.3023
sub-PHU 41.732.271.641.913.558.099.5511.649.822.912.271.454.7320
sub-PHU 51.912.272.002.553.828.189.5510.459.823.642.551.554.8625
sub-PHU 62.182.822.002.093.918.369.1811.5510.183.452.361.644.9822
sub-PHU 71.822.641.642.003.648.098.8211.0910.453.272.271.364.7624
sub-PHU 81.822.271.552.183.737.368.6410.457.913.182.181.554.4018
sub-PHU 91.642.271.362.004.007.369.5510.648.553.182.361.454.5322
sub-PHU 101.732.001.361.913.917.458.8211.738.273.552.181.364.5221
sub-PHU 111.362.091.732.273.738.368.7311.278.183.362.181.734.5819
sub-PHU 121.732.731.552.003.648.369.0910.457.913.362.001.454.5219
sub-PHU 131.822.361.551.553.367.919.0910.737.643.642.271.554.4519
sub-PHU 141.551.361.641.914.367.277.7310.188.183.272.001.184.2219
sub-PHU 151.642.451.642.094.278.009.459.457.913.452.181.644.5219
sub-PHU 161.451.731.911.914.008.277.6410.369.553.452.001.274.4624
Table 4. Calculation result of average NDMI and NDVI values for each sub-PHU in 2010–2020 (data source: Landsat-8 using Google Earth Engine; processed by the authors).
Average Value of NDMI (Moisture)
per Sub-PHU
Average NDMIAverage Value of NDVI (Vegetation)
per Sub-PHU
Average NDVI
20142015201620172018201920202014201520162017201820192020
sub-PHU 10.3110.2570.2900.3080.2830.3210.2650.2910.5330.5650.5300.5000.6120.5490.4680.537
sub-PHU 20.3770.3640.3410.3490.3610.3650.2650.3460.5520.6480.6470.6210.7030.5800.6720.632
sub-PHU 30.4260.4280.4210.3760.4420.3960.3900.4110.5490.6410.6370.5110.7090.5240.6750.607
sub-PHU 40.4280.4310.3510.3730.3850.3850.4780.4040.6230.6170.6630.6870.6680.6230.7270.658
sub-PHU 50.4440.3840.3380.3240.3650.3930.4220.3810.6530.5290.5850.5710.6330.5830.7030.608
sub-PHU 60.4560.4200.3240.3200.3760.3910.4570.3920.7000.5490.6000.5970.6650.6440.7180.639
sub-PHU 70.4410.3990.3250.3400.3760.4120.4290.3890.6870.4890.6010.5810.6500.6890.6940.627
sub-PHU 80.3780.3760.3270.3280.3460.3560.4300.3630.6970.5860.7030.6580.6930.7020.7150.679
sub-PHU 90.5000.4350.4190.3670.4300.4520.3500.4220.7320.5290.7130.5530.6930.7310.7450.671
sub-PHU 100.4380.4020.2690.3310.3800.4060.4840.3870.7110.5110.6020.5560.7100.7360.7390.652
sub-PHU 110.3600.3360.3190.3150.3160.3390.4390.3460.6850.5530.6730.6320.6400.6930.6690.649
sub-PHU 120.4120.3910.4000.3780.4090.4110.4000.4000.7250.5890.7360.6180.6930.7410.7150.688
sub-PHU 130.3980.4040.3430.3710.3870.4080.4150.3890.6900.6340.6780.6160.6800.7370.7070.677
sub-PHU 140.3950.3890.3740.3770.3950.4050.3780.3870.6800.5800.6880.6430.6680.6950.6820.662
sub-PHU 150.3440.3270.3430.3400.3320.3460.3600.3420.6080.6060.6740.6350.6260.6190.5920.623
sub-PHU 160.3810.3340.3810.3580.3760.3710.3910.3700.6220.4880.6240.6320.6590.5700.6360.604
Table 5. The tidal observational data results (from Bahaur, Pangkuh, and Talio stations) and the estimated values of the highest water levels (HWS and HAT). (data source: BRGM-RI; processed by the authors).
Tide ConstituentsAmplitude (cm) of Each Constituent
BahaurPangkuhTalio
M226.431.915.3
S24.54.01.5
N25.36.53.1
K21.31.20.4
K169.063.847.8
O135.239.025.3
P121.119.514.6
M40.52.01.0
MS42.12.20.7
Type of tidal oscillationDiurnal Tides
Highest Astronomical Tide165.4170.1109.8
Highest Water Spring135.1138.789.9
Table 6. The number of yearly fires incidents for each sub-PHU in 2010–2020 (data source: FIRMS; processed by the authors).
Fire History (Number of Fires Events Per Year)Total Fires (2010–2020)Fires in the Last 3 Years
20102011201220132014201520162017201820192020
sub-PHU 108911263700142460351260
sub-PHU 2013107191954392021210898123
sub-PHU 303816184000101581
sub-PHU 41202612214240001860690186
sub-PHU 50010144700000620
sub-PHU 606021105000101151
sub-PHU 70101113200013014813
sub-PHU 8043913181980021230397125
sub-PHU 900114189000701127
sub-PHU 1000322012400010016810
sub-PHU 11016191733580033850261118
sub-PHU 12002718438600103580335161
sub-PHU 130016026700222010924
sub-PHU 1409288141002882610546601161571
sub-PHU 150708938429501102500802260
sub-PHU 160422358108432103701329852113190820
Table 7. The calculation results of the area, the volume of peat soil, the average thickness of peat, the volume of peat water, and the rate of groundwater subsidence in Kahayan–Sebangau PHU.
Sub-PHUArea (Hectares)Volume (m3)Average of Peat Depth (m)Water Volume (m3)ET (mm/Day)Water Loss Rate (mm/Day)Water Loss (%)Water Loss in 14 Days (cm)Water Loss in 21 Days (cm)
sub-PHU 1153,858,240355,378,8292.310213,227,2973.523−21.918−1.7−30.685−46.028
sub-PHU 2392,962,1761,078,284,9512.744646,970,9713.525−21.918−1.4−30.685−46.028
sub-PHU 3263,587,5361,279,229,3654.8531,023,383,4923.519−17.191−0.5−24.068−36.102
sub-PHU 4369,821,6641,132,159,5823.061905,727,6663.500−17.191−0.7−24.068−36.102
sub-PHU 551,628,176207,497,4434.019165,997,9543.490−17.191−0.6−24.068−36.102
sub-PHU 635,031,888189,227,2175.402151,381,7743.504−17.191−0.4−24.068−36.102
sub-PHU 789,852,112308,887,6973.438247,110,1573.507−17.191−0.6−24.068−36.102
sub-PHU 8228,735,936553,301,9342.419331,981,1613.515−16.350−1.1−22.890−34.335
sub-PHU 9119,679,408673,079,4405.624538,463,5523.507−17.191−0.4−24.068−36.102
sub-PHU 10127,321,344460,624,0083.618368,499,2063.506−17.191−0.6−24.068−36.102
sub-PHU 11122,975,280197,477,4081.606118,486,4453.521−16.350−1.7−22.890−34.335
sub-PHU 12106,197,408561,840,7675.291337,104,4603.513−21.918−0.7−30.685−46.028
sub-PHU 13154,393,632354,202,5662.294212,521,5403.515−21.918−1.7−30.685−46.028
sub-PHU 14415,991,664428,869,8671.031257,321,9203.535−16.350−2.7−22.890−34.335
sub-PHU 15379,892,592946,521,3442.492567,912,8073.522−21.918−1.6−30.685−46.028
sub-PHU 161,491,227,8562,955,405,2121.9821,773,243,1273.518−21.918−2.0−30.685−46.028
the entire PHU4,503,156,91211,681,987,6303.2617,859,333,5293.514−18.806−1.2−26.329−39.493
Table 8. The rank of sub-PHUs based on 11 criteria to determine the most prioritized areas in the Kahayan–Sebangau PHU.
Rank Based on CriteriaWater
Balance
Deficit
Months
Dry Days
Average
Dry Days
Extreme
NDMINDVIRecurrent
Fires
Fires Last 3 YearsAverage Peat DepthWater LossTotal ScoreRank
sub-PHU 18641116161013121210814
sub-PHU 21610112131014991010411
sub-PHU 3613132146243542
sub-PHU 41511137361212879410
sub-PHU 552151610131154725
sub-PHU 623169594321543
sub-PHU 74414146115675768
sub-PHU 81412511221110119879
sub-PHU 9151110143412421
sub-PHU 103788877566654
sub-PHU 11131312214888151310612
sub-PHU 121014934191138726
sub-PHU 131186473271314757
sub-PHU 14121625951515161611115
sub-PHU 157910615121314101110713
sub-PHU 1691571511151616141513316
Publisher’s Note: MDPI stays neutral with regard to jurisdictional claims in published maps and institutional affiliations.

