Article

Human Activity Intensity and Its Spatial-Temporal Evolution in China’s Border Areas

1
Key Laboratory of Regional Sustainable Development Modeling, Institute of Geographic Sciences and Natural Resources Research, Chinese Academy of Sciences, Beijing 100101, China
2
College of Resources and Environment, University of Chinese Academy of Sciences, Beijing 100049, China
3
Laboratory of Geographic Information and Spatial Analysis, Department of Geography and Planning, Queen’s University, Kingston, ON K7L 3N6, Canada
*
Author to whom correspondence should be addressed.
Land 2022, 11(7), 1089; https://doi.org/10.3390/land11071089
Submission received: 29 June 2022 / Revised: 13 July 2022 / Accepted: 14 July 2022 / Published: 15 July 2022

Abstract

:
Monitoring human activities in border areas is challenging due to the complex geographical environment and diverse people. China has the longest terrestrial boundary and the highest number of neighboring countries in the world. In this study, a human activity intensity index (HAI) was proposed based on land cover, population density, and satellite-based nighttime light for a long-term macroscopic study. The HAI was calculated at 1 km resolution within the 50 km buffer zone of China’s land boundary on each side in 1992, 2000, 2010, and 2020, respectively. Results show that human activity is low in about 90% of the study area. Overall, the HAI on the Chinese side is higher than that on the neighboring side, and the intensity of land use on the Chinese side has increased significantly from 1992 to 2020. Among China’s neighbors, India has the highest HAI with the fastest growth. With the changes in the HAI between China and its neighboring countries, four regional evolution patterns are found in the study area: Sino-Russian HAI decline; Sino-Kazakhstan HAI unilateral growth; Indian HAI continuous growth; China and Indochina HAI synchronized growth. Hotspot analysis reveals three spatial evolution patterns, which are unilateral expansion, bilateral expansion, and cross-border fusion. Both the “border effect” and “agglomeration effect” exist in border areas. The HAI changes in border areas not only impact the eco-environment but also affect geopolitics and geoeconomics. The HAI can be used as an instrument for decision-making and cooperation between China and neighboring countries in such areas as ecological protection, border security, and border trade.

1. Introduction

Human activities are disrupting biogeochemical cycles at an unprecedented scale and intensity, with profound and drastic impacts on terrestrial ecosystems [1,2]. The science on human contributions to global warming is quite clear. Human emissions and activities also pose extremely high risks to planetary boundaries, such as biosphere integrity, nitrogen and phosphorus cycles, and land systems, and are becoming a major factor driving global environmental change [3,4]. The proposed United Nations 2030 Agenda and the Sustainable Development Goals (SDGs) aim to reduce the impact of human activities on the ecosystem and improve human well-being [5]. Therefore, human activity mapping is crucial for understanding humanity’s role in shaping Earth’s patterns and processes [6]. In addition, understanding the spatial-temporal evolution of human activity intensity on a fine scale is critical to infrastructure and local governance [7,8].
Border areas, as frontiers of geo-cooperation and geo-conflict, are experiencing rapid and extensive changes in human activity [9]. Approximately one-fifth of global WorldPop-based population growth has occurred in the borderlands since the 1990s, leading to more than one-third of forest loss, as estimated by the European Space Agency Climate Change Initiative [9]. Globally, more than half of all terrestrial birds, mammals, and amphibians cross international borders. In addition to being threatened by deforestation and hunting, these species may be harmed by border infrastructure building and lack of conversation activity coordination on both sides of the border [10]. Spatially, human activities in border areas have mainly occurred at ports and cities. Border ports are international transportation hubs and transit points for passengers and freight, and border cities are the main areas for residents to settle and forge a national cultural identity. Under the integrated development of bilateral border cities, a spatial pattern called Twin Cities has been formed [11]. As a result of geopolitics, border trade, ethnic integration, and other factors, the global border areas present complex and diverse forms of human activities. Moreover, there has been a long-standing security dilemma in disputed border areas, and the increase in human activities on both sides of a border may be for military or political purposes. Therefore, due to their complex interweaving of elements, human activities in border areas require in-depth analysis.
Research related to human activities, including the human footprint [6,12], human pressure [13,14], environmental footprint [15], and anthropogenic disturbances [16,17], reveals human impact on natural environments from different perspectives. Quantitative assessments of human activities are mainly based on global and regional scales, using indicators such as population density, land transformation, human accessibility, infrastructure, and grazing density [18]. For example, Williams et al. mapped the human footprint on the global land surface and found that 1.9 million square kilometers of relatively undisturbed land have been changed significantly from 2000 to 2013 [6]. Venter et al. used infrastructure, land cover, and human accessibility to measure the cumulative human footprint on the Earth’s surface from 1993 to 2009 and found that human footprint growth is much lower than population and economic growth [19]. However, global-scale datasets are not suitable for regional analysis. Many studies have been conducted to measure the human footprint at the regional or city scale with a modified method and local data [20]. However, there are few quantitative measures of human activities in border areas.
Currently, border research mainly concentrates on the micro-scale and single activities, including infrastructure and building [21,22], border trade and cooperation [23], agriculture and animal husbandry practice [24], cross-border population migration [25], and armed conflict [26]. Most studies focus on border activities’ impacts on ecosystems and biodiversity but pay less attention to the overall pattern of human activities. Macro-scale patterning of human activity characteristics in border areas is ignored. At the same time, the existing global-scale human activity datasets cannot be used for border research because of problems such as low resolution, short research periods, and inconsistent statistical calibers on both sides of the border. In general, there is a lack of long-term studies on human activity in border areas around the world.
China’s border areas are representative due to the country’s 22,800 km long terrestrial boundary—the longest in the world—with 14 contiguous countries, more than any other in the world. China’s border areas are unstable, accompanied by local conflicts and the intertwined forces of major powers. In recent years, Sino–Indian border disputes and the construction of “Belt and Road” cross-border economic corridors have attracted increasing attention [27,28,29,30]. Since China’s border areas fully opened up in 1992, the government has increased support for border development through a series of preferential policies for cross-border cooperation, which have resulted in rapid agriculturalization, urbanization, and industrialization in some border areas. The border areas have played a key role in the “Belt and Road” initiative, especially the construction of six cross-border economic corridors [31]. As a result of the “Belt and Road” initiative, COVID-19, and local military conflicts, China’s border area has entered a period of rapid adjustment.
Currently, research on China’s border area mainly focuses on specific activities such as land use change [32,33] and cross-border infrastructure [28,34], as well as dynamic activities such as cross-border trade [35,36,37] and cross-border population flows [38,39]. For example, changes in vegetation greenness in China’s border areas were analyzed by Wang et al. in 2017 [40]. They found that an increasing trend in vegetation greenness occurred on China’s side along the border with North Korea and South Asian countries. In 2016, Liu et al. analyzed the temporal and spatial changes in land use and land cover in Luang Namtha Province, Laos, from 1990 to 2010 [41]. Song et al. recorded the recent transformation of Ruili from a “small” and “ordinary” border city to a hub for China–Myanmar cooperation since the beginning of the “Belt and Road” initiative [42]. Nevertheless, these studies are mainly based on regional levels, such as the Himalayan region and the southwestern border areas of China, from sources such as census data and questionnaires. In addition, there are very few studies on the temporal and spatial evolution of human activities in the areas on both sides of China’s border on a fine scale.
This paper aims to quantitatively characterize and summarize the pattern of human activities in China’s border areas. To undertake this research, we proposed a human activity intensity index (HAI) to conduct a long-term macroscopic study of the HAI at 1 km resolution within the 50 km buffer zone of China’s land boundary on each side from 1992 to 2020. The HAI was constructed based on three datasets: land cover, population density, and satellite-based nighttime lights. The characteristics of HAI changes in the entire border areas were analyzed country-by-country and region-by-region. According to the distribution of the HAI, the hotspots were then identified, and three temporal and spatial evolution patterns of high HAI regions were found. Based on our results, we discuss the ecological, geopolitical, and geoeconomic impacts of the HAI in border areas.

2. Data and Methodology
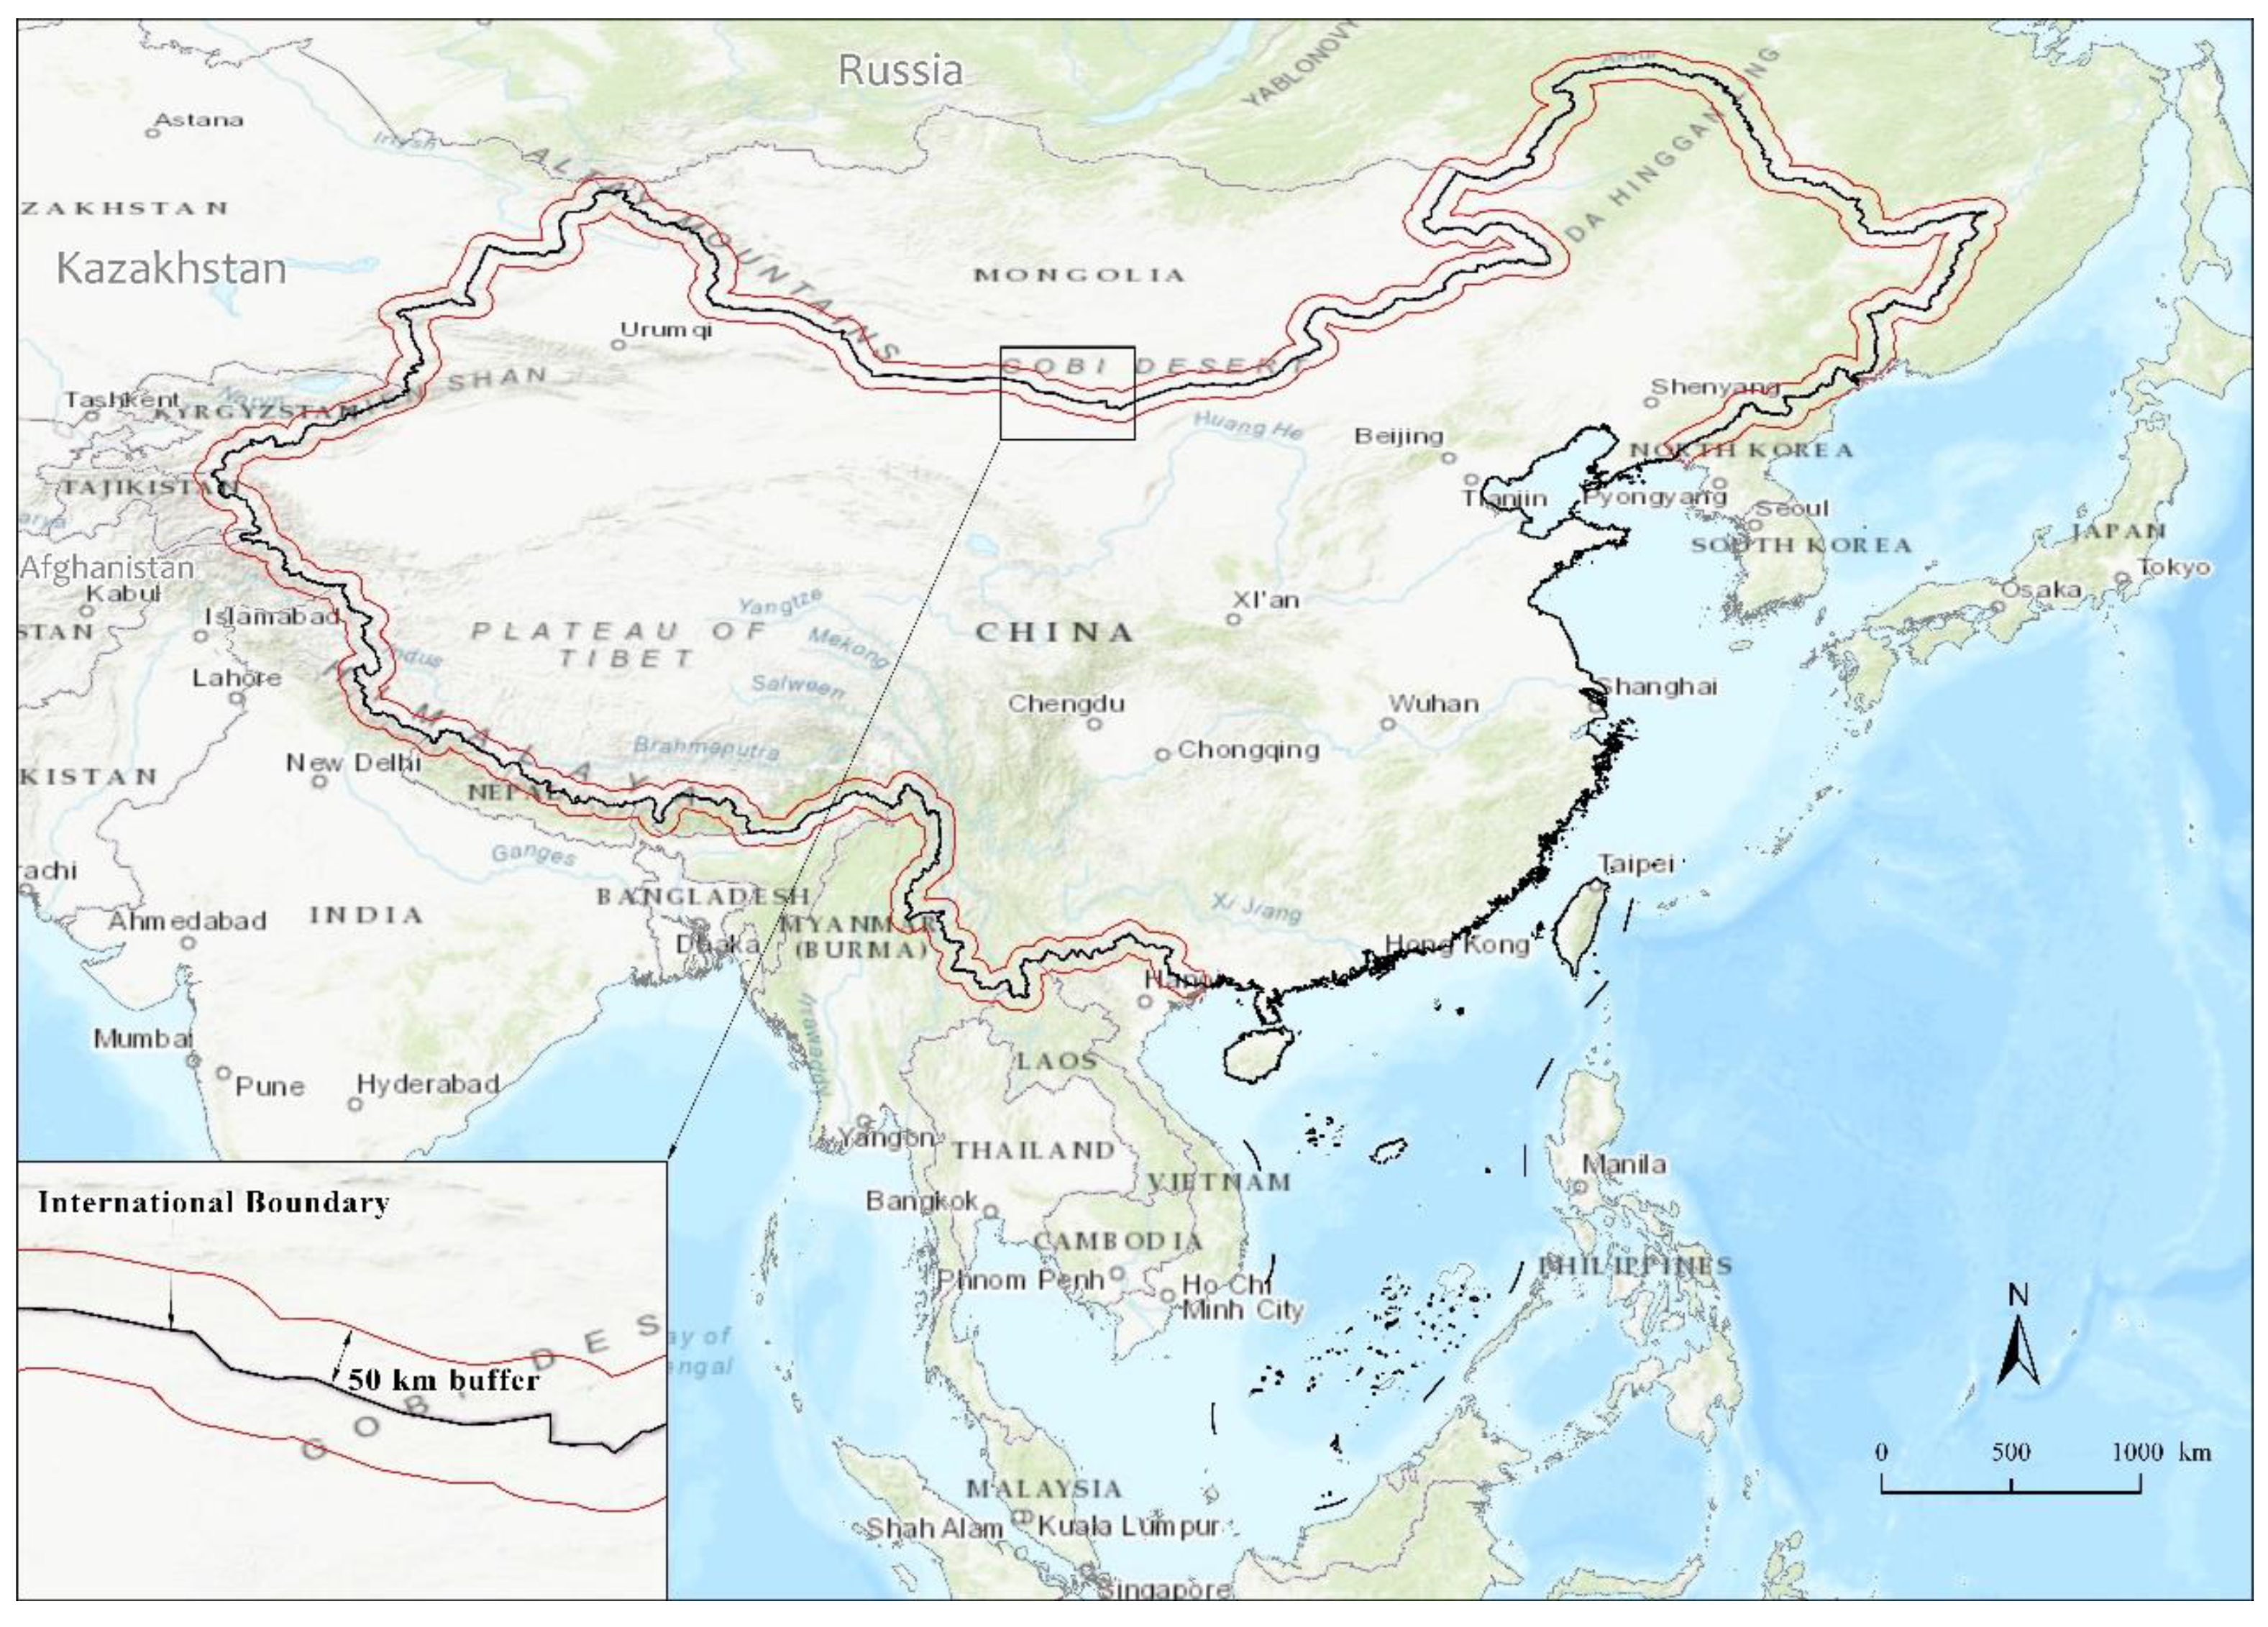
2.1. Study Area

Generally speaking, the range of about 50 km from the international boundary has obvious border characteristics [43]. In this study, a buffer zone of 50 km around China’s land boundary is used as the study area (Figure 1), which is identified as China’s border area in this paper. China’s terrestrial boundary is 22,000 km long, from the estuary of the Yalu River in the east to the estuary of Fangchenggang in Guangxi. The study area is 1,642,600 square kilometers, with diverse landform types such as virgin forests, deserts, and alpine plateau. China did not fully open its border until 1992, which is why this study started at that point. Based on data availability, the time interval was about every 10 years, and 4 years, 1992, 2000, 2010, and 2020, were selected for long-term data analysis.

2.2. Data Sources and Preprocessing

2.2.1. Land Cover

Land cover change is an important manifestation of human activities, and landscape changes represented by agricultural expansion and forest degradation have become dynamic features of land use in border areas [9]. The land cover data comes from the global land cover database from 1992 to 2020 produced by the European Space Agency (https://cds.climate.copernicus.eu/, accessed on 1 May 2022), with a horizontal resolution of 300 m. We resampled it to 1 km resolution by Majority Rule. This dataset classified the land surface into 22 types using the United Nations Food and Agriculture Organization’s (UN FAO) Land Cover Classification System (LCCS). Each land type was scored based on the degree of human activity [44,45,46]. Based on the method of Sanderson et al. [18], we assigned a score for each layer ranging from 0 (no human activity) to 10 (maximum human activity) (Table 1). Among them, settlement was most affected by human activities, with the highest score of 10, followed by agricultural land and grassland, with water having a lower score of 1. Other land cover types were unaffected by humans and were assigned a value of 0 (Table 1).

2.2.2. Population Density

The population density data were derived from the Socioeconomic Data and Applications Center, NASA. The population density data in 1992 was replaced with data from 1990 because it was lacking, using its Gridded Population of the World (GPW) data(v3) with 2.5 arcmin resolution. We resampled it to 1 km resolution (30 arc seconds). Population density data from 2000 to 2020 were adopted from UN World Population Prospects (WPP)-Adjusted Population Density (v4.10) with 1 km resolution. The normalization formula of population density of 1 km resolution is as follows:
Popunor(n,t) = (popu(n,t)/max(popu(n,t))) × 10
where Popunor(n,t) is the normalized population density of raster n for year t and ranges from 0 to 10, popu(n,t) is the population density of raster n for year t. popu(n′,t′) is the population density of any raster n′ for any year t′ in 1992, 2000, 2010, and 2020. Therefore, max (popu (n′,t′)) is the maximum raster value among these four years.

2.2.3. Nighttime Light
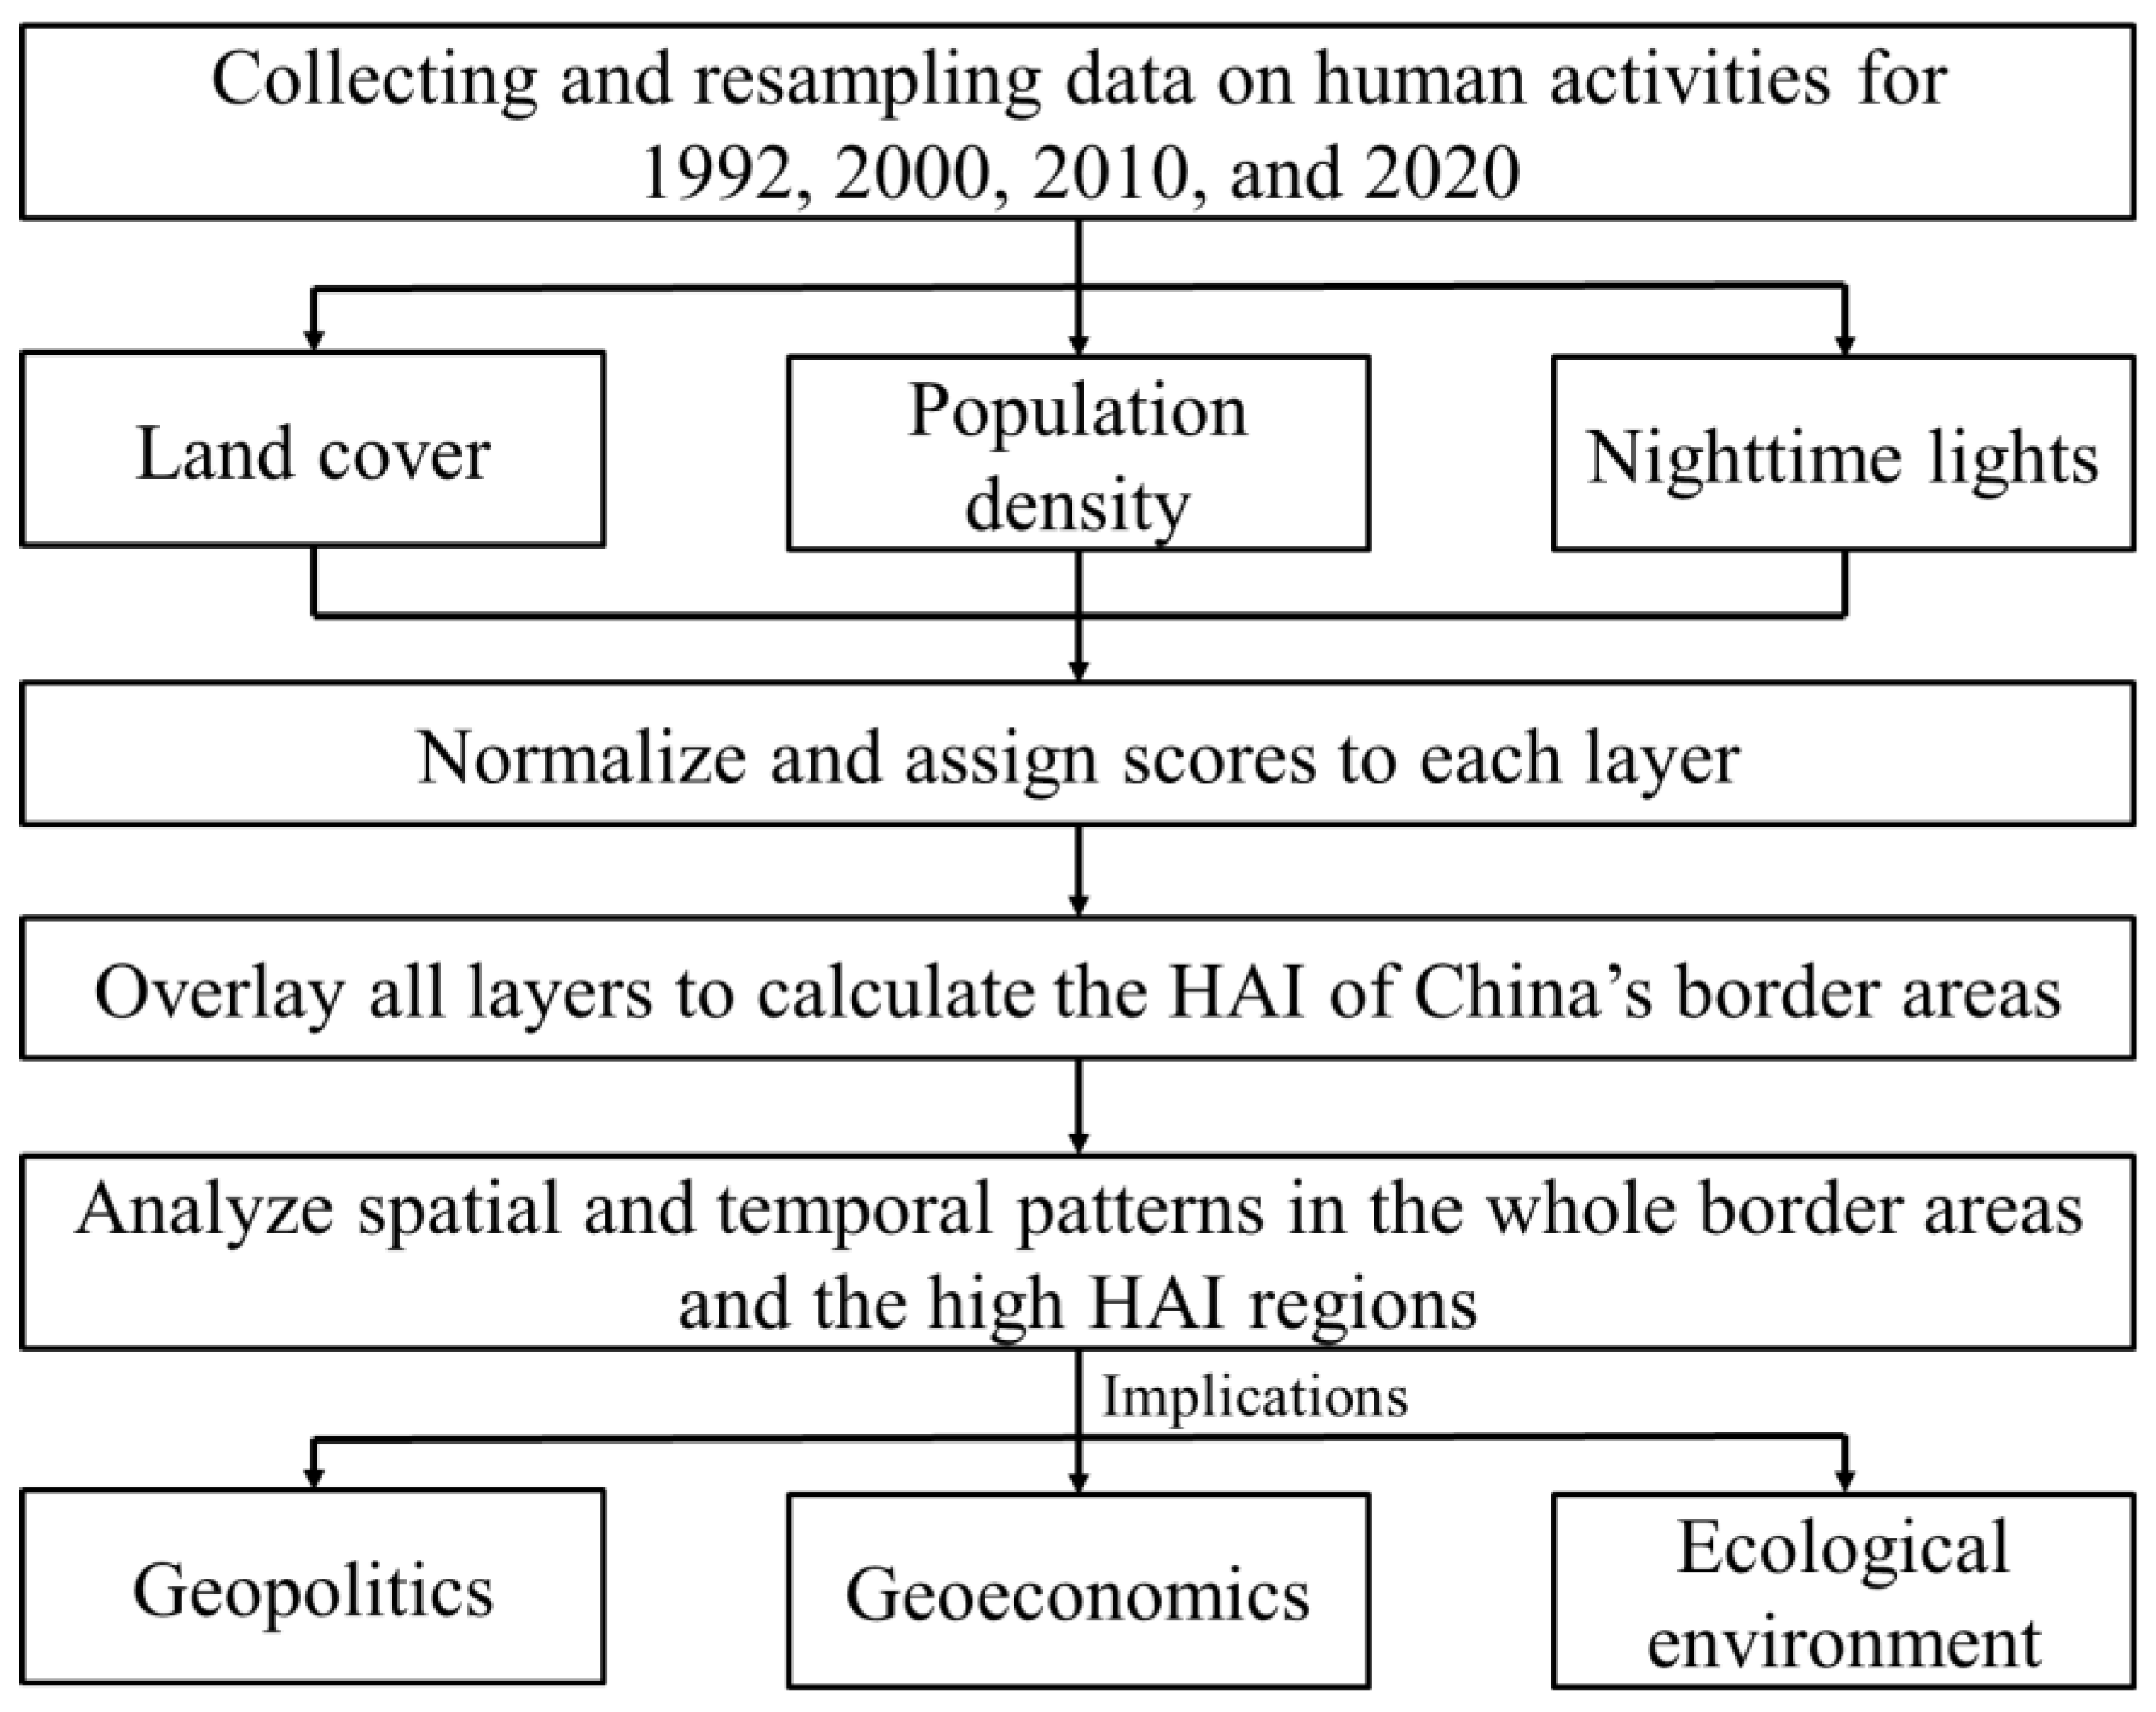
Nighttime light is often used to reflect differences in the spatial distribution of economic activities, urbanization, carbon emissions, infrastructure, and other factors [47,48,49]. The night light sensor carried by the satellite has a high photoelectric amplification ability, which can detect low-intensity light emitted by the city’s night lights, firelight, and even traffic flow. In this study, night light reflects the degree of social and economic development [50]. We adopted the global nighttime light intensity dataset processed by Li et al. [51], which harmonized DMSP and VIIRS nighttime light data from 1992 to 2018 on a global scale, including temporally calibrated DMSP-OLS NTL time series data from 1992 to 2013 and converted NTL time series from the VIIRS data (2014–2018). The dataset values range from 0 to 63 with a spatial resolution of 1 km. Nighttime light data in 2020 are replaced by 2018 data because of lacking. The normalization formula of nighttime light of 1 km resolution is as follow:
Lightnor(n,t) = (light(n,t)/max(light(n,t))) × 10
where Lightnor(n,t) is the normalized nighttime light intensity of raster n for year t and ranges from 0 to 10; and light (n,t) is the nighttime light intensity of raster n for year t. light(n′,t′) is the nighttime light intensity of any raster n′ for any year t′ in 1992, 2000, 2010, and 2020. Therefore, max (light (n′,t′)) is the maximum nighttime light value among these four years.

2.3. Methodology

Based on the existing literature and data availability, three datasets, land cover, population density, and nighttime lights, were selected to construct the HAI. Due to the grazing activities taking place on grasslands and built-up land, including all kinds of artificial infrastructure, there is no need to add grazing and infrastructure data. The processing flowchart for calculating HAI is illustrated in Figure 2. First, the three sets of data were checked to eliminate outliers, and all data were resampled to a resolution of 1 km × 1 km. Second, since they represented different kinds of data, population density and nighttime light data were standardized based on their maximum and minimum values (Equations (1) and (2)). The land cover was assigned scores based on the standard used in previous studies (Table 1). Third, the values of these three types of data were added and averaged to obtain the HAI. The formula is as follows.
HAI(n,t) = (Land(n,t) +Popunor(n,t) + Lightnor(n,t))/3
where HAI(n,t) is the human activity intensity of raster n for year t, ranging from 0 to 10; Land(n,t) is the score of land cover of raster n for year t; Popunor(n,t) is the standardized population density intensity value of raster n for year t; Lightnor(n,t) is the standardized nighttime light intensity value of raster n for year t.
Based on the calculated score, the HAI is divided into five categories by Geometric Interval: high, relatively high, relatively low, low, and very low, which shows relative degrees rather than absolute comparisons (Table 2). Then we analyzed spatial and temporal patterns in the whole border areas and some specific regions. Finally, the implications of the HAI for geopolitics, geoeconomics, and the ecological environment were discussed. We used ArcGIS 10.8 to generate the maps in the article.

3. Results

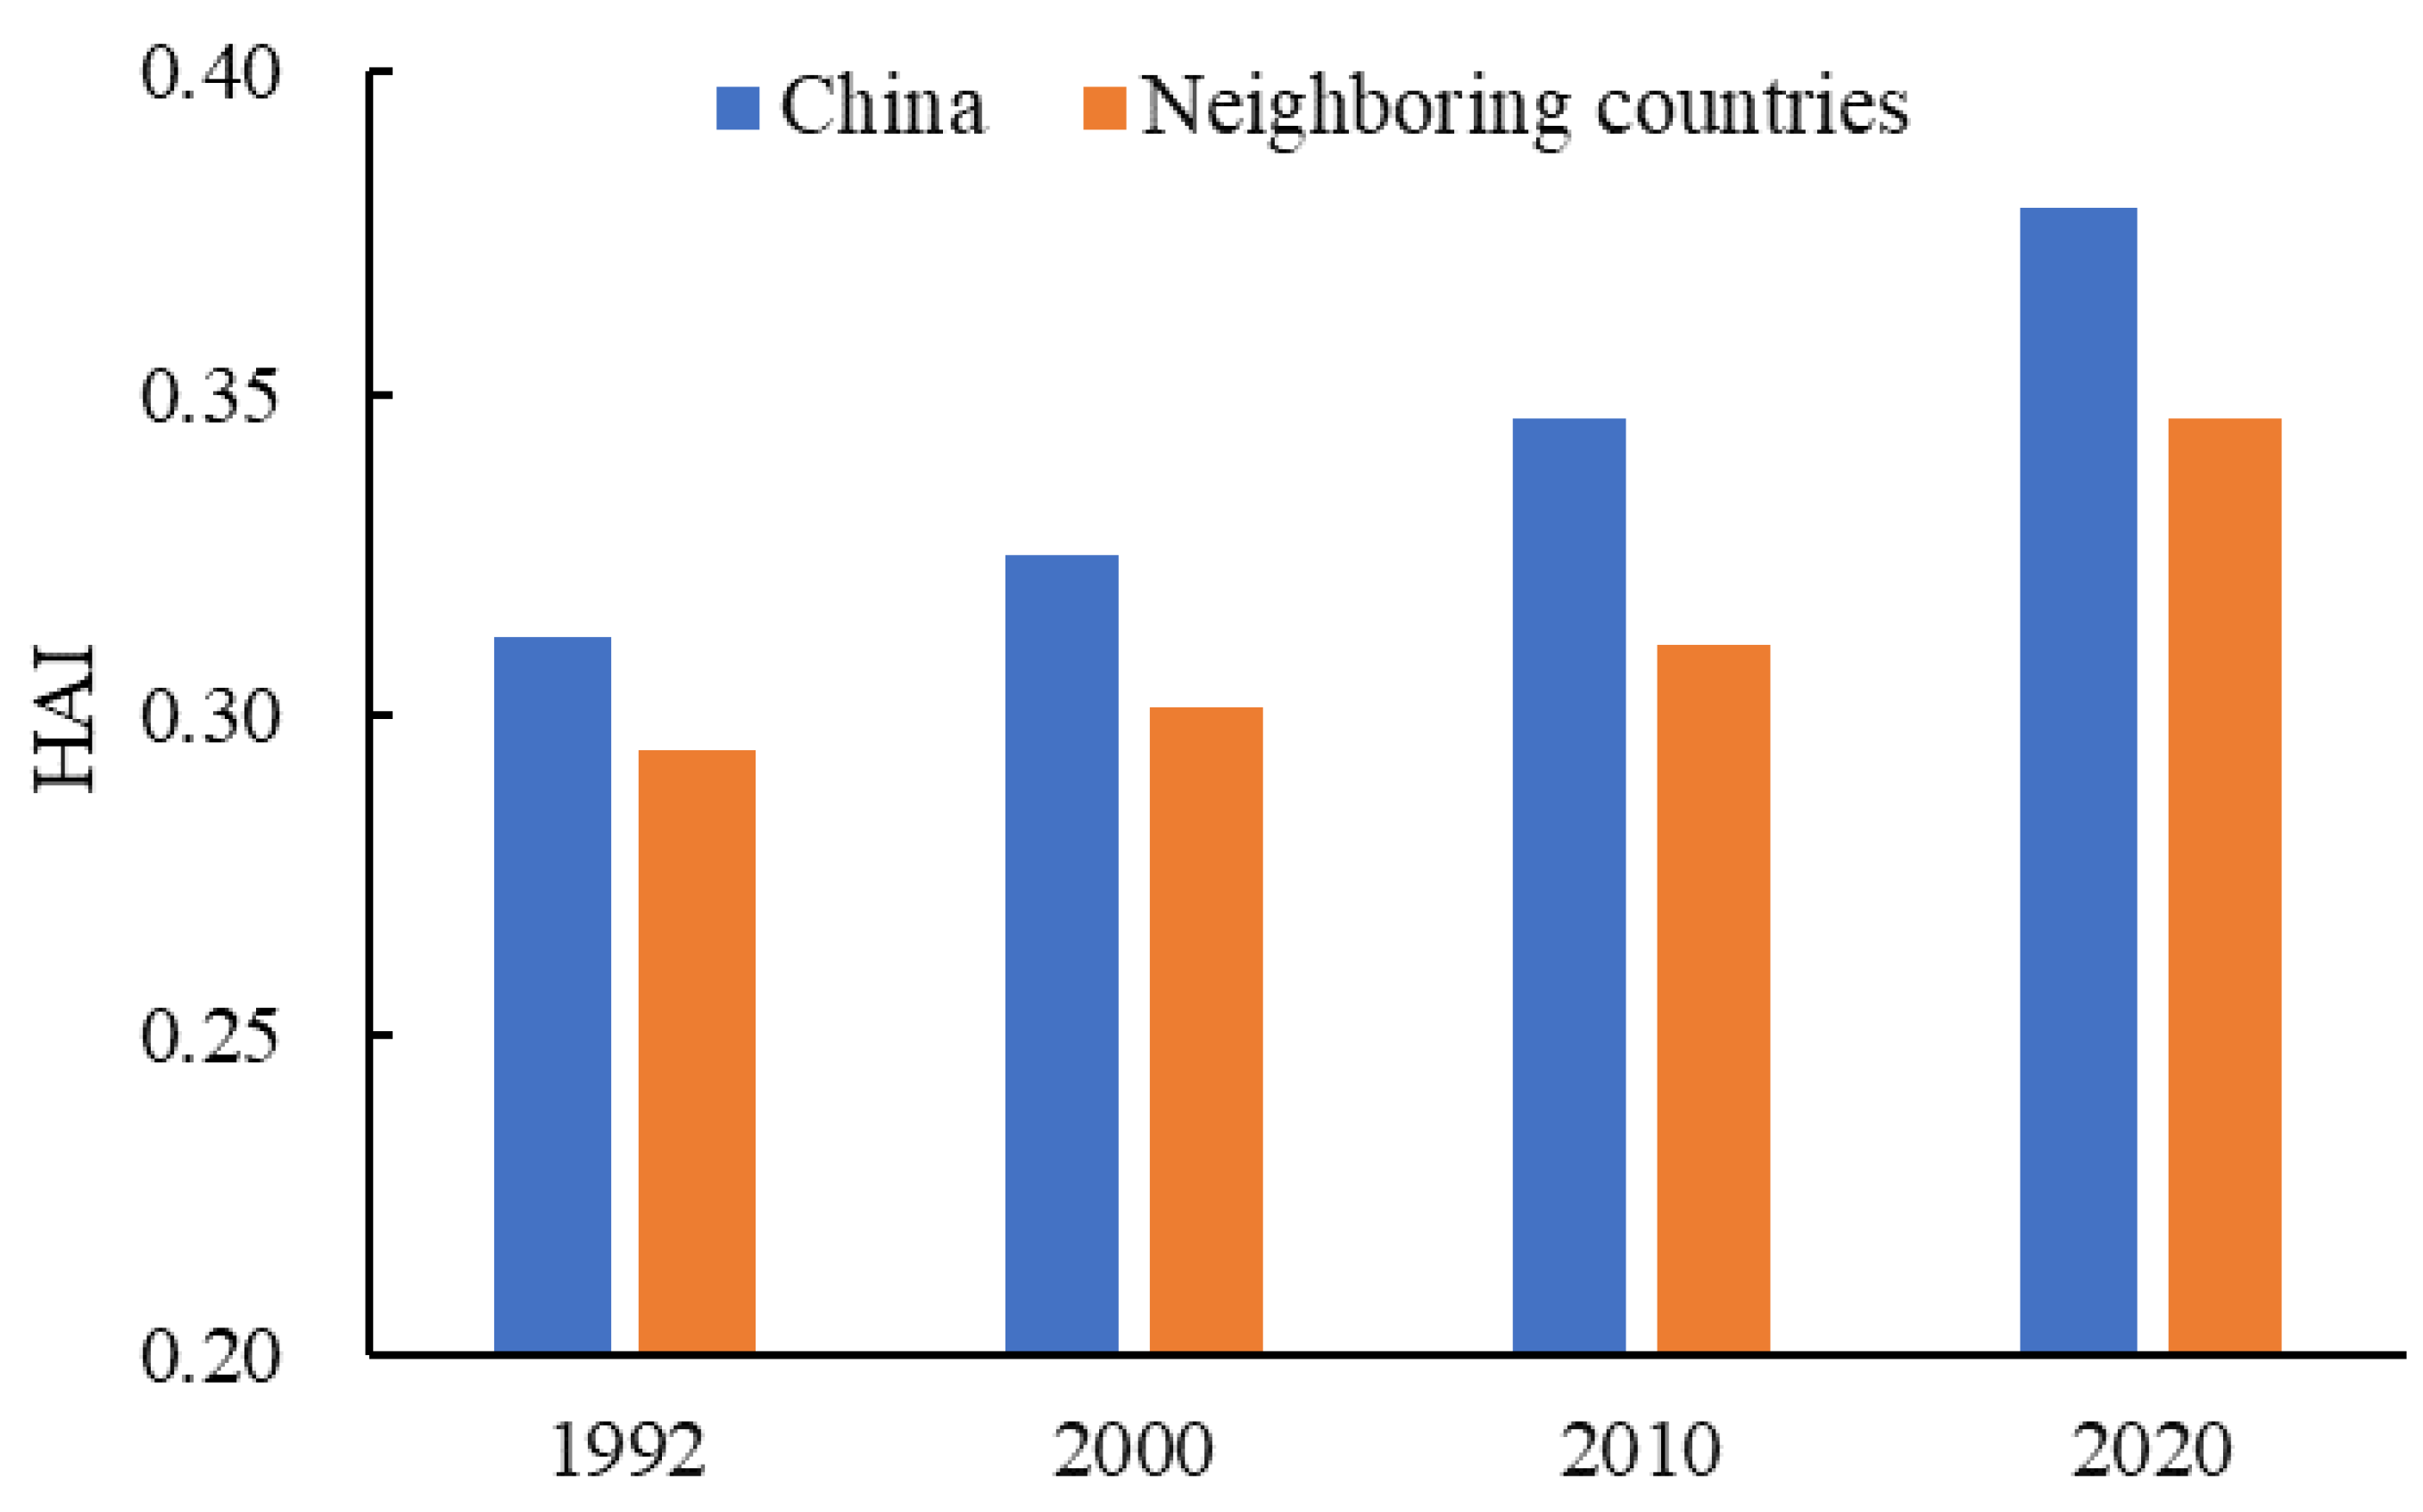
3.1. Evolution of HAI in the Whole Border Area

The mean HAI values on the Chinese side in 1992, 2000, 2010, and 2020 are 0.31, 0.32, 0.35, and 0.38, respectively (Figure 3). The minimum is 0, which is located in the virgin forest area of the Greater Khingan, Inner Mongolia desert Gobi area, Qinghai-Tibet Plateau, and Pamir Plateau area. The maximum is 9.97, located in the urban area of Yanji City in 2020. Another finding is that 93% of raster cells have HAI < 1, whereas the number of raster cells with HAI < HAImean account for 60%. This implies that the border area has a relatively low level of HAI from 1992 to 2020. Most of the buffer areas have high altitudes and high latitudes, and the natural conditions are relatively harsh, making them unsuitable for human activities. The mean HAI values on the neighboring side for 1992, 2000, 2010, and 2020 are 0.29, 0.3, 0.31, and 0.35, respectively (Figure 3), while the minimum is 0, which is located in the Mongolia desert Gobi area and Pamir Plateau area. The maximum is 6.78, which is located in the urban area of Khabarovsk City, Russia, in 2020. Here, 91% of raster cells have HAI < 1, implying that most border areas on the neighboring sides also have a relatively low HAI. Overall, the HAI on the Chinese side is higher than that on the neighboring side.
China’s border area has undergone a process of rapid land use transformation. China established free trade zones in 1992, such as the “Border Development and Opening Pilot Zone” and the “Border Economic Cooperation Zone”, resulting in rapid urbanization and industrialization. In 2001, China acceded to the World Trade Organization (WTO), which actively promoted economic globalization, accelerating development, and constructing border ports and cities serving import and export trade. In the 21st century, there have been 20 years of China’s economic take-off, including the rapid development of China’s border areas.
Figure 4 shows the mean HAI spatial distribution from 1992 to 2020. The HAIs of the China–Kazakhstan, China–India, and China–Russia border areas are relatively high. There are high HAI clusters with concentrated and contiguous regions due to fertile land, especially the Brahmaputra Valley Plain of India, located in the piedmont alluvial plain of the Qinghai-Tibet Plateau. Furthermore, India proposed the “Border Action Development Plan” in 2016, which promoted infrastructure construction in border areas and accelerated the settlement of border residents. The China–Kazakhstan border region presents local high HAI levels due to the good terrain conditions, mainly in the Ili River Valley. Since 2013, Kazakhstan has become a key transit area along two important border crossings with China: The Alashankou/Dostyk crossing and the Khorgos/Altynkol crossing [52]. International cooperation, such as through the “Belt and Road” initiative, accelerates the growth of the HAI in this region. The scattered border ports and cities with high HAI values include Heihe, Dandong, Yanji, Ruili, and Hekou in China, and Khabarovsk, Blagoveshchensk in Russia, Phuong in Vietnam, and Muse in Myanmar. The HAI is low in high latitude regions such as the China–Mongolia and China–Russia borders, where there are wildlife nature reserves. For example, the desert ecosystem in the Inner Mongolia Urad Haloxylon-Mongolia Wild Ass National Nature Reserve is extremely fragile. Shuanghe National Nature Reserve, one of the most desolate places in China’s north, is also cold all year round and is a protected fragile ecosystem due to being inconvenient for transportation.

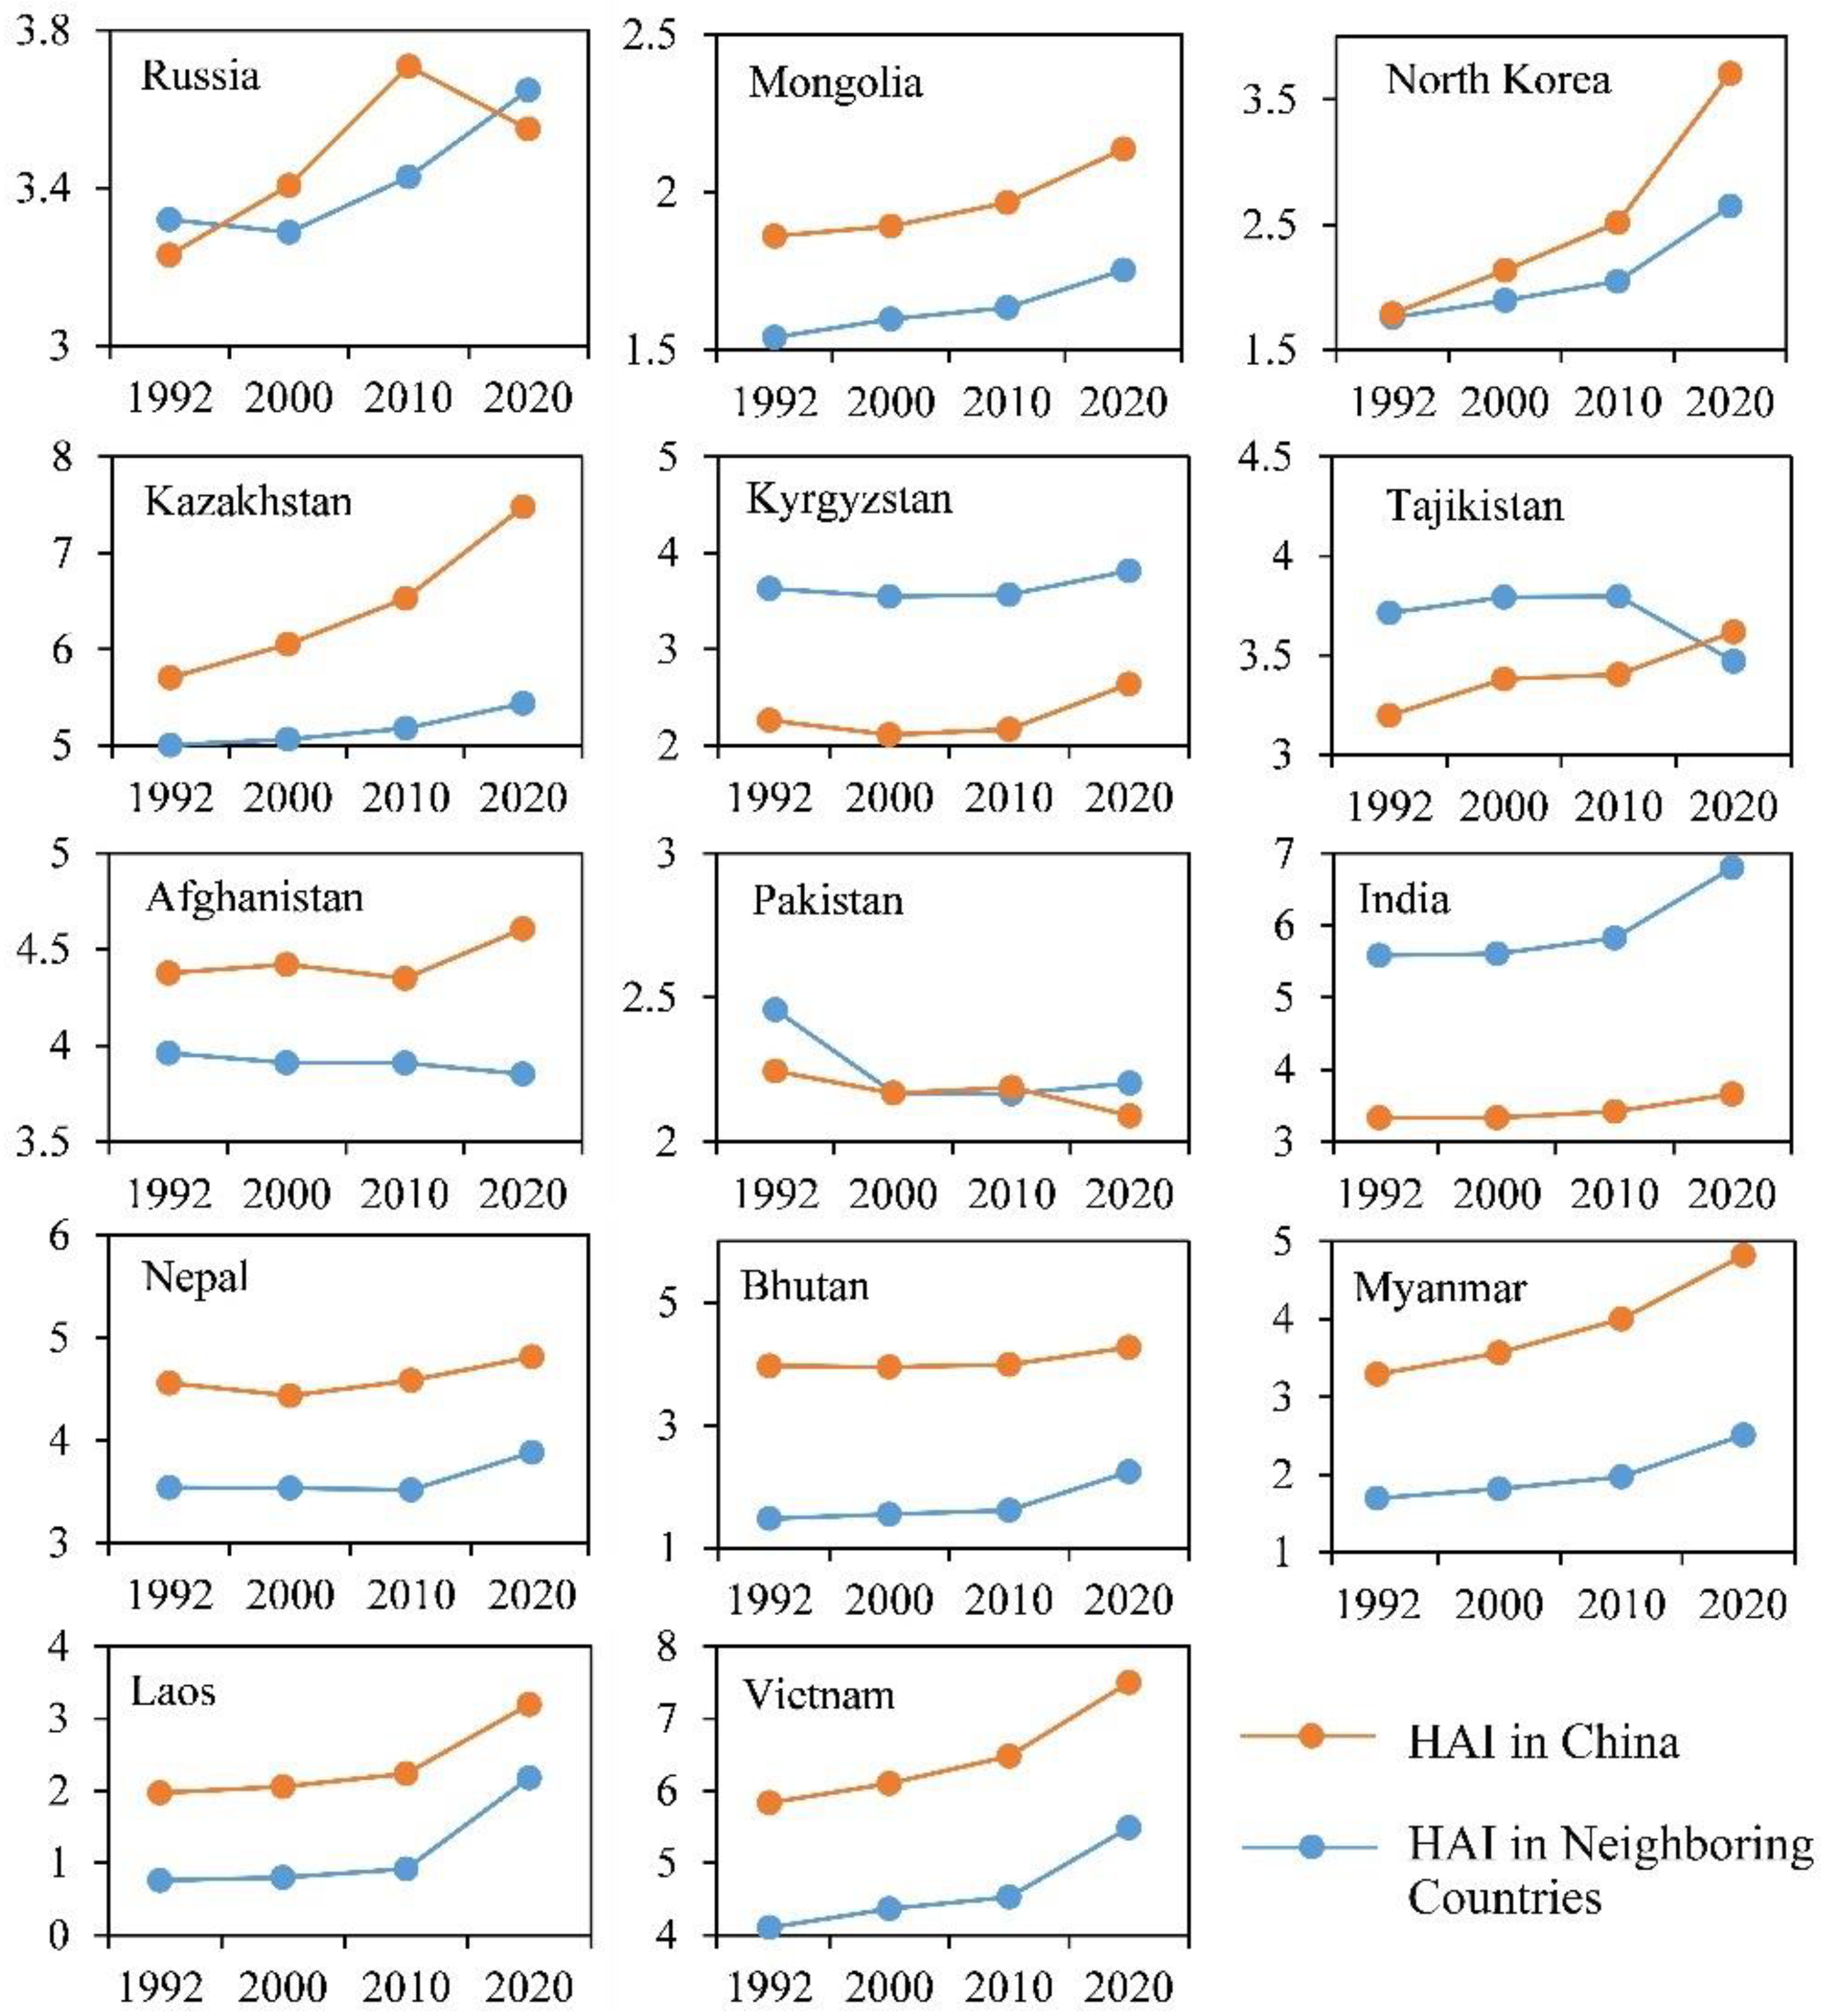
3.2. Interstate Comparison along the Boundary

Figure 5 shows China’s comparative HAI changes with its neighboring countries. Among these neighbors, India has the highest HAI and most rapid growth. In particular, the state of Assam in India has gone through a period of rapid population growth. Since entering the 21st century, Assam has returned to peace and promoted development through policies such as the North East Industrial and Investment Promotion Policy and Industrial Policy of Assam, leading to improvements such as enhanced road connectivity. Mongolia has the lowest HAI, with slow growth due to the uninhabitable conditions in border areas. From 1992 to 2010, except for the slight decrease in the HAI in Pakistan, the HAI in most neighboring countries remained stable. After 2010, the HAI in the study area underwent great changes. Among them, countries with a fast-growing HAI include India, Vietnam, North Korea, Bhutan, Myanmar, and Laos. The HAI in Tajikistan and Afghanistan decreased slightly. From the perspective of time evolution, China and its neighboring countries’ HAI grow simultaneously in many regions, including Nepal, Bhutan, Myanmar, Laos, Vietnam, Mongolia, Afghanistan, and Kyrgyzstan. China has a significantly increased HAI in border areas with North Korea and Kazakhstan.
Overall, about half of the 14 neighboring countries have a lower HAI than their corresponding border areas in China, including Mongolia, Kazakhstan, Afghanistan, Nepal, Bhutan, Myanmar, Laos, and Vietnam. Only two countries, India and Kyrgyzstan, have a higher HAI than the Chinese side. The contrast in HAI between some countries and China has changed significantly, such as Russia, North Korea, Tajikistan, and Pakistan. As a result of Russia’s series of development plans in the Far East around land policy and Sino-Russian trade policy, Russia’s HAI has grown relatively compared with China. However, its corresponding border areas in China have faced difficulties such as insufficient economic development momentum, population shrinkage, and resource traps, with the result that border development has shown a backward trend in recent years. Apart from Russia, the closed and planned economy in North Korea and its minimal opening to the outside world have led to the slow development of human activities on its borders. Furthermore, the phenomenon of land degradation in the plateau area is obvious. For example, Tajikistan has experienced grassland degradation due to overgrazing, and its HAI decreased rapidly after 2010. Similarly, a lot of alpine meadows have degraded in the northwest of the Qinghai-Tibet Plateau, leading to regional grazing bans in China, resulting in the HAI declining in China’s border area adjacent to Pakistan.

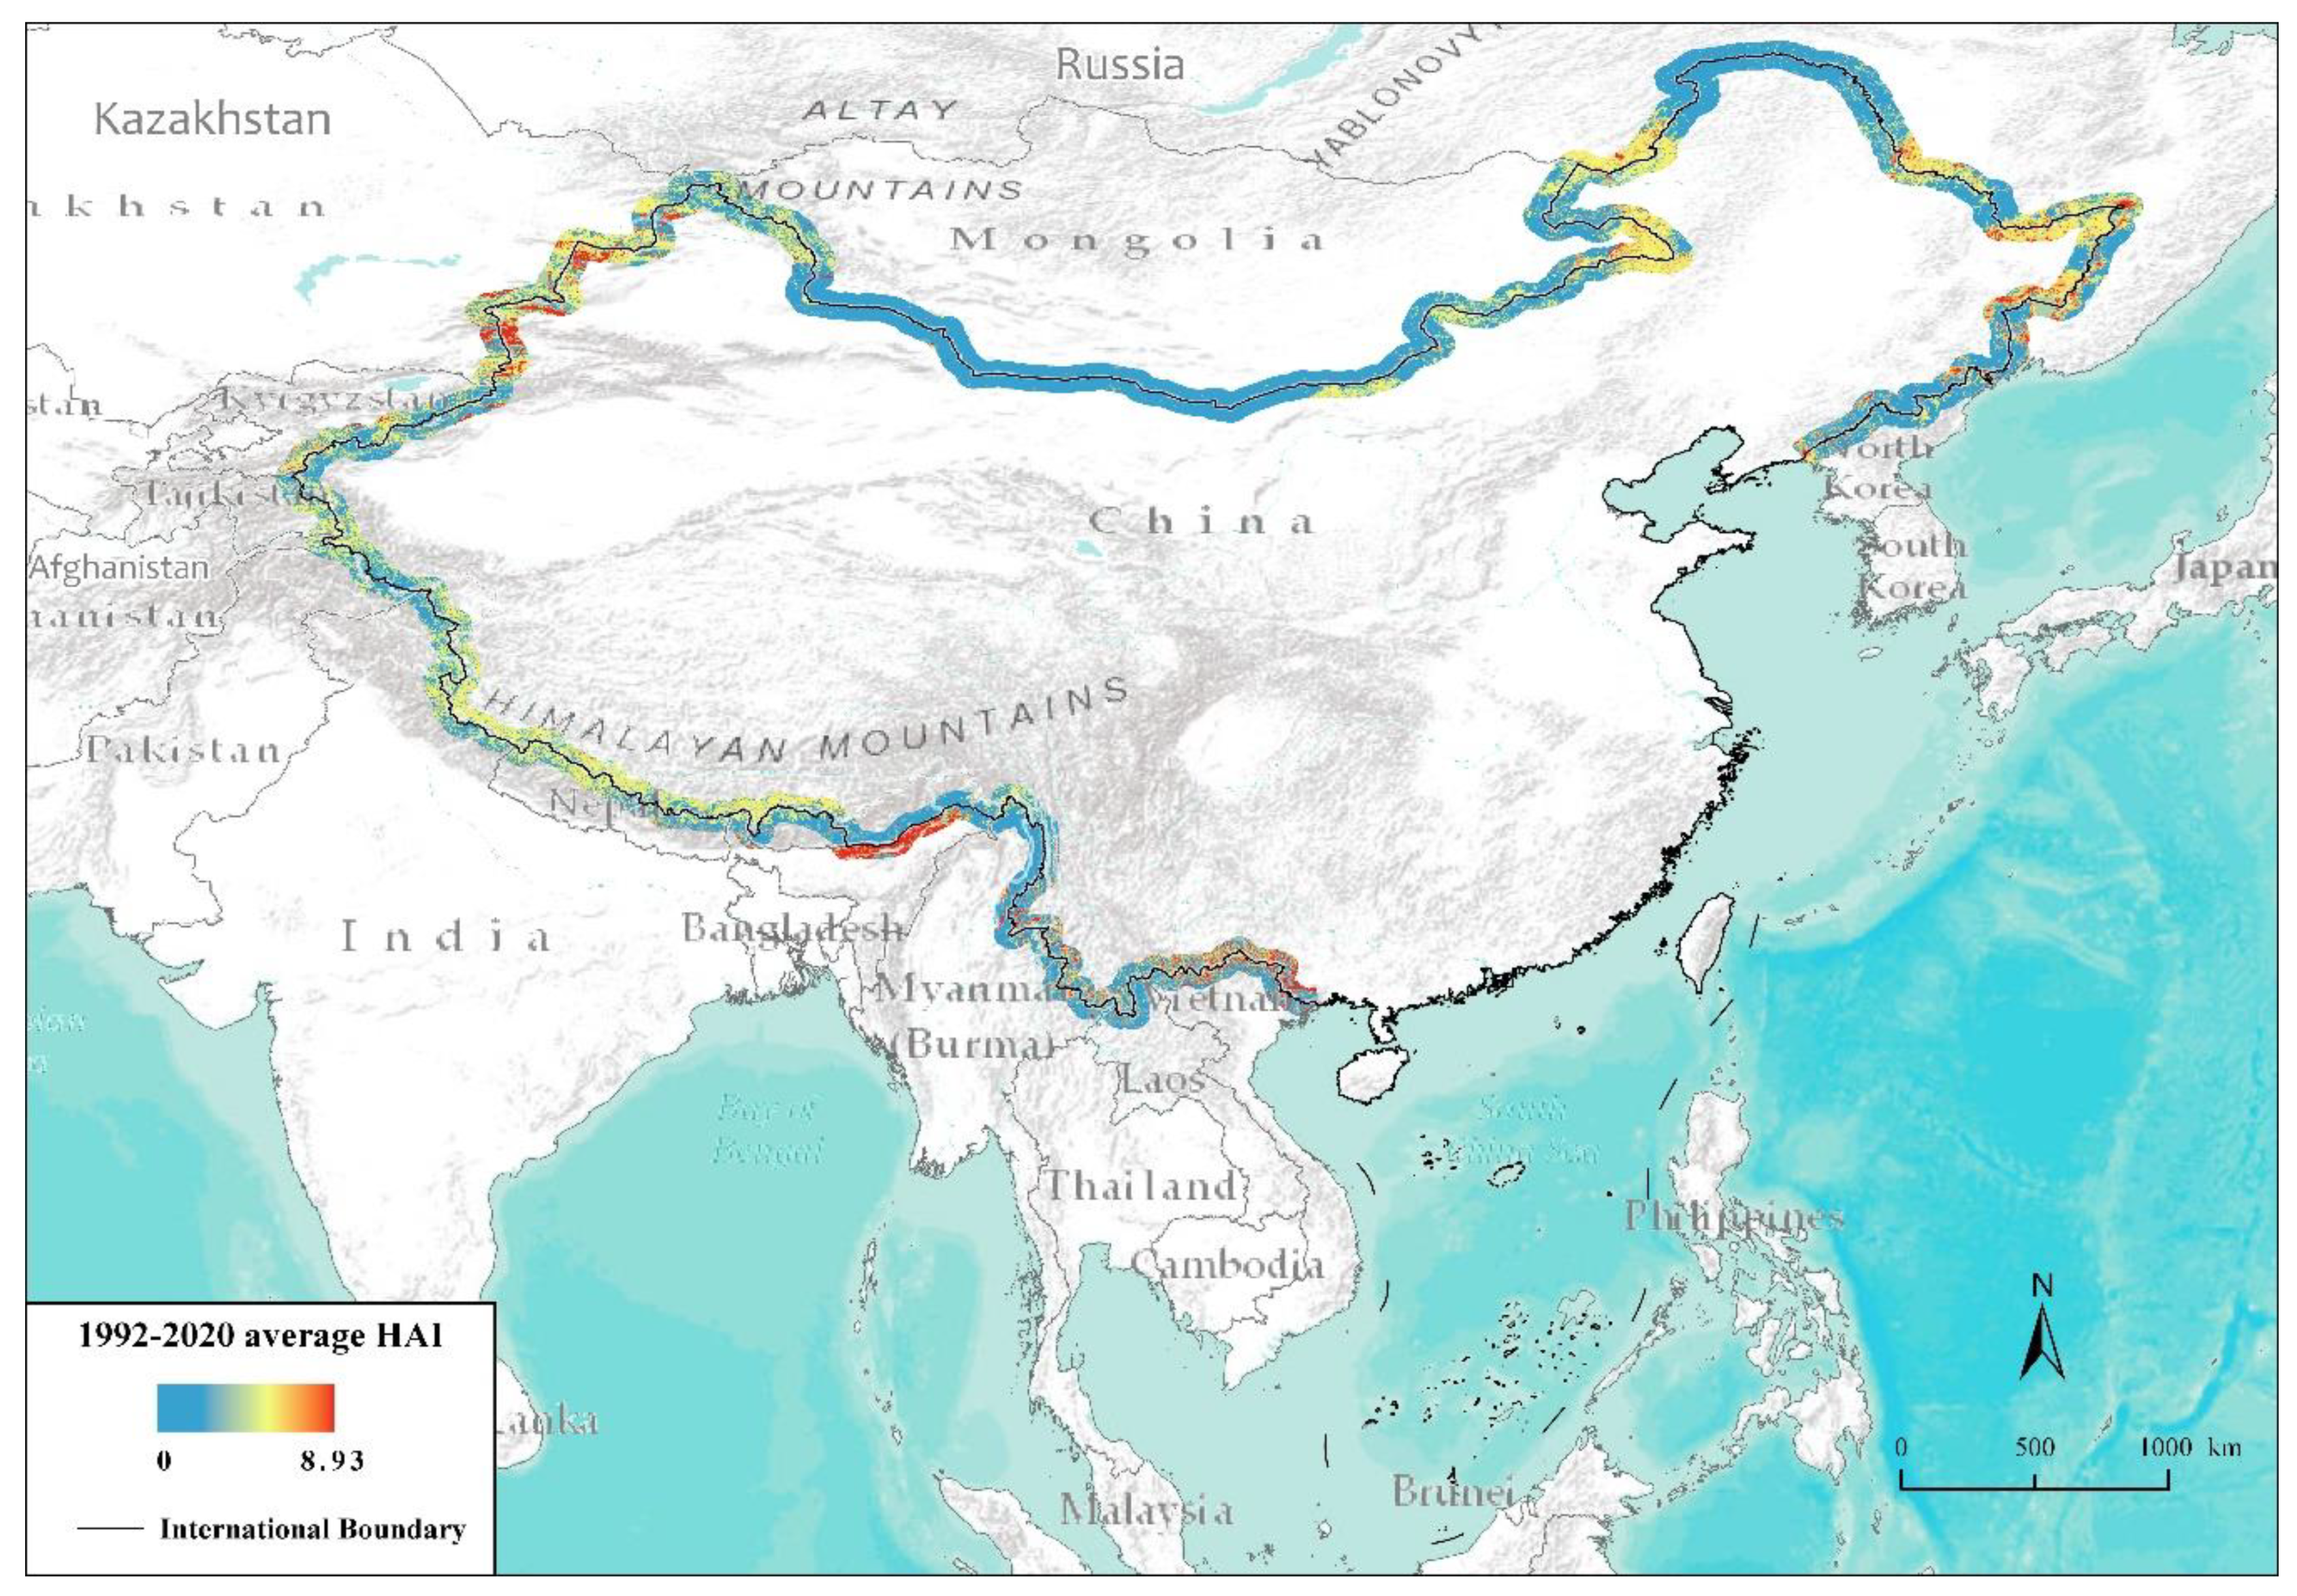
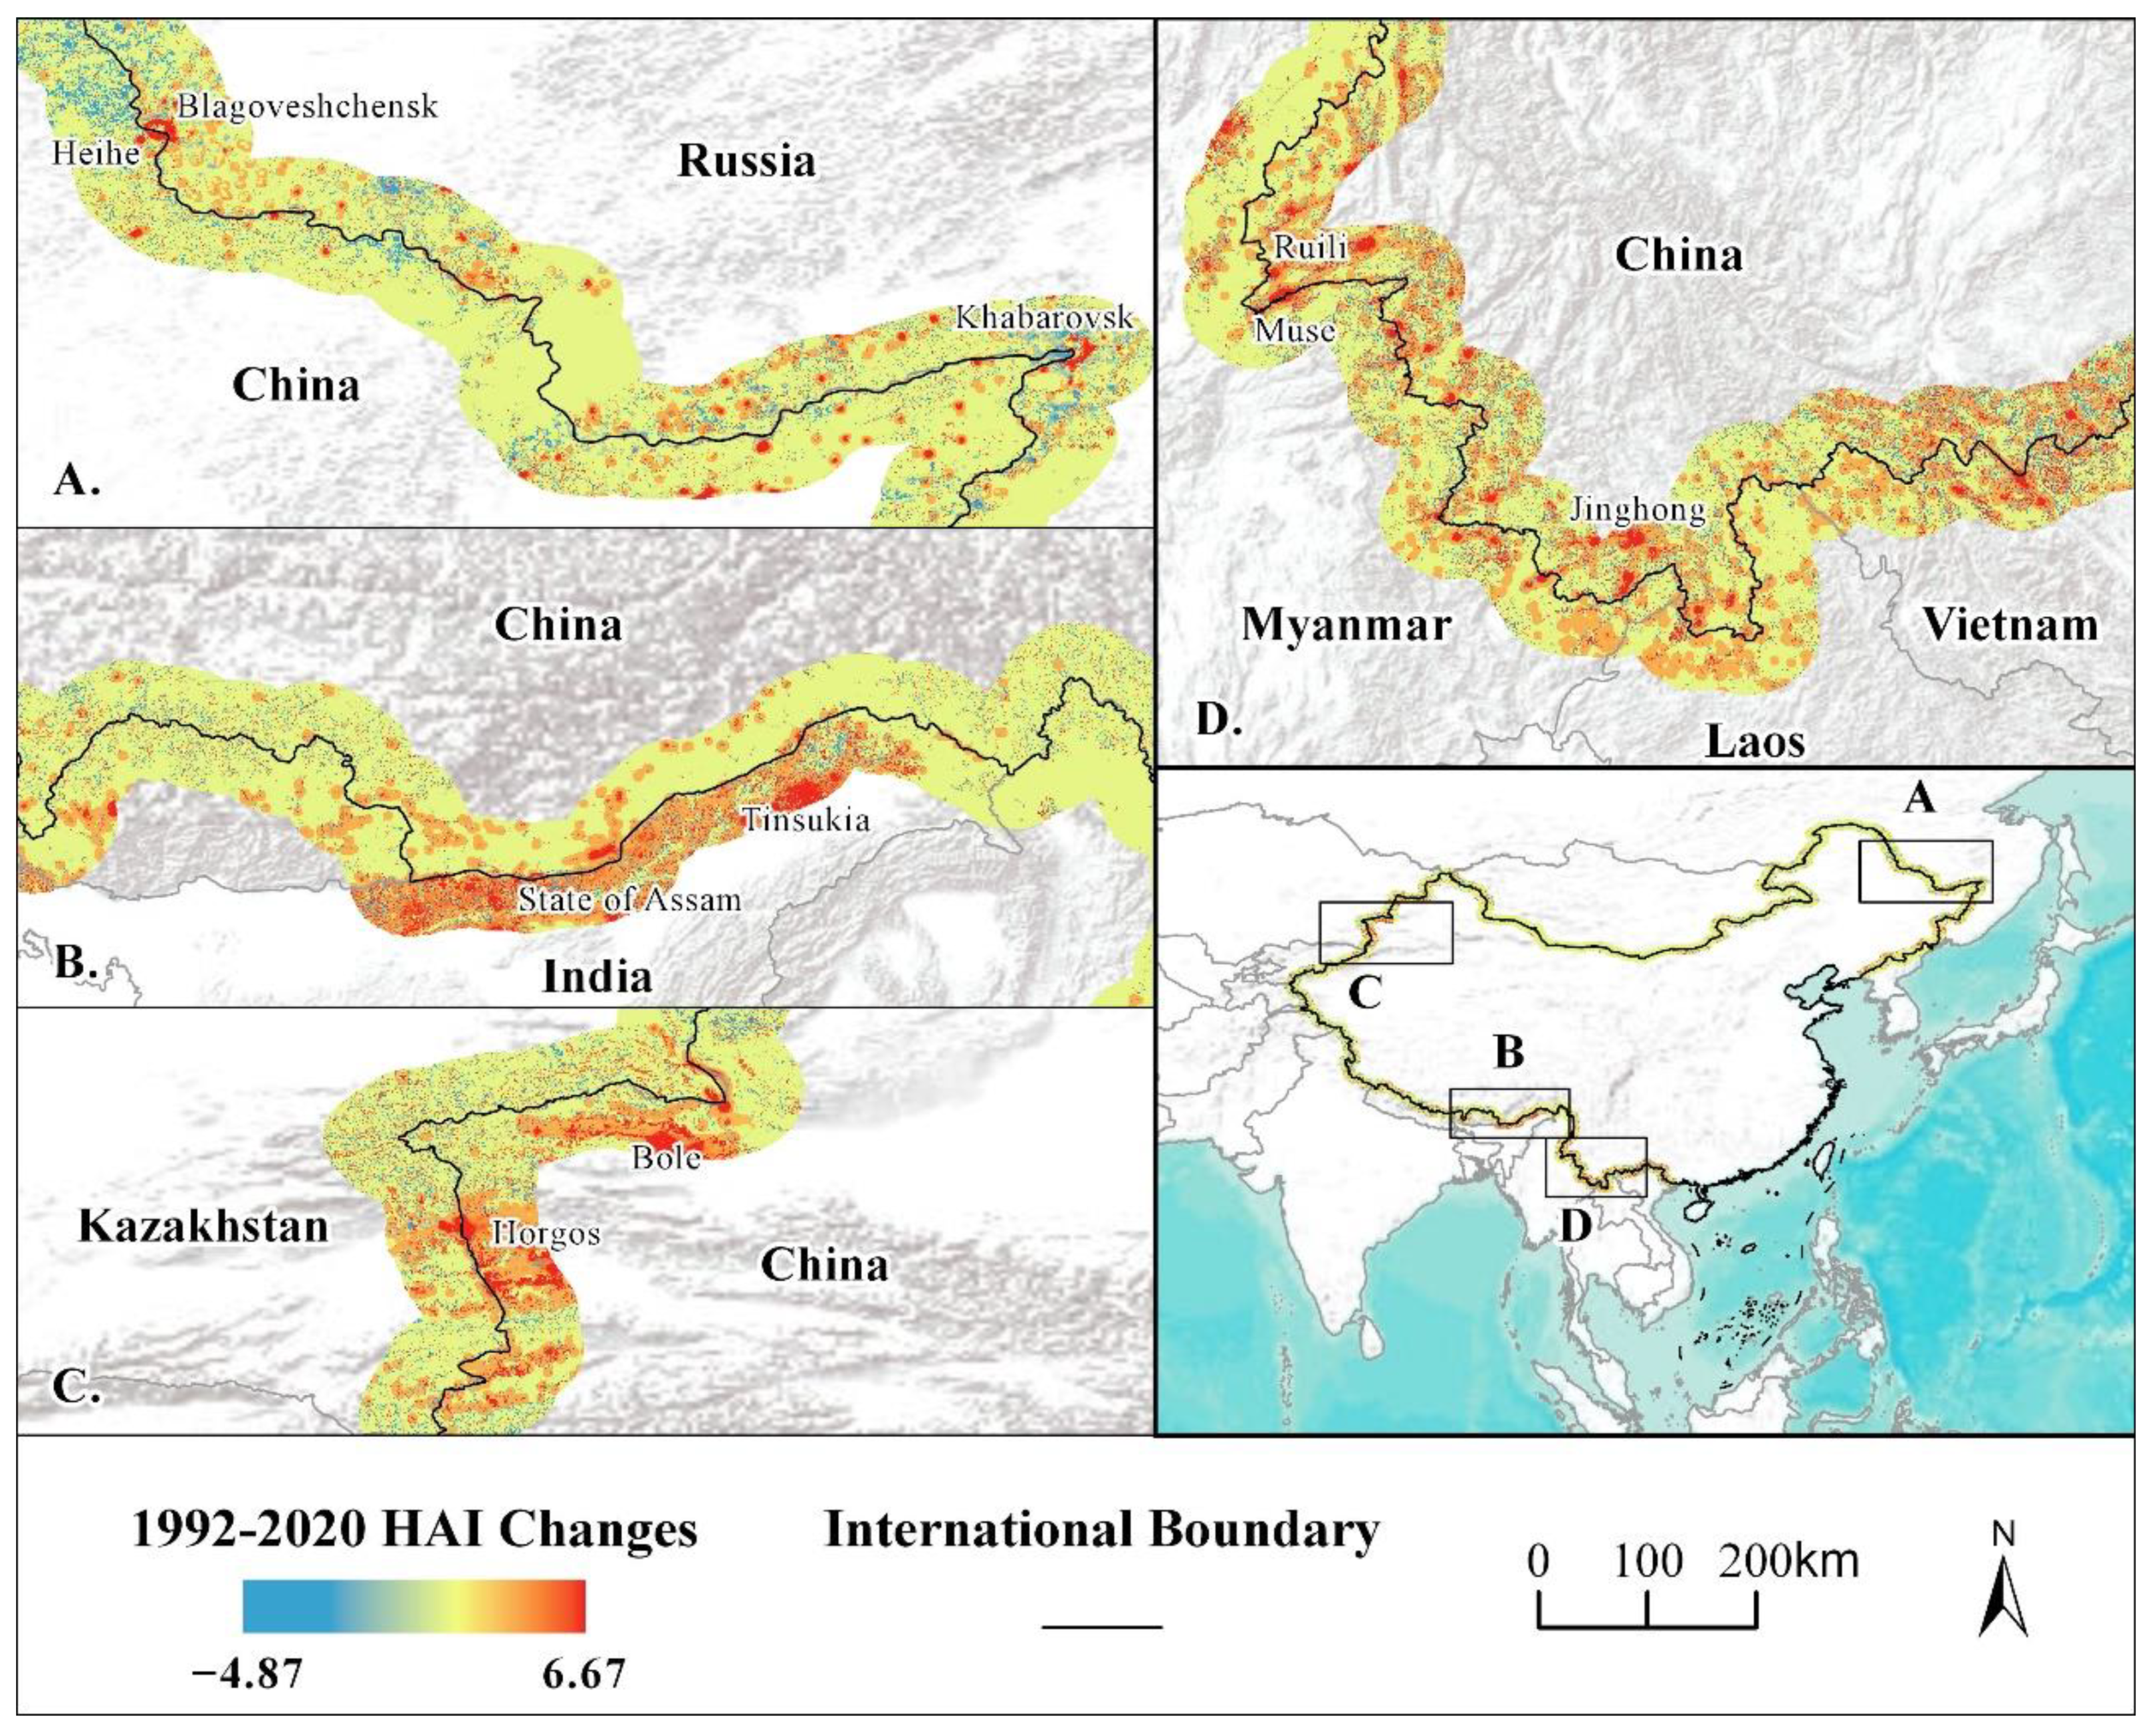
3.3. Selected Regional Analysis

Taking 2020 minus 1992 in the HAI values as the HAI change, we found that about 80% of the raster changes were between −1 and 1. That is, the HAI in most areas remained basically stable. To further analyze the regions with drastic changes in the HAI, we selected four typical regions: the Sino-Russian border, the Sino-Indian border, the China–Kazakhstan border, and the China and Indo-China Peninsula border areas (Figure 6). The HAI shows a declining trend in the northeastern border area of China, especially along the Sino-Russian border. The HAI in other border areas increased significantly, including the northwest, south, and southwest, especially in the cities and port areas on the China–Kazakhstan and China–India borders. The next four paragraphs characterize HAI changes in the following main regions: Sino-Russian HAI decline; Sino-Kazakhstan HAI unilateral growth; Indian HAI continuous growth; and China and Indo-China Peninsula HAI synchronous growth.
The HAI in the northeastern border of China faces recessionary predicaments (Figure 6A), where energy and mining, agriculture and forestry development, and machinery and household appliances are developed between China and Russia and China and North Korea. In the 1960s and 1970s, the northeast region was at the forefront of China’s economic development, with heavy industry leading, and the northeast border dominated by interstate trade. Since the 1980s, the overall development of northeast China has been slow, and the population has decreased. At the same time, the Russian far east area is sparsely populated, and North Korea has limited opening to the outside world, resulting in a gradual decrease in northeast border trade activities. The HAI decline areas are mainly located around cities, farms, and nature reserves, such as Khabarovsk’s surrounding areas and Heihe’s western part.
The China–Kazakhstan border shows a trend of unilateral growth on the Chinese side (Figure 6C). The Kazakh side has an average increase of 0.04, while the Chinese side has an average increase of 0.18, which is 4.5 times that of the Kazakh side. There are important inland export hubs, such as Khorgos and Alashankou, along the Sino-Kazakhstan border. China’s border policy supports the establishment of border economic cooperation zones in Yining, Bole, Tacheng, and other places. Meanwhile, Xinjiang is the core area for the construction of the “Belt and Road” initiative, and the northwestern border has become a hub for China’s westward opening and border trade. Bole City and Horgos City have grown significantly with the support of China’s policies. However, in Kazakhstan’s comprehensive opening to the outside world, the strategic position of the Sino-Kazakh border is relatively weak, and the growth of the HAI on the Kazakh side is relatively slow.
In the eastern Sino-Indian border area, the average growth rate of China was 0.09 while India’s was 0.34, which was 3.8 times that of China (Figure 6B). This may be due to different natural conditions in the two areas. Along the Sino-Indian border, the Brahmaputra Valley Plain on the Indian side has a milder climate and more abundant rainfall, making it more suitable for human activities. Moreover, a large Bengali-speaking population in Assam tends to retain the traditional habits of large families, resulting in greater population growth. The Chinese side is located at the foot of the eastern Himalayas, where the plateau ecosystem limits HAI growth. Furthermore, there is a disputed area between China and India here.
The HAI in the southwest study area shows a synchronous growth (Figure 6D). The average HAI border growth of Myanmar, Laos, and Vietnam was 0.12, while on the Chinese side, it was 0.14. There was little difference between the two. Due to favorable climatic conditions, the development of bilateral trade, and frequent cross-border activities, both sides have some degree of HAI growth.

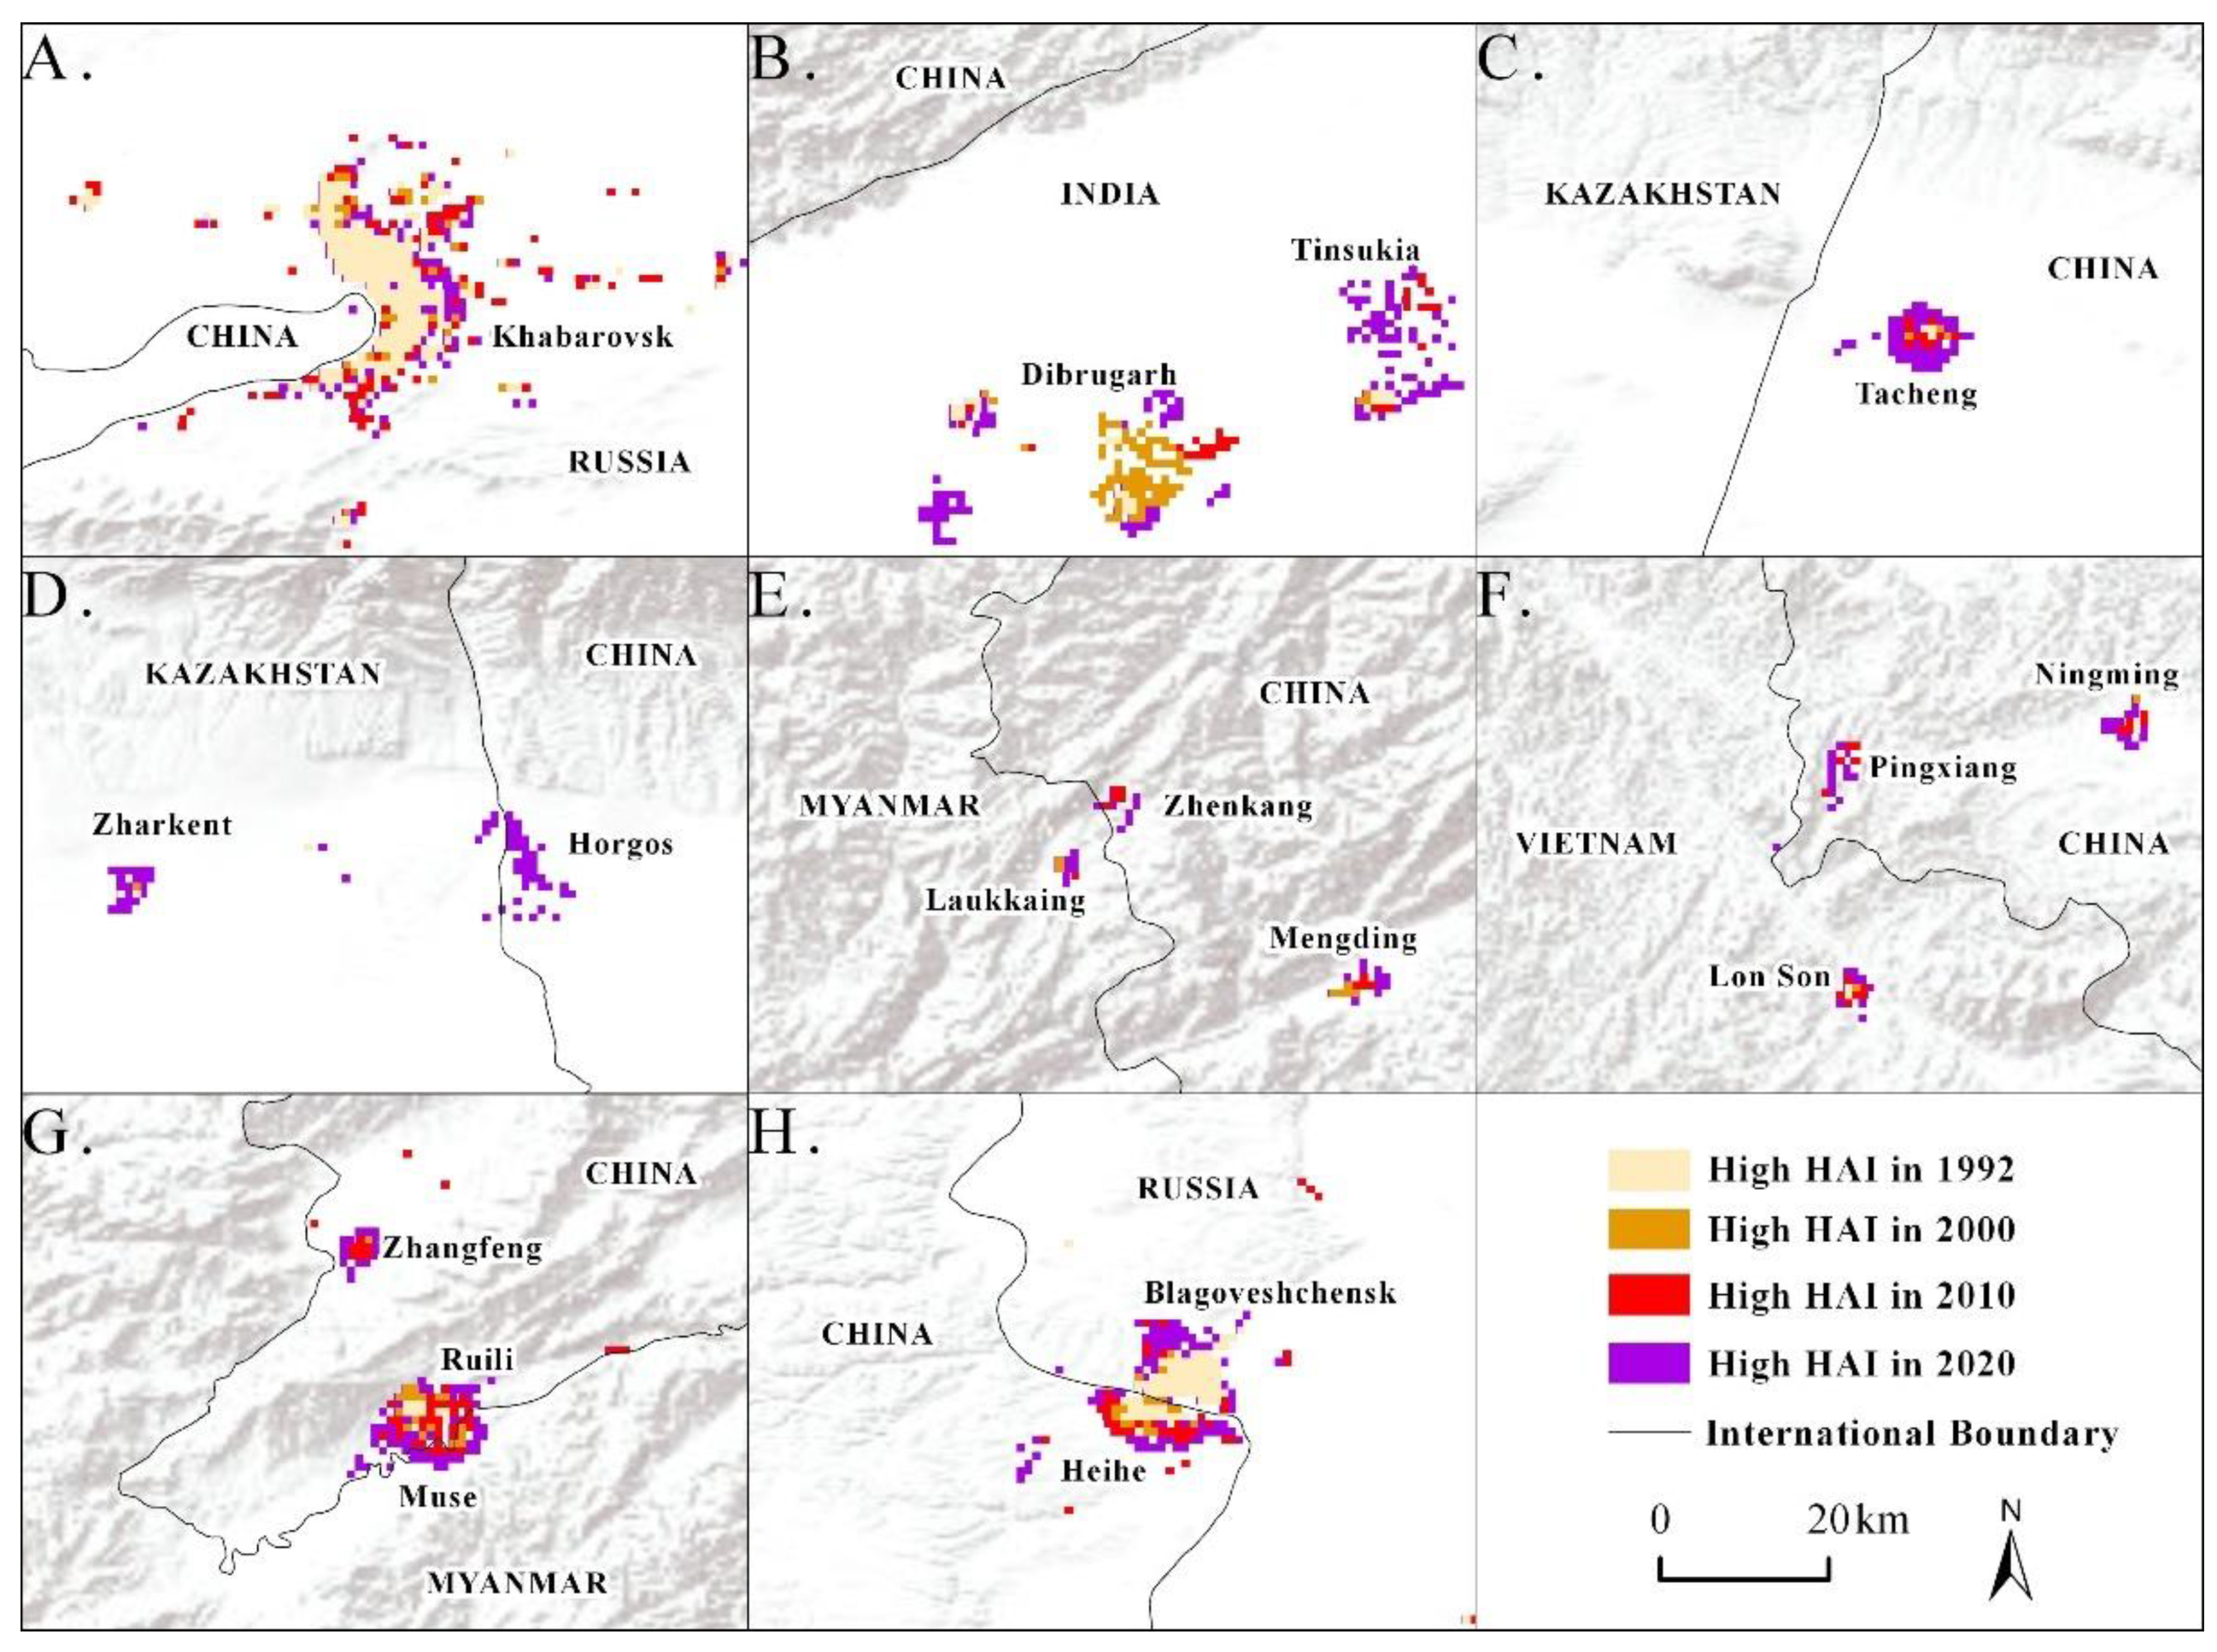
3.4. Hotspot Analysis

We further observed some hotspots with high HAI and dramatic changes. Most of these hotspots are border towns, where construction land has expanded significantly. Changing patterns of high HAI (>4) in some hotspot areas from 1992 to 2020 can be expressed as three spatial models, namely unilateral expansion, bilateral expansion, and cross-border integration.
Unilateral expansion. There is a high HAI on one side of the international boundary and a low HAI on the other, forming a single-center development model within the border buffer zone. Moreover, there is no obvious interaction between the areas on either side of the international boundary. Meanwhile, the single-center region continues to expand toward the international boundary, resulting in the stark contrast between prosperity on one side and desolation on the other. They include Khabarovsk in Russia (Figure 7A), Assam in India (Figure 7B), Mongla in Myanmar, Tacheng in China (Figure 7C), as well as others such as Manzhouli, Erenhot, and Jinghong in China. Such areas are generally the capitals of border states and undertake the important responsibilities of maintaining and guarding borders. Alternatively, they are essential external transportation hubs, serving as transit platforms and stations for the country to realize foreign trade through land borders. This unilateral expansion was due to a number of historical factors. For example, Khabarovsk is the administrative center of the Russian Far Eastern Federal District, the capital of the Khabarovsk Territory, and the largest city in the Russian Far East. During the Ming and Qing Dynasties of China (1643–1858), Khabarovsk, named Boli, was established here. Due to Sino-Russian border negotiations, Khabarovsk was formed as a border city in Russia. Apart from historical factors, the huge difference in the natural environment leads to inconsistent development of bilateral HAI. For example, Medog County is located on the southeastern edge of the Qinghai-Tibet Plateau in China, with a maximum altitude of 7787 m, where the landscape is dominated by ravines that hinder transportation. On the other side, the state of Assam in India is located in the Brahmaputra River Valley Plain, with flat terrain and fertile water and soil, where Dibrugarh, Tinsukia, Chabua, and other cities formed. As well, the difference in national policy support between the countries further deepened the contrast in the HAI. For example, China’s Tacheng Baketu Port has a history of trade in the Qing Dynasty and is a major transfer point from western China to Central Asia and Europe. Tacheng was set up as an open city along the border in 1992, and key developments as an opening-up area were established here in 2020. Therefore, it has long been an opening-up area supported by Chinese policies. In contrast, the Kazakh border on the other side was developing more slowly than the Chinese side due to Kazakhstan’s constant changes in national strategy.
Bilateral expansion. Some high HAI areas formed near the international boundary and continued to spread towards the boundary on both sides due to some degree of interaction between the countries. These areas are China Khorgos–Kazakhstan Khorgos (Figure 7D), China Zhenkang–Myanmar Laukkaing (Figure 7E), and China Pingxiang–Vietnam Lang Son (Figure 7F). Border trade is the main reason for this phenomenon. These areas on both sides continue to have an active trade relationship and cross-border population movement, which is more common in southwest China. Secondly, national-level trade policies have promoted bilateral interaction. For example, the China–Kazakhstan Horgos Cross-border Cooperation Center proposed in 2006 has been jointly constructed by China and Kazakhstan. As a result, since then, the HAI in the Horgos region of China has rapidly increased.
Cross-border integration. Composed of parts of China and neighboring countries, some cross-border areas break through the international boundary to form integrated wholes. These twin cities are characterized by deep social and economic integration and gradual outward expansion [53,54]. Examples are China Ruili–Myanmar Muse (Figure 7G), China Heihe–Russia Blagoveshchensk (Figure 7H), China Hekou–Vietnam Lao Cai, China Dongxing–Vietnam Mong Cai, and China Dandong–North Korea Sinuiju. The first common factor shaping such twin cities is natural conditions. Such cities are generally found in flat areas without a major natural obstacle. The second factor is historical. For example, Ruili in China and Muse across the border in Myanmar were originally in the same country and had the same ethnic culture. However, due to historical border evolution, this area was divided between the two countries. Border trade and cross-border transportation further promoted the integrated development of the twin cities. For example, Sinuiju is a special economic zone in North Korea. On the opposite side is Dandong, and it undertakes 80% of the trade volume between China and North Korea. Therefore, Dandong in China and Sinuiju in North Korea have formed closely linked twin cities. In addition, Hekou and Lao Cai, the largest border ports between China and Vietnam, have also formed integrated spaces as twin cities.
In general, there seems to be a paradox about an international boundary. On the one hand, it has a “border effect”, which artificially separates areas with the same natural attributes, and restricts the free flow of population and materials. On the other hand, it has a special attraction—an agglomeration effect. In the context of globalization, human activities continue to gather at the boundary frontier based on different needs. For example, countries deploy military forces in border areas for security and to demonstrate national strength. Border residents settle along the boundary to facilitate border trade for a living. Transportation facilities, such as ports, are directly connected with neighboring countries, which can facilitate the inspection and safe arrival of goods. The international boundary not only has mediating effects but also serves as a symbol of power and strategic interest in the border area. The barrier function of the international boundary divides power and institutional space between countries, while its intermediary function brings about the exchange of resources and markets.

4. Discussion

4.1. Comparisons with Previous Studies

Most border research uses population and land use data for analysis. You et al. analyzed population changes within a 200 km buffer zone inside and outside China’s borders [55], finding that the population density on the neighboring side was twice as high as on the Chinese side. The comparison of population densities we found is consistent with this, but with a higher HAI on the Chinese side than on the neighboring side. Therefore, using population density data alone cannot represent comprehensive HAI in border areas. Land cover has significantly changed in some sparsely populated areas, such as Khorgos. However, some densely populated areas, such as Dandong, have stagnated. Huang et al. used census data to analyze the population distribution of 131 border counties in China from 1982 to 2010 [56]. However, the demographic analysis based on administrative units has coarsened the spatial differences in population density. In fact, the border population is mainly distributed in the plains, oases, and along the transportation lines [55]. Therefore, using a single datum to identify human activities will produce large deviations. Stokes et al. used three types of data in urban infrastructure research, including population, land use and nighttime light, and proved that comprehensive data can better reflect the diversity of human activities [57]. Hence, we integrated those three types of data to reflect the HAI in border areas comprehensively.
Taking the 50 km buffer zone of the boundary as the study area is also an innovation of this paper. The area of the 200 km buffer zone adopted by You et al. [55] was too broad, and the entire regions of Nepal and Bhutan were included in their study, which was not representative of a typical border area. According to our survey, areas beyond 100 km from the international boundary have few border features. The international boundary has a greater impact on the HAI in areas within 50 km. At the same time, existing studies have focused more on units such as provinces [41] and cities [42] in local areas, which lack multi-scale spatial comparison of raster data. We took the buffer zone of China’s international boundary as the study area and conducted a multi-scale comparative analysis to comprehensively understand the evolutionary characteristics of human activities in the areas on both sides of China’s border. In addition, compared with short-term research in previous studies [55,58,59], the dynamic evaluation of the HAI in this study used a long-term time series from 1990 to 2020, which is helpful in understanding the temporal and spatial evolution of the border area in the past 30 years.

4.2. Geopolitical and Geoeconomic Implications of HAI Changes in Border Areas

Human activities in border areas have geopolitical overtones. Sovereign consciousness and national culture impact human activities. The nature of cooperation and conflict of human activities in border areas is a major factor affecting geopolitics. The rapid growth of the HAI in disputed areas will exacerbate geopolitical tensions between the two countries and push the bilateral countries further into a “security dilemma”. In Arunachal Pradesh, the disputed area between China and India, India actively moves human settlements to this area, or strengthens human activities in existing areas, to gain greater strategic initiative and public opinion in the geopolitical competition. India’s HAI near the disputed area increased by 0.34 from 1992 to 2020, while the Chinese counterpart increased by only 0.09. India also continues to ramp up human activities in disputed areas like Itanagar and Pasighat, establishing administrative capitals and undertaking infrastructure projects to consolidate territorial control [60]. It can also be seen from Figure 5 that India’s HAI in border areas has risen rapidly; it is becoming the country with the highest HAI among China’s land neighbors.
On the other hand, in a friendly international context, establishing a cross-border economic cooperation zone is a means of expanding human activities, which will further stabilize bilateral relations that promote border geoeconomics. The cross-border economic cooperation zone takes cross-border industrial cooperation and port logistics as its main functions. For example, the Heilongjiang Cross-border Economic Cooperation Pilot Zone has established three areas, Heihe, Suifenhe, and Dongning, and is committed to building a pilot area for comprehensive strategic cooperation between China and Russia and a regional cross-border industrial cooperation base for Northeast Asia. The China Dongxing–Vietnam Mong Cai Cross-Border Economic Cooperation Zone, an upgraded version of the China-ASEAN Free Trade Area, is an important carrier and platform for the “Belt and Road” initiative. The cooperation zone is spatially manifested in the expansion of industrial land near the boundary and the growth of economic activities, transforming the border area’s function from security and defense to economic. However, human activities in the Sino-Russian border areas show a partial contraction. With the resolution of boundary issues related to disputed areas in the early 21st century, the geopolitical importance of the Sino-Russian border areas has decreased, leading to a decline in the HAI.

4.3. Implications of the HAI for Ecosystem Services and Biodiversity

The rapid expansion of human activities, including urbanization, agricultural reclamation, and grazing, on both sides of China’s international boundary greatly affects habitats and biodiversity [61,62]. The trade-off of the economic and ecological intensity of land use is essential in this area [63]. We used the monthly global Normalized Difference Vegetation Index (NDVI) data at1 km resolution, which is a MODIS product provided by NASA [64], and conducted a phased spatial comparison from 2000 to 2020 with the HAI. The analysis found that HAI and NDVI changes in most population agglomeration areas were negatively correlated to a certain extent. Vegetation coverage has been greatly reduced in urban areas such as Mangshi, Jinghong, Aheqi, Jimunai, and Mohe in China, as well as Myitkyina, Bhamo in Myanmar, and the Brahmaputra watershed in India. Due to overgrazing in the Pamir Plateau, the HAI increased slightly, and the NDVI decreased significantly on the borders of China–Tajikistan, China–Kyrgyzstan, and China–Kazakhstan. Although the HAI increased rapidly in some areas, the NDVI here remains stable, such as in the border areas with high forest coverage in Vietnam, Laos, and Myanmar. The HAI is reducing in the Sino-Russian border area, such as Greater Khingan. Coupled with strict ecological protection and control measures on the Chinese side, the NDVI in this area has increased significantly, which is reflected in improved ecological conditions.
Biodiversity in the study area faces a greater threat at several hotspots that cross borders, such as the Himalayas, the Central Asian mountains, and the India–Myanmar region [65]. The HAI in these areas has increased significantly. Tang et al. found that the estimated forest disturbance area reached 4366.14 km2 in the China–Laos border areas from 1991 to 2016 [66]. Lin Wang et al. found that the reduction of natural forests in the southwestern border areas of China led to a decrease in the number of biological habitats, especially in the Sino-Vietnamese border area [67]. We extracted the range of key biodiversity areas (KBA, https://www.keybiodiversityareas.org/, accessed on 10 May 2022) and found that the HAI in KBA increased by 13% from 1992 to 2020. Among the KBA areas with the most HAI growth are Dibru Saikhowa National Park and Sonai Rupai Wildlife Sanctuary in India, Irrawaddy River in Myanmar, and Tongbiguan Nature Reserve and Longgang Nature Reserve in China, which are mainly located in the southern and southwestern study areas. Therefore, we propose that cross-border protection measures and international cooperation in these two areas should be strengthened. Governments should take appropriate control of the HAI in the KBA areas, for instance, to ensure orderly migration in core protected areas and improve cross-border biological connectivity.

4.4. Research Deficiencies and Prospects

Several uncertainties still exist. First, we proposed an HAI based on data acquisition in the study area. Some indicators, such as roads, are not considered because of the poor availability of historical data, which may underestimate the impact of infrastructure construction outside human agglomeration. Second, the HAI represented by land cover adopts an empirical evaluation method. However, referencing the results of previous research still involves a certain degree of subjectivity. If high-precision data for continuous-time is available in the future, such as monthly and daily dynamic data of the tourist population and migrant population, these data can be incorporated into the research framework to further analyze the changes in the HAI during the year. In the buffer zone between two countries in border areas, the impact of human activities has spillover effects such as transboundary air and water pollution [68,69]. Therefore, we should also strengthen the research on this kind of telecoupling in the future [70] and explore the cross-border cooperation mechanism of border ecological environment governance.

5. Conclusions

About 90% of the study area has a low HAI, and there are almost no traces of human activities in the Central Mongolian desert Gobi area, the Greater Khingan virgin forest area, the Qinghai-Tibet Plateau, and the Pamir Plateau. High HAI areas are mainly distributed in the Ili River Valley, the Brahmaputra River Valley Plain, and the Sino-Russian and Sino-Myanmar border urban areas. The HAI of the Chinese side is higher than that of the neighboring countries. In particular, the land use intensity on the Chinese side has increased significantly, but the population density on the Chinese side is lower than that of the neighboring countries. Among China’s land neighbors, India’s HAI is the highest with rapid growth, and the Indian side presents a contiguous HAI with high intensity. Mongolia had the lowest HAI, but it increased slightly. With the adjustment of China’s geostrategies in relations with neighboring countries, four regional evolution patterns emerged in the study area. They are Sino-Russian HAI decline, Sino-Kazakhstan HAI unilateral growth, Indian HAI continuous growth, and China and Indo-China Peninsula HAI synchronous growth. Spatial models in hotspot areas are unilateral expansion, bilateral expansion, and cross-border integration.
The paradoxical phenomenon of “border effect” and “agglomeration effect” is presented in border areas at the same time. In the context of globalization, the agglomeration effect of increased population and industrialization in border areas, such as those reflected in migration and urbanization in border cities, and as a result of the development of cross-border economic cooperation zones and cross-border transport infrastructure, have an impact on the ecological environment. Meanwhile, human activity intensity in border areas is also an important factor affecting geopolitics and geoeconomics. Governments are inclined to move border residents to disputed areas to enhance control. The agglomeration of the population in border cities promotes cross-border economic cooperation, and economic prosperity attracts more population, in turn.
The main contributions of this paper are as follows. Given the current lack of research on human activity in international border areas, we take China as an example to make up for this gap. Three different kinds of data were integrated to form a new index of HAI, which helps understand the evolution of human activities in the past 30 years in China’s border areas. The methodology of this study can provide a reference for border research, and the results support decision-making about cooperation between China and neighboring countries in such key areas as ecological protection, border security, and border trade.

Author Contributions

Conceptualization, Y.C. and H.L. (Haimeng Liu); methodology, Y.C., D.C., and H.L. (Hui Liu); software, Y.C.; validation, Y.C. and H.L. (Haimeng Liu); formal analysis, Y.C. and H.L. (Haimeng Liu); resources, Y.C.; data curation, Y.C.; writing—original draft preparation, Y.C.; writing—review and editing, H.L. (Haimeng Liu), D.C. and H.L. (Hui Liu); visualization, Y.C.; supervision, H.L. (Hui Liu), D.C. and H.L. (Haimeng Liu); project administration, H.L. (Hui Liu); funding acquisition, H.L. (Hui Liu) and H.L. (Haimeng Liu). All authors have read and agreed to the published version of the manuscript.

Funding

This research was funded by the Strategic Priority Research Program of the Chinese Academy of Sciences (XDA20010103), the Second Tibetan Plateau Scientific Expedition and Research Program (2019QZKK1007, 2019QZKK1005), and the National Natural Science Foundation of China (42171210).

Institutional Review Board Statement

Not applicable.

Informed Consent Statement

Not applicable.

Data Availability Statement

Not applicable.

Acknowledgments

The study was also supported by Barbara Muirhead and Ilia Parshakov from Queen’s University and Shaoqi Gong from Nanjing University of Information Science and Technology. The authors very much appreciate their contributions.

Conflicts of Interest

The authors declare no conflict of interest.

References

  1. Crutzen, P.J. Geology of mankind. Nature 2002, 415, 23. [Google Scholar] [CrossRef] [PubMed]
  2. Masson-Delmotte, V.; Zhai, P.; Pirani, A.; Connors, S.L.; Péan, C.; Berger, S.; Caud, N.; Chen, Y.; Goldfarb, L.; Gomis, M.I.; et al. Climate Change 2021: The Physical Science Basis; IPCC: Geneva, Switzerland, 2021. [Google Scholar]
  3. Honghu Meng, X.G.; Song, Y.; Cao, G.; Li, J. Biodiversity arks in the Anthropocene. Reg. Sustain. 2021, 2, 109–115. [Google Scholar] [CrossRef]
  4. Steffen, W.; Richardson, K.; Rockström, J.; Cornell, S.E.; Fetzer, I.; Bennett, E.M.; Biggs, R.; Carpenter, S.R.; De Vries, W.; De Wit, C.A. Planetary boundaries: Guiding human development on a changing planet. Science 2015, 347, 1259855. [Google Scholar] [CrossRef] [PubMed] [Green Version]
  5. Cheng, Y.; Liu, H.M.; Wang, S.B.; Cui, X.G.; Li, Q.R. Global action on SDGs: Policy review and outlook in a post-pandemic era. Sustainability 2021, 13, 6461. [Google Scholar] [CrossRef]
  6. Williams, B.A.; Venter, O.; Allan, J.R.; Atkinson, S.C.; Rehbein, J.A.; Ward, M.; Di Marco, M.; Grantham, H.S.; Ervin, J.; Goetz, S.J.; et al. Change in terrestrial human footprint drives continued loss of intact ecosystems. One Earth 2020, 3, 371–382. [Google Scholar] [CrossRef]
  7. Josa, I.; Aguado, A. Infrastructures and society: From a literature review to a conceptual framework. J. Clean. Prod. 2019, 238, 117741. [Google Scholar] [CrossRef]
  8. Nassauer, J.I.; Raskin, J. Urban vacancy and land use legacies: A frontier for urban ecological research, design, and planning. Landsc. Urban Plan. 2014, 125, 245–253. [Google Scholar] [CrossRef]
  9. Xiao, C.; Li, P.; Feng, Z.; Zheng, F. Global border watch: From land use change to joint action. Int. J. Appl. Earth Obs. Geoinf. 2021, 103, 102494. [Google Scholar] [CrossRef]
  10. Studies of Endangered Animals on Border of China and Vietnam Stress Need for Transboundary Conservation: As Climate Change Forces Species to Migrate across Borders, Scientists Recommend Coordinated Approaches to Prevent Biodiversity Loss. Available online: www.sciencedaily.com/releases/2022/03/220322150915.htm (accessed on 12 May 2022).
  11. Norman, L.M.; Feller, M.; Guertin, D.P. Forecasting urban growth across the United States-Mexico border. Comput. Environ. Urban Syst. 2009, 33, 150–159. [Google Scholar] [CrossRef]
  12. Mu, H.W.; Li, X.C.; Wen, Y.A.; Huang, J.X.; Du, P.J.; Su, W.; Miao, S.X.; Geng, M.Q. A global record of annual terrestrial human footprint dataset from 2000 to 2018. Sci. Data 2022, 9, 176. [Google Scholar] [CrossRef]
  13. Bowler, D.E.; Bjorkman, A.D.; Dornelas, M.; Myers-Smith, I.H.; Navarro, L.M.; Niamir, A.; Supp, S.R.; Waldock, C.; Winter, M.; Vellend, M.; et al. Mapping human pressures on biodiversity across the planet uncovers anthropogenic threat complexes. People Nat. 2020, 2, 380–394. [Google Scholar] [CrossRef] [Green Version]
  14. Mammides, C. A global assessment of the human pressure on the world’s lakes. Glob. Environ. Chang. 2020, 63, 102084. [Google Scholar] [CrossRef]
  15. Vanham, D.; Leip, A.; Galli, A.; Kastner, T.; Bruckner, M.; Uwizeye, A.; van Dijk, K.; Ercin, E.; Dalin, C.; Brandão, M.; et al. Environmental footprint family to address local to planetary sustainability and deliver on the SDGs. Sci. Total Environ. 2019, 693, 133642. [Google Scholar] [CrossRef] [PubMed]
  16. Martinez-Ramos, M.; Ortiz-Rodriguez, I.A.; Pinero, D.; Dirzo, R.; Sarukhan, J. Anthropogenic disturbances jeopardize biodiversity conservation within tropical rainforest reserves. Proc. Natl. Acad. Sci. USA 2016, 113, 5323–5328. [Google Scholar] [CrossRef] [PubMed] [Green Version]
  17. Danneyrolles, V.; Dupuis, S.; Fortin, G.; Leroyer, M.; de Romer, A.; Terrail, R.; Vellend, M.; Boucher, Y.; Laflamme, J.; Bergeron, Y.; et al. Stronger influence of anthropogenic disturbance than climate change on century-scale compositional changes in northern forests. Nat. Commun. 2019, 10, 1265. [Google Scholar] [CrossRef] [PubMed]
  18. Sanderson, E.W.; Jaiteh, M.; Levy, M.A.; Redford, K.H.; Wannebo, A.V.; Woolmer, G. The human footprint and the last of the wild. Bioscience 2002, 52, 891–904. [Google Scholar] [CrossRef]
  19. Venter, O.; Sanderson, E.W.; Magrach, A.; Allan, J.R.; Beher, J.; Jones, K.R.; Possingham, H.P.; Laurance, W.F.; Wood, P.; Fekete, B.M.; et al. Sixteen years of change in the global terrestrial human footprint and implications for biodiversity conservation. Nat. Commun. 2016, 7, 12558. [Google Scholar] [CrossRef] [Green Version]
  20. Li, S.; Zhang, Y.; Wang, Z.; Li, L. Mapping human influence intensity in the Tibetan Plateau for conservation of ecological service functions. Ecosyst. Serv. 2018, 30, 276–286. [Google Scholar] [CrossRef]
  21. Antaya, A.M. Effects of Human Activity on the Distribution of Desert Bighorn Sheep Along the Border in Southwestern Arizona and Northern Sonora. Master’s Thesis, The University of Arizona, Tucson, AZ, USA, 2018. [Google Scholar]
  22. Rutt, C.D.; Coleman, K.J. The impact of the built environment on walking as a leisure-time activity along the U.S./Mexico border. J. Phys. Act. Health 2005, 2, 257–271. [Google Scholar] [CrossRef]
  23. McCallum, J. National borders matter: Canada-US regional trade patterns. Am. Econ. Rev. 1995, 85, 615–623. [Google Scholar]
  24. Ziegler, A.D.; Fox, J.M.; Xu, J. The rubber juggernaut. Science 2009, 324, 1024–1025. [Google Scholar] [CrossRef] [PubMed]
  25. Payan, T.; Cruz, P.L. Binational Commons: Institutional Development and Governance on the U.S.—Mexico Border; University of Arizona Press: Tucson, AZ, USA, 2020. [Google Scholar]
  26. Mueller, M.F.; Yoon, J.; Gorelick, S.M.; Avisse, N.; Tilmant, A. Impact of the Syrian refugee crisis on land use and transboundary freshwater resources. Proc. Natl. Acad. Sci. USA 2016, 113, 14932–14937. [Google Scholar] [CrossRef] [PubMed] [Green Version]
  27. Dai, C.W. China’s strategy for Sino-Indian boundary disputes, 1950–1962. Asian Perspect. 2019, 43, 435–457. [Google Scholar] [CrossRef]
  28. Murton, G.; Lord, A. Trans-Himalayan power corridors: Infrastructural politics and China’s Belt and Road Initiative in Nepal. Political Geogr. 2020, 77, 102100. [Google Scholar] [CrossRef]
  29. Holslag, J. The persistent military security dilemma between China and India. J. Strateg. Stud. 2009, 32, 811–840. [Google Scholar] [CrossRef]
  30. Maxwell, N. Forty years of folly: What caused the Sino-Indian border war and why the dispute is unresolved. Crit. Asian Stud. 2003, 35, 99–112. [Google Scholar] [CrossRef]
  31. Liu, H.M.; Fang, C.L.; Miao, Y.; Ma, H.T.; Zhang, Q.; Zhou, Q. Spatio-temporal evolution of population and urbanization in the countries along the Belt and Road 1950–2050. J. Geogr. Sci. 2018, 28, 919–936. [Google Scholar] [CrossRef] [Green Version]
  32. Jiang, H. Cooperation, land use, and the environment in Uxin Ju: The changing landscape of a Mongolian-Chinese borderland in China. Ann. Assoc. Am. Geogr. 2004, 94, 117–139. [Google Scholar] [CrossRef]
  33. Sturgeon, J.C. Border Landscapes: The Politics of Akha Land Use in China and Thailand; University of Washington Press: Seattle, WA, USA, 2005. [Google Scholar]
  34. Murton, G. Making mountain places into state spaces: Infrastructure, consumption, and territorial practice in a Himalayan borderland. Ann. Am. Assoc. Geogr. 2017, 107, 536–545. [Google Scholar] [CrossRef]
  35. Gu, X.S.; Womack, B. Border cooperation between China and Vietnam in the 1990s. Asian Surv. 2000, 40, 1042–1058. [Google Scholar]
  36. Schoenberger, L.; Turner, S. Negotiating remote borderland access: Small-scale trade on the Vietnam-China border. Dev. Change 2008, 39, 667–696. [Google Scholar] [CrossRef]
  37. Ge, Y.; He, Y.; Jiang, Y.; Yin, X. Border trade and regional integration. Rev. Dev. Econ. 2014, 18, 300–312. [Google Scholar] [CrossRef]
  38. Alexseev, M.A. Socioeconomic and security implications of Chinese migration in the Russian Far East. Post-Sov. Geogr. Econ. 2001, 42, 122–141. [Google Scholar] [CrossRef]
  39. Su, X.; Cai, X. Space of compromise: Border control and the limited inclusion of burmese migrants in China. Ann. Am. Assoc. Geogr. 2020, 110, 847–863. [Google Scholar] [CrossRef]
  40. Wang, X.; Ma, W.; Hua, T.; Li, D. Variation in vegetation greenness along China’s land border. Sci. China-Earth Sci. 2017, 60, 2025–2032. [Google Scholar] [CrossRef]
  41. Liu, X.; Jiang, L.; Feng, Z.; Li, P. Rubber plantation expansion related land use change along the Laos-China border region. Sustainability 2016, 8, 1011. [Google Scholar] [CrossRef] [Green Version]
  42. Song, T.; Chahine, T.; Sun, M. Ruili, China: The China-Myanmar nexus hub at the crossroads. Cities 2020, 104, 102766. [Google Scholar] [CrossRef]
  43. Lechevalier, A.; Wielgohs, J. Borders and Border Regions in Europe: Changes, Challenges and Chances; Transcript Verlag: Bielefeld, Germany, 2013. [Google Scholar]
  44. Xu, Y.; Xu, X.; Tang, Q. Human activity intensity of land surface: Concept, methods and application in China. J. Geogr. Sci. 2016, 26, 1349–1361. [Google Scholar] [CrossRef]
  45. Li, Y.; Yin, B.; Li, Y. Early warning signals for landscape connectivity and resilient conservation solutions. Land Degrad. Dev. 2019, 30, 73–83. [Google Scholar] [CrossRef] [Green Version]
  46. Zhao, G.; Liu, J.; Kuang, W.; Ouyang, Z.; Xie, Z. Disturbance impacts of land use change on biodiversity conservation priority areas across China: 1990–2010. J. Geogr. Sci. 2015, 25, 515–529. [Google Scholar] [CrossRef] [Green Version]
  47. Wang, Y.; Liu, Z.; He, C.; Xia, P.; Liu, Z.; Liu, H. Quantifying urbanization levels on the Tibetan Plateau with high-resolution nighttime light data. Geogr. Sustain. 2020, 1, 233–244. [Google Scholar] [CrossRef]
  48. Wu, R.; Yang, D.; Dong, J.; Zhang, L.; Xia, F. Regional Inequality in China Based on NPP-VIIRS Night-Time Light Imagery. Remote Sens. 2018, 10, 240. [Google Scholar] [CrossRef] [Green Version]
  49. Mellander, C.; Lobo, J.; Stolarick, K.; Matheson, Z. Night-time light data: A good proxy measure for economic activity? PLoS ONE 2015, 10, e0139779. [Google Scholar] [CrossRef] [PubMed] [Green Version]
  50. Singhal, A.; Sahu, S.; Chattopadhyay, S.; Mukherjee, A.; Bhanja, S.N. Using night time lights to find regional inequality in India and its relationship with economic development. PLoS ONE 2020, 15, e0241907. [Google Scholar] [CrossRef]
  51. Li, X.; Zhou, Y.; Zhao, M.; Zhao, X. A harmonized global nighttime light dataset 1992–2018. Sci. Data 2020, 7, 168. [Google Scholar] [CrossRef]
  52. Notteboom, T.; Pallis, A.; Rodrigue, J.-P. Port Economics, Management and Policy; Routledge: New York, NY, USA, 2022; p. 690. [Google Scholar]
  53. Okunev, I.Y.; Tislenko, M.I. Geopolitical positioning of twin cities: A case study of Narva/Ivangorod, Valga/Valka, and Blagoveshchensk/Heihe. Teor. Praksa 2017, 54, 592–605. [Google Scholar]
  54. Mikhailova, E.V. Appearance and Appliance of the Twin-Cities Concept on the Russian-Chinese Border. In Proceedings of the ISPRS/IGU/ICA Joint International Workshop on Borderlands Modelling and Understanding for Global Sustainability, Beijing, China, 5–6 December 2013; pp. 105–110. [Google Scholar]
  55. You, Z.; Feng, Z.; Lei, Y.; Yang, Y.; Li, F. Regional features and national differences in population distribution in China’s border regions (2000–2015). Sustainability 2017, 9, 336. [Google Scholar] [CrossRef] [Green Version]
  56. Huang, D.; Lang, Y.; Liu, T. Evolving population distribution in China’s border regions: Spatial differences, driving forces and policy implications. PLoS ONE 2020, 15, e0240592. [Google Scholar] [CrossRef]
  57. Stokes, E.C.; Seto, K.C. Characterizing urban infrastructural transitions for the Sustainable Development Goals using multi-temporal land, population, and nighttime light data. Remote Sens. Environ. 2019, 234, 111430. [Google Scholar] [CrossRef]
  58. Duoping, Z.; Gennian, S.; Jianjun, S. Research on tourist flow evolution trends and motivation analysis of China’s border tourism: A comparative case study of Xinjiang, Inner Mongolia and Yunnan. Hum. Geogr. 2012, 27, 134–139. [Google Scholar] [CrossRef]
  59. Song, T.; Cheng, Y.; Liu, W.; Liu, H. Spatial difference and mechanisms of influence of geo-economy in the border areas of China. J. Geogr. Sci. 2017, 27, 1463–1480. [Google Scholar] [CrossRef] [Green Version]
  60. Davis, A.E.; Gamble, R.; Roche, G.; Gawne, L. International relations and the Himalaya: Connecting ecologies, cultures and geopolitics. Aust. J. Int. Aff. 2021, 75, 15–35. [Google Scholar] [CrossRef]
  61. Fang, C.; Liu, H.; Wang, S. The coupling curve between urbanization and the eco-environment: China’s urban agglomeration as a case study. Ecol. Indic. 2021, 130, 108107. [Google Scholar] [CrossRef]
  62. Liu, H.; Cui, W.; Zhang, M. Exploring the causal relationship between urbanization and air pollution: Evidence from China. Sustain. Cities Soc. 2022, 80, 103783. [Google Scholar] [CrossRef]
  63. Shen, W.; Zhang, J.; Zhou, X.; Li, S.; Geng, X. How to Perceive the Trade-Off of Economic and Ecological Intensity of Land Use in a City? A Functional Zones-Based Case Study of Tangshan, China. Land 2021, 10, 551. [Google Scholar] [CrossRef]
  64. Ji, G.; Song, H.; Wei, H.; Wu, L. Attribution Analysis of Climate and Anthropic Factors on Runoff and Vegetation Changes in the Source Area of the Yangtze River from 1982 to 2016. Land 2021, 10, 612. [Google Scholar] [CrossRef]
  65. Mi, X.C.; Feng, G.; Hu, Y.B.; Zhang, J.; Chen, L.; Corlett, R.T.; Hughes, A.C.; Pimm, S.; Schmid, B.; Shi, S.H.; et al. The global significance of biodiversity science in China: An overview. Natl. Sci. Rev. 2021, 8, nwab032. [Google Scholar] [CrossRef]
  66. Tang, D.M.; Fan, H.; Yang, K.; Zhang, Y. Mapping forest disturbance across the China-Laos border using annual Landsat time series. Int. J. Remote Sens. 2019, 40, 2895–2915. [Google Scholar] [CrossRef]
  67. Wang, L.; Yang, B.; Bai, Y.; Lu, X.Q.; Corlett, R.T.; Tan, Y.H.; Chen, X.Y.; Zhu, J.G.; Liu, Y.; Quan, R.C. Conservation planning on China’s borders with Myanmar, Laos, and Vietnam. Conserv. Biol. 2021, 35, 1797–1808. [Google Scholar] [CrossRef]
  68. Liu, H.M.; Fang, C.L.; Fang, K. Coupled human and natural cube: A novel framework for analyzing the multiple interactions between humans and nature. J. Geogr. Sci. 2020, 30, 355–377. [Google Scholar] [CrossRef]
  69. Kang, S.C.; Zhang, Q.G.; Qian, Y.; Ji, Z.M.; Li, C.L.; Cong, Z.Y.; Zhang, Y.L.; Guo, J.M.; Du, W.T.; Huang, J.; et al. Linking atmospheric pollution to cryospheric change in the Third Pole region: Current progress and future prospects. Natl. Sci. Rev. 2019, 6, 796–809. [Google Scholar] [CrossRef] [PubMed]
  70. Hull, V.; Liu, J. Telecoupling: A new frontier for global sustainability. Ecol. Soc. 2018, 23, 41. [Google Scholar] [CrossRef]
Figure 1. Study area.
Land 11 01089 g001
Figure 2. Flowchart of the methodology.
Land 11 01089 g002
Figure 3. Overall changes in the study area between China and its neighboring countries.
Land 11 01089 g003
Figure 4. The average HAI, 1992–2020.
Land 11 01089 g004
Figure 5. HAI changes between China and its neighboring countries.
Land 11 01089 g005
Figure 6. HAI changes in selected regions, 1992–2020. (A). The Sino-Russian border area, including the Fuyuan Delta, Heihe; (B). The east part of the Sino-Indian border area, including Assam in India and Nyingchi in China; (C). China–Kazakhstan border area, including Bortala Mongolian Autonomous Prefecture and Yining city in China, and the Almaty Region in Kazakhstan; (D). China and the Indo-China Peninsula border area, including the cross-border regions between China and Myan-mar, Laos, and Vietnam.
Land 11 01089 g006
Figure 7. High HAI areas change form. Unilateral expansion areas (AC); Bilateral expansion areas (DF); Cross-border integration areas (G,H).
Land 11 01089 g007
Table 1. Land cover datasets and sub-HAI scores.
Land TypeDescriptionSub-HAI Score
SettlementUrban areas10
Agricultural landCropland, rainfed6
Cropland, irrigated or post-flooding4
Cropland, rainfed, herbaceous cover3
Cropland, rainfed, tree, or shrub cover3
Mosaic cropland (>50%)/natural vegetation (tree, shrub, herbaceous cover) (<50%)3
GrasslandGrassland2
Mosaic herbaceous cover (>50%)/tree and shrub (<50%)2
WaterWater bodies1
OthersOthers0
Table 2. The classification and description of HAI.
HAI TypesHAI RangingDescription
High>4Area with dense population, relatively developed economy, and urban landscape.
Relatively high3–4Distributed in suburban areas, scattered towns, rural areas, industrial and mining areas.
Relatively low1–3There are traces of human cultivation, mainly farmland and grassland.
Low0.1–1It is basically the same as the natural coverage of forests, lakes, alpine meadows, etc., but there are occasional human activities.
Very Low<0.1Consistent with exposed areas such as plateaus and deserts, they are extremely difficult to reach or unsuitable areas for human habitation.
Publisher’s Note: MDPI stays neutral with regard to jurisdictional claims in published maps and institutional affiliations.

