
Effects of Monocropping on Land Cover Transitions in the Wet Evergreen Agro-Ecological Zone of Ghana

1
Institute for Environment and Sanitation Studies, (IESS), College of Basic and Applied Science, University of Ghana, Legon P.O. Box LG 25, Ghana
2
Department of Natural Resources and Geo-Information Sciences, Nyankpala Campus, University for Development Studies, Tamale P.O. Box TL 1350, Ghana
3
Department of Human Geography, Planning and International, Faculty of Social and Behavioural Sciences, University of Amsterdam, 1012 WX Amsterdam, The Netherlands
4
Department of Environmental Science, Ho Technical University, Ho P.O. Box HP 217, Ghana
5
Center of Remote Sensing and Geo-Information Services, (CERSGIS), PMB 17, Legon Post Office, University of Ghana, Legon P.O. Box LG 25, Ghana
*
Author to whom correspondence should be addressed.
Land 2022, 11(7), 1063; https://doi.org/10.3390/land11071063
Submission received: 23 May 2022
/
Revised: 6 July 2022
/
Accepted: 7 July 2022
/
Published: 12 July 2022
(This article belongs to the Special Issue Social and Environmental Trade-Offs in African Agriculture: Achieving Sustainable Development Goals)
Abstract
:The wet evergreen forest ecological zone of Ghana is undergoing notable structural changes, although most maps erroneously depict the area to be an intact forest. Several hectares of plantation agriculture such as rubber, oil palm, and cocoa are replacing the natural vegetation and habitats, thereby threatening indigenous biodiversity. This study aimed to assess the effects of tree monocrop proliferation on landscape transitions between 1986 and 2020 in the Wassa East District of Ghana. The ISODATA clustering technique was used to produce land cover category maps from Landsat images of 1986, 2002, and 2020. A post-classification change detection technique resulted in transition matrices which were used for the computation of land cover transition intensities over 34 years. The results showed that the landscape was dominated by forests in 1986. Still, the forest continuously declined by 34% (1% annually) in 2020 while all other land cover types increased in both periods with cocoa covering 23% oil palm covering 14%, and rubber covering 2% of the land area. These conversions in the land area are important, especially since the closed forests usually transition to monocrops through the intermediate process: food crop farming. This information is essential for decision making on land development and biodiversity conservation.
Keywords:
monocrops; tree crops; change detection; interval; categorical; transition; intensity analysis1. Introduction
Monoculture farming is debatable in today’s agricultural industry [1,2]. Monoculture (or monocropping), as opposed to polyculture, is an agriculture type based on growing only one kind of crop at a time in the same field [3,4]. The switch to monocropping is exacerbated as the global population increases and crop demand keeps rising as it is believed to produce high yields. Furthermore, the management of such systems is relatively simpler. Tree monocrops (commodity crops) are efficient as they offer long-term productivity and profitability [5]. Market availability and technology accessibility seem to make monocropping the way to go. Despite these advantages, monocrops have a myriad of negative effects on people’s socio-economic and environmental lives. In the past, they were planted in guided ecosystems such as cocoa and coffee agroforestry systems [6,7]; however, the quest for high yields and ease of management has led some farmers to switch from traditional understory agroforestry systems to monocropping systems. These farming practices discourage the preservation of farmland biodiversity [8]. Aside from biodiversity loss, soil erosion and degradation, and increased exposure to climate change, pests and diseases are associated with tropical cocoa farms cultivated in full-sun monocultures [5]. Another disadvantage is that smallholder farmers’ intensive monocropping adoption is limited due to a lack of capital and credit [9]. The enhanced technologies for monoculture, especially rubber cultivation, make it unsuitable for smallholders with dissimilar needs, resources, and risks [9]. This, according to farmers’ communication, has left ownership of large tracts of monocrops in the hands of a few affluent investors, mainly from the cities.
Ghana’s rainforests have undergone substantial depletion over the years attributable to diverse human activities, including legal and illegal logging, mining, agriculture, and settlement expansion [10,11,12]. Agriculture is touted as the backbone of the Ghanaian economy and a major foreign exchange earner contributing about 35% to the gross domestic product (GDP), employing 55% of Ghana’s population on a formal and informal basis, and responsible for about 45% of all export earnings [13]. While it has a significant economic association at various scales, there are anthropogenic impacts on natural habitats via fragmentation and habitat loss in landscapes [14]. Destruction of habitats takes the form of altering natural habitats so that they cease to support the species they initially sustained [15]. The exposed flora and fauna become wiped out or dislocated. Fragmentation encompasses the spatial organization of the residual habitat after the habitat loss, especially the frequency of habitat edges [14].
In Ghana, the renewed emphasis on food self-sufficiency and rural agro-employment may likely cause the expansion of agricultural activities and conversion of forest lands into other uses. In the long term, such uncontrolled expansionist agro-production systems are unsustainable. Such infractions on the natural environment destabilize the ecosystem processes that are fundamental to the sustainable production of food and commodities and the wellbeing of smallholder farmers [16]. The ongoing threats to forests and biodiversity from food and cash crop production are less acknowledged in production landscapes outside protected forests. In some cases, reserved forests are encroached upon gradually on the blind side of authorities [17]. Similarly, there are increasing inequalities and marginalization of agriculture or forest-dependent communities when lands are taken for large-scale farming which undermines the livelihoods of forest fringe communities [18]. To safeguard rural livelihoods, planning and decision making about the resource must involve forest fringe and forest-dependent communities to provide firsthand insight on aspects of the landscape that are critical to their wellbeing [19]. Without better trade-off management between production, conservation, and socio-economic impacts, Ghana will likely lose most of its remaining forest and woodlands due to the desire to provide and sustain the livelihood of people.
Most natural habitats are being replaced with large hectares of monocrops such as cocoa, oil palm, and rubber plantations, thus threatening indigenous biodiversity [20]. The wet and moist evergreen ecological zones in south-western Ghana are suitable for cultivating commodity crops such as cocoa, rubber, and oil palm. Expansive areas of south-western Ghana hitherto covered by primary forests have reduced drastically due to the conversion of forested areas to tree crop plantations mainly comprising cocoa, rubber, oil palm, and coconut [21]. Mining of minerals has also over the years resulted in the increased clearing of vegetation in Ghana, affecting hydrological regimes. It also destroys relevant soil organisms and destabilizes soil aggregates, thereby dispossessing the soil of organic matter which supports soil fertility needed for vegetation growth [22].
Forest cover loss has accelerated in recent decades [12,21,23]. The loss of forest cover attributed to anthropogenic causes in Ghana is currently alarming and progressing at an annual rate of 2%; thus, approximately 135,000 hectares annually [23]. The high deforestation rate can partly be traced to Ghana’s 1948 forest policy which established and protected forest reserves and allocated the remaining lands for conversion to other land uses [24]. Subsequently, the World Bank-supported structural adjustment program exacerbated the pressure through intensified timber extraction and agriculture expansion, which are particular commodities obtained from the landscapes [25]. In recent times, the continuous conversion of forests to or a switch to commodity monocrops is mainly driven by farmers’ response to the Ghana government’s incentive programs and the integration of smallholder farmers in global value chains. Other factors are direct financial benefits, culture, and the means to access and hold onto lands [26]. For the achievement of the tree crop subsector’s contribution to rural poverty reduction, the government seeks to expand and develop it by establishing the Tree Crop Development Authority (Ghana) (TCDA). However, less consideration has been given to the effects of monocrop proliferation on the physical state and trade-offs at the landscape level. To inform decision making, there is a need for insights into the structural changes caused by monocrops and their associated socio-cultural contributions to landscape services. Multi-temporal landscape studies have often merged tree monocrops with other crops while others treat them as part of open forests [27]. These miscategorizations of tree monocrops mask the spatial and structural dynamics attributable to the increased farmer participation in landscapes. Attempts to separate these commodity monocrops have been few and sometimes focused on specific crops [7,10,27].
This research focused on the combined effects of monocrops on landscapes. This study aimed to assess the effects of monocrop proliferation on landscape transitions between 1986 and 2020 in the Wassa East District of Ghana.
This consists of, firstly, mapping out the monoculture crops from nature, and secondly, unravelling the effects of monocrops in an ecologically diverse landscape. Monocrops such as cocoa, oil palm, and rubber are usually held as smallholder systems and mostly erroneously mapped as forests. The extra challenge posed by the research question was to compare the processes of land transitions of monocrop categories to land cover change outside the monocrop zones.
2. Materials and Methods
2.1. Study Area
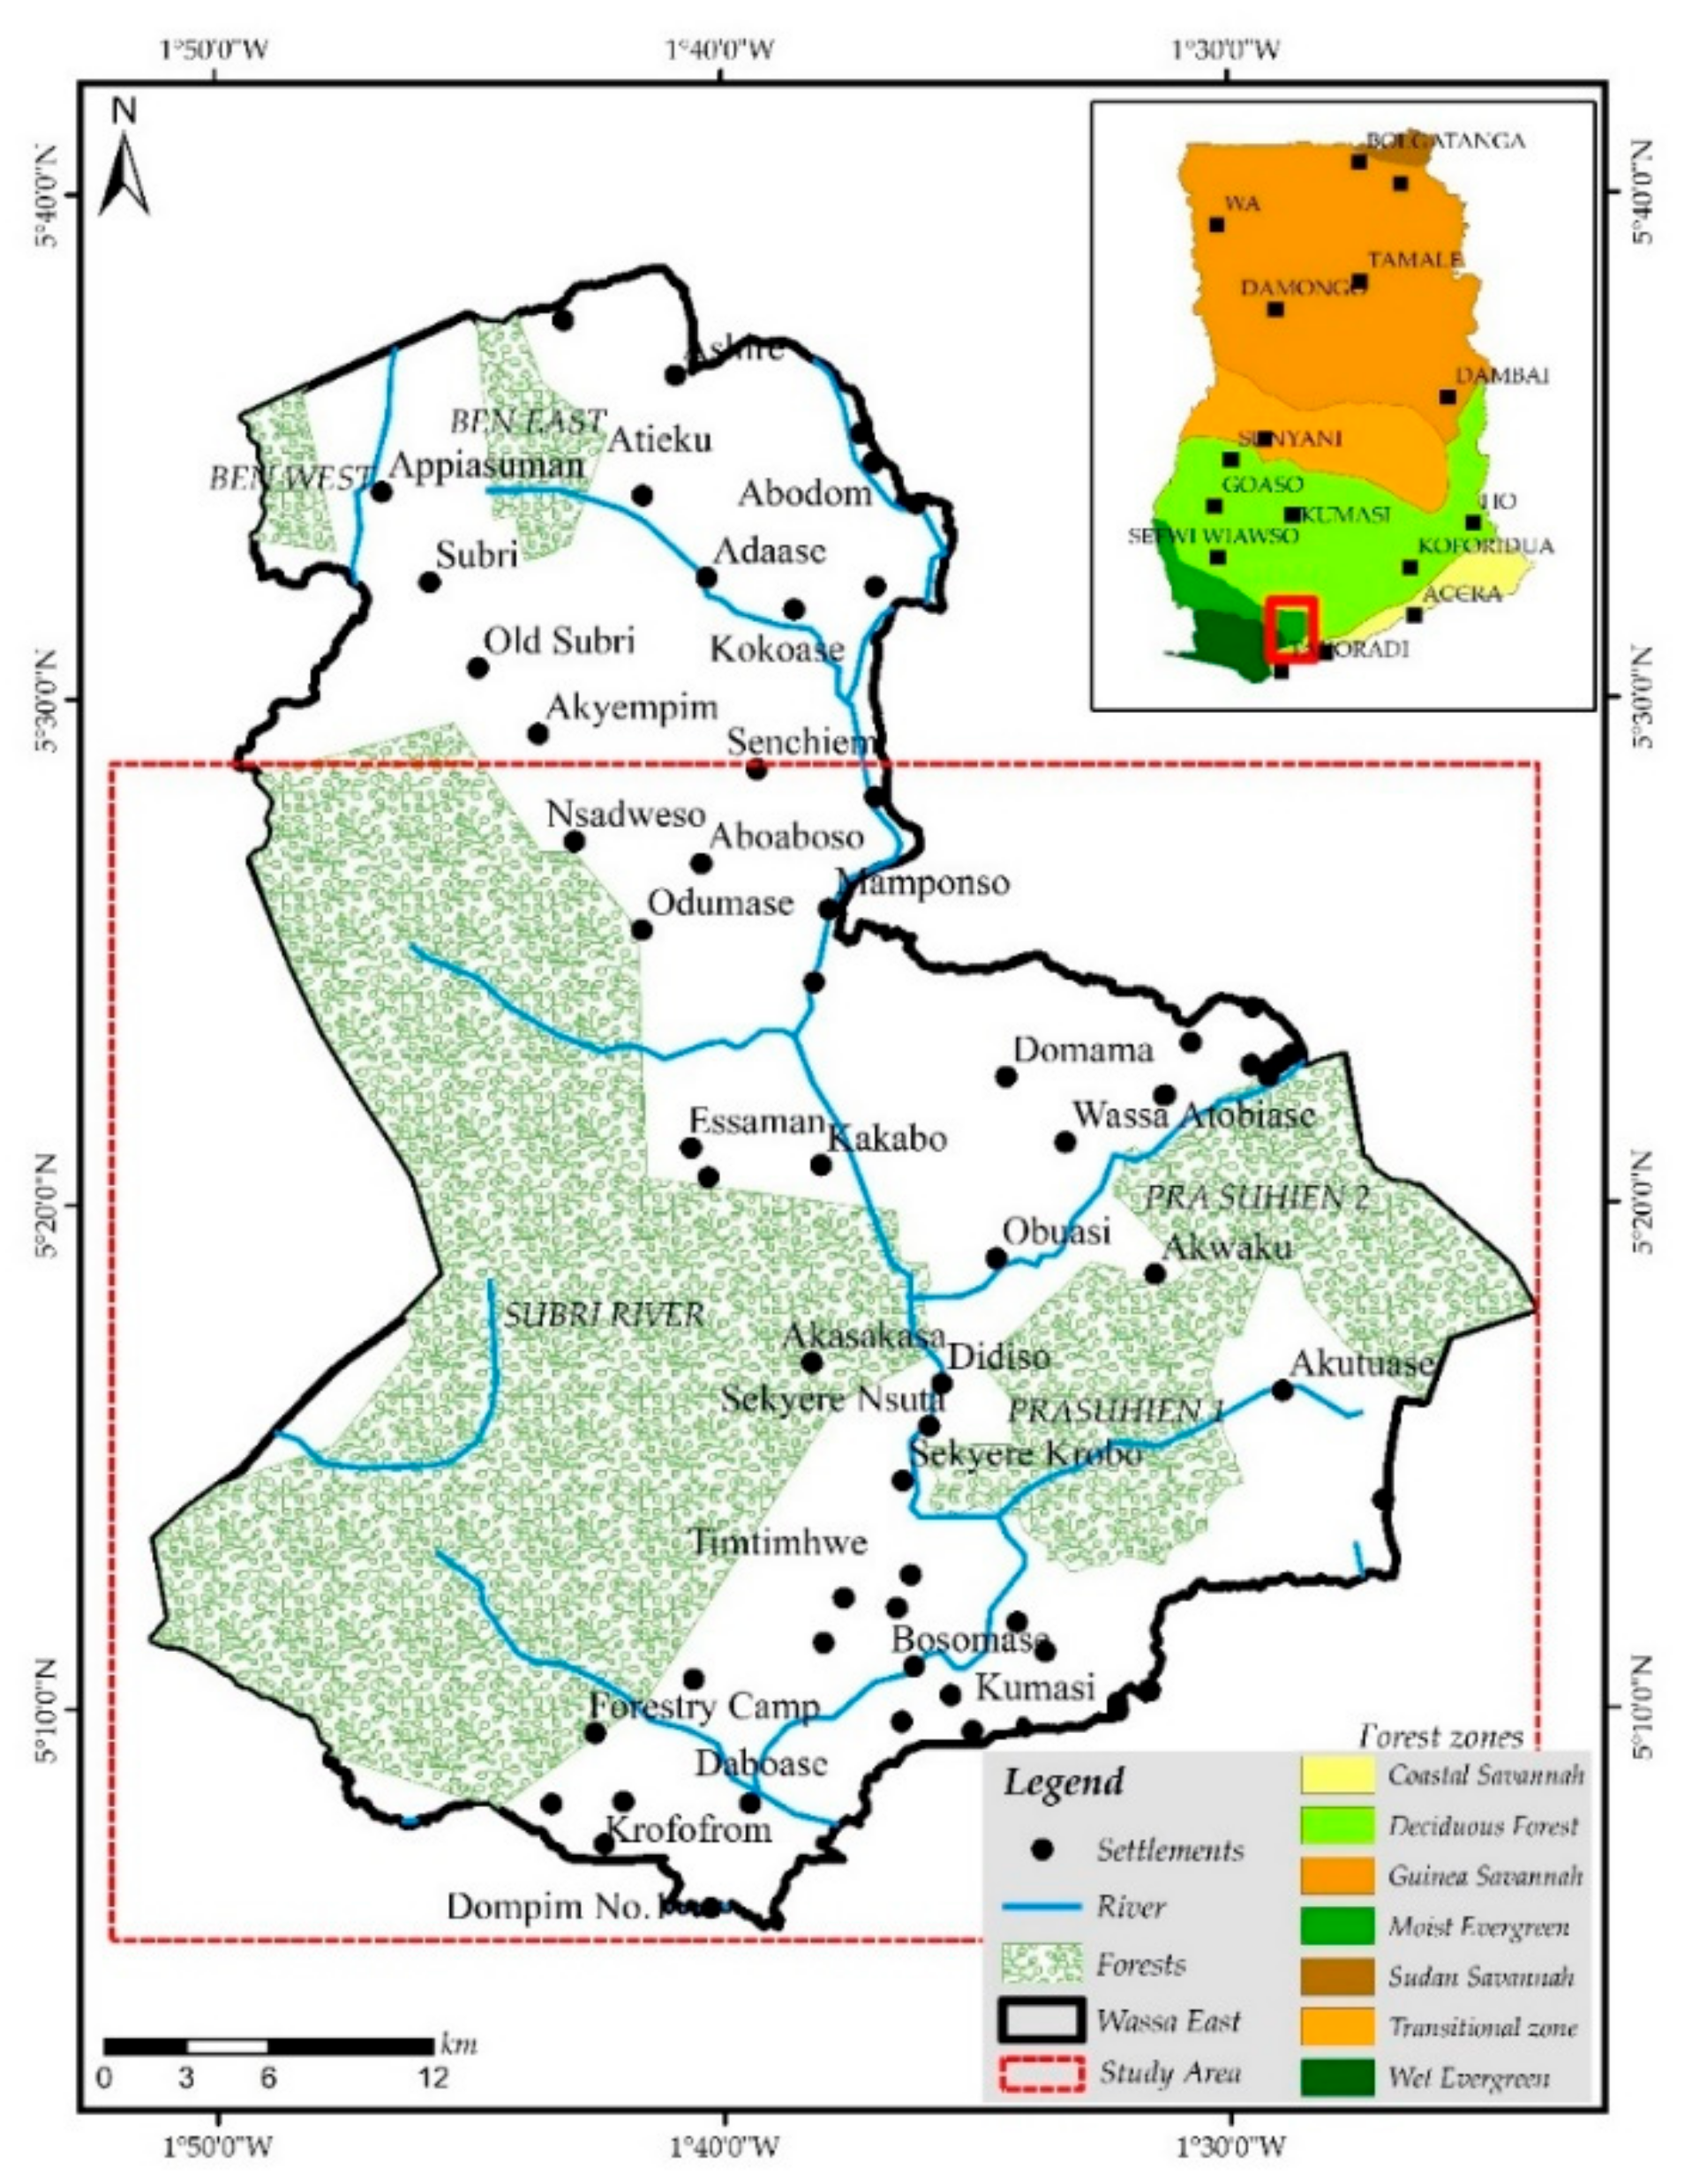
The study area is part of the Wassa East District in the Western Region of Ghana. The Wassa East landscape stretches between latitudes 1°54′13.0″ W and 1°23′45.0″ W and longitudes 5°5′10.0″ N and 5°29′42.0″ N with an area of 1289 km2. The main communities within the Wassa East district are Daboase, Sekyere Krobo, Dompim No.1, Kakabo, and Sekyere Aboaboso.
The forest ecological zones in the landscape comprise mainly the wet evergreen and moist evergreen zones and partly deciduous forests and coastal savannah (Figure 1). The wet evergreen forest is restricted to the highest rainfall (1500–2100 mm) areas with an average annual temperature of 30 °C and consists of the highest concentration of rare and endemic species in the country [28]. The Wassa East landscape has two national forest reserves, namely, the Subri River Forest Reserve (375 km2) and the Pra Suhyen Forest Reserve (204 km2) with a largely dendritic drainage pattern of rivers including the Pra, Subri, Butre, Brempong, Suhyen, Abetumaso, Hwini, and Tipae, most of which originate from the Akwapim Ranges and flow southwards toward the coast [29]. Agriculture is the area’s dominant economic activity, employing about 71% of the people who traditionally engage in “slash and burn” farming and use simple farm tools such as the hoe and cutlass [29]. The main staple food crops grown are cassava, plantain, maize, cocoyam, and vegetables, and tree crops such as cocoa, oil palm, and rubber are cultivated for cash [29,30].
2.2. Data and Data Sources
The study extensively applied geographic information systems (GISs) and remote sensing technologies to analyze changes in the landscape using Landsat satellite images. These images are excellent sources of current or historical information on places or phenomena. The study applied three Landsat satellite images (Table 1), land cover reference data from the Google Earth platform, and field data collection campaigns. The choice of the Landsat was based on the coverage of the study area, accessibility of archived historical data for the site since 1986, and medium spatial and multispectral resolution. The Landsat path/row (194/056) covers mainly the south-western side of Ghana, including the Wassa East landscape. The temporal resolution of Landsat is 16 days; however, achieving cloud-free images with optical remote sensors for the high forest zones is rare [31]. For these reasons, data covering the south-western and coastal areas in Ghana have high clouds and heavy haze, making most of them unsuitable for analysis. Historical remote sensing data are required to understand the dynamics of land cover and use under the combined influence of natural and anthropogenic activities in the Western Region of Ghana. The Landsat data series has widely been used in historical territorial studies because it is open source, has a rich historical archive, and has a medium spatial resolution (30 m) [32]. We analyzed two different data cohorts to show the pattern of land cover exchanges that took place since 1986. The choice of the years 1986, 2002, and 2020 was influenced by the availability of cloud-free satellite image scenes and the dates that give us an almost equal interval. We originally wanted to look at 10 years of difference but the absence of cloud-free data restricted us to 1986, 2002, and 2020 images. The selected satellite images include Landsat 5 TM (Thematic Mapper) (1986), Landsat 7 ETM+ (Enhanced Thematic Mapper Plus) (2002), and Landsat 8 OLI (Operational Land Imager) (2020). All the surface reflectance Landsat images were downloaded from the USGS Earth Explorer (http://earthexplorer.usgs.gov, accessed on 14 January 2020 online data-clearing house. These different generations of Landsat sensors and images have relatively comparable spectral and spatial resolutions that were important for the study. Although the images were captured on different dates, they are all dry season data spanning between December and January. It was decided to use data captured within the dry season to avoid significant seasonal differences in scene illumination which might culminate into false changes in the change detection analysis [33,34]. The choice of dry season data also helped to avoid the problem of cloud cover, a common feature in images of the tropical zone [35].
Primary data were gathered from the field, and historical Google Earth maps were used to assess the validity of the classification maps. Thirty (30) field samples per land cover class were identified during the fieldwork campaign across the Wassa East landscape to assess the accuracy of the classification map derived from the Landsat 8 OLI image. A total of 316 point sample units of the recognized land cover types were collected using a handheld global positioning system (GPS). In addition to the location data, we gathered data on land cover types and descriptions of the surrounding environment and took digital photos. An area sample with a minimum size of 900 m2 was preferred to a single-point location to ensure that the sampled areas coincided with the respective pixel of the image. Where possible, oral narration about the land cover and the respective changes over the period was also obtained from community leaders who stayed in the landscape and have historical knowledge of the changes.
An additional 10 to 20 field samples were extracted from Google Earth’s high spatial resolution to supplement data on inaccessible areas in the field. Data extraction was carried out by visual identification of land cover types and onscreen digitizing on the Google Earth platform. Point samples from the two sources were combined and categorized by land cover types. Additionally, there were no readily available historical maps for validation. Rather, a knowledge of the landscape composition for the past two years was obtained through key respondent interviews [10,36,37] with 34 local leaders and elderly people from Daboase, Dompim no. 1, Aboaboso, Sekyere Heman, Sekyere Krobo, and Essaman. Additionally, the historical imagery of Google Earth was a useful aid in gathering historical information on the land cover. This was done by scaling backwards in time to look at a point in Google Earth. Image interpretation elements (tone, colour, shape, and pattern) were used to visually detect the land cover types [38]. Pixels were collected as reference data from “known” features within the unprocessed 1986 Landsat-5 TM image, Landsat-7 ETM+, and from historical Google Earth images to assess the quality of the classification. The techniques suggested by [39] were applied to measure map quality by approximating the omission and commission errors using the change matrix.
2.3. Data Preparation and Mapping
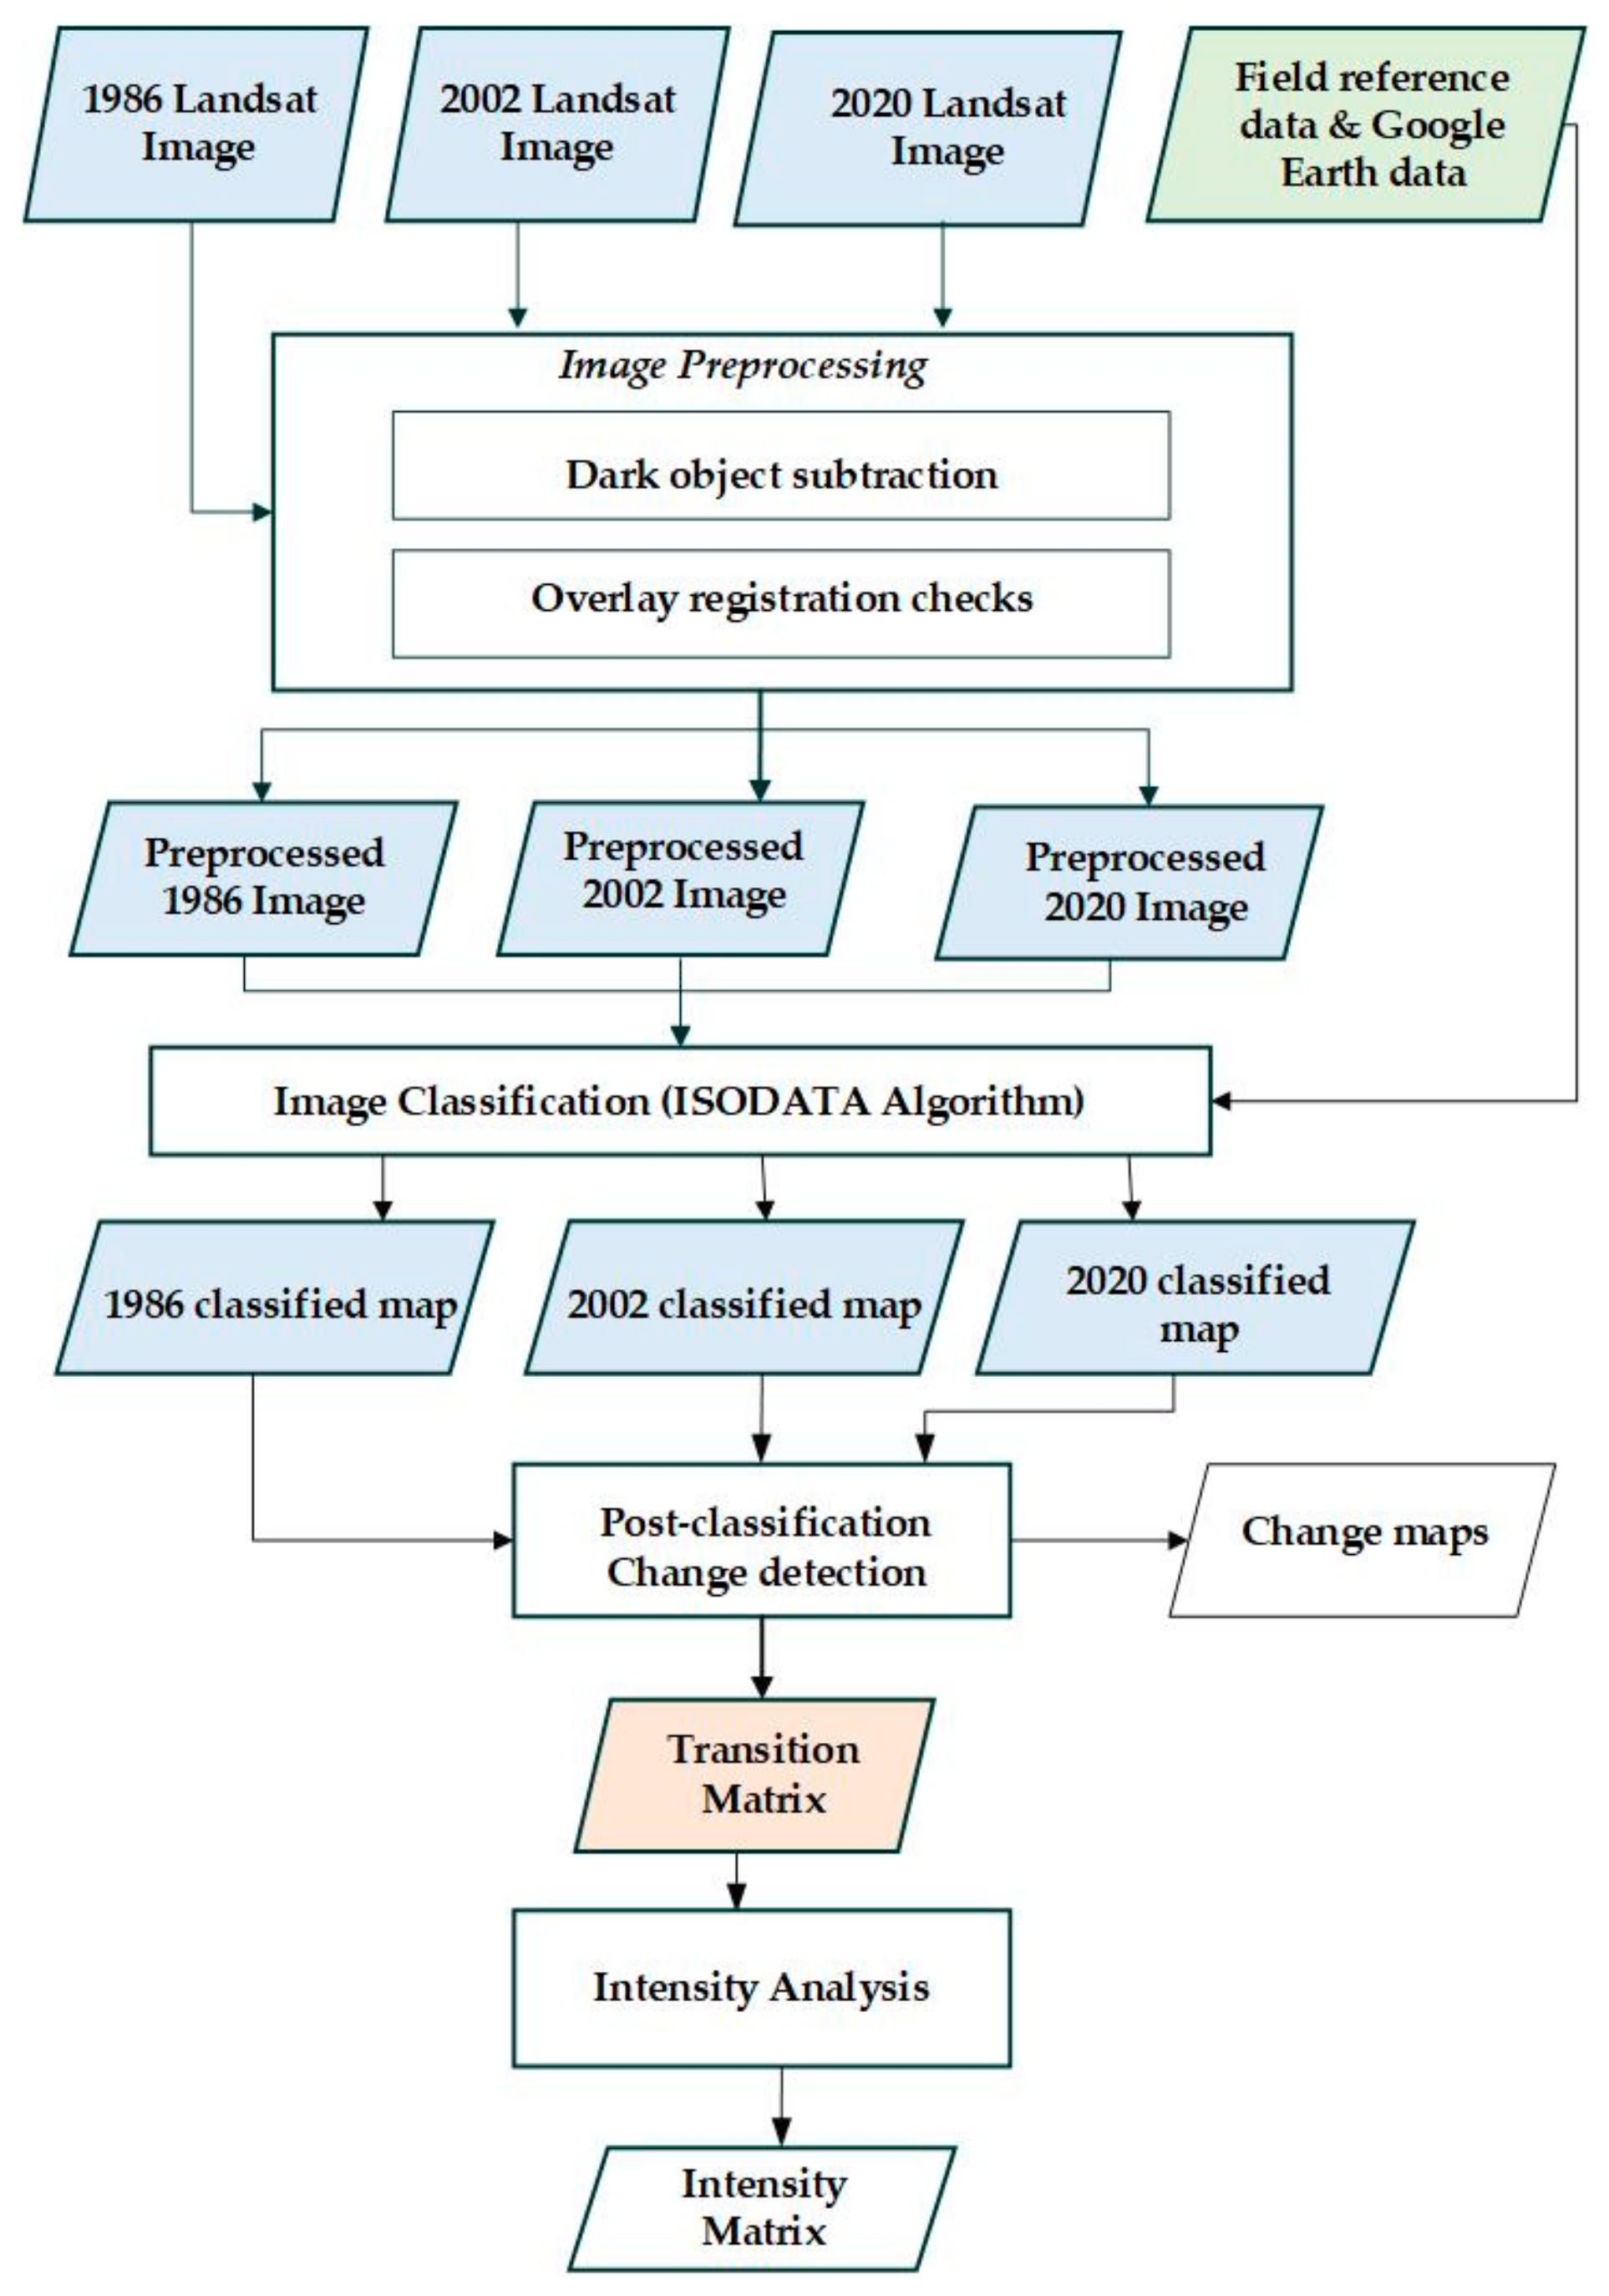
The land cover mapping stages consist of developing a land cover classification scheme (Figure 2) image pre-processing, and image classification. A well-defined classification scheme is fundamental to the success of any land cover identification and classification. The dominant land covers (or land categories) classified were identified through the Wassa East Ministry of Food and Agriculture (MoFA) and Forestry Commission of Ghana (FC) stakeholder interactions and the literature [10].
Image pre-processing consists of all the preliminary operations administered to the raw satellite images to minimize or completely remove errors due to the sensor and platform-specific radiometric and geometric misrepresentations. The atmospheric and geometric defects associated with the Landsat images were resolved by applying surface reflectance images pre-processed with Landsat Ecosystem Disturbance Adaptive Processing System and Landsat Surface Reflectance Code [40]. Furthermore, dark object subtraction was applied to minimize the effects of the residual haze on the three images using pixels from the visible waterbody of the image [41]. Swiping the overlaid images over each other was employed to ensure they are co-registered and devoid of spatial mismatch. Ensuring that a pixel in a geographic location was compared with the same pixel in another image of a different date ensured a correct change detection result. If pixels are non-aligned or not in the same geographic space, the change results are not representative and therefore have to be realigned (co-registering) using the software. The final step was to subset the three images to align with the coverage of the Wassa East landscape.
Initially, we analyzed the remote sensing images using a chain classification method to identify various natural and human-developed features present on the land surface into land cover categories. The study applied an unsupervised image classification by interlinking the process of identifying land features in the dataset to be a member of one of the inherent categories present in the image collection without using labelled training samples [42]. The unsupervised classification process used was the Iterative Self Organizing Data Analysis (ISODATA) algorithm in Erdas Imagine version 2014. The ISODATA algorithm was chosen over K-means in the unsupervised classification since it permits differing numbers of clusters on a dataset while the former assumes a known cluster number [43]. Moreover, the unsupervised classification algorithm was applied since it statistically groups image pixels into a specified number of spectral classes based on the pixel values rather than comparing it to reference data [44] which were lacking for the 1986 and 2002 maps.
Applying the algorithm to the three images, a series of iterations were run to group the images’ pixels into fifty class profiles, which were subsequently regrouped into representative eight classes listed in Table 2 based on the study objectives and the spatial resolution of the images (30 m). The eight map classes were identified, namely, closed forest, open forest, farmland and fallow, waterbody, built-up and bare, rubber, oil palm, and cocoa. Some classes including farmland and fallow and built-up and bare could not be clearly distinguished and therefore were merged into one class. Specific known sites of monocrop plantations that were misclassified as forests were manually digitized onscreen into their correct classes (such as cocoa, rubber, and oil palm) to enhance the accuracy and usefulness of the map [45].
The ArcGIS and Erdas Imagine [46] GIS packages were used for elementary procedures such as data visualization and mapping, and programmed transition excel sheets by [47] were used to analyze interval, categorical, and transition intensity patterns of land categories in 1986–2002 and 2002–2020 time intervals in Wassa East landscape.
2.4. Change Detection and Intensity Analysis
Intensity analysis is an accounting framework that analyzes transitions among categories between consecutive time points [48]. It refers to the measurable approach applied in analyzing maps of land categories from different points in time for a single site by using contingency tables or matrices, where one matrix recaps the change in each time interval [39]. This process accounts for land transition intensities by solving three-level interrelated questions on the interval, category, and transition [48]. The interval question compares the speed of change, in terms of size and intensity, among time intervals [47,48]. The category level examines each category in terms of size and intensity of gross loss and gross gain in each site during each time interval [47,48]. Finally, the transition level questions seek to understand the intensity with which the gain of a specific category or class transitions from other categories in each period [47]. It relates the transitions in terms of size and intensity in each site [48]. The three-level analysis enables the research agenda to discover the processes and causes of change [47].
Post-classification change detection was applied to determine the landscape compositional changes that occurred in the two periods, 1986–2002 and 2002–2020. Through a post-classification approach, the detected landscape variations were the apparent changes and/or growths that have occurred over three decades. This approach was used to generate transition matrices that show the detailed land exchanges between the respective land cover types and the unchanged areas. Like the one presented in Table 3, the transition matrix is the first step in assessing the changes in land cover and use types between the two time periods. The matrix illustrates the sizes of land cover coverages (and percentage areas) in the initial year and the changes that existed until the concluding year. The diagonal values of the transition matrix represent the persistent land cover classes, while the off-diagonal values represent the transitions in land cover types in the period in perspective. These matrices are generated through overlays of two maps of the same place for two different time points. The rows show the proportions of the four classes at the initial time (i.e., 1986), and the columns illustrate the identical order of class types at the subsequent time (i.e., 2020). The diagonal elements (that is, Cjj) indicate the number of land classes that showed persistence of class j, while the off-diagonal values show the size of the land that changed from the initial class to the consequent category during the time interval.
Matrices are inputs used in the intensity analysis to show the spatial distribution of change. Matrices can be used to calculate the gains, losses, net changes, and swaps to offer detailed insights into the nature of the changes in the landscape [40]. Gross losses are the sum of all proportions for each land cover type in the before-image that transitioned to other land cover types in the after-image and are determined by subtracting the persistent land category from the total in the right-hand column (Cj+–Cjj). Gross gains refer to the sum of all areas per land cover type transitioned from other land cover types by the after-image [49]. The net change of a class category is the difference between gross gain and gross loss. Additionally, a concurrent gain and loss of a category in the landscape is termed a swap [50]. A swap is determined as the difference between the total and net change for the before and after-images [40]. Moreover, the swap is double the loss or gain if the net change is zero (implying gain is equal to loss) [50].
The computations on class attributes also consist of change and rates, the spatial distribution of change, and transitions over time [51]. The annual rates of change in the respective land cover types were computed for each period. The rate of change in the class area over a period is calculated by subtracting the total coverage of Year 2 from Year 1 and dividing the result by Year 2. The annual coverage is a derivative of dividing the rate of change of class coverage by the number of years shown in the equation below.
The formula for calculating the annual rate of change [49]:
3. Results
3.1. Land Cover Types and Their Distribution
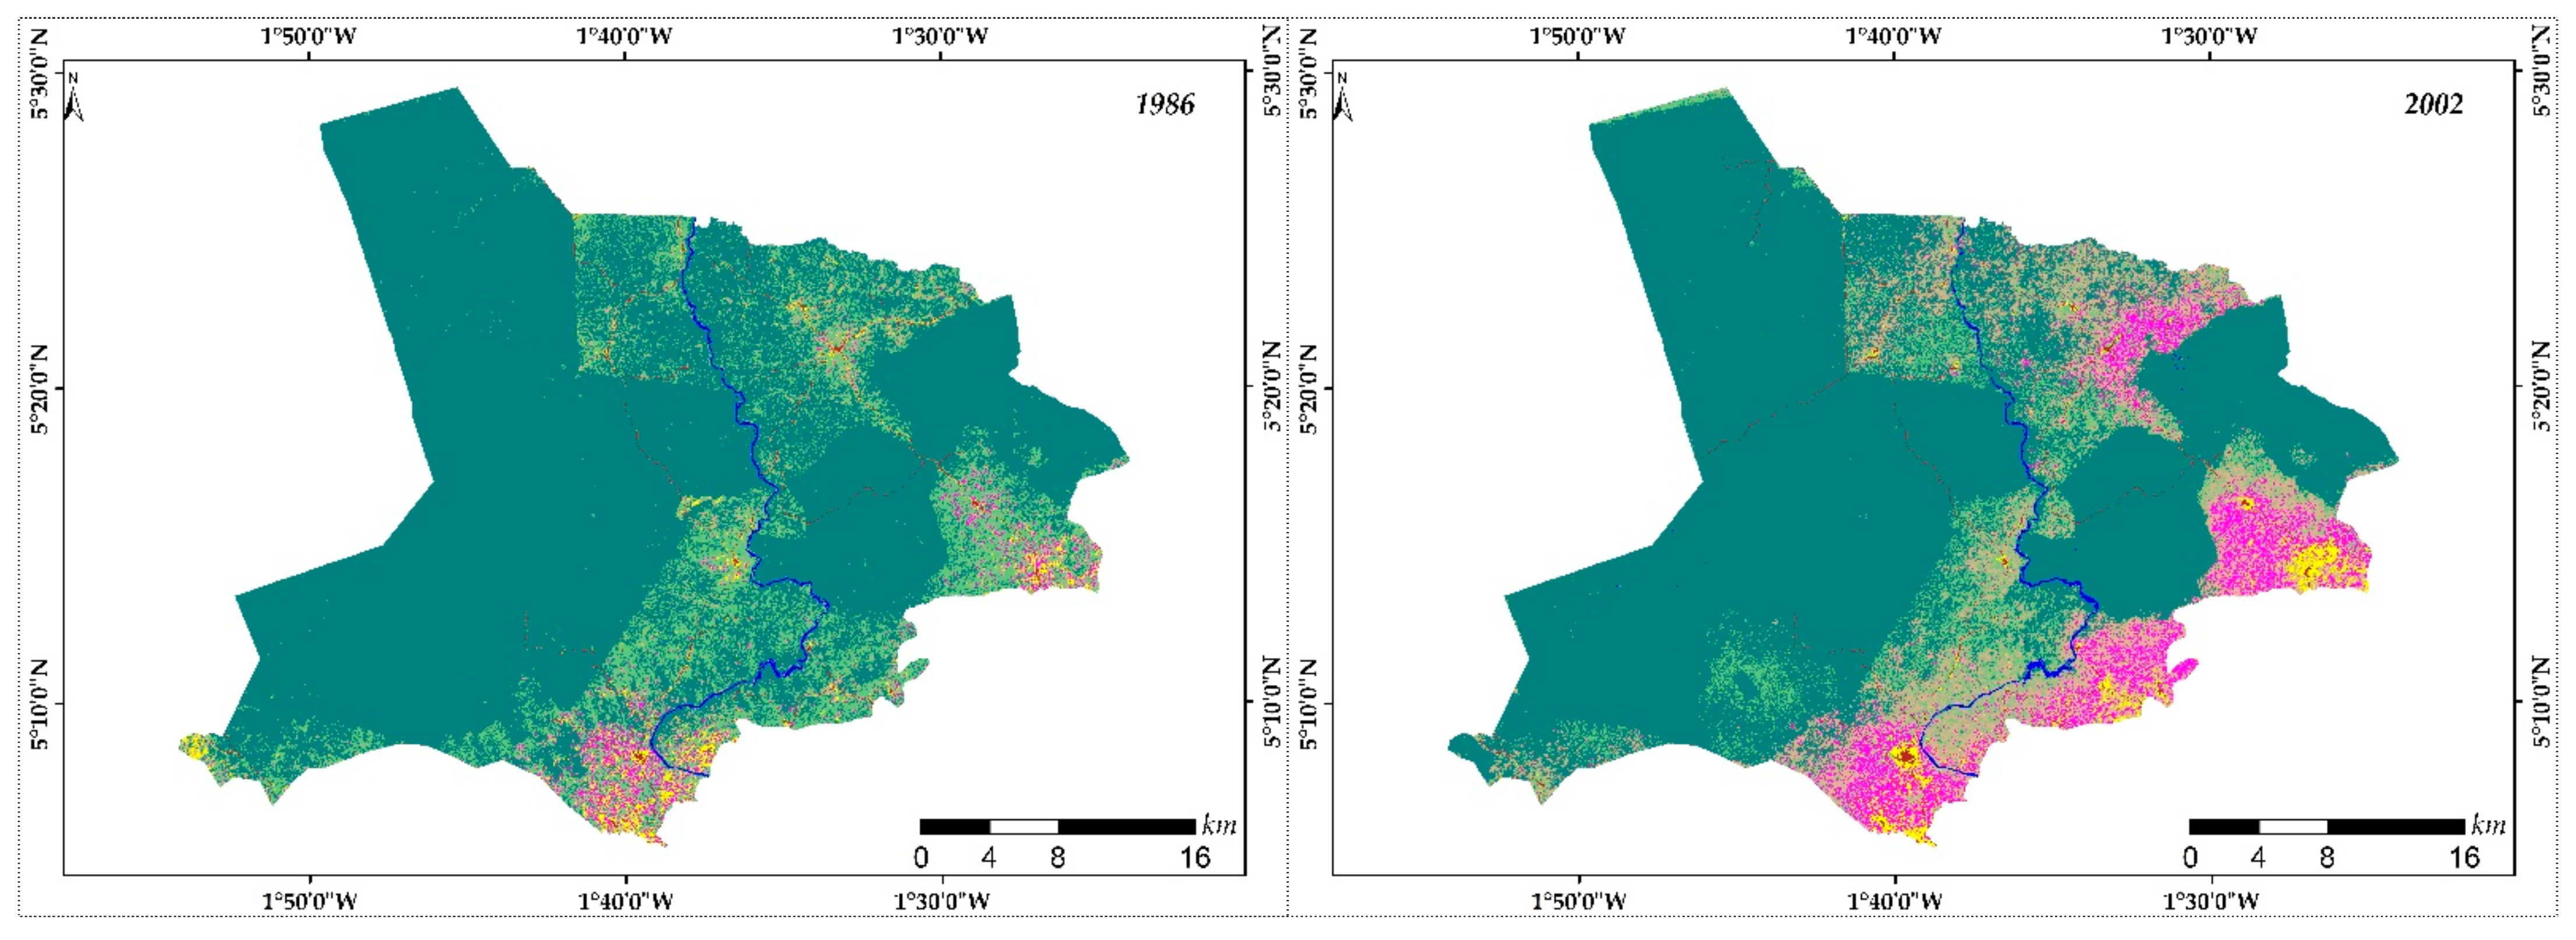
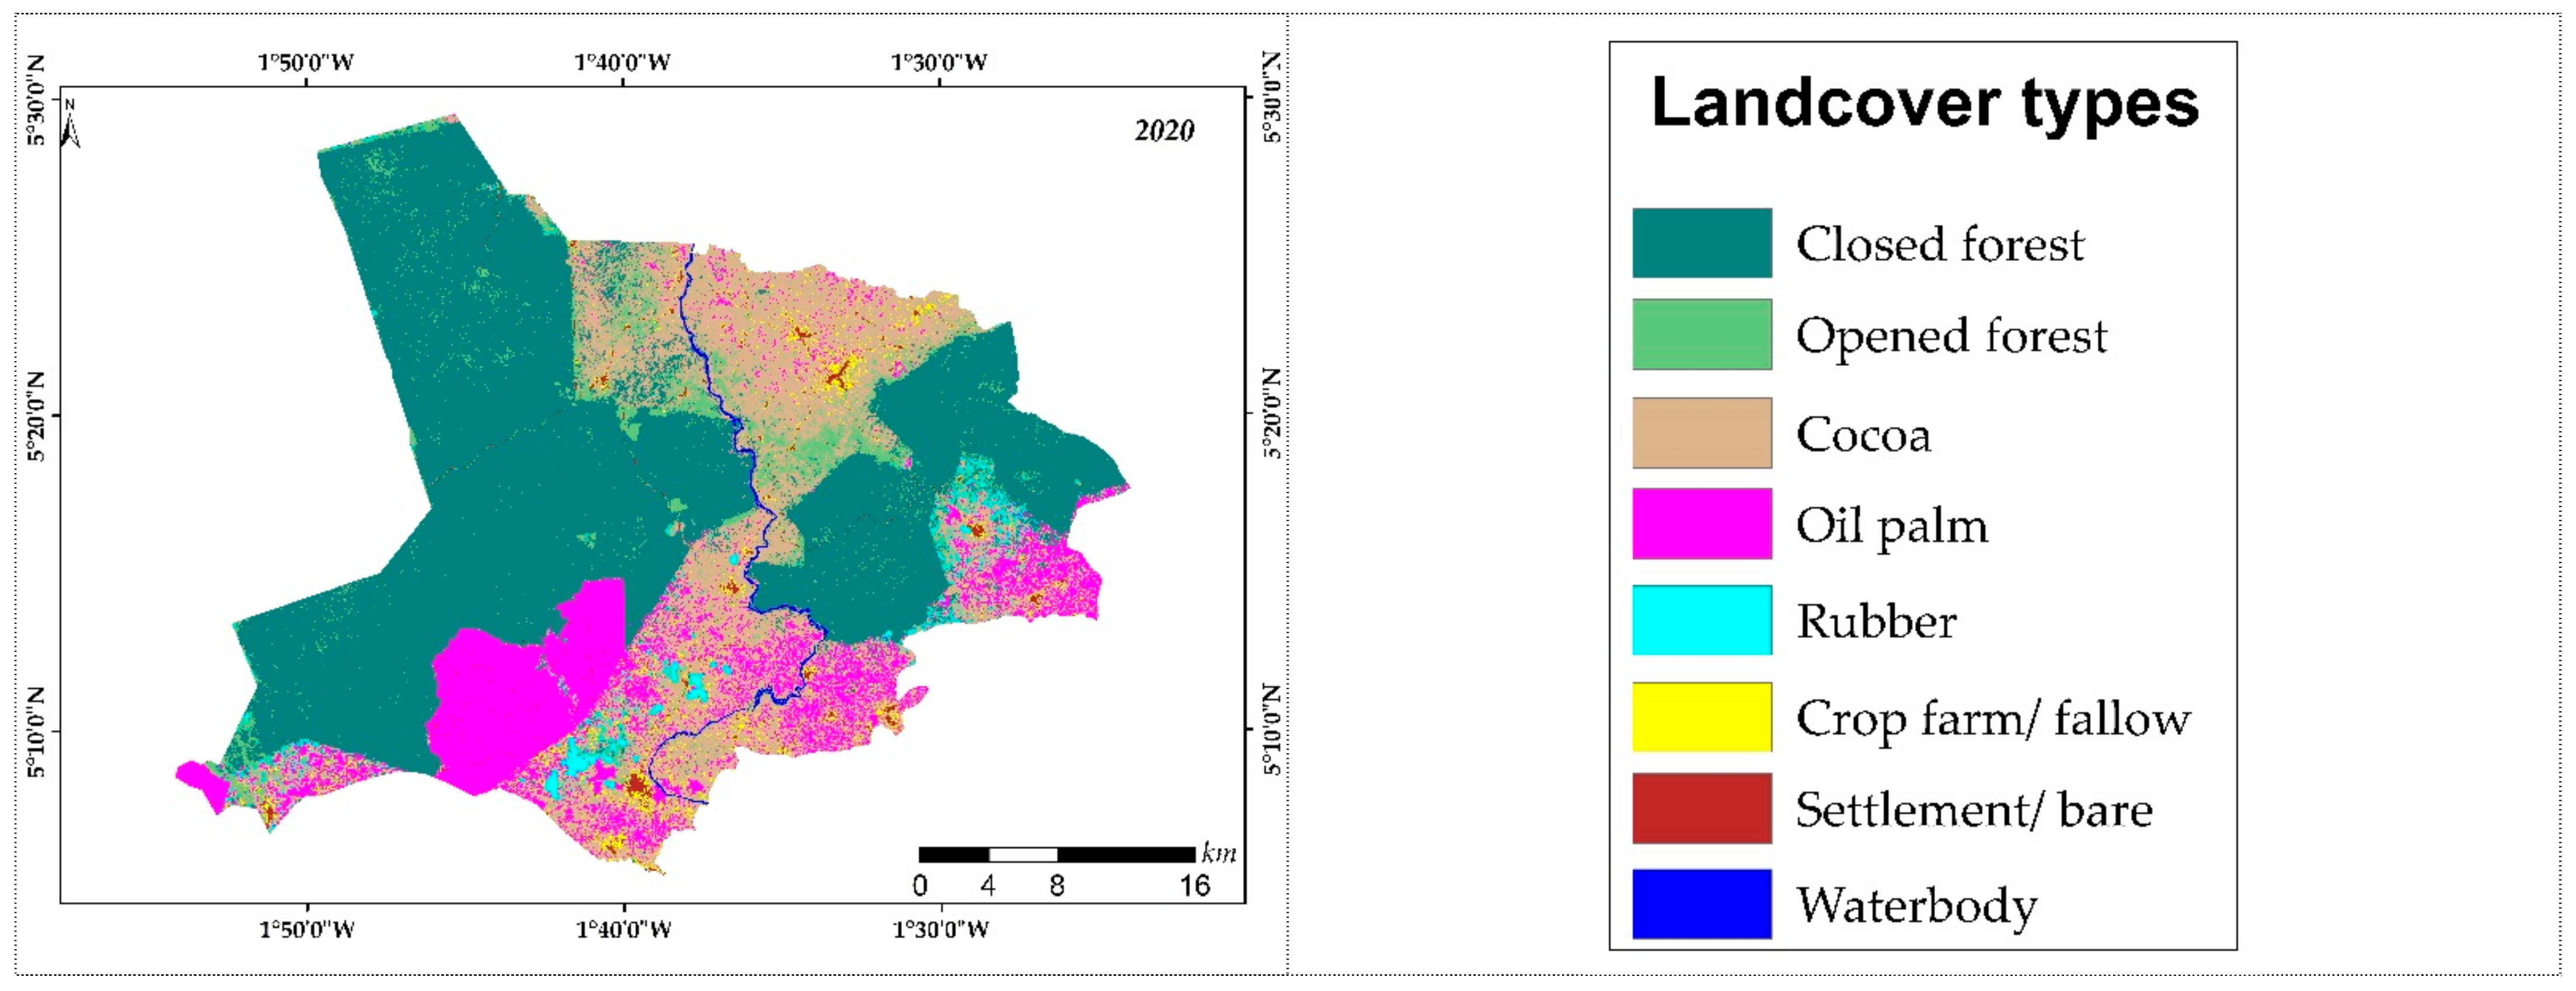
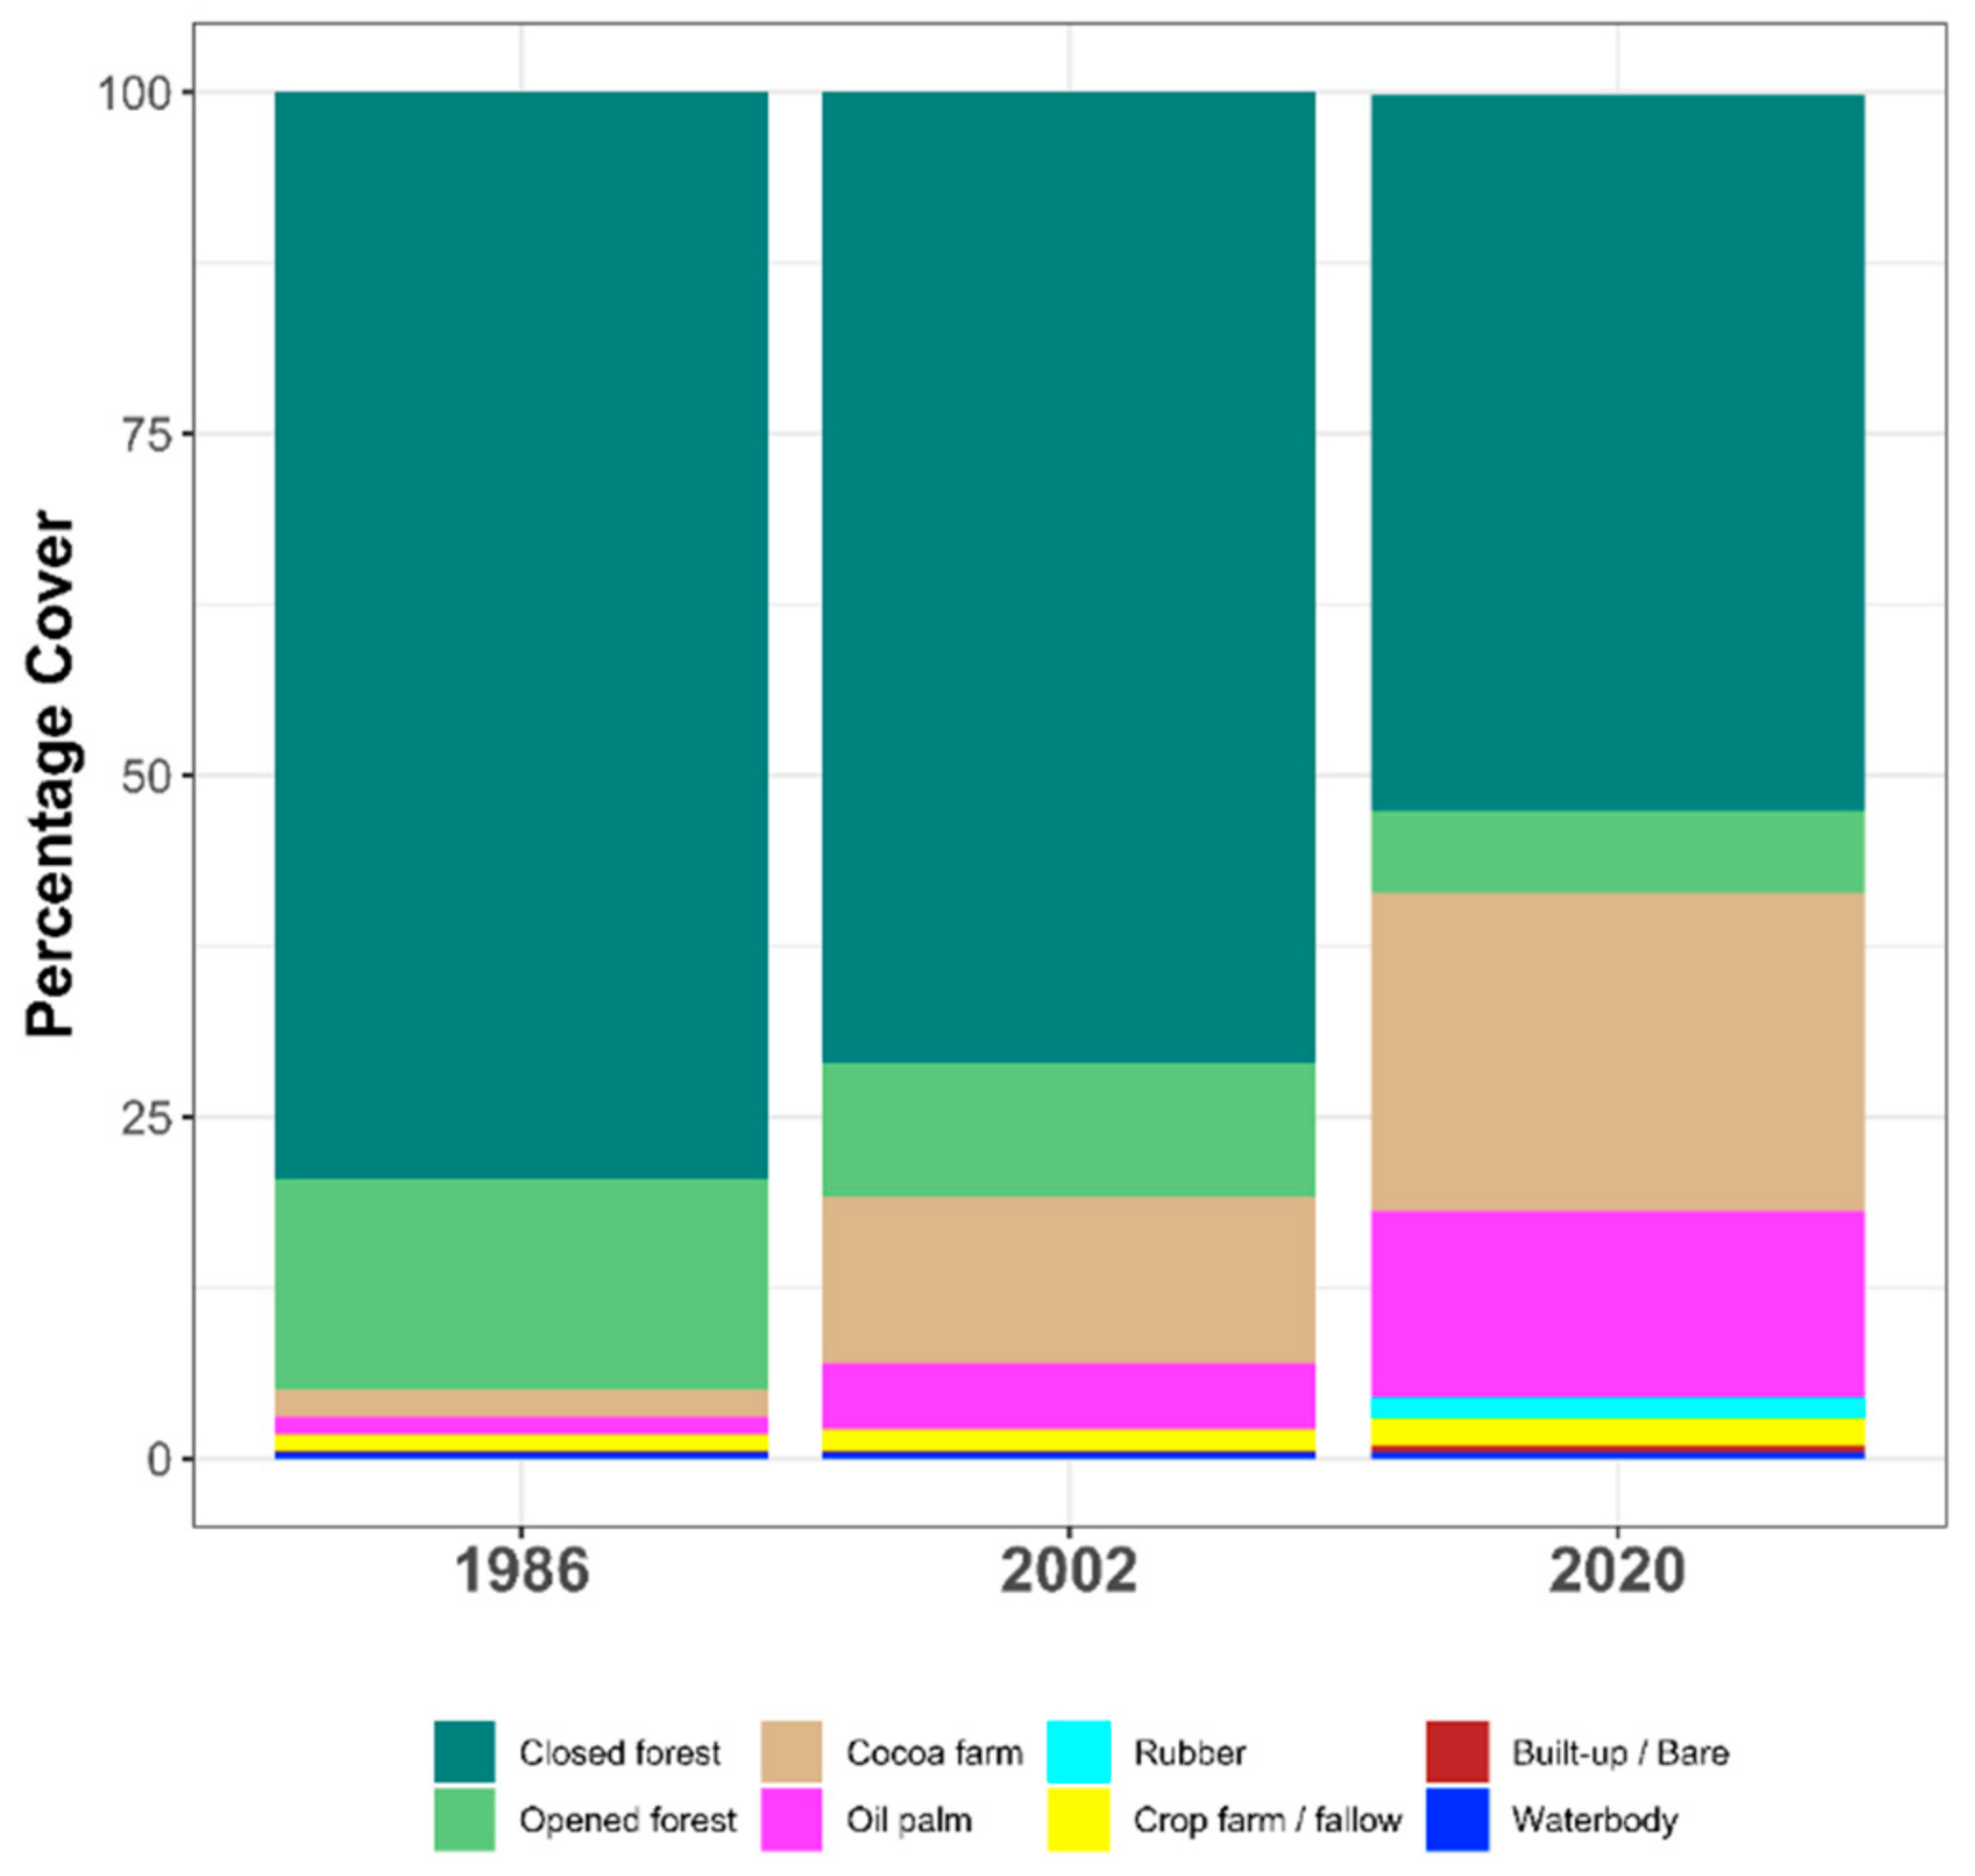
Figure 3 shows the land category maps for the years 1986, 2002, and 2020; Figure 4 illustrates the size of each land category at three-time points, 1986, 2002, and 2020, for the Wassa East landscape. There were seven (7) major land categories (closed forest, opened forest, cocoa, oil palm, crop farm/fallow, settlement/bare, and waterbody) in the 1986 and 2002 maps, while the 2020 map had an additional class, rubber, making them eight. This near-coastal region is mostly forested at all times. The largest land category was a closed forest at all three-time points, followed by an opened forest in 1986, then cocoa in 2002 and 2020 (Throughout the time points, closed and opened forests experienced net losses while the other land categories experienced net gains. The closed forest is mainly found in the reserved blocks, namely, Subri, Pra Suhien 1 and 2, Pra river, and other areas scattered across the landscape. It dominates the landscape with about 102,526 ha or 79% in 1986 (Figure 4), reduced to 71% in 2002, and finally to 52% in 2020 with an annual rate of 0.7%. The opened forest, interspersed with closed forest patches and crop farm/fallow, constituted about 15% of the landscape in 1986 and was reduced in area by 2.3% annually to form 10% of the landscape in 2002. By 2020, the opened forest constituted the fourth highest coverage with 6% after the closed forest, cocoa, and oil palm. Cocoa experienced a net gain, as it originally occupied 2% of the landscape in 1986 but increased to 12% in 2002 and ended with 23% in 2020 at a 6% annual rate (Table 4). Likewise, the oil palm category, which was 1% in 1986, increased to 5% in 2002 and 14% in 2020 at an annual rate of 11%. Half of the coverage of the oil palm cover category, which is approximately 7893 ha, was formally part of the Subri forest reserve block but has now been converted to an oil palm plantation. The map shows this oil palm plantation in a contiguous fuchsia colour at the south-eastern portion of the Subri reserve near some communities.
Throughout the time points, closed and opened forests experienced net losses while the other land categories experienced net gains. The closed forest is mainly found in the reserved blocks, namely, Subri, Pra Suhien 1 and 2, Pra river, and other areas scattered across the landscape. It dominates the landscape with about 102,526 ha or 79% in 1986 (Figure 4), reduced to 71% in 2002, and finally to 52% in 2020 with an annual rate of 0.7%. The opened forest, interspersed with closed forest patches and crop farm/fallow, constituted about 15% of the landscape in 1986 and was reduced in area by 2.3% annually to form 10% of the landscape in 2002. By 2020, the opened forest constituted the fourth highest coverage with 6% after the closed forest, cocoa, and oil palm. Cocoa experienced a net gain, as it originally occupied 2% of the landscape in 1986 but increased to 12% in 2002 and ended with 23% in 2020 at a 6% annual rate (Table 4). Likewise, the oil palm category, which was 1% in 1986, increased to 5% in 2002 and 14% in 2020 at an annual rate of 11%. Half of the coverage of the oil palm cover category, which is approximately 7893 ha, was formally part of the Subri forest reserve block but has now been converted to an oil palm plantation. The map shows this oil palm plantation in a contiguous fuchsia colour at the south-eastern portion of the Subri reserve near some communities.
The cocoa and oil palm monocrops can be found in the eastern portion of the study area (Figure 3). The crop farm/fallow land category was found mostly around townships and at the edges of road networks. The emerging land category, rubber, is spreading across the landscape. It occupied 1.6% of the Wassa East landscape in 2020 (Figure 4). The most miniature land categories in 1986 were built-up (0.51%) and waterbody (0.46%), which marginally increased to 0.85% and 0.54% in 2020 with 4% and 1% annual rates, respectively.
3.2. Land Cover Changes between Time Scales
The cocoa expansion rate was the highest during the first time interval; however, oil palm assumed the first position with a lower change rate during the second time scale. Between 1986 to 2002, cocoa farms had the fastest annual growth rate followed by oil palm plantations with 35% and 17%, respectively. Cocoa, however, was reduced to a 5% annual growth rate in the second period, 2002–2020, while oil palm grew at a 10% rate. Throughout the entire period, cocoa gained an annual percentage change of approximately 74%, and oil palm, 57%. Generally, closed forests were reduced by 34% between 1986 and 2020 and the rate of reduction in the first period was half the rate of the second period. Waterbodies, comprising the Pra River which traverses from north to south of the study area, were increasing gradually at an annual rate of 0.3% in the first session but doubled in the second period. The annual growth rate of settlement/bare increased by 1% and jumped to 2.7% during the second period (Table 4).
3.3. Land Cover Intensities
The matrices (Table 5 and Table 6) are the change detection results of the land cover intensity analysis. These matrices are generated through overlays of two maps of the same place for two different time points. The rows show the classes at the initial time, and the columns show the identical order of class types at a subsequent time. The diagonal entries indicate land persistence, while the off-diagonal values show the land size that changed from the initial class to other consequent categories during the time interval. The interval, categorical, and transition intensity analysis results are presented below.
3.3.1. Time Interval Intensity Analysis
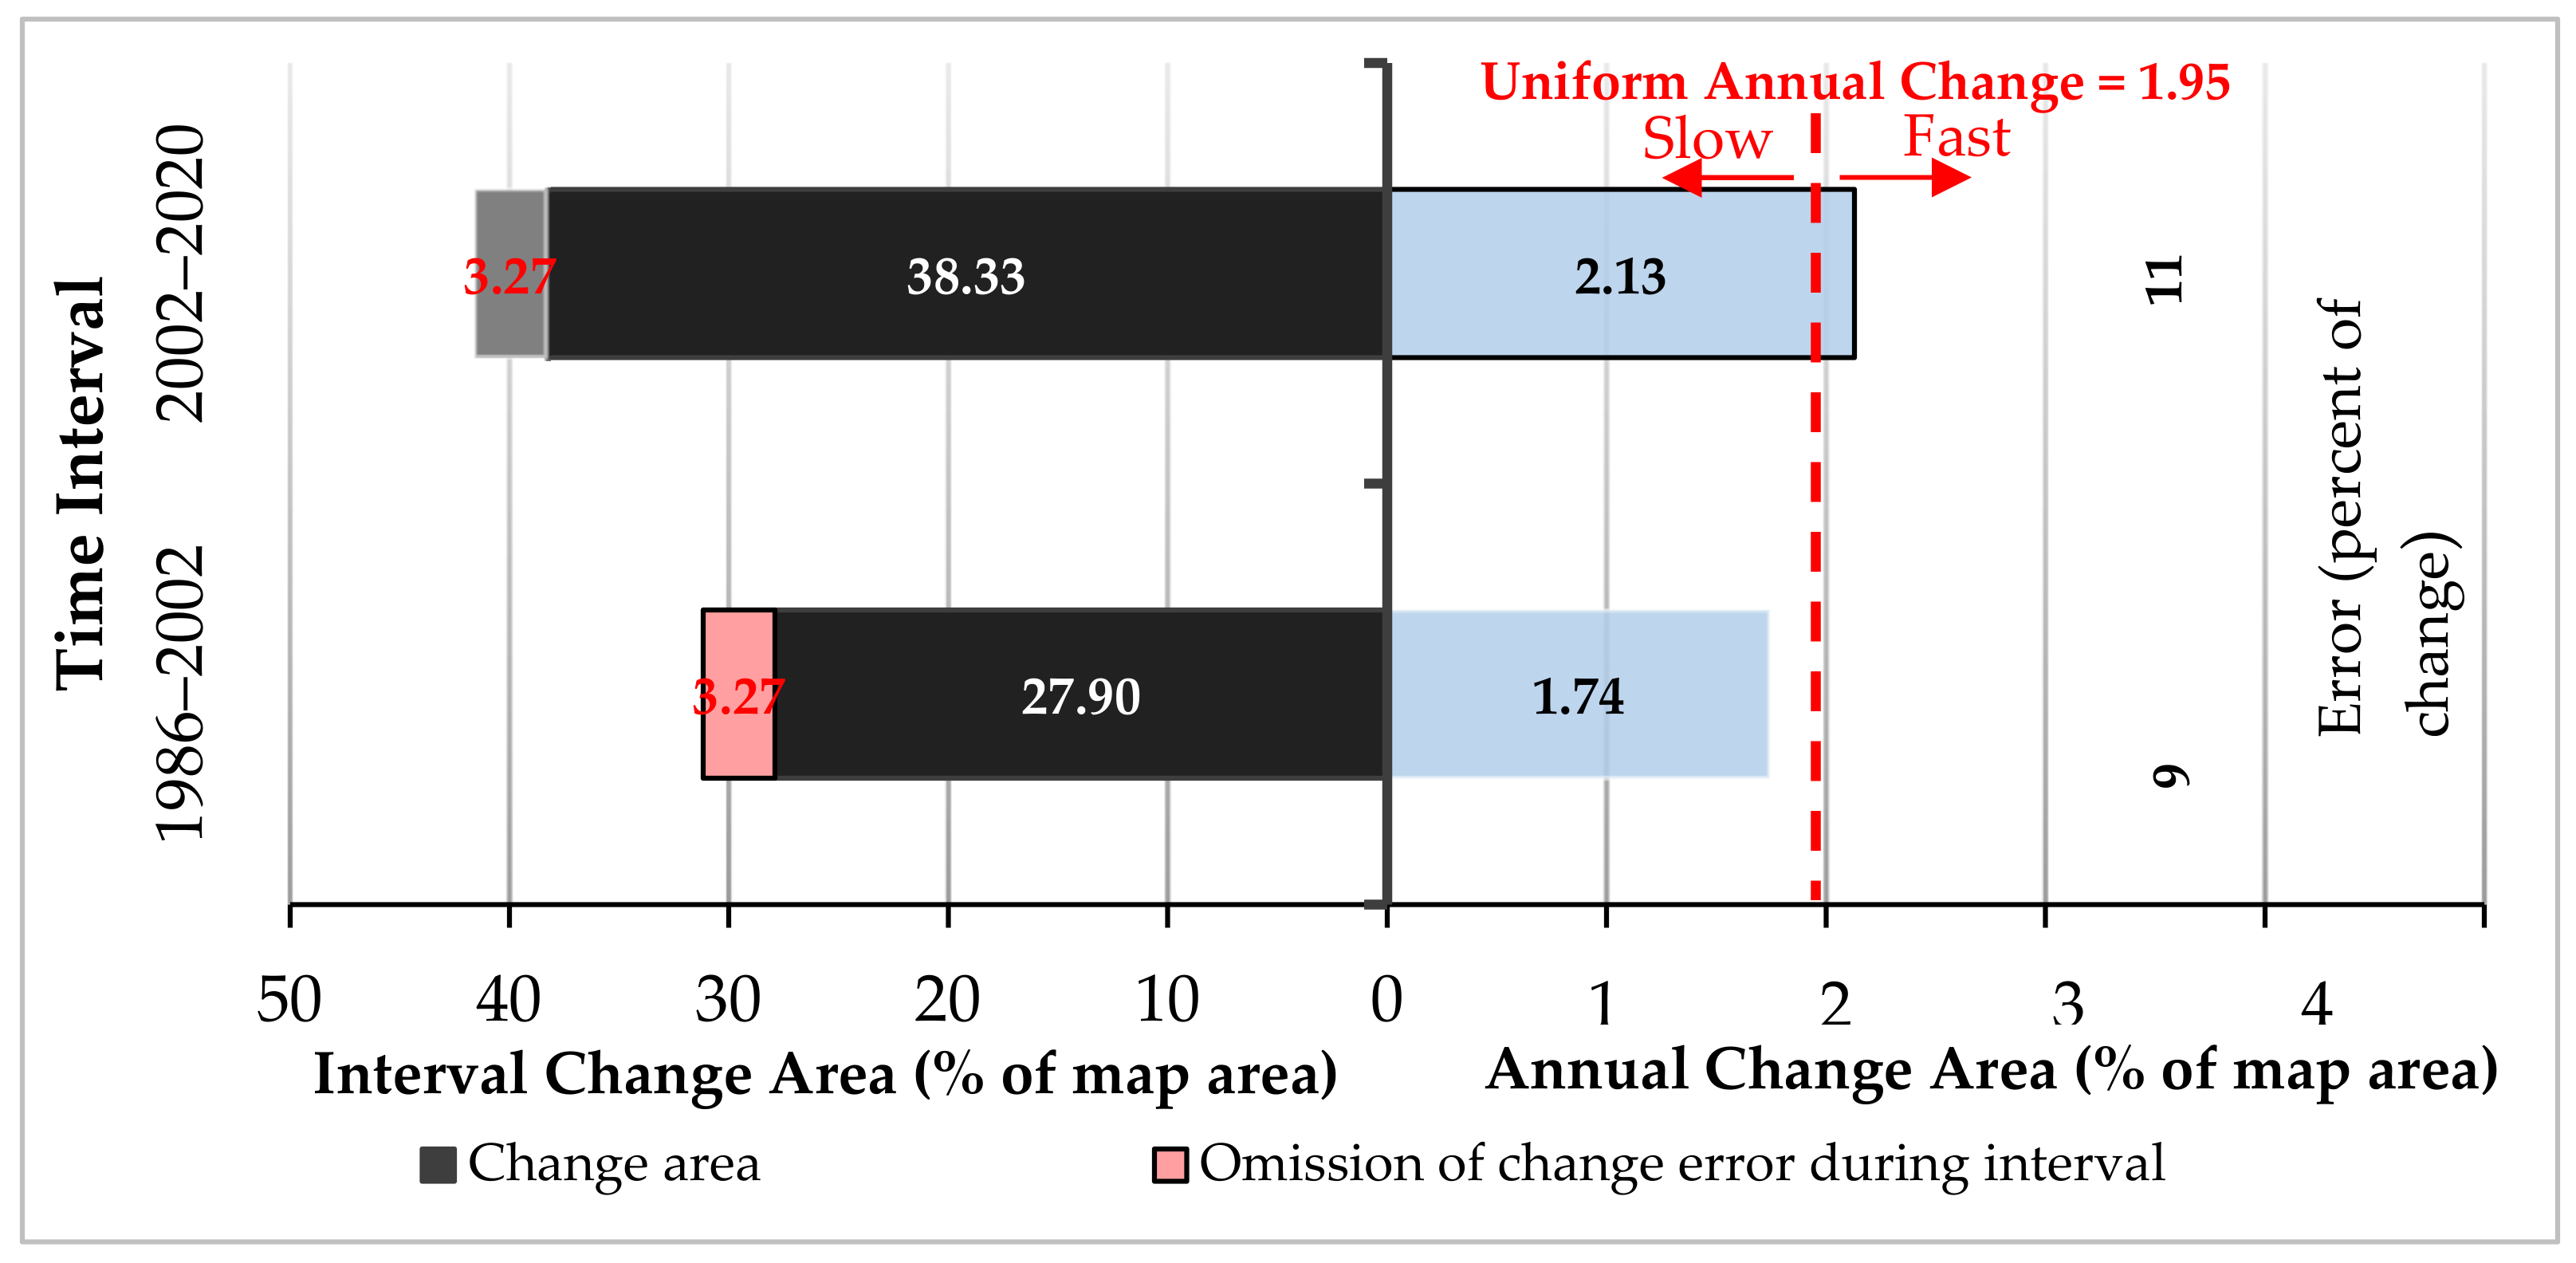
Figure 5 shows the interval levels of change for two-time intervals and examples explain the deviation between the observed annual change and the uniform annual change. The right side of the chart shows the intensity of changes for each time interval. The dashed red line shows the uniform annual change percentage realized in 34 years. Changes are slow if the bars stop before the uniform line or fast if a bar extends beyond the uniform line. Our interval intensity analysis (Figure 5) showed that the annual rate of overall change of (2.13%) was fast from the 2002–2020 time period compared to the 1986–2002 time interval (1.74%) as shown by the dashed red line. The left side of the figure shows the gross change during each interval separated into three components and illustrates the hypothetical errors that could explain the observed deviations from the uniform line.
3.3.2. Category Level Intensity Analysis
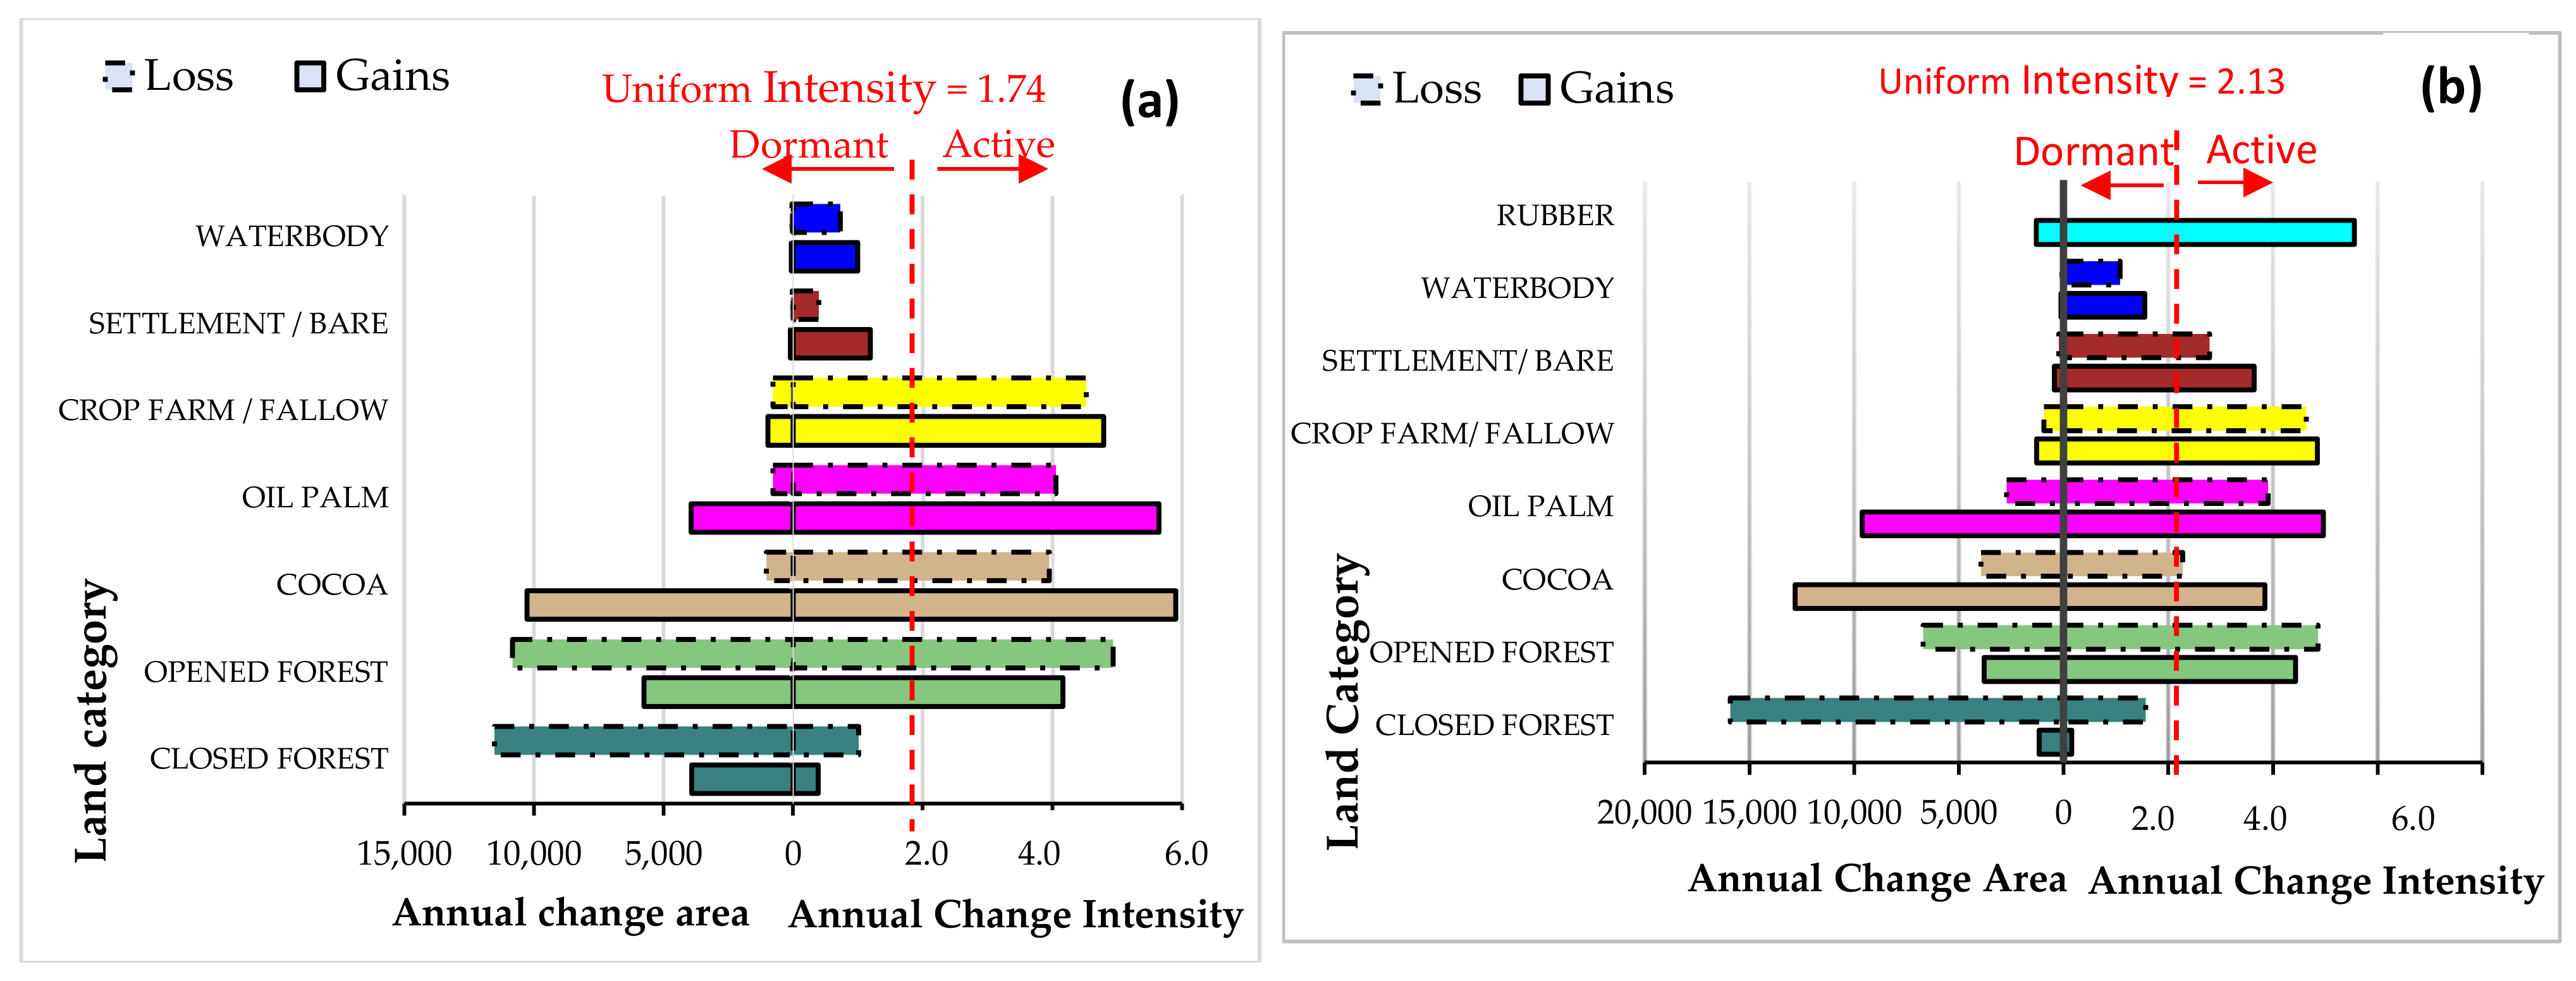
This section shows the categorical intensities for the 1986–2002 interval, thus the a section of Figure 6, and 2002–2020 time interval, represented by the section b. The left section of shows the size of the loss and gain of each category in terms of area, thus indicating whether each category’s net change was negative, zero, or positive. The right section bars indicate each category’s intensity of loss (broken-line boxes) and gain (straight-line boxes) in terms of change per area. The annual change area (bars on the left) was determined by the number of pixels, and the annual change intensity (bars on the right) by the percentages of the land cover categories. The dashed lines indicate uniform intensity; thus, the intensities of the changes were equally spread over the spatial extent during the time interval. The loss and gain of a category are described as dormant or active if the intensity was less or more than the uniform intensity.
Cocoa had the most substantial gain during all intervals. Oil palm had the second-largest gain in 2002–2020 and the third largest gain in the first period. Closed forests and opened forests had the most significant losses during all periods. Two main reasons may account for a category experiencing such a huge loss when subjected to a uniform change intensity at the start time; otherwise, a category’s loss was intensive than uniform [47]. To establish the reason(s) that apply, we studied the category’s loss intensity relative to the uniform change intensity illustrated in the right sections of the graphs.
Category level intensity analysis, therefore, explores classes that showed dormant or active changes upon comparison to the overall intensity of landscape changes. Closed forest and waterbody were the categories that remained dormant for both gains and losses during both time intervals. Unlike the waterbody category, the relatively huge size of the closed forest being the denominator made its category’s intensity dormant. Therefore, the vast size of the closed forest was the sole reason for its appreciable losses in the landscape. All monocrops’ losses and gains extend beyond the uniform line for both time intervals which implies that cocoa and oil palm have been consistently active. Additionally, rubber made its entrance in the second period by gaining 5.6% of the category annually (Figure 6b). Crop farm/fallow had similar active changes and losses as much as it gained for both time intervals. The settlement/bare land category was initially dormant in the first time interval but then became active in the second time interval. Finally, it is worth noting that in both time intervals, all land categories had positive net changes except the two forest categories (i.e., closed and opened forests).
3.3.3. Transition Intensity Analysis
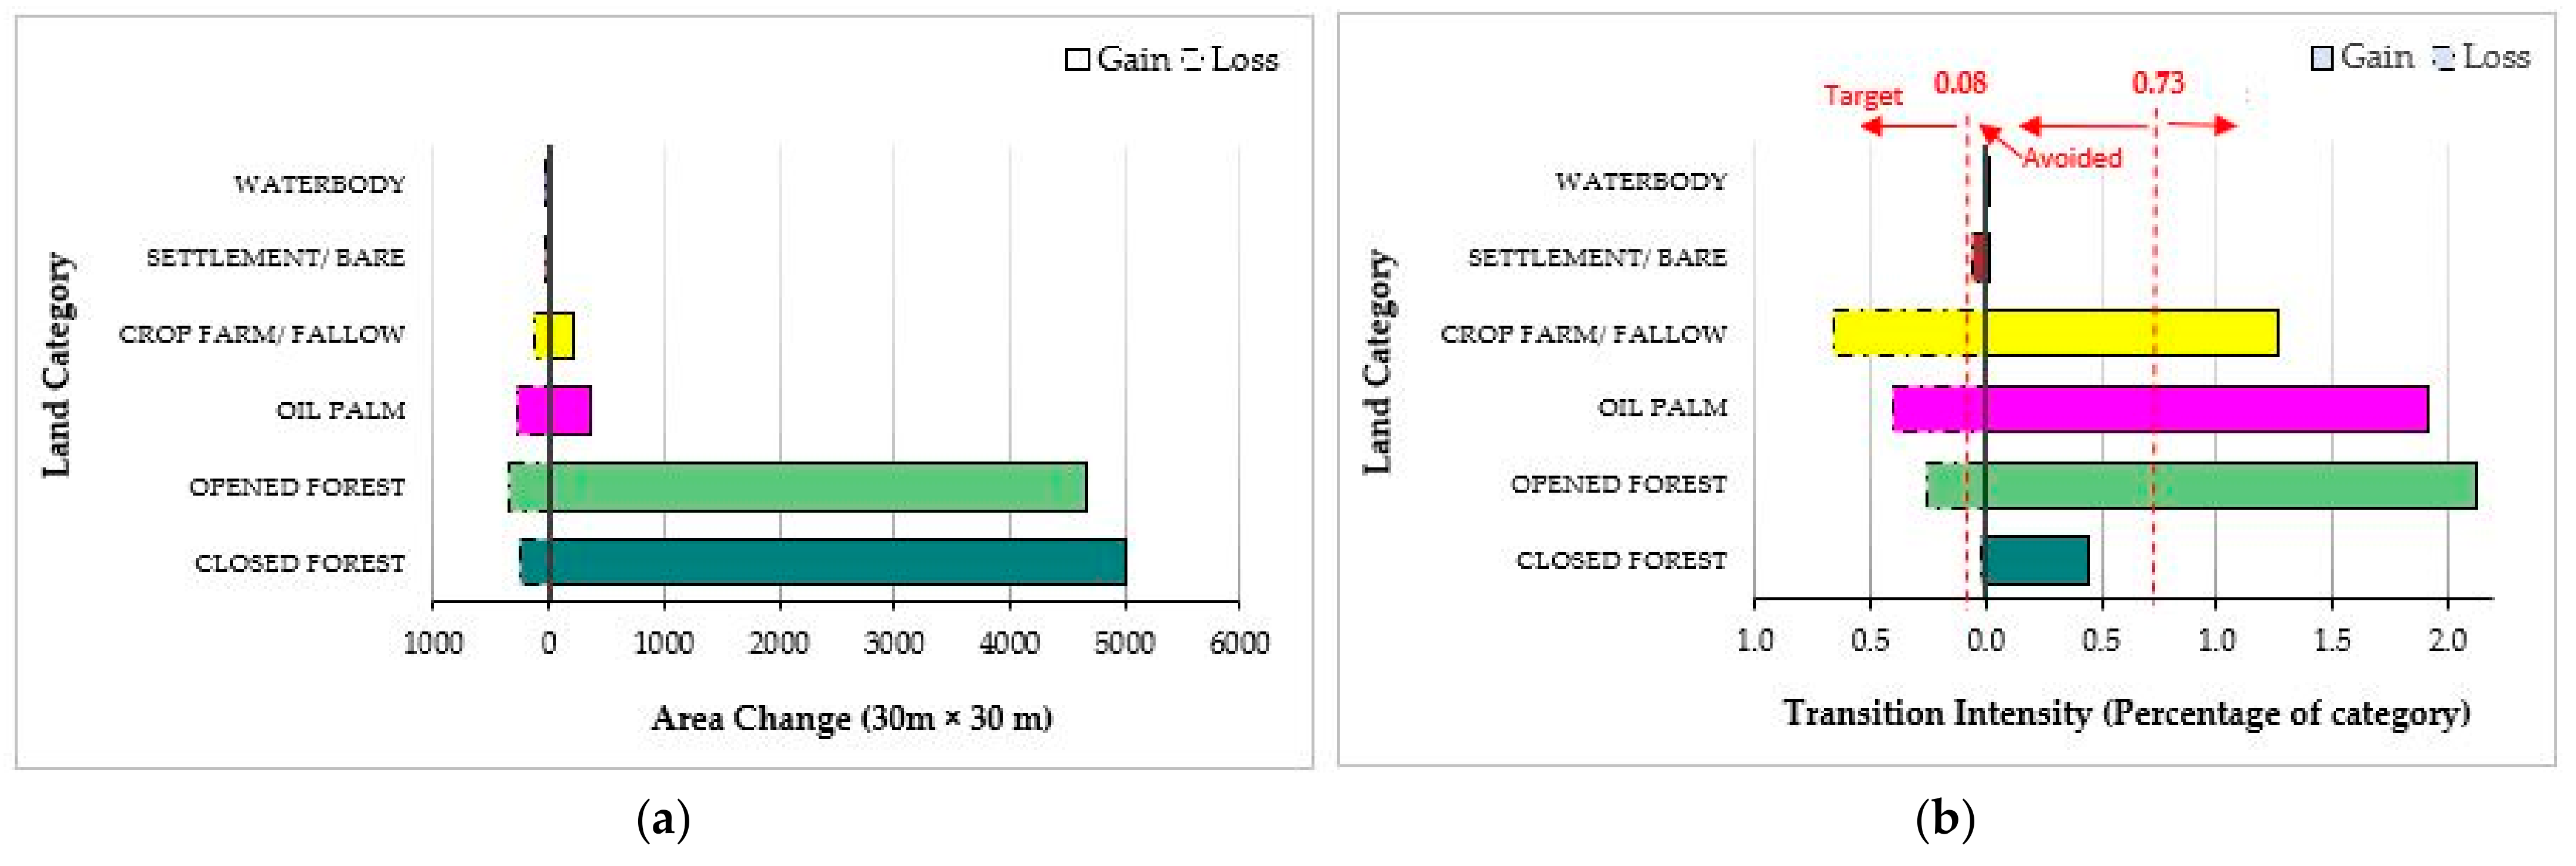
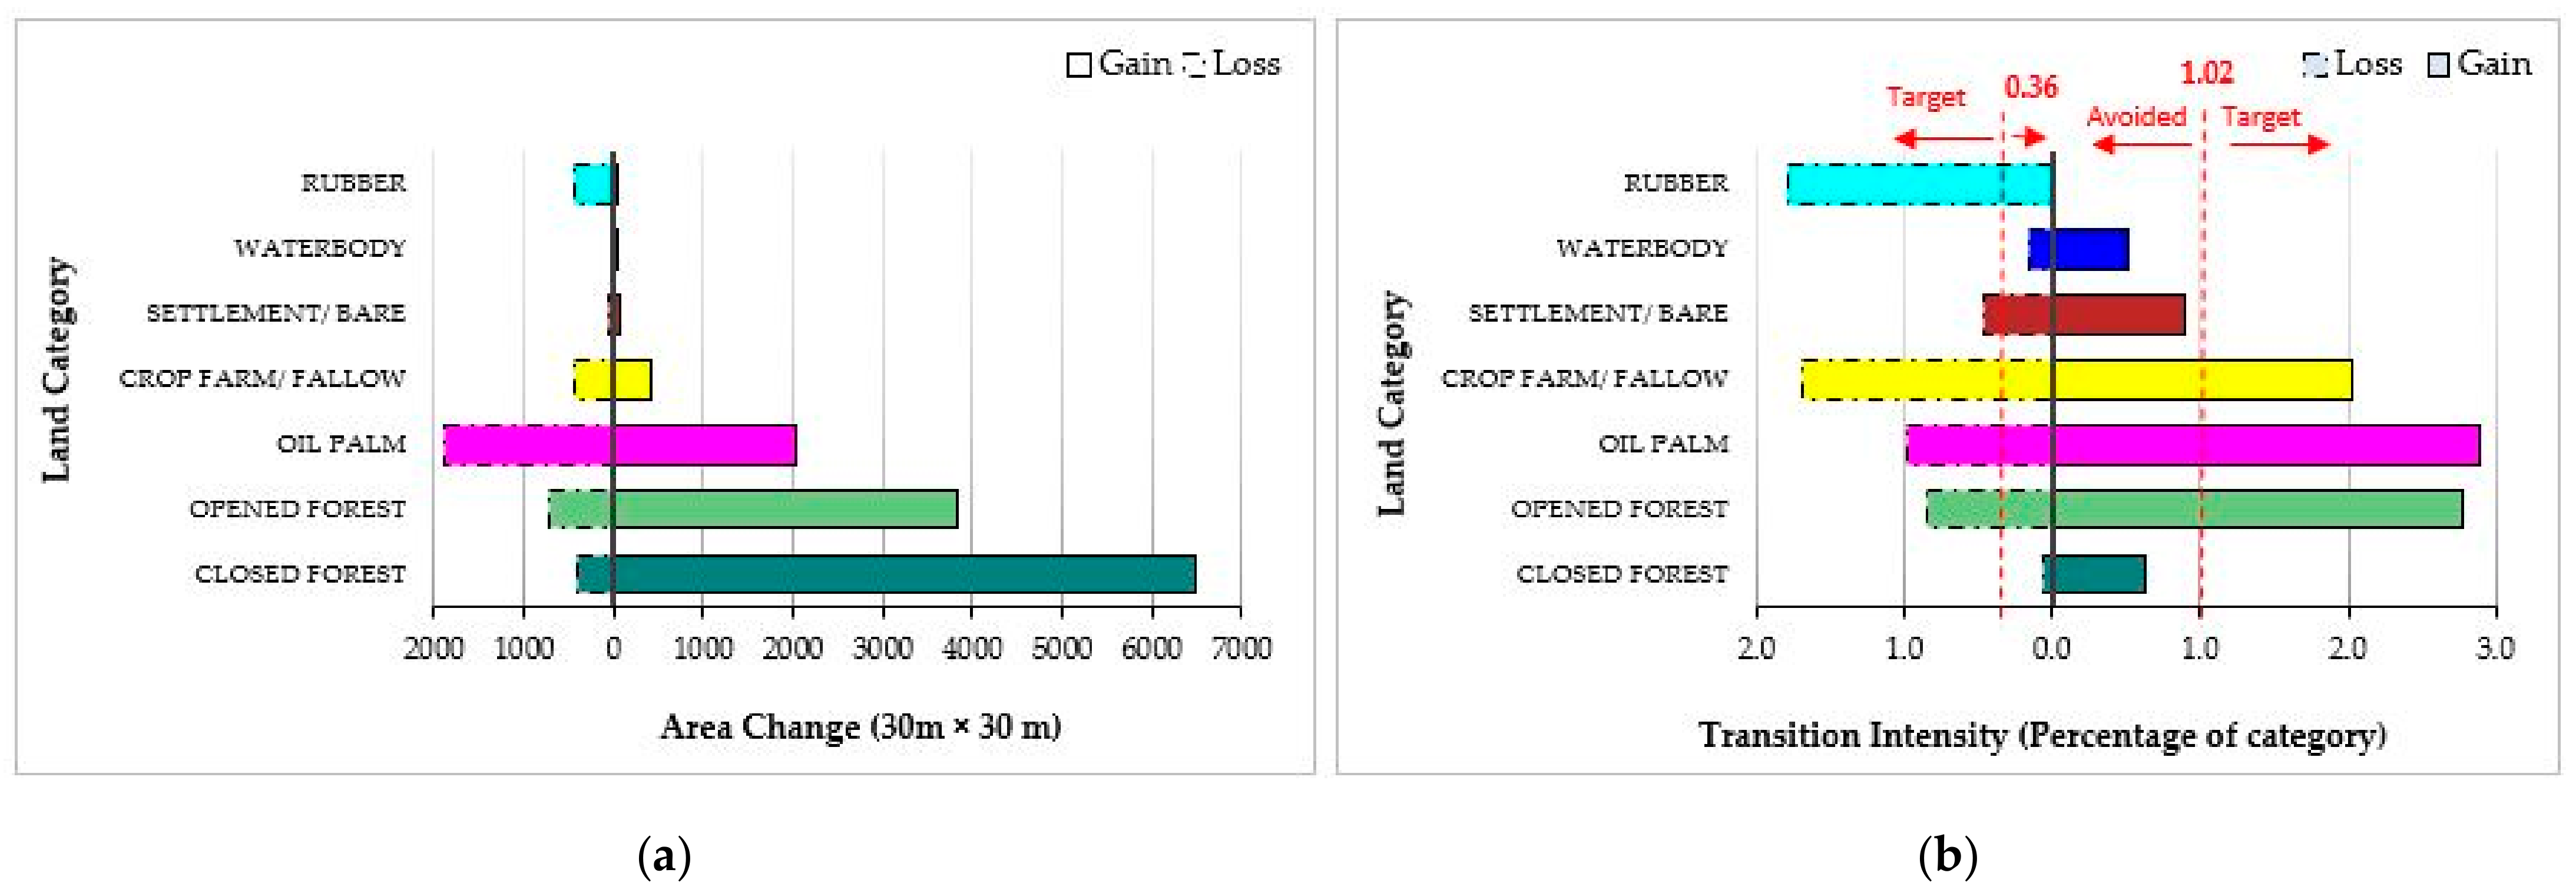
The study was conducted to understand the impacts of monocropping; thus, cocoa, oil palm, and rubber activities on land cover transitions in the Wassa East landscape were analyzed in detail to determine which transitions in these categories are intensively avoided versus those targeted by a given land category in a given time interval as revealed by our transition intensity analysis. The analysis also helped ascertain whether the pattern is stable across time intervals. Figure 7, Figure 8, Figure 9, Figure 10 and Figure 11 show the results from transition level analysis. Each figure has two graphs; section (a) shows area changes as the number of pixels, while section (b) shows the percentage intensities. The left and right sections of each bar chart denote the losses and gains, respectively. The graphs for percentage transition intensities between land categories show hypothetical uniform intensities for the interval transitions as red vertical dashed lines on either side of the charts. The left uniform intensity lines denote the hypothetical uniform value for the intensity of transitions resulting in losses in the respective land categories and the opposite for the gains. Figure 7a and Figure 8a show the transitions by size to and from oil palm, and Figure 7b and Figure 8b represent transition intensities (percentages) for the first and second intervals of oil palm. The oil palm gains were mostly from the closed and opened forests and it lost very little to the same coverage types during both intervals. This is because the closed forest category is far larger than the next largest category; thus, a uniform gain of oil palm would cause the transition from closed forest to be larger than from other categories. Additionally, the gains of oil palm contributed to losses in targeted closed and opened forests, meaning the transition intensity was greater than the uniform transition intensity for all periods except the closed forest transition in the first period. The high conversion of closed forests during the second period is linked to oil palm expansion into forest reserve blocks in the mid-2000s. The oil palm category swapped with cocoa; thus, there existed concurrent gains and losses between the two land categories for both periods. However, the hypothetical uniform intensities prove that cocoa is a target for oil palm. Oil palm also gained from the crop farm/fallow category and lost to the same category even though the losses were minimal during the periods.
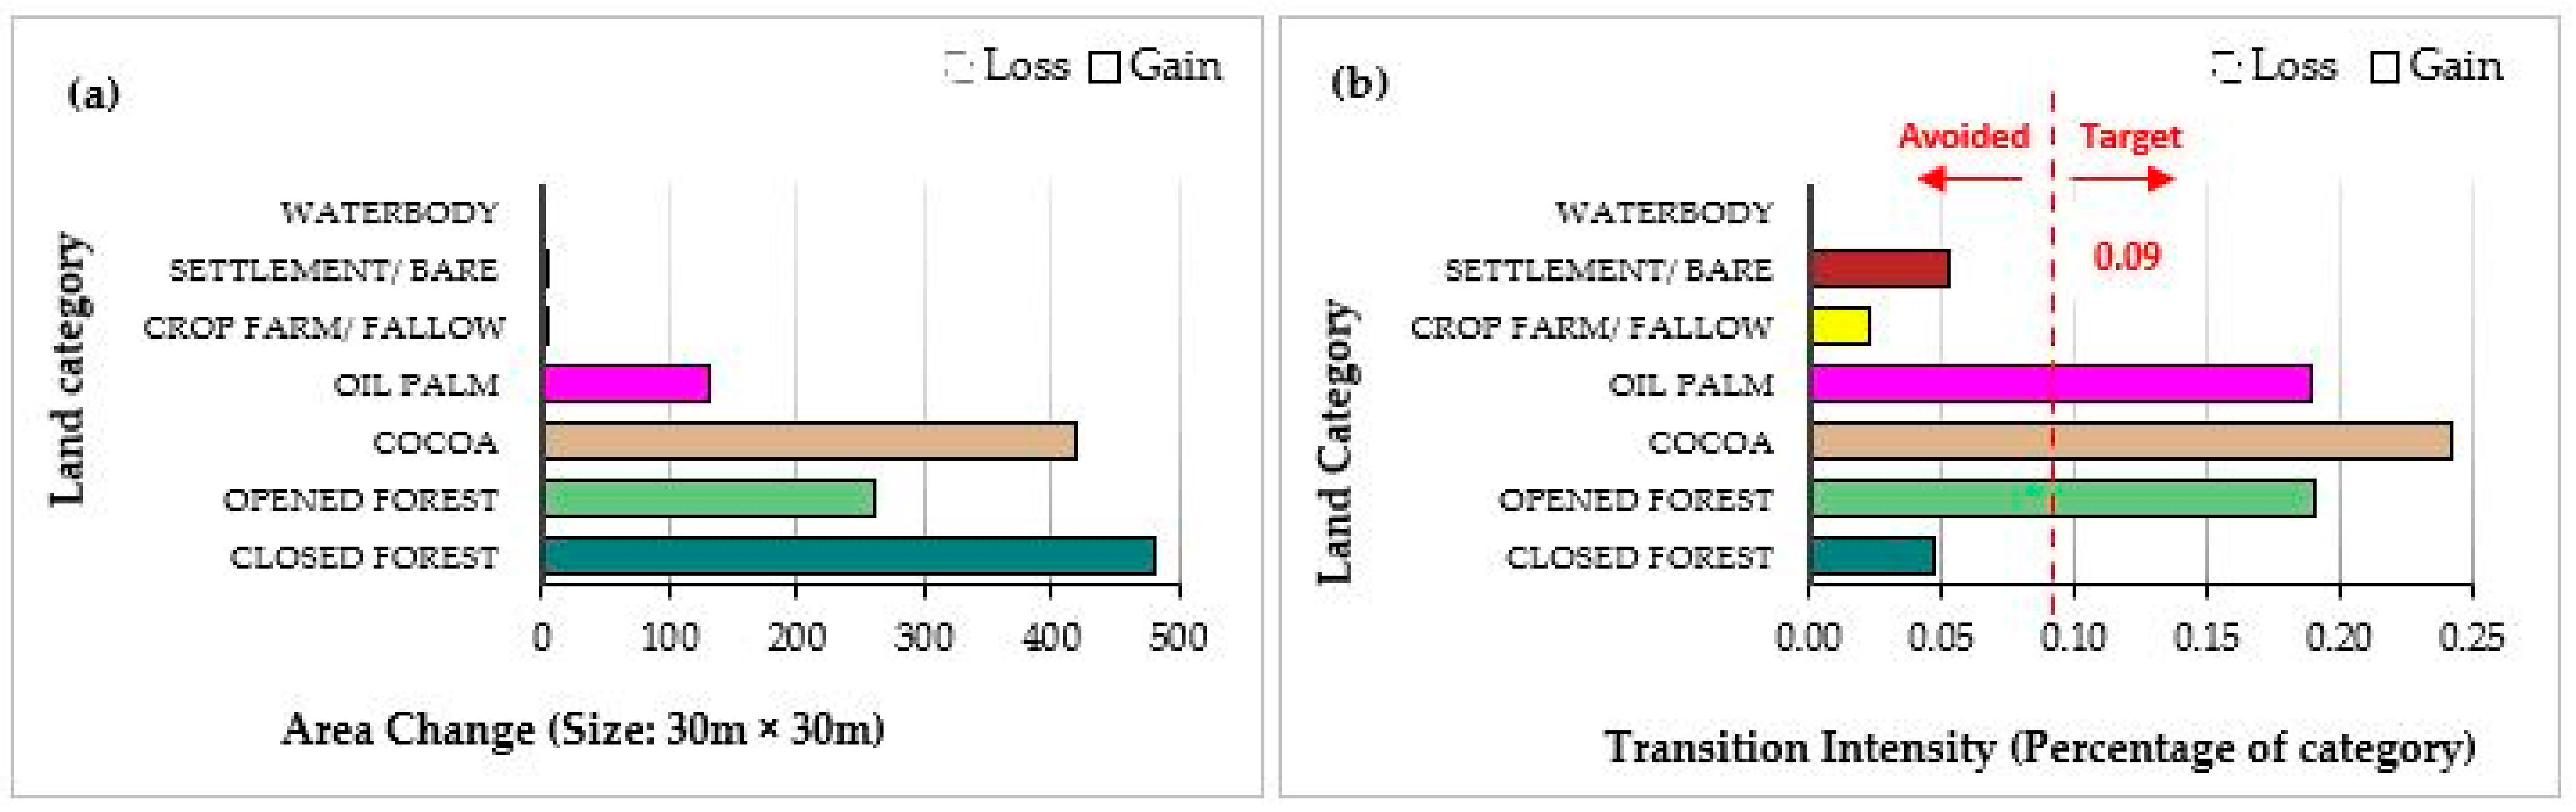
Figure 9 and Figure 10 illustrate transitions from forest to cocoa in terms of size and intensity. Most of the largest transitions were from closed forests and opened forests. Oil palm and crop farm/fallow were the largest non-forest categories with high transitions, especially during the second interval. Transition intensities revealed that the gain of cocoa avoided closed forests during both intervals. Thus, the closed forest’s large size, as compared to the other categories, explains the large transitions from closed forest to other categories even with a uniform loss. Gains in the size of cocoa farms were greater and with high intensity from the opened forests than any of the other land categories. The oil palm class size was small in 1986–2002 and was the target for cocoa, and likewise in 2002–2020, when the two categories swapped. Cocoa targeted crop farm/fallow in both periods, despite the latter’s small size. Settlement/bare targeted cocoa in 2002–2020 and the latter lost to it with high intensity.
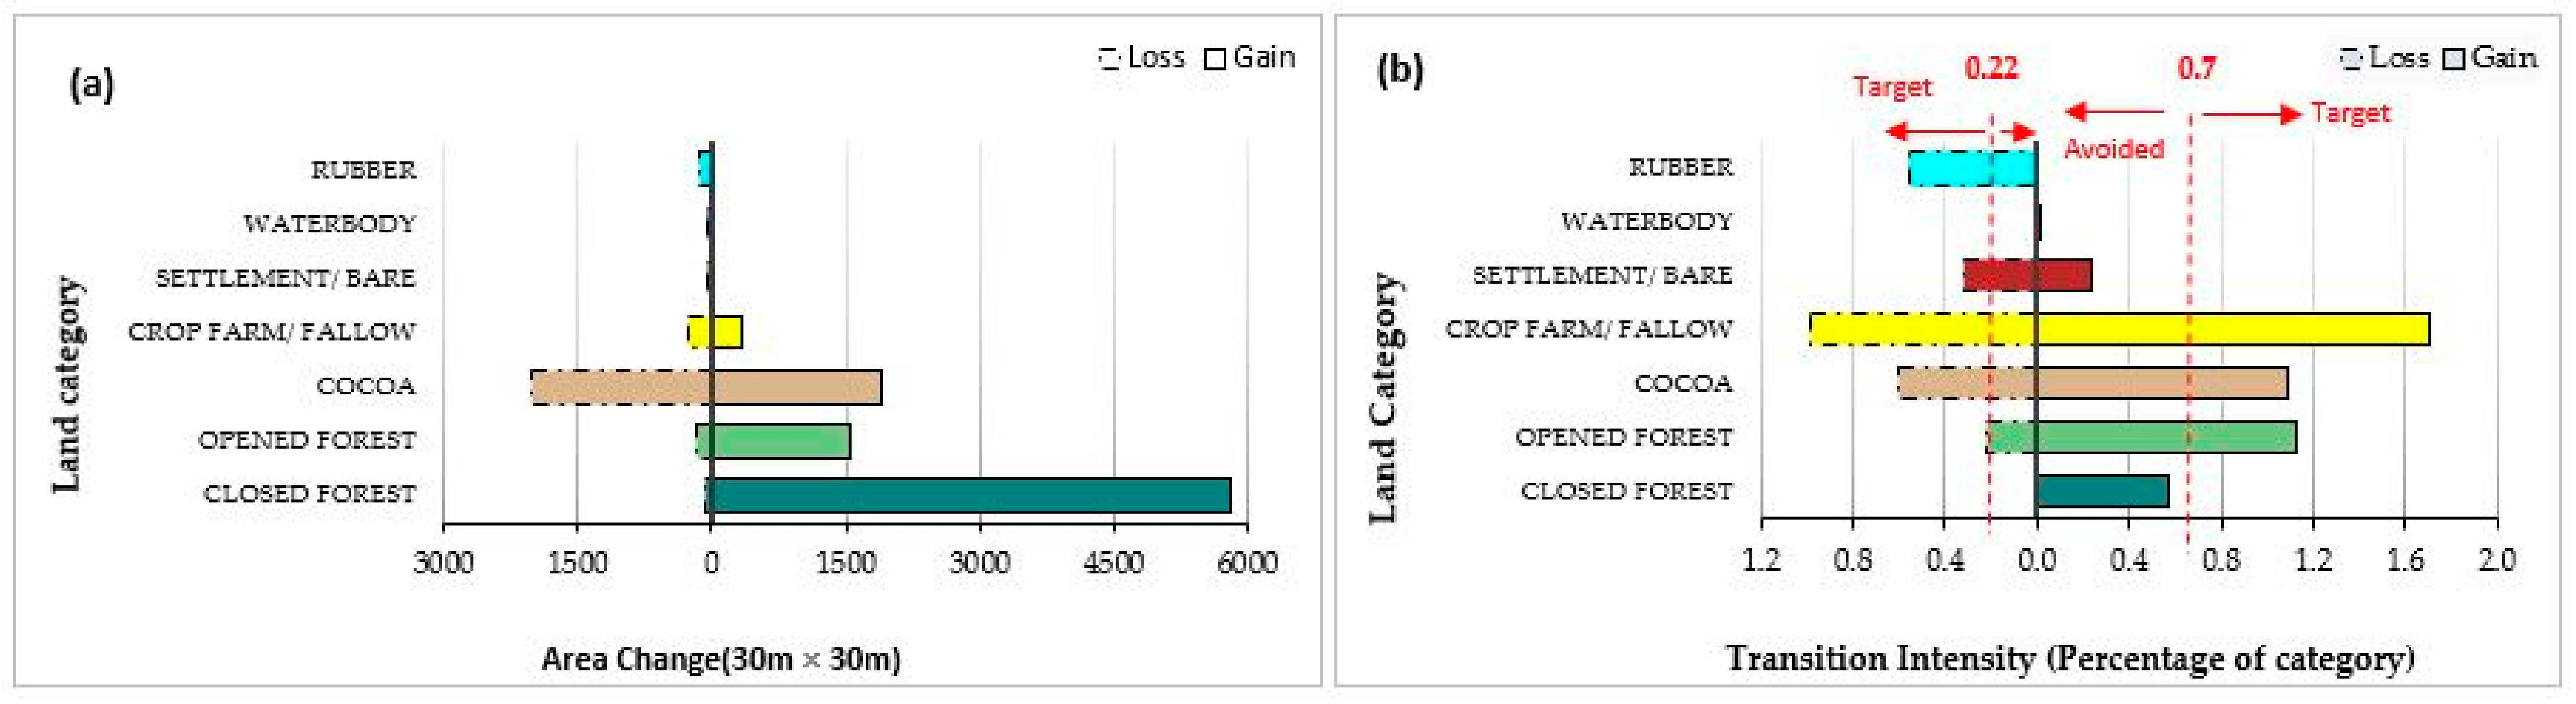
Figure 11 reveals that other losing land categories in transition lost to the rubber category as rubber was introduced between the 2002–2020 time period and thus gained mostly from the forest categories and the other monocrops. As observed earlier, closed forests contributed the most to the rubber land category but fell short of the hypothetical uniform intensity value due to their size. The next three contributors to rubber in terms of area size were cocoa, opened forests, and oil palm. All three were targeted categories with cocoa being the most targeted, and oil palm and opened forest had approximately similar transition intensities.
Relating the cluster of graphs in Figure 7, Figure 8, Figure 9, Figure 10 and Figure 11 exposes how a particular losing category transitioned to a certain monocrop in terms of size and intensity during each time interval. First, the higher uniform transition intensity values for the gains (left) compared with the losses (right) means the Wassa East landscape is aggressively being occupied by tree monocrops rather than by natural forests, food crop farms, or settlements. Secondly, the variation among the uniform transition intensity lines shows that cocoa gained more aggressively than oil palm and rubber. Thirdly, all monocrops targeted opened forests and crop farms/fallows except rubber. For instance, oil palm’s biggest target was crop farm/fallow, while cocoa highly targeted oil palm and opened forest.
4. Discussion
The study investigated all four aspects of change detection vital in natural resource management [52]. This study followed the four processes of change detection analysis as we (a) detected changes that have transpired and (b) the nature of the changes, (c) quantified the areal extent of the change, and (d) assessed the spatial pattern of the change.
The Wassa East district experienced changes concerning all land categories, especially the forest lands. An analysis of the landscape structure revealed the same classes for 1986, 2002, and 2020. However, the 2020 landscape had an additional class of rubber. The identified classes are similar to several other studies on the south-western side of Ghana [53,54,55]. The studies have shown increasing cases of rubber (Hevea brasiliensis) plantation establishments since 1962 to present by companies such as Ghana Rubber Estate Limited (GREL) in the rainforest zones of the Western Region [56] and Plantation Socfinaf Ghana (PSG) since 2012 in the Subri forest reserve part of the study area [57]. PSG was introduced in 2012 after succeeding an abandoned pulp plantation initially operated by Subri Industrial Plantation Limited who was sponsored by AfDB to plant 5000 ha of acacia and establish a (Gmelina arborea) plantation [58]. Aside from the natural forest converted plantation, other agricultural fallow lands within a 25 km radius of Daboase were acquired by SIPL for the Gmelina plantation in 1995 [57]. Due to late and inadequate funding or income, the project stalled and was abandoned [58]. The company, PSG, acquired the plantation when the government privatized it and planted in its stead oil palm and rubber trees. Often, large tracts of the forest are cleared to plant rubber plantations, culminating in substantial forest and other land cover losses [56,59]. Currently, PSG holds 6178 ha and 1012 ha of oil palm and rubber, respectively (PSG communication). Despite the environmental challenges, the palm oil mill of PSG has been operational and has offered jobs to about 2000 Ghanaians since 2019, a source of stable income after the project’s revival [57].
Transitions are not only forest-based; there exists shifts to monocrops cultivation at the detriment of food crops, putting food security at risk [60]. A series of land category transition intensity analyses were conducted to understand how the different land categories changed in the Wassa East landscape for two time periods. The transition in Wassa East was relatively fast and substantially more intensive for almost all land categories during the 2002–2020 period compared to 1986–2002, where cocoa and oil palm showed very remarkable annual change intensity in terms of gains during the first division. Deforestation is responsible for the majority of land conversions in Wassa East, and crop farm/fallow land showed the second most intensive changes of all categories after forest categories. In terms of transition, the forest land categories, thus closed and opened forests, contributed the most to the monocrop categories. However, the oil palm category equally targeted crop farm/fallow and somehow lost to the same category. Likewise, cocoa targeted mostly oil palm and crop farm/fallow. The third monocrop, rubber, also targeted the other monocrops, thus cocoa and oil palm. Only monocrops, such as cocoa and oil palm, intensively gained ground in the first interval but for the second interval, opened and crop farm/fallow came at par, with rubber being the most active category. Despite the high vegetation fragmentation, oil palm and rubber were expanding and aggregating, thereby bringing in some evenness in the land cover class. This means even though the landscape comprises smallholder plots held by smaller holder farmers (2 ha average smallholder farm), when they are put in the same land use over large areas, the cumulative effect on the entire structural characteristics of the landscape mimics a large-scale plantation. This is similar to the findings of Asubonteng and others for cocoa and oil palm plantations in the Kade area in the Eastern Region [10]. Most other farmers intercrop cocoa with food crops for years and then abandon the site after the cocoa canopy forms [61,62]. This is due to the higher price of rubber, easy maintenance of rubber farms, climatic resilience, and better access to bank loans compared to crops [63,64]. Communication with farmers revealed that rubber plantation developments in the Wassa East landscape started in 2013 for the off-reserve areas after farmer consultations with GREL the previous year.
Agriculture is the major force in the bid to end hunger and malnutrition in developing countries [65]. However, this is having repercussions on the environment and social life. Achieving food and nutrition security, reducing inequality, and preserving terrestrial ecosystems is one of the greatest challenges in sustainable land use management. In sub-Saharan Africa for instance, increasing population growth and rising level of food consumption demand that several environmental, political, and socio-economic challenges are resolved to meet international conventions such as the Aichi Biodiversity Targets and the United Nation’s 2030 agenda for Sustainable Development Goals (SDGs). According to Andres et al. [5], the rising demand for cocoa beans and products globally has been met by expanding the area under cocoa production, although productivity per hectare has stagnated at a low level of around 450 kg/ha per year in the last decade.
5. Conclusions
The research applied remote sensing to assess land cover changes in the landscapes of the Wassa East District in the Western Region of Ghana. This information is essential for decision making on land development and biodiversity conservation. We monitored spatial and compositional variations using a post-classification change detection algorithm to generate a change matrix for analyzing land cover transitions. Notably, the forest zones of Ghana are undergoing structural changes resulting from vegetation degradation (deforestation and fragmentation) and reafforestation through monocrop plantation developments. The main losers in the landscape were closed and opened forests, especially in the off-reserve areas. This study established that several hectares of plantation agriculture such as rubber and oil palm are now replacing natural vegetation habitats, thereby threatening indigenous biodiversity.
In the study, we assessed the dominant land transitions among monocrops and other land categories between 1986 and 2020 in the Wassa East District of Ghana. Land use and cover maps of 1986, 2002, and 2020 were produced from freely available historical Landsat images using the ISODATA clustering technique. A change matrix from post-classification change detection from the maps generated revealed land cover transitions and intensities in the periods. The landscape comprised of closed forest, opened forest, cocoa, oil palm, crop farm/fallow, settlement/bare, and waterbodies in 1986 and 2002, with rubber emerging in 2020. Increasingly, the study area is experiencing changes, regardless of the land category. Closed forest transitioned to monocrops such as cocoa, oil palm, and rubber through an intermediate category: crop farm/fallow. This information is essential for decision making on land development and biodiversity conservation.
Author Contributions
Conceptualization, S.K.L.; methodology, S.K.L. and K.O.A.; software, S.K.L., S.K.A. and K.O.A.; validation, S.K.L., S.K.A. and K.O.A.; formal analysis, S.K.L. and K.O.A.; investigation, S.K.L. and K.O.A.; resources, S.K.L.; data curation, S.K.L. and K.O.A.; writing—original draft preparation, S.K.L.; writing—review and editing, S.K.L., K.O.A. and S.K.A.; visualization, S.K.L. and K.O.A.; supervision, S.K.A.; project administration, S.K.L. and S.K.A.; funding acquisition, S.K.L. All authors have read and agreed to the published version of the manuscript.
Funding
The research received funding from UK Research & Innovation (UKRI) through the Global Challenges Research Fund (GCRF) program, grant ref: ES/P011306/ under the project Social and Environmental Trade-offs in African Agriculture (SENTINEL) led by the International Institute for Environment and Development (IIED) in part implemented by the Regional Universities Forum for Capacity Building in Agriculture (RUFORUM).
Informed Consent Statement
Not applicable.
Data Availability Statement
Not applicable.
Acknowledgments
We acknowledge the useful contributions from the Forestry Commission of Ghana staff, especially Charles Nketia (the Takoradi Forest district manager), and Foster Gyau (the forestry technical officer for Subin and surrounding forest reserves. Thanks to my brothers: John Essien and Dzidefo Letsa for hosting me in Takoradi and for all the other support. Sentinel teams from Africa and UK such as Gordon Yofesi Mwesigwa, David Ekepu, Adam Devenish, Geoff Griffiths, and Anthony Egeru—you are greatly appreciated. Best of all, to friends and colleagues: Orlando Dablu, Wisdom E. Akatu, Diana Gbetsi, Lydia Cobbinah, and Kennedy Biaku, for reading through the manuscripts and making relevant suggestions.
Conflicts of Interest
The authors declare no conflict of interest.
References
- Crews, T.E.; Carton, W.; Olsson, L. Is the future of agriculture perennial? Imperatives and opportunities to reinvent agriculture by shifting from annual monocultures to perennial polycultures. Glob. Sustain. 2018, 1, e11. [Google Scholar] [CrossRef] [Green Version]
- Florence, A.M.; McGuire, A.M. Do diverse cover crop mixtures perform better than monocultures? A systematic review. Agron. J. 2020, 112, 3513–3534. [Google Scholar] [CrossRef]
- Rahaman, M.T.; Gurung, D.B.; Pitol, M.N.S. Comparative study of understory between exotic monoculture plantation (Acacia sp.) and adjacent natural sal (Shorea Robusta) forest. Eur. J. Agric. Food Sci. 2020, 2. [Google Scholar] [CrossRef]
- Shipton, P.J. Monoculture and soilborne plant pathogens. Annu. Rev. Phytopathol. 1977, 15, 387–407. [Google Scholar] [CrossRef]
- Andres, C.; Comoé, H.; Beerli, A.; Schneider, M.; Rist, S.; Jacobi, J. Cocoa in monoculture and dynamic agroforestry. In Sustainable Agriculture Reviews; Springer: Cham, Switzerland, 2016; pp. 121–153. [Google Scholar]
- Wainaina, P.; Minang, P.A.; Duguma, L.; Muthee, K. A review of the trade-offs across different cocoa production systems in Ghana. Sustainability 2021, 13, 10945. [Google Scholar] [CrossRef]
- Benefoh, D.T.; Villamor, G.B.; van Noordwijk, M.; Borgemeister, C.; Asante, W.A.; Asubonteng, K.O. Assessing land-use typologies and change intensities in a structurally complex Ghanaian cocoa landscape. Appl. Geogr. 2018, 1, 109–119. [Google Scholar] [CrossRef]
- Yahya, M.S.; Syafiq, M.; Ashton-Butt, A.; Ghazali, A.; Asmah, S.; Azhar, B. Switching from monoculture to polyculture farming benefits birds in oil palm production landscapes: Evidence from mist netting data. Ecol. Evol. 2017, 7, 6314–6325. [Google Scholar] [CrossRef] [PubMed]
- Joshi, L.; Wibawa, G.; Akiefnawati, R.; Mulyoutami, E.; Wulandari, D.; Penot, E. Diversified rubber agroforestry for smallholder farmers-a better alternative to monoculture. In Information Booklet for Workshop on Rubber Development in Lao PDR: Exploring Improved Systems for Smallholder Production; Lao PDR: Vientiane, Lao, 2006; pp. 9–11. [Google Scholar]
- Asubonteng, K.; Pfeffer, K.; Ros-Tonen, M.; Verbesselt, J.; Baud, I. Effects of tree-crop farming on land-cover transitions in a mosaic landscape in the eastern region of Ghana. Environ. Manag. 2018, 62, 529–547. [Google Scholar] [CrossRef] [Green Version]
- Mantey, J.; Nyarko, K.B.; Owusu-Nimo, F.; Awua, K.A.; Bempah, C.K.; Amankwah, R.K.; Akatu, W.E.; Appiah-Effah, E. Influence of illegal artisanal small-scale gold mining operations (galamsey) on oil and grease (O/G) concentrations in three hotspot assemblies of Western Region, Ghana. Environ. Pollut. 2020, 263, 114251. [Google Scholar] [CrossRef]
- Kusimi, J.M. Assessing land use and land cover change in the Wassa West District of Ghana using remote sensing. GeoJ. 2008, 71, 249–259. [Google Scholar] [CrossRef]
- Quarshie, G.K.; Jnr, E.M.O.; Prah, B.E.K.; Amoah, A.S. Fast Fourier transform (FFT) analysis on NDVI time series for assessment of vegetation patterns in Ghana. Int. J. Remote Sens. 2015, 4, 47–51. [Google Scholar]
- Hargreaves, J. Fungal Biodiversity in the Falkland Islands and South Georgia. Ph.D. Thesis, University of Aberdeen, Aberdeen, Scotland, 2019. [Google Scholar]
- William, F.L. Habitat destruction: Death by a thousand cuts. In Conservation Biology for All; Sodhi, N.S., Ehrlich, P.R., Eds.; Oxford University Press: Oxford, UK, 2010; pp. 73–86. [Google Scholar]
- Liao, C.; Brown, D.G. Assessments of synergistic outcomes from sustainable intensification of agriculture need to include smallholder livelihoods with food production and ecosystem services. Curr. Opin. Environ. Sustain. 2018, 32, 53–59. [Google Scholar] [CrossRef]
- Acheampong, E.O.; Macgregor, C.J.; Sloan, S.; Sayer, J. Deforestation is driven by agricultural expansion in Ghana’s forest reserves. Sci. Afr. 2019, 5, e00146. [Google Scholar] [CrossRef]
- Sobeng, A.K.; Agyemang-Duah, W.; Thomas, A.; Oduro Appiah, J. An assessment of the effects of forest reserve management on the livelihoods of forest fringe communities in the Atwima Mponua District of Ghana. For. Trees Livelihoods 2018, 27, 158–174. [Google Scholar] [CrossRef]
- Asubonteng, K.O.; Ros-Tonen, M.A.; Baud, I.S.; Pfeffer, K. Envisioning the future of mosaic landscapes: Actor perceptions in a mixed cocoa/oil-palm area in Ghana. Environ. Manag. 2021, 68, 701–719. [Google Scholar] [CrossRef] [PubMed]
- de Graft-Johnson, K.A.A.; Blay, J.; Nunoo, F.K.E.; Amankwah, C.C. Biodiversity threats assessment of the Western Region of Ghana. In ICFG Initiative Ghana; Coastal Resources Center, University of Rhode Island: Narragansett, RI, USA, 2010; pp. 1–78. [Google Scholar]
- Chiti, T.; Grieco, E.; Perugini, L.; Rey, A.; Valentini, R. Effect of the replacement of tropical forests with tree plantations on soil organic carbon levels in the Jomoro district, Ghana. Plant Soil 2014, 375, 47–59. [Google Scholar] [CrossRef]
- Mensah, A.K.; Mahiri, I.O.; Owusu, O.; Mireku, O.D.; Wireko, I.; Kissi, E.A. Environmental impacts of mining: A study of mining communities in Ghana. Appl. Ecol. Environ. Res. 2015, 3, 81–94. [Google Scholar]
- Kyere-Boateng, R.; Marek, M.V. Analysis of the social-ecological causes of deforestation and forest degradation in Ghana: Application of the DPSIR framework. Forests 2021, 12, 409. [Google Scholar] [CrossRef]
- Ghana Forest and Wildlife Policy. 2022. Available online: https://www.clientearth.org/media/vuvfrzwj/ghana-forest-amp-wildlife-policy-1995-ext-en.pdf (accessed on 25 June 2022).
- Benhin, J.K.; Barbier, E.B. Structural adjustment programme, deforestation and biodiversity loss in Ghana. Environ. Resour. Econ. 2004, 27, 337–366. [Google Scholar] [CrossRef] [Green Version]
- Boakye, J. Understanding motivations for violation of timber harvesting regulation: The case of chainsaw operators in Ghana. For. Policy Econ. 2018, 87, 85–92. [Google Scholar] [CrossRef]
- Ashiagbor, G.; Forkuo, E.K.; Asante, W.A.; Acheampong, E.; Quaye-Ballard, J.A.; Boamah, P.; Mohammed, Y.; Foli, E. Pixel-based and object-oriented approaches in segregating cocoa from forest in the Juabeso-Bia landscape of Ghana. Remote Sens. Appl. Soc. Environ. 2020, 19, 100349. [Google Scholar] [CrossRef]
- Hawthorne, W.D.; Abu-Juam, M.; Gyakari, N.; Ekpe, P. Plants in Ankasa, Nini-Suhien, and Bia. Review of existing knowledge, results from a new survey, and recommendations for management plans. In Protected Areas Development Programme; Ghana Wildlife Department Project financed by the European Union (Project No. 6 ACP/GH045): Western Region, Ghana, 1998. [Google Scholar]
- Adu-Boahen, A. Assessing the Corporate Social Responsibility of Benso Oil Palm Plantation in the Mpohor Wassa East District of Western Region. Master’s Thesis, Kwame Nkrumah University of Science and Technology, Kumasi, Ghana, 2012. [Google Scholar]
- Odoom, D. Relevance of cocoa life project interventions to community development in rural Ghana: Exploring the views of beneficiaries in Wassa East district. JDCS 2021, 8, 22–48. [Google Scholar] [CrossRef]
- Singh, R.K.; Khand, K.; Kagone, S.; Schauer, M.; Senay, G.B.; Wu, Z. A novel approach for next-generation water-use mapping using Landsat and Sentinel-2 satellite data. Hydrol. Sci. J. 2020, 65, 2508–2519. [Google Scholar] [CrossRef]
- Wulder, M.A.; Masek, J.G.; Cohen, W.B.; Loveland, T.R.; Woodcock, C.E. Opening the archive: How free data has enabled the science and monitoring promise of Landsat. Remote Sens. Environ. 2012, 122, 2–10. [Google Scholar] [CrossRef]
- Panuju, D.R.; Paull, D.J.; Griffin, A.L. Change detection techniques based on multispectral images for investigating land cover dynamics. Remote Sens. 2020, 12, 1781. [Google Scholar] [CrossRef]
- Morresi, D.; Vitali, A.; Urbinati, C.; Garbarino, M. Forest spectral recovery and regeneration dynamics in stand-replacing wildfires of central Apennines derived from Landsat time series. Remote Sens. 2019, 11, 308. [Google Scholar] [CrossRef] [Green Version]
- Hewson, R.; Mshiu, E.; Hecker, C.; van der Werff, H.; van Ruitenbeek, F.; Alkema, D.; van der Meer, F. The application of day and night-time ASTER satellite imagery for geothermal and mineral mapping in East Africa. Int. J. Appl. Earth Obs. Geoinf. 2020, 85, 101991. [Google Scholar] [CrossRef]
- Islam, K.N.; Rahman, M.M.; Jashimuddin, M.; Hossain, M.M.; Islam, K.; Al Faroque, M. Analyzing multi-temporal satellite imagery and stakeholders’ perceptions to have an insight into how forest co-management is changing the protected area landscapes in Bangladesh. For. Policy Econ. 2019, 101, 70–80. [Google Scholar] [CrossRef]
- Young, J.C.; Rose, D.C.; Mumby, H.S.; Benitez-Capistros, F.; Derrick, C.J.; Finch, T.; Garcia, C.; Home, C.; Marwaha, E.; Morgans, C.; et al. A methodological guide to using and reporting on interviews in conservation science research. Methods Ecol. Evolut. 2018, 9, 10–19. [Google Scholar] [CrossRef] [Green Version]
- Lillesand, T.; Kiefer, R.W.; Chipman, J. Remote Sensing and Image Interpretation; John Wiley & Sons: Hoboken, NJ, USA, 2015. [Google Scholar]
- Pontius, R.G., Jr. Metrics That Make a Difference: How to Analyze Change and Error; Springer Nature: Berlin/Heidelberg, Germany, 2022. [Google Scholar]
- Martins, V.S.; Soares, J.V.; Novo, E.M.; Barbosa, C.C.; Pinto, C.T.; Arcanjo, J.S.; Kaleita, A. Continental-scale surface reflectance product from CBERS-4 MUX data: Assessment of atmospheric correction method using coincident Landsat observations. Remote Sens. Environ. 2018, 218, 55–68. [Google Scholar] [CrossRef]
- Wicaksono, P.; Hafizt, M. Dark target effectiveness for dark-object subtraction atmospheric correction method on mangrove above-ground carbon stock mapping. IET Image Process. 2018, 12, 582–587. [Google Scholar] [CrossRef]
- Olaode, A.; Naghdy, G.; Todd, C. Unsupervised classification of images: A review. IJIP 2014, 8, 325–342. [Google Scholar]
- Shivakumar, B.R. Land cover mapping capability of chaincluster, K-means, and ISODATA techniques—A case study. In Advances in VLSI, Signal Processing, Power Electronics, IoT, Communication and Embedded Systems; Springer: Singapore, 2021; pp. 273–288. [Google Scholar]
- Lu, D.; Weng, Q. A survey of image classification methods and techniques for improving classification performance. Int. J. Remote Sens. 2007, 28, 823–870. [Google Scholar] [CrossRef]
- Zhou, P.; Huang, J.; Pontius, R.G.; Hong, H. Land classification and change intensity analysis in a coastal watershed of Southeast China. Sensors 2014, 14, 11640–11658. [Google Scholar] [CrossRef] [Green Version]
- ERDAS EI. Hexagon Geospatial, 305 Intergraph Way; ERDAS Imagine Software: Madison, AL, USA, 2014. [Google Scholar]
- Aldwaik, S.Z.; Pontius, R.G., Jr. Map errors that could account for deviations from a uniform intensity of land change. Int. J. Geogr. Inf. Sci. 2013, 27, 1717–1739. [Google Scholar] [CrossRef]
- Quan, B.; Pontius, R.G., Jr.; Song, H. Intensity analysis to communicate land change during three-time intervals in two regions of Quanzhou City, China. GISci. Remote Sens. 2020, 57, 21–36. [Google Scholar] [CrossRef]
- Pontius, R.G., Jr.; Shusas, E.; McEachern, M. Detecting important categorical land changes while accounting for persistence. Agric. Ecosyst. Environ. 2004, 101, 251–268. [Google Scholar] [CrossRef]
- Braimoh, A.K. Random and systematic land-cover transitions in northern Ghana. Agric. Ecosyst. Environ. 2006, 113, 254–263. [Google Scholar] [CrossRef]
- Lu, D.; Mausel, P.; Brondizio, E.; Moran, E. Change detection techniques. Int. J. Remote Sens. 2004, 25, 2365–2401. [Google Scholar] [CrossRef]
- Macleod, R.D.; Congalton, R.G. A quantitative comparison of change-detection algorithms for monitoring eelgrass from remotely sensed data. PE&RS 1998, 64, 207–216. [Google Scholar]
- Hackman, K.O.; Gong, P.; Wang, J. New land-cover maps of Ghana for 2015 using Landsat 8 and three popular classifiers for biodiversity assessment. Int. J. Remote Sens. 2017, 38, 4008–4021. [Google Scholar] [CrossRef]
- Wolff, S.; Meijer, J.; Schulp, C.J.; Verburg, P.H. Contextualizing local landscape initiatives in global change: A scenario study for the high forest zone, Ghana. Reg. Environ. Change 2020, 20, 115. [Google Scholar] [CrossRef]
- Paitan, C.P.; Verburg, P.H. Accounting for land use changes beyond the farm-level in sustainability assessments: The impact of cocoa production. Sci. Total Environ. 2022, 825, 154032. [Google Scholar] [CrossRef] [PubMed]
- Wauters, J.B.; Coudert, S.; Grallien, E.; Jonard, M.; Ponette, Q. Carbon stock in rubber tree plantations in Western Ghana and Mato Grosso (Brazil). For. Ecol. Manag. 2008, 255, 2347–2361. [Google Scholar] [CrossRef]
- PSG Website. Available online: https://www.socfin.com/en/locations/psg (accessed on 25 February 2022).
- Bissell, C. Restoring More Than Forests: How Rights-Based Forest Restoration Can Empower Communities, Recover Biodiversity, and Tackle the Climate Crisis. Available online: https://www.fern.org/fileadmin/uploads/fern/Documents/2020/Fern_Restoring_more_than_forests_long_report.pdf (accessed on 21 May 2022).
- Appiah-Badu, K.; Anning, A.K.; Eshun, B.; Mensah, G. Land use effects on tree species diversity and soil properties of the Awudua Forest, Ghana. Glob. Ecol. Conserv. 2022, 34, e02051. [Google Scholar] [CrossRef]
- Dzanku, F.M.; Tsikata, D.; Ankrah, D.A. The gender and geography of agricultural commercialisation: What implications for the food security of Ghana’s smallholder farmers? J. Peasant Stud. 2021, 48, 1507–1536. [Google Scholar] [CrossRef]
- Ajagun, E.O.; Ashiagbor, G.; Asante, W.A.; Gyampoh, B.A.; Obirikorang, K.A.; Acheampong, E. Cocoa eats the food: Expansion of cocoa into food croplands in the Juabeso District, Ghana. Food Secur. 2021, 14, 451–470. [Google Scholar] [CrossRef]
- Hashmiu, I.; Agbenyega, O.; Dawoe, E. Cash crops and food security: Evidence from smallholder cocoa and cashew farmers in Ghana. Agric. Food Secur. 2022, 11, 12. [Google Scholar] [CrossRef]
- Oduro, K.A.; Arts, B.; Kyereh, B.; Mohren, G. Farmers’ motivations to plant and manage on-farm trees in Ghana. Small-Scale For. 2018, 17, 393–410. [Google Scholar] [CrossRef]
- Bugri, J.T.; Yeboah, E. Understanding Changing Land Access and Use by the Rural Poor in Ghana; International Institute for Environment and Development: London, UK, 2017. [Google Scholar]
- Uphaus, C. Ending Hunger. In The Role of Agriculture; Bread for the World Institute: Washington, DC, USA, 2008; pp. 1–7. [Google Scholar]
Figure 1.
Wassa East study district in the Western Region of Ghana.

Figure 2.
Framework for landscape mapping and structural analysis.

Figure 3.
Land category maps for 1986 (TL), 2002 (TR), and 2020 (BR) as part of the Wassa East district.
Figure 3.
Land category maps for 1986 (TL), 2002 (TR), and 2020 (BR) as part of the Wassa East district.


Figure 4.
Percentage class distributions for 1986, 2002, and 2020 classified maps.

Figure 5.
Time interval level Intensity Analysis.

Figure 6.
Category level intensity analysis for 1986–2002 (a); and 2002–2020 (b).

Figure 7.
Transition to and from oil palm in (a) size and (b) intensity for 1986–2002 time scale (dashed lines represent uniform intensity).
Figure 7.
Transition to and from oil palm in (a) size and (b) intensity for 1986–2002 time scale (dashed lines represent uniform intensity).

Figure 8.
Transition to and from oil palm in (a) size and (b) intensity for 2002–2020 time scale (dashed lines represent uniform intensity).
Figure 8.
Transition to and from oil palm in (a) size and (b) intensity for 2002–2020 time scale (dashed lines represent uniform intensity).

Figure 9.
Transition to and from cocoa in (a) size and (b) intensity for 1986–2002 time scale (dashed lines represent uniform intensity).
Figure 9.
Transition to and from cocoa in (a) size and (b) intensity for 1986–2002 time scale (dashed lines represent uniform intensity).

Figure 10.
Transition to and from cocoa in (a) size and (b) intensity for 2002–2020 time scale (dashed lines represent uniform intensity).
Figure 10.
Transition to and from cocoa in (a) size and (b) intensity for 2002–2020 time scale (dashed lines represent uniform intensity).

Figure 11.
Transition to rubber in (a) size and (b) intensity during 2002–2020 time period.


Table 1.
List of Landsat images acquired for the study.
| Landsat Scene ID | Acquisition Date | Satellite/Sensor | Spatial Resolution | No. of Bands |
|---|---|---|---|---|
| LT05_L1TP_194056_19861229_20170215 | 29 December 1986 | Landsat-5 TM | 30 m | 7 |
| LE07_L1TP_194056_20020115_20170201 | 15 January 2002 | Landsat-7 ETM+ | 30 m | 9 |
| LC08_L1TP_194056_20200109_20200114 | 9 January 2020 | Landsat-8 OLI | 30 m | 11 |
Table 2.
Land cover classification scheme.
| Land Cover Classes | Class Description of the Landscape |
|---|---|
| Closed forest | Woodland areas with dense tree canopy occupying more than 0.5 ha with trees higher than 5 m. This includes woodlands in and outside conservation areas but excludes tree crops such as cocoa and rubber meeting these criteria. |
| Open forest | Degraded woodland areas with dense tree canopy occupying more than 0.5 ha with trees higher than 5 m. |
| Crop farm/ fallow | Portions of the landscape are arable and planted with temporal annual or biannual crops and devoid of permanent commercial crops. This class includes fallow areas that are in series with cropping periods. |
| An area may also contain shrubs and grasses, a predominant feature in fallow areas. | |
| Waterbody | Refers to all forms of water bodies in the study area, i.e., river networks, streams, lagoons, stagnant waterbodies. |
| Rubber | Any plantation of trees that yields latex from which rubber is produced, esp. Hevea brasiliensis; the latex is collected from slashes made in the bark and used to make commercial rubber. |
| Oil palm | Perennial farmlands consist of African pinnate-leaved palm (Elaeis guineensis) cultivated for its clustered fruit whose flesh and seeds yield oil. |
| Cocoa * | Farms consist mainly of a small tropical American evergreen tree, Theobroma cacao, cultivated for its seeds, the source of cocoa beans, chocolate, etc. |
| Settlement/bare | Minimal isolated to non-vegetated parts of the landscape including built-up, bare, rocky, beach, and mined-out areas. |
* Refers to areas under the cultivation of tree-like crops that produce outputs over many harvesting seasons and last longer on the land. These are usually planted for commercial returns.
Table 3.
A 4 × 4 land cover transition matrix.
| 1986 | 2020 | |||||
|---|---|---|---|---|---|---|
| Category 1 | Category 2 | Category 3 | Category 4 | Total 1986 | Loss | |
| Category 1 | C11 | C12 | C13 | C14 | C1+ | C1+–C11 |
| Category 2 | C21 | C22 | C23 | C24 | C2+ | C2+–C22 |
| Category 3 | C31 | C32 | C33 | C34 | C3+ | C3+–C33 |
| Category 4 | C41 | C42 | C43 | C44 | C4+ | C4+–C44 |
| Total 2020 | C+1 | C+2 | C+3 | C+4 | 1 | |
| Gain | C+1–C11 | C+2–C22 | C+3–C33 | C+4–C44 | ||
Table 4.
Percentage area changes (negative percentages represent decreasing change).
| 1986–2002 Changes | 2002–2020 Changes | 1986–2020 Changes | ||||
|---|---|---|---|---|---|---|
| Class Names | % Change Area | % Annual | % Change Area | % Annual | % Change Area | % Annual |
| Closed forest | −10.69 | −0.67 | −26.16 | −1.64 | −34.05 | −2.13 |
| Opened forest | −38.12 | −2.31 | −38.12 | −2.38 | −61.01 | −3.81 |
| Cocoa | 567.22 | 35.45 | 92.08 | 5.75 | 1181.56 | 73.85 |
| Oil palm | 262.15 | 16.38 | 178.45 | 11.15 | 908.42 | 56.78 |
| Crop farm/fallow | 18.27 | 1.14 | 30.71 | 1.92 | 54.60 | 3.41 |
| Settlement/bare | 15.71 | 0.98 | 43.12 | 2.70 | 65.61 | 4.10 |
| Waterbody | 5.12 | 0.32 | 11.94 | 0.75 | 15.67 | 1.10 |
Table 5.
Transition matrix 1986–2002 in units of pixels (30 m × 30 m) and percentage of the landscape.
Table 5.
Transition matrix 1986–2002 in units of pixels (30 m × 30 m) and percentage of the landscape.
| 1986 | 2002 Land Cover Map (% and Number of Pixels) | ||||||||
|---|---|---|---|---|---|---|---|---|---|
| Closed Forest | Opened Forest | Cocoa | Oil Palm | Farm/Fallow | Settlement/b. | Waterbody | Total ‘86 | Loss | |
| Closed forest | 953,915 | 81,475 | 80,107 | 19,007 | 1898 | 811 | 1000 | 1,138,213 | 184,298 |
| 83.81 | 7.16 | 7.04 | 1.67 | 0.17 | 0.07 | 0.09 | |||
| Opened forest | 56,036 | 46,085 | 74,669 | 34,461 | 7616 | 245 | 95 | 219,207 | 173,122 |
| 25.56 | 21.02 | 34.06 | 15.72 | 3.47 | 0.11 | 0.04 | |||
| Cocoa | 4064 | 5670 | 9565 | 4528 | 2131 | 79 | 1 | 26,038 | 16,473 |
| 15.61 | 21.78 | 36.73 | 17.39 | 8.18 | 0.3 | 0.00 | |||
| Oil palm | 581 | 2374 | 5903 | 6757 | 3544 | 83 | 1 | 19,243 | 12,486 |
| 3.02 | 12.34 | 30.68 | 35.11 | 18.42 | 0.43 | 0.01 | |||
| Crop farm/fallow | 1237 | 2388 | 3450 | 4898 | 4725 | 402 | 0 | 17,100 | 12,375 |
| 7.23 | 13.96 | 20.18 | 28.64 | 27.63 | 2.35 | 0.00 | |||
| Settlement/bare | 0 | 98 | 20 | 38 | 311 | 6878 | 0 | 7345 | 467 |
| 0.00 | 1.33 | 0.27 | 0.52 | 4.23 | 93.64 | 0.00 | |||
| Waterbody | 715 | 31 | 16 | 0 | 0 | 0 | 5783 | 6545 | 762 |
| 10.92 | 0.47 | 0.24 | 0.00 | 0.00 | 0.00 | 88.36 | |||
| Total 2002 | 1,016,548 | 138,121 | 173,730 | 69,689 | 20,225 | 8498 | 6880 | 1,433,691 | |
| Gain | 62,633 | 92,036 | 164,165 | 62,932 | 15,500 | 1620 | 1097 | ||
The italicized figures are the percentage values and the bold indicate the persistence of land categories.
Table 6.
Transition matrix 2002–2020 in units of pixels (30 m × 30 m) and percent of landscape (below).
Table 6.
Transition matrix 2002–2020 in units of pixels (30 m × 30 m) and percent of landscape (below).
| 2002 | 2020 Land Cover Map (%) | |||||||||
|---|---|---|---|---|---|---|---|---|---|---|
| Closed Forest | Opened Forest | Cocoa | Oil Palm | Crop Farm/ Fallow | Settlement/b. | Waterbody | Rubber | Total 2002 | Loss | |
| Closed forest | 729,136 | 50,024 | 116,475 | 104,354 | 3615 | 1730 | 1695 | 8643 | 1,015,669 | 286,534 |
| 71.73 | 4.92 | 11.46 | 10.27 | 0.36 | 0.17 | 0.17 | 0.85 | |||
| Opened forest | 11,235 | 17,238 | 68,672 | 28,066 | 5948 | 1768 | 230 | 4722 | 137,877 | 120,639 |
| 8.13 | 12.48 | 49.72 | 20.32 | 4.31 | 1.28 | 0.17 | 3.42 | |||
| Cocoa | 6980 | 13,119 | 102,477 | 34,094 | 8026 | 1033 | 205 | 7562 | 173,495 | 71,018 |
| 4.02 | 7.55 | 58.99 | 19.62 | 4.62 | 0.59 | 0.12 | 4.35 | |||
| Oil palm | 1484 | 3371 | 36,280 | 20,685 | 4708 | 711 | 13 | 2364 | 69,615 | 48,930 |
| 2.13 | 4.84 | 52.06 | 29.68 | 6.76 | 1.02 | 0.02 | 3.39 | |||
| Crop farm/fallow | 30 | 473 | 7363 | 6193 | 3348 | 2697 | 7 | 83 | 20,193 | 16,845 |
| 0.15 | 2.34 | 36.4 | 30.62 | 16.56 | 13.34 | 0.03 | 0.41 | |||
| Settlement/bare | 543 | 1150 | 1351 | 354 | 745 | 4188 | 0 | 79 | 8409 | 4221 |
| 6.39 | 13.53 | 15.89 | 4.16 | 8.77 | 49.27 | 0.00 | 0.92 | |||
| Waterbody | 652 | 13 | 644 | 18 | 8 | 4 | 5543 | 0 | 6880 | 1337 |
| 9.47 | 0.19 | 9.36 | 0.25 | 0.11 | 0.06 | 80.56 | 0.00 | |||
| Rubber | 0 | 0 | 0 | 0 | 0 | 0 | 0 | 0 | 0 | 0 |
| 0 | 0 | 0 | 0 | 0 | 0 | 0 | 0 | |||
| Total ‘20 | 750,058 | 85,389 | 333,261 | 193,762 | 26,396 | 12,130 | 7691 | 23,452 | 1,432,138 | |
| Gain | 20,922 | 68,150 | 230,784 | 173,077 | 23,048 | 7942 | 2149 | 23,452 | ||
The italicized figures are the percentage values and the bold indicate the persistence of land categories.
Publisher’s Note: MDPI stays neutral with regard to jurisdictional claims in published maps and institutional affiliations. |
© 2022 by the authors. Licensee MDPI, Basel, Switzerland. This article is an open access article distributed under the terms and conditions of the Creative Commons Attribution (CC BY) license (https://creativecommons.org/licenses/by/4.0/).
Share and Cite
MDPI and ACS Style
Loh, S.K.; Asubonteng, K.O.; Adanu, S.K. Effects of Monocropping on Land Cover Transitions in the Wet Evergreen Agro-Ecological Zone of Ghana. Land 2022, 11, 1063. https://doi.org/10.3390/land11071063
AMA Style
Loh SK, Asubonteng KO, Adanu SK. Effects of Monocropping on Land Cover Transitions in the Wet Evergreen Agro-Ecological Zone of Ghana. Land. 2022; 11(7):1063. https://doi.org/10.3390/land11071063
Chicago/Turabian StyleLoh, Seyram K., Kwabena O. Asubonteng, and Selase K. Adanu. 2022. "Effects of Monocropping on Land Cover Transitions in the Wet Evergreen Agro-Ecological Zone of Ghana" Land 11, no. 7: 1063. https://doi.org/10.3390/land11071063
Note that from the first issue of 2016, this journal uses article numbers instead of page numbers. See further details here.