Article

The Impacts of Regional Cooperation on Urban Land-Use Efficiency: Evidence from the Yangtze River Delta, China

Law School, Ningbo University, Ningbo 315211, China
*
Author to whom correspondence should be addressed.
Land 2022, 11(6), 915; https://doi.org/10.3390/land11060915
Submission received: 10 May 2022 / Revised: 7 June 2022 / Accepted: 13 June 2022 / Published: 15 June 2022
(This article belongs to the Special Issue Urban Land Development in the Process of Urbanization)

Abstract

:
Urban land-use efficiency (ULUE) has been increasingly recognized as an issue of land-use management across the world in the last century as the globe experienced unprecedented rapid urban expansion. However, although a large body of studies was dedicated to analyzing the driving forces of ULUE, literature was rarely focused on the impacts of regional cooperation on ULUE. To bridge the knowledge gap, we used the Chinese trailblazer of regional cooperation–Yangtze River delta (YRD)—as a case to reveal the impacts of regional cooperation on ULUE. Social network analysis and a super efficiency SBM model with undesirable outputs were used to measure regional cooperation and ULUE, respectively. Furthermore, the impacts of regional cooperation on ULUE were examined by using the geographically and temporally weighted regression model. The results show that regional cooperation in the YRD strengthened from 2009 to 2016, among which Shanghai was the core node city in the YRD. Only seven cities maintained good ULUE with a stable trend during 2009–2016. The regression results indicated the positive impacts of regional cooperation on ULUE, which was more evident in the southern cities of the YRD. The potential mechanism to explain the impacts of regional cooperation on ULUE includes co-building transportation facilities and joint development zones. These findings provide insightful implications for improving ULUE by strengthening regional cooperation in Chinese cities.

1. Introduction

The world has witnessed unprecedented urban expansion during the last century [1,2]. Global urban land has increased by 58,000 km2 from 1970 to 2000. If the trend is to be continued, global urban land area is projected to increase by 1.2 million km2 in 2030, tripling the amount circa 2000 [3]. Unfortunately, rapid urban expansion has been accompanied by inefficient urban land use, which more frequently takes place in developing countries [4,5,6]. Inefficient urban land use indicates extensive land development that is characterized by high coverage of the urban built-up area with low yield in a region. According to the report on China’s land use situation by Wang, et al. [7], 45% of urban land is used inefficiently, and approximately 5% of it is vacant. Furthermore, inefficient urban land use has resulted in considerable loss of cultivated land and ecological land, imposing challenges for food security and environmental protection [8,9,10]. Therefore, the concerns about ULUE and its driving forces have attracted great attention from decision-makers, scholars, and planners across the world.
ULUE was defined as the yield per unit of urban land area with respect to social and economic activities [11]. There is a plethora of studies related to ULUE, which can be categorized into two main streams. The first stream is measuring ULUE through the lens of economic, social, and environmental output [12,13]. An increasing body of studies found that most cities show an increasing trend of ULUE with technological progress [14]. At the urban agglomeration scale, the world-class urban agglomerations are inclined to have better ULUE than nation-class and region-class urban agglomerations [15,16]. At the city scale, developed cities are generally characterized by higher land-use efficiency [17,18]. In terms of land types, residential land has been used effectively as compared to industrial land [19]. The second stream is exploring the driving forces of ULUE. Existing literature found that land market [20], land-use structure [21], socio-economic development [22], local government behavior [23], and public policy [24] imposed positive impacts on ULUE. However, existing literature was focused on the effect of endogenous factors of a city on ULUE, particularly from the perspective of socio-economic determinants. By contrast, exogenous factors resulting from the interaction among cities, such as regional cooperation, were chronically overlooked in previous studies.
Regional cooperation is likely to be an instrument in affecting land-use efficiency [25,26]. Regional cooperation is regarded as any kind of formalized trans-local, international, or bi-lateral cooperation between local authorities and their communities [27]. It is well-known as the modes of “twin city strategy” [28], “city-helps-city schemes” [29], and “inter-city integration agenda” [30], which is an efficient way to facilitate the linkages of economic, social, and institutional affairs among cities for alleviating urban competition [31]. Inevitably, regional cooperation seems to have profound impacts on regional land-use management [32]. On the one hand, industrial development cooperation among cities over a physical space (e.g., cross-jurisdictional economic development zones) promotes industries from scattered distribution to a cluster pattern [33]. This gains the industrial agglomeration effect, which is beneficial for industrial yield but also saves industrial land resources. On the other hand, cooperative spatial planning for a city-region regulates disordered urban land development through formulating spatial zones and planning ordinances [34]. By establishing coordination mechanisms for land development, intensive land development could be implemented in the region. For example, the Pearl River Delta Urban Cluster Coordination Plan proposed a spatial zone with “one core area, three belts, and five axes” to prevent urban sprawl. Nevertheless, although regional cooperation is increasingly acknowledged as a driver affecting urban land use, the impacts of regional cooperation on ULUE remain rarely explored.
To bridge the knowledge gap, we used the Chinese pioneer of regional cooperation—YRD—as a case to explore the impacts of regional cooperation on ULUE. This paper was dedicated to two issues: (1) what are the characteristics of regional cooperation and ULUE in the YRD; (2) how regional cooperation imposes impacts upon the ULUE. We used social network analysis and a super efficiency slack-based measure (SBM) model with undesirable outputs to measure the intensity of regional cooperation and ULUE, respectively. Furthermore, the impacts of regional cooperation on ULUE were examined by using geographically and temporally weighted regression (GTWR). Thus, this article proceeds as follows. Section 2 following the introduction presents a conceptual framework about the definitions, dimensions, and potential impacts of regional cooperation on ULUE, which provided the theoretical premise for this study. Section 3 introduces the study area of YRD, data source, and research methods. Section 4 demonstrates the results, including regional cooperation, ULUE, and the impacts of regional cooperation on ULUE. Section 5 shows the mechanism related to the impacts of regional cooperation on ULUE, policy implications, and limitations. Section 6 is the conclusion. The present work has two potential contributions. On the one hand, a conceptual framework was established to clarify how regional cooperation imposes impacts on ULUE, providing a new lens on the driving forces of ULUE. On the other hand, the empirical analysis was conducted to examine the conceptual framework about the impacts of regional cooperation on ULUE and to further discuss the possible explanations for the differences in the impacts among cities.

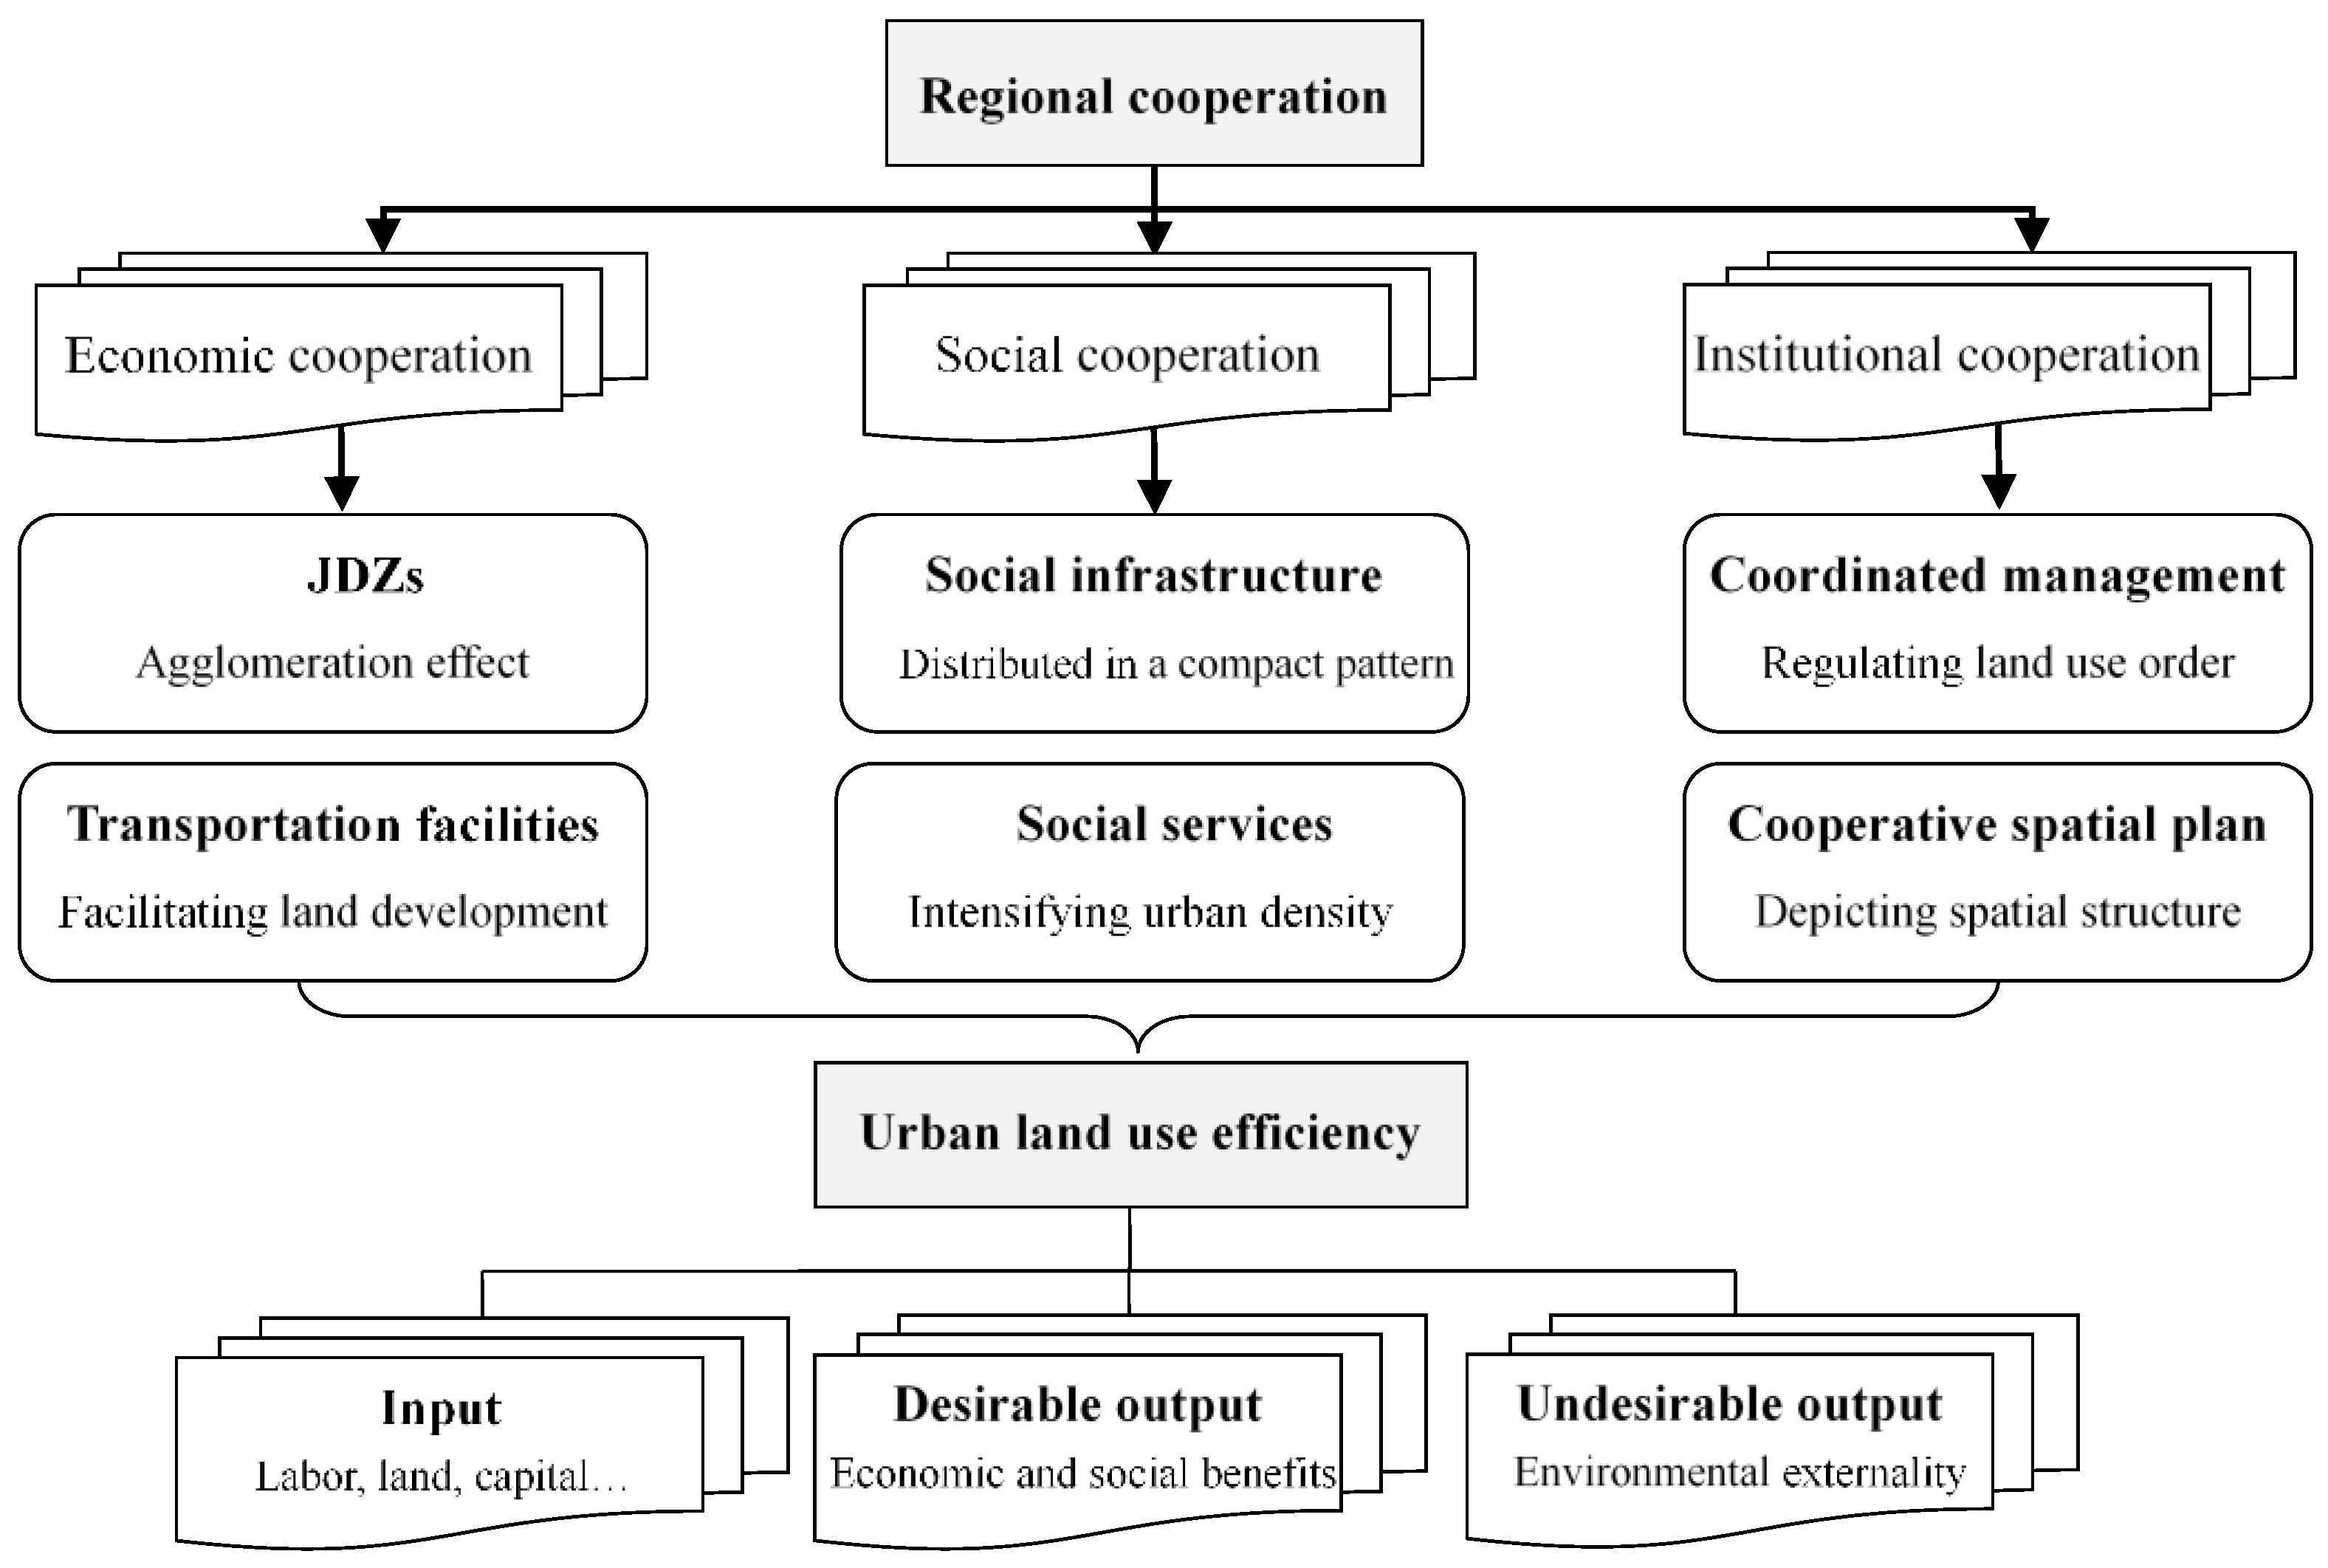
2. Conceptual Framework

Regional cooperation is defined as the coordination made by the governments, society, and markets to reduce negative externalities from economic globalization and intercity competition [35]. According to Zhang, et al. [36], regional cooperation can be summarized as three dimensions: economic cooperation, social cooperation, and institutional cooperation. Firstly, economic cooperation reflects the agglomeration of economic activities for a city-region [37]. It is considered to be the initial form of cross-border regional integration [38,39], which focuses on promoting the flow and recombination of production elements among regions. In recent years, due to the fewer land quotas, more big cities are keen on seeking physical space for industrial development with surrounding less-developed cities. More economic cooperation modes are emerging, such as co-building industrial development zones, and developing infrastructures. Secondly, social cooperation is related to social welfare to improve social interaction, which helps support economic contact. It aims to integrate multiple participants (e.g., enterprises, the public, governments, and non-governmental organizations) to share better social services in terms of science, education, culture, public health, and entertainment. For example, the case of Ningbo-Zhoushan-Taizhou (Zhejiang province) city-regional cooperation shows that in parallel with economic cooperation, a range of social cooperation in realms, i.e., human resources, credit information, and healthcare is set to enhance social wellbeing. Thirdly, institutional cooperation bridges territorial authorities in forms of urban planning, urban management, and institution construction [36]. Existing literature shows that it is an efficient way to be initiated by subordinate governments with the active involvement of superior governments [40]. It can not only ensure that the local authorities make great efforts for the mutual interests, but also enable the superior government to play its regulatory role, as well as provide support and preferential policies for the cooperation.
ULUE includes two concepts–structure efficiency at the macro level and margin efficiency at the micro level. The former is focused on the degree of planned land use, which reflects the effects of public policy on land use. The latter is focused on the output of land per unit area, which reflects the productive capability of land resources. In this paper, ULUE was used to measure the input-output relationship at the micro level, reflecting the transformation capability from resource consumption to economic, social, and environmental benefits. Generally speaking, the dimensions of land input often refer to production elements, including labor, land, and capital [41]. According to Xie, et al. [42], technology is the other important dimension of land input. The dimensions of land output were initially focused on economic and social benefits [25,43]. However, due to the worsening environmental issues across the world, negative environmental externalities of land use have attracted great attention. They are often regarded as undesirable outputs from land development. For example, the wastewater and solid waste from the secondary and tertiary industries are defined as undesirable outputs.
The potential impacts of regional cooperation on ULUE are concluded as follows (Figure 1). First, economic cooperation improves ULUE through joint development zones (JDZs) and co-building transportation facilities. China’s development zones were initially designed to attract foreign direct investments and promote regional economic development [44,45]. JDZs usually attract high-added-value industries [46] by supporting extensive land, abundant labor, and sufficient raw materials. The process promotes intensification of land use and upgrading of industrial structure, which is conducive to gaining an agglomeration effect [22]. As mentioned by Duranton and Puga [37], “sharing, matching, and learning” among cooperative firms fosters agglomeration externalities. In addition, economic cooperation is concomitant with coordinated planning of transportation facilities, i.e., a joint port, a regionally integrated railway network with identical railway gauges, regional shipping companies, and an integrated highway system [47]. The co-building transportation facilities are committed to facilitating land development along the routes and quickening production-element exchange among cities. Second, social cooperation is an efficient way to optimize land-use strategy. On the one hand, an important approach of social cooperation is building social infrastructure, such as research institutions, universities, cultural institutions, and healthcare facilities [48,49]. Those infrastructures are likely to be distributed along with the sites of economic cooperation, i.e., urban core, industrial parks, and economic development zones. Such a strategy ensures a compact land-use pattern. On the other hand, the enhancement of cooperation in social services contributes to increasing social interaction and driving human and social capital. The process leads the urban population to concentrate in urban areas, which intensifies urban density. Third, institutional cooperation acts as a guide in urban land use from government behavior through coordinated urban management and cooperative spatial planning. Coordinated urban management refers to a series of governance rules formulated by cities to regulate land developmental order, including planning ordinances and spatial governance zones [34]. This takes account of urban land development intensity and density in different cities, which is beneficial for reducing ineffective land use. Cooperative spatial planning is dedicated to depicting a concrete spatial structure of the core, axe, belt, and network among cities. By implementing these cooperative regional plans, land-use patterns will be stipulated, which prevents disordered urban land use. In sum, we suppose that regional cooperation will pose positive impacts on ULUE according to the conceptual framework.

3. Data Source and Methodology
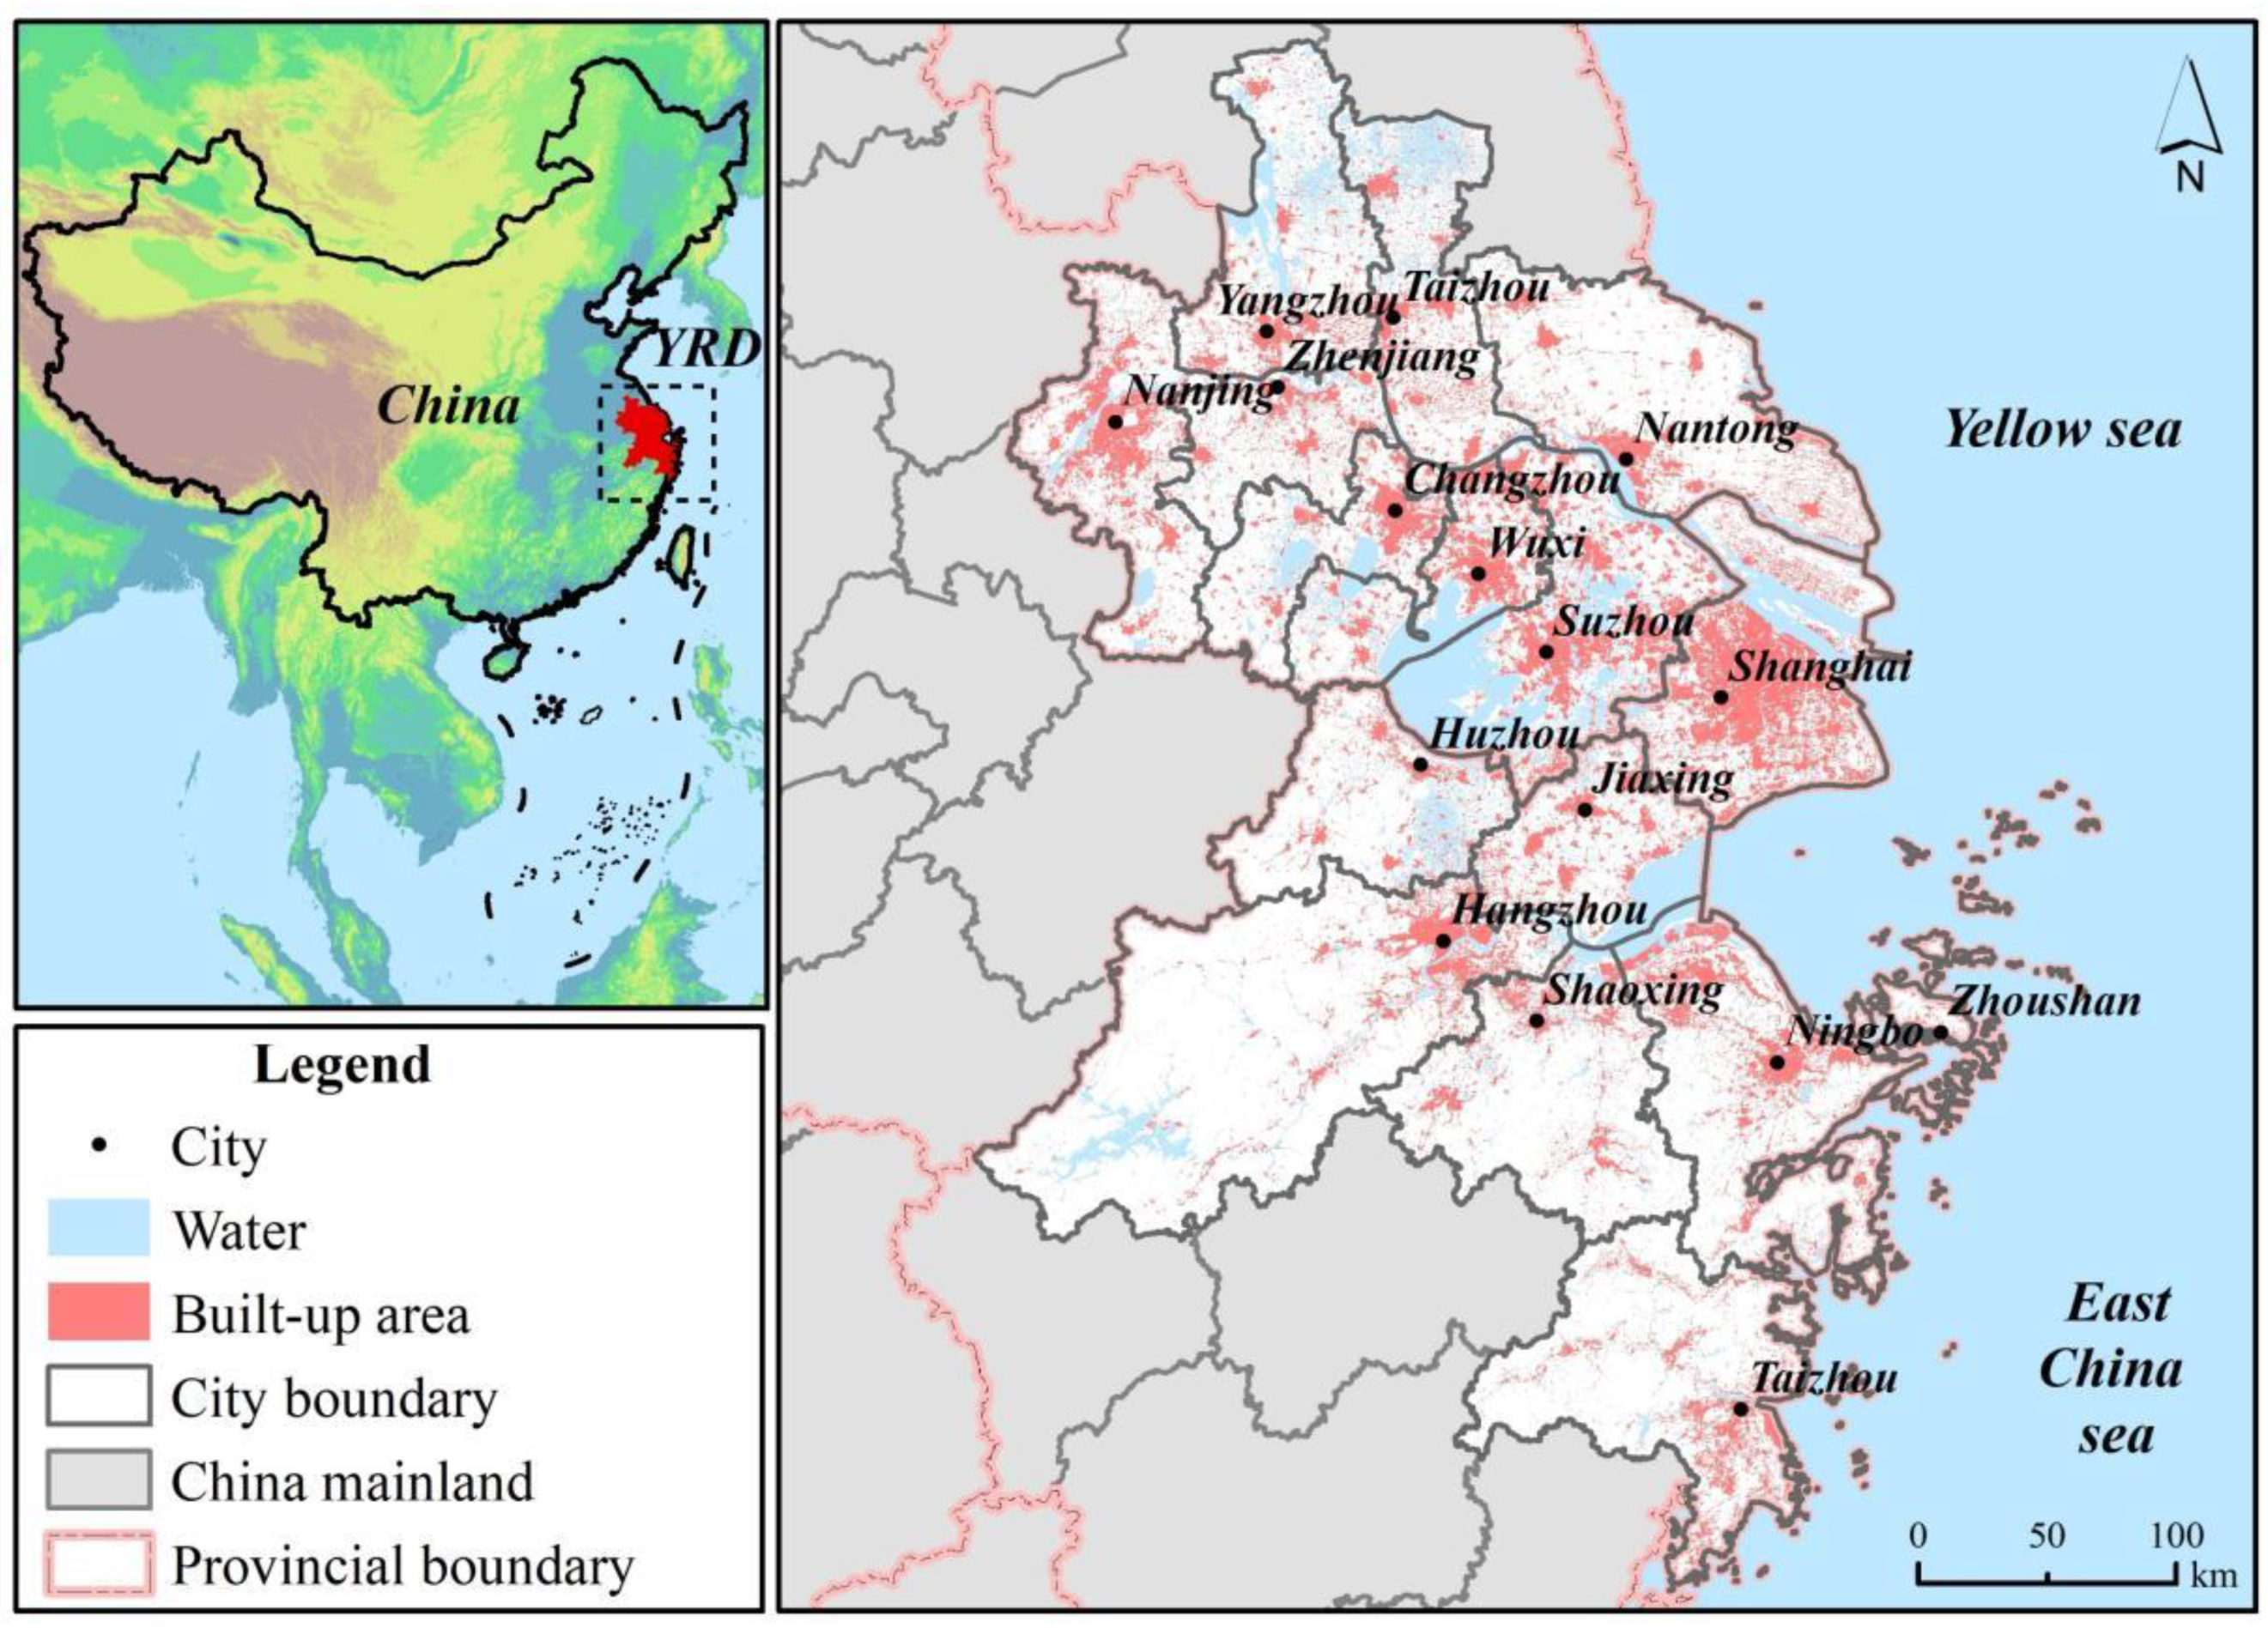
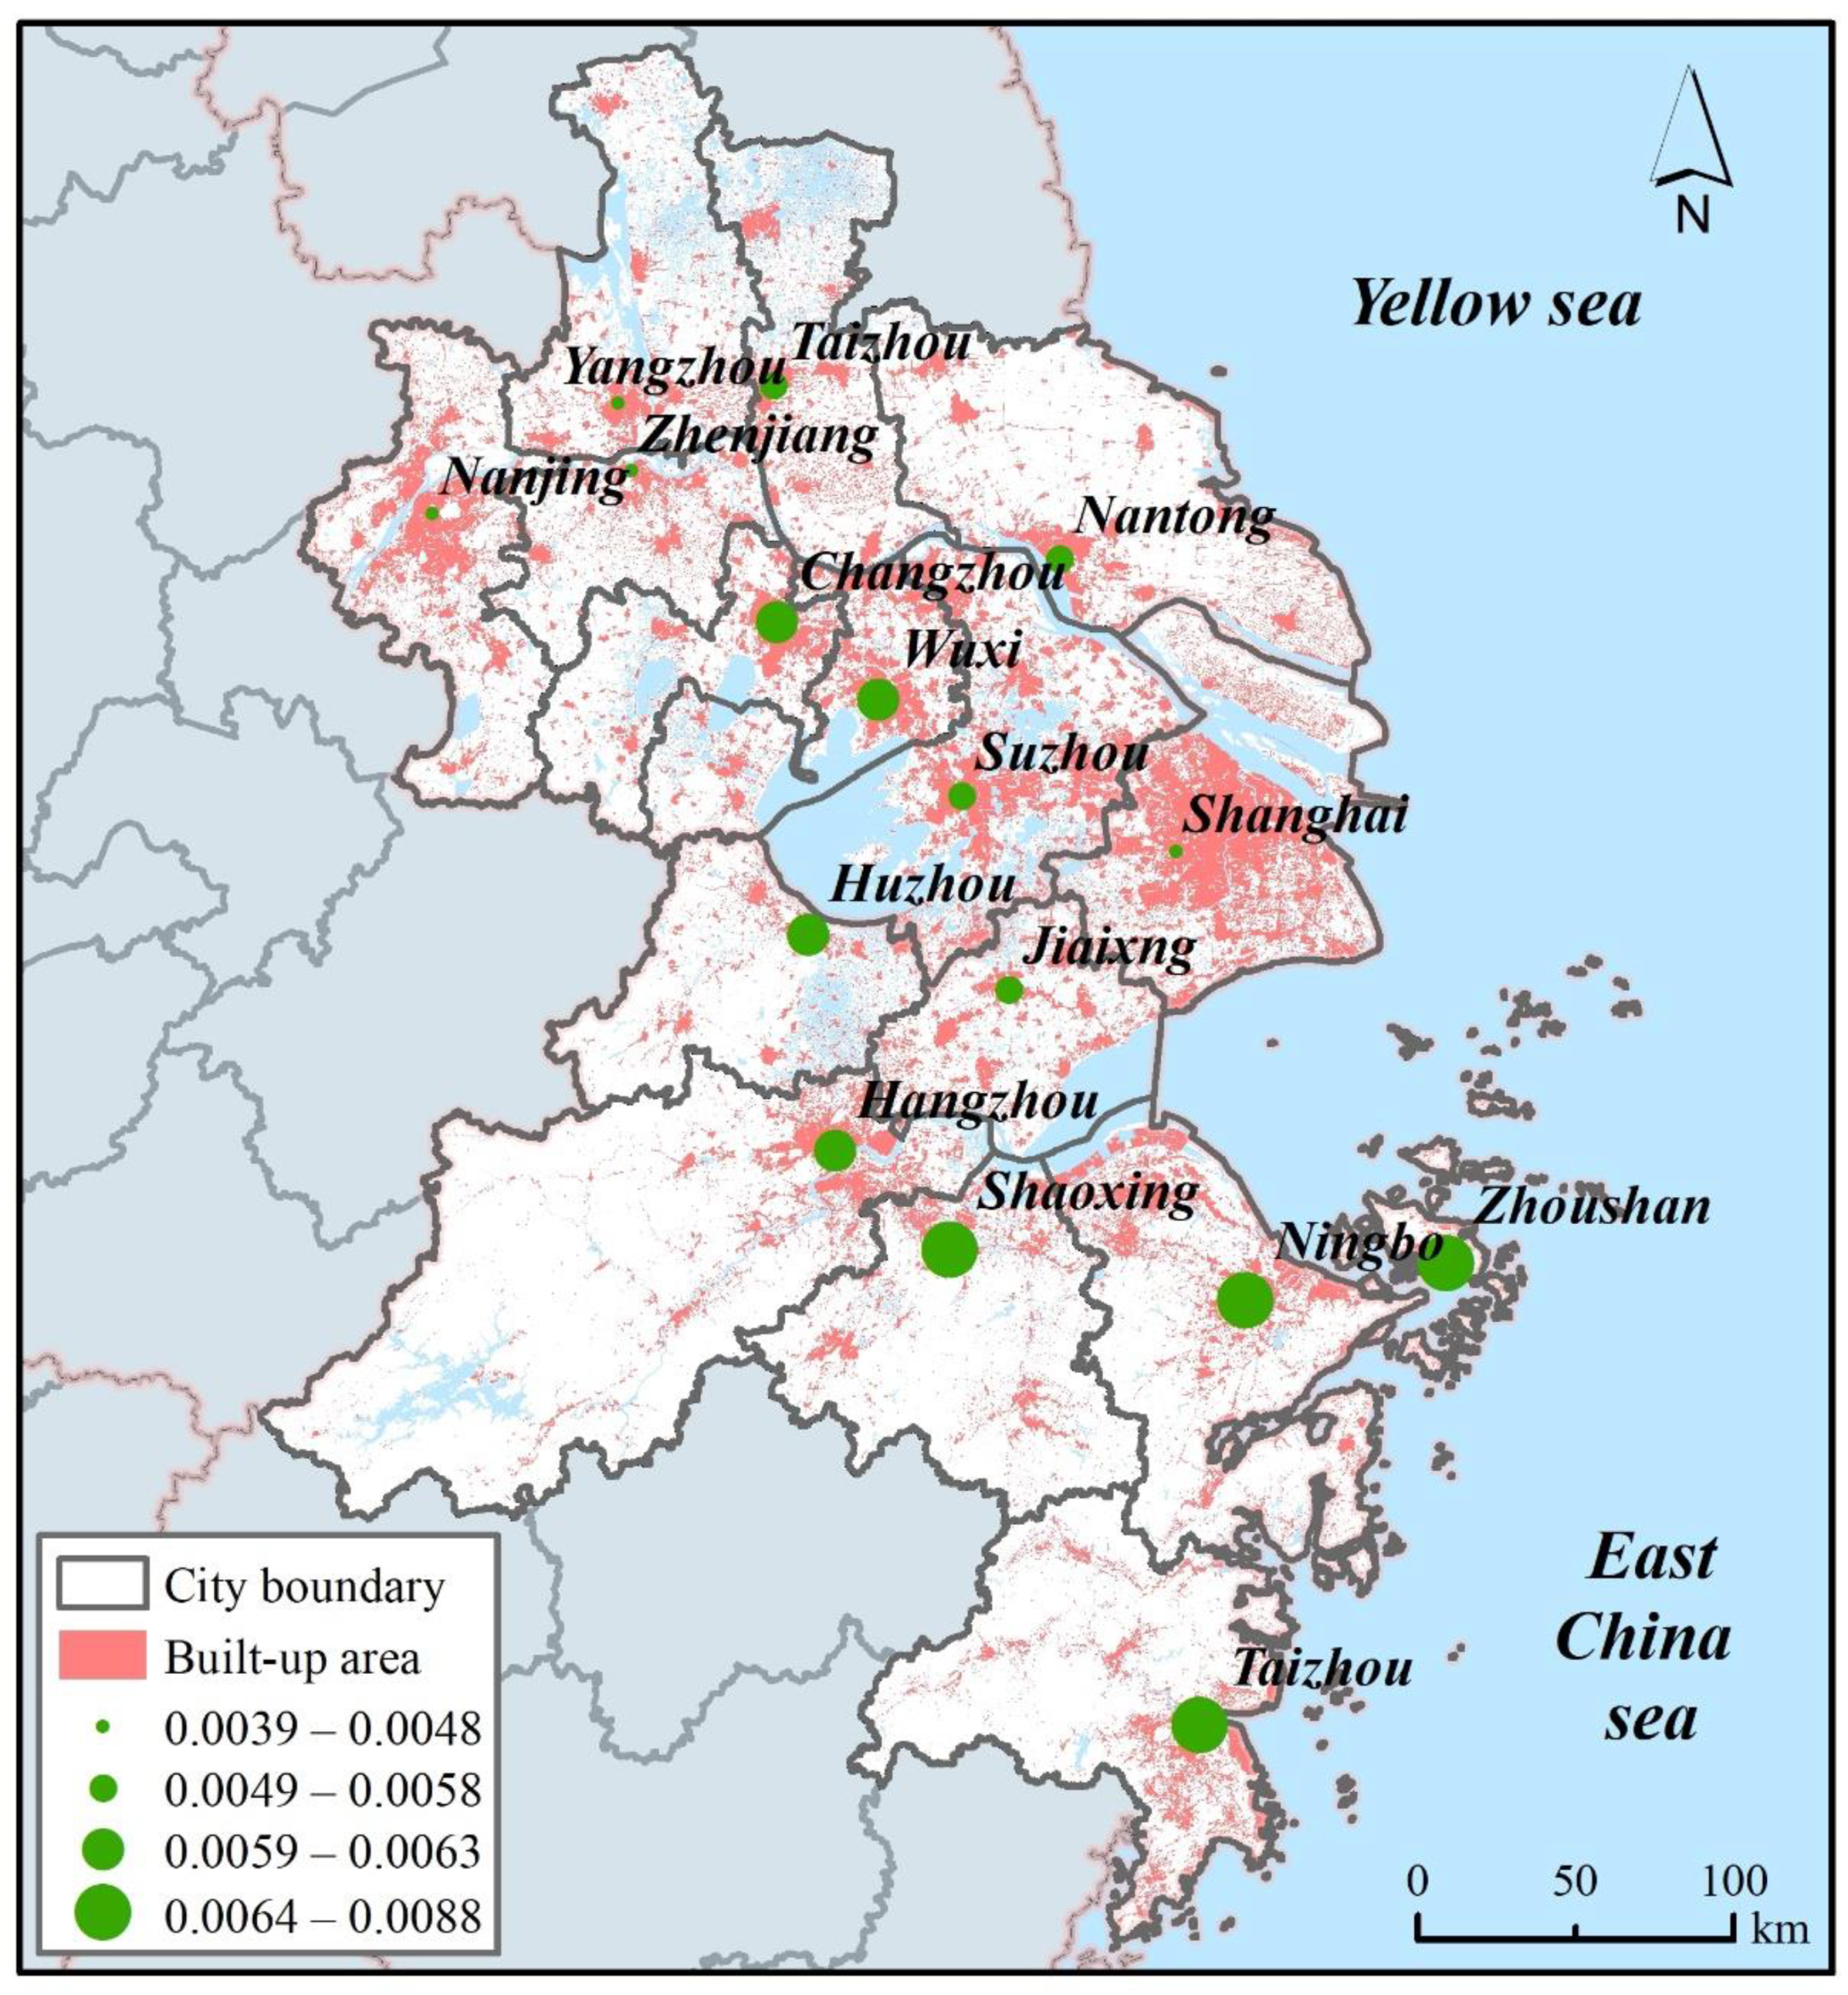
3.1. Study Area

The Yangtze River delta is located downstream of the Yangtze River, which belongs to the middle coastline of China (Figure 2). The proposal of YRD Regional Planning was approved in 2010, stipulating its realm and including 16 core cities with an area of 113,852 km2, including Shanghai, Nanjing, Suzhou, Wuxi, Changzhou, Zhenjiang, Yangzhou, Taizhou (Jiangsu province), Nantong, Hangzhou, Ningbo, Huzhou, Jiaxing, Shaoxing, Zhoushan, and Taizhou (Zhejiang province). As an economic growth engine, the YRD only takes 2.03% of China’s urban district area but harnessed 17.23% of the nation’s gross domestic product (GDP) in 2020. The GDP per capita is 144,397 Yuan, indicating the high level of economic development in the YRD. With the deepening of regional integration, the YRD has evolved into one of the most integrated urban agglomerations in China. In 2003, 16 cities in the YRD took the first step of regional cooperation by signing the proposal of urban linkage development in the YRD. Currently, regional cooperation in the YRD has expanded from economy, transportation, and tourism to culture. Along with an increasingly important role in regional cooperation, its ineffective land use is becoming evident [50]. The growth rate of urban land (3.53%) was much higher than that of the urban population (3.24%) from 2009 to 2016 [51], revealing ineffective urban land use in the YRD. Therefore, it is necessary to explore whether ULUE is related to regional cooperation in the YRD.

3.2. Data Source

Media data and statistics yearbooks were used in this work. Firstly, media data of intercity cooperation news between 2009 and 2016 was collected from local government official websites. The data was the most comprehensive and systematic records, involving the joint actions of governments at all levels, government-affiliated institutions, enterprises, private organizations, and non-governmental organizations for coordinated development [32]. It has been widely applied to measure the intensity of intercity cooperation [29,36]. For the data collection, target city names were entered as keywords on a local government website to search for official news about regional cooperation [29,36]. For instance, Nanjing and Shanghai were used as keywords on Shanghai and Nanjing’s official websites to search for cooperation news between the two cities, respectively. We defined 240 news keywords search combinations and obtained 5299 pieces of news after excluding the irrelevant cooperation news. Secondly, statistical data regarding prefecture-level cities for the period 2009–2016 were obtained from the China city statistical yearbook and the China city construction statistical yearbook from 2010 to 2017. Most statistical indicators were extracted from China city statistical yearbook, including the proportion of employees in secondary and tertiary industries (%), total investment in fixed assets (10,000 Yuan), the proportion of secondary and tertiary industries in GDP (%), the average salary of employees (Yuan), industrial wastewater discharge (10,000 t), industrial SO2 emissions (t), and industrial smoke/powder/dust emissions (t). Park area per capita (m2) and urban area (km2) were extracted from China city construction statistical yearbook.

3.3. Methodology

3.3.1. Social Network Analysis

Social network analysis was a set of methods to quantitatively analyze the structure and attributes of social relations [52]. Social network analysis in urban studies could reveal intercity relations and spatial interaction [53,54]. During the analysis, urban agglomeration was considered as the overall network, and each city within was regarded as a node in the network. As one of the network structure indexes, centrality measured the influence of nodes in the complex network, including degree centrality, betweenness centrality, and closeness centrality [55,56]. In this study, degree centrality was used to analyze the structural characteristics of regional cooperation, which indicated the number of linkages for a node. The higher the degree centrality of a node, the more connections it had with other nodes, and further reflected the strong regional cooperation [32,36]. The degree centrality of each city in the regional cooperation network of the YRD was analyzed using UCINET. The following equation shows the degree centrality of node i to its adjacent nodes:
C D ( N i ) = j = 1 g x i j ( i j )
where C D ( N i ) represents the degree centrality of node i ; g refers to the amount of nodes in the network; x i j refers to the sum of linkages between node i and node j .

3.3.2. Super Efficiency SBM Model with Undesirable Outputs

Data envelopment analysis has been widely adopted to measure the land-use efficiency of decision-making units with multiple inputs and outputs [26,57]. To compensate for the slack problem of input and output, Tone [58] proposed the SBM model based on non-radial and non-angle by putting the slack variables directly into the objective function. In addition, considering the negative environmental consequences induced by production and life, undesirable outputs were taken into account [59]. The model can crack the issue in efficiency evaluation that decision-making units are simultaneously efficient with the value of 1 [60]. Therefore, we applied the super efficiency SBM model with undesirable outputs to measure ULUE. There were n decision-making units with m input indicators, S 1 desirable output indicators, and S 2 undesirable output indicators. The inputs, desirable outputs, and undesirable outputs were represented as x R m ,   y g R s 2 ,   y b R s 2 , respectively. The vectors X ,   Y g ,   Y b were expressed as X = ( x i j ) R m × n ,   Y g = ( y r j ) R s 1 × n ,   Y b = ( y r j ) R s 2 × n . Therefore, the super efficiency SBM model with undesirable outputs for evaluating decision-making units ( x 0 ,   y 0 g ,   y 0 b ) is as follows [61]:
min α * = 1 m i = 1 m ( x ¯ / x i 0 ) 1 + 1 s 1 + s 2 ( r = 1 s 1 ( s r g / y r 0 g ) + r = 1 s 2 ( s r b / s r 0 b ) ) s . t . { x ¯ X λ y g ¯ Y g λ y b ¯ Y b λ x ¯ x 0 , y g ¯ y 0 , y b ¯ y 0 b , λ > 0
where α* is the efficiency value of decision-making units ( x 0 ,   y 0 g ,   y 0 b ) ; λ is the weight vector; s g and s b correspond to the slacks in desirable outputs and undesirable outputs, respectively.
The following indicators were selected to measure the input and output of land use. Descriptions of the indicators are shown in Table 1.

3.3.3. Geographically and Temporally Weighted Regression

GTWR was used to examine the impacts of regional cooperation on ULUE. The GTWR model was developed by Huang, et al. [62], which is better to describe the temporal and spatial relationship between dependent variables and independent variables. In the GTWR model, spatial or temporal variations of ULUE were taken into consideration, which is superior to common regression models–ordinary least squares (OLS) and temporally weighted regression (TWR) [63,64]. In fact, location and time are both important determinants of ULUE. On the one hand, location is an important factor since ULUE is often affected by the spatial spillover effect of peripheral cities [24,57]. On the other hand, there are temporal effects, such as inflation related to the economic output. In this study, OLS and TWR were also used to compare the performance of model fitting. The GTWR model is specified in the following equation:
Y i = β 0 ( u i , v i , t i ) + k β k ( u i , v i , t i ) X i k + ε i
where i denotes city; ( u i ,   v i ,   t i ) refers to the spatial-temporal coordinates (longitude, latitude, time) of city i; Y i refers to the explained variable; X i k refers to the k-th explanatory variable; β 0 refers to the constant term; β k refers to the regression coefficient of the k-th explanatory variable; ε i is a random error term. The estimation of β k ( u i , v i , t i ) can be expressed as:
β ^ k ( u i , v i , t i ) = [ X T W u i ,   v i , t i X ] 1 X T W u i , v i , t i Y
where W ( u i , v i , t i ) = d i a g ( W 1 u v t ,   W 2 u v t , ,   W n u v t ) refers to the spatio-temporal weight matrix, which is used to determine the influence of other sample points on the regression sample point. This paper used the Gaussian function method to determine the spatial-temporal weight matrix:
W i j S T = e x p [ ( d i j S T / b S T ) 2 ]
where d i j S T is the spatial-temporal distance, d S T = λ d S + μ d T , λ and μ represent the weight of space and time distances, respectively; b S T is the bandwidth, and the cross validation (CV) method is generally used to determine the optimal bandwidth. The expression is:
C V = i n [ Y i Y ^ i ( b ) ] 2
When CV is the minimum value, the corresponding b is the optimal bandwidth.
Dependent variables, independent variables, and control variables are shown in Table 2. ULUE of a city was defined as the dependent variable. The amount of news about regional cooperation was used to indicate regional cooperation, which was defined as the independent variable. Four control variables, including GDP per capita, the proportion of fiscal expenditure in GDP, population density, and science expenditure, were added to control the impacts of economic development, government investment, population, and technology on urban land use.

4. Results

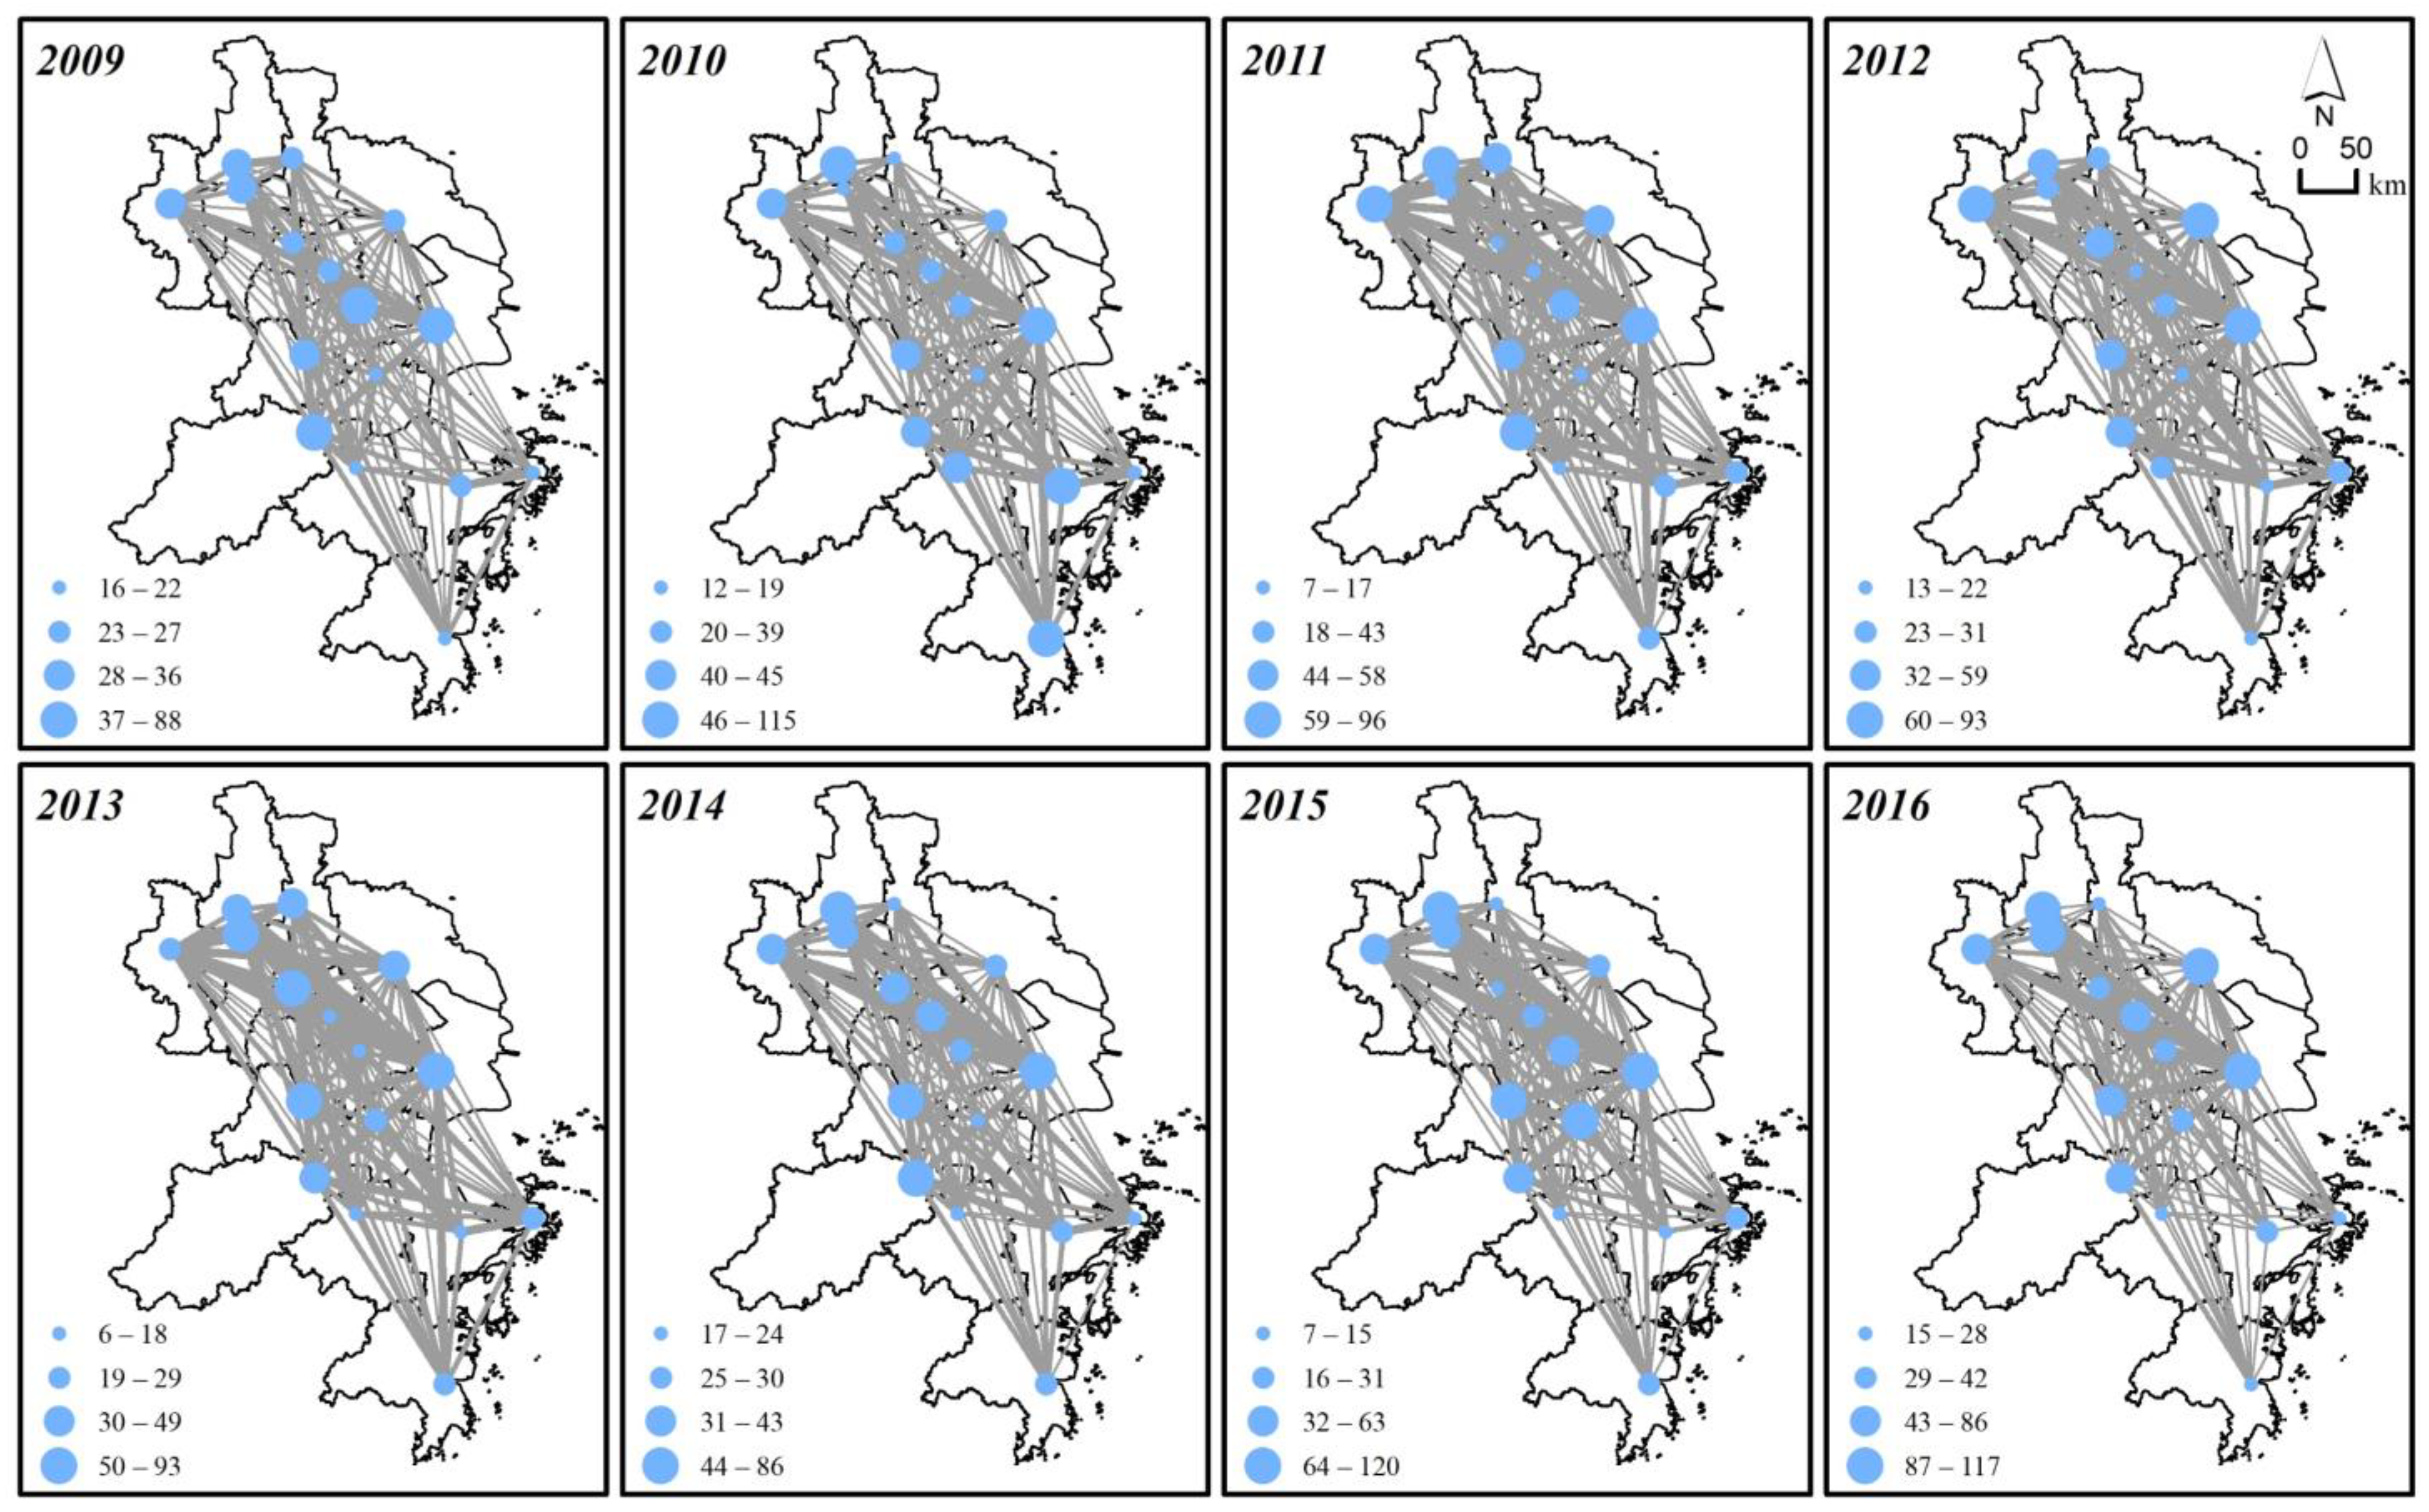
4.1. Degree Centrality of the Cities in the YRD

Figure 3 demonstrates the degree centrality of 16 cities within cooperation networks in the YRD. Regional linkages in the YRD have intensified during the research period as the degree centrality of 16 cities increased from 568 in 2009 to 893 in 2016. Besides, the network structure of the YRD shows as an increasing agglomeration. In 2009, the YRD formed four groups from north to south, including Nanjing-Yangzhou-Zhenjiang-Changzhou-Taizhou (Jiangsu province), Changzhou-Wuxi-Nantong-Suzhou-Shanghai, Hangzhou-Huzhou-Suzhou-Jiaxing-Shanghai, and Hangzhou-Shaoxing-Ningbo-Zhoushan-Taizhou (Zhejiang province). Jiangsu province and Zhejiang province strengthened their ties within the province, respectively, in the following years, and all cities actively cooperated with Shanghai. In addition, increasing cross-provincial cooperation has been achieved between Hangzhou, Ningbo, Huzhou, Jiaxing, and Nanjing, Suzhou, and Wuxi, in which the sum of linkages increased from 29 to 76 within eight years. This is reflected by the more frequent information exchange, regional survey, and scientific cooperation in terms of cooperative industrial development and urban management. Finally, in 2016, taking Nanjing-Wuxi-Suzhou-Shanghai as the intersection, the YRD formed two large network circles with the other five cities in Jiangsu province and seven cities in Zhejiang province, respectively.
The degree centrality of 16 cities can be classified into three types. The first type is Shanghai, which leads substantially in the degree centrality. The average centrality of Shanghai reaches 101, far exceeding that of other cities. The second type includes Nanjing, Zhenjiang, Yangzhou, Nantong, Hangzhou, and Huzhou. The average degree centrality of these cities ranges from 45 to 60, indicating the relatively active roles of these cities in regional cooperation. The other nine cities belong to the third type, whose degree centralities are less than the average. Among them, Wuxi (25), Zhoushan (22), and Shaoxing (22) have the lowest degree centrality.

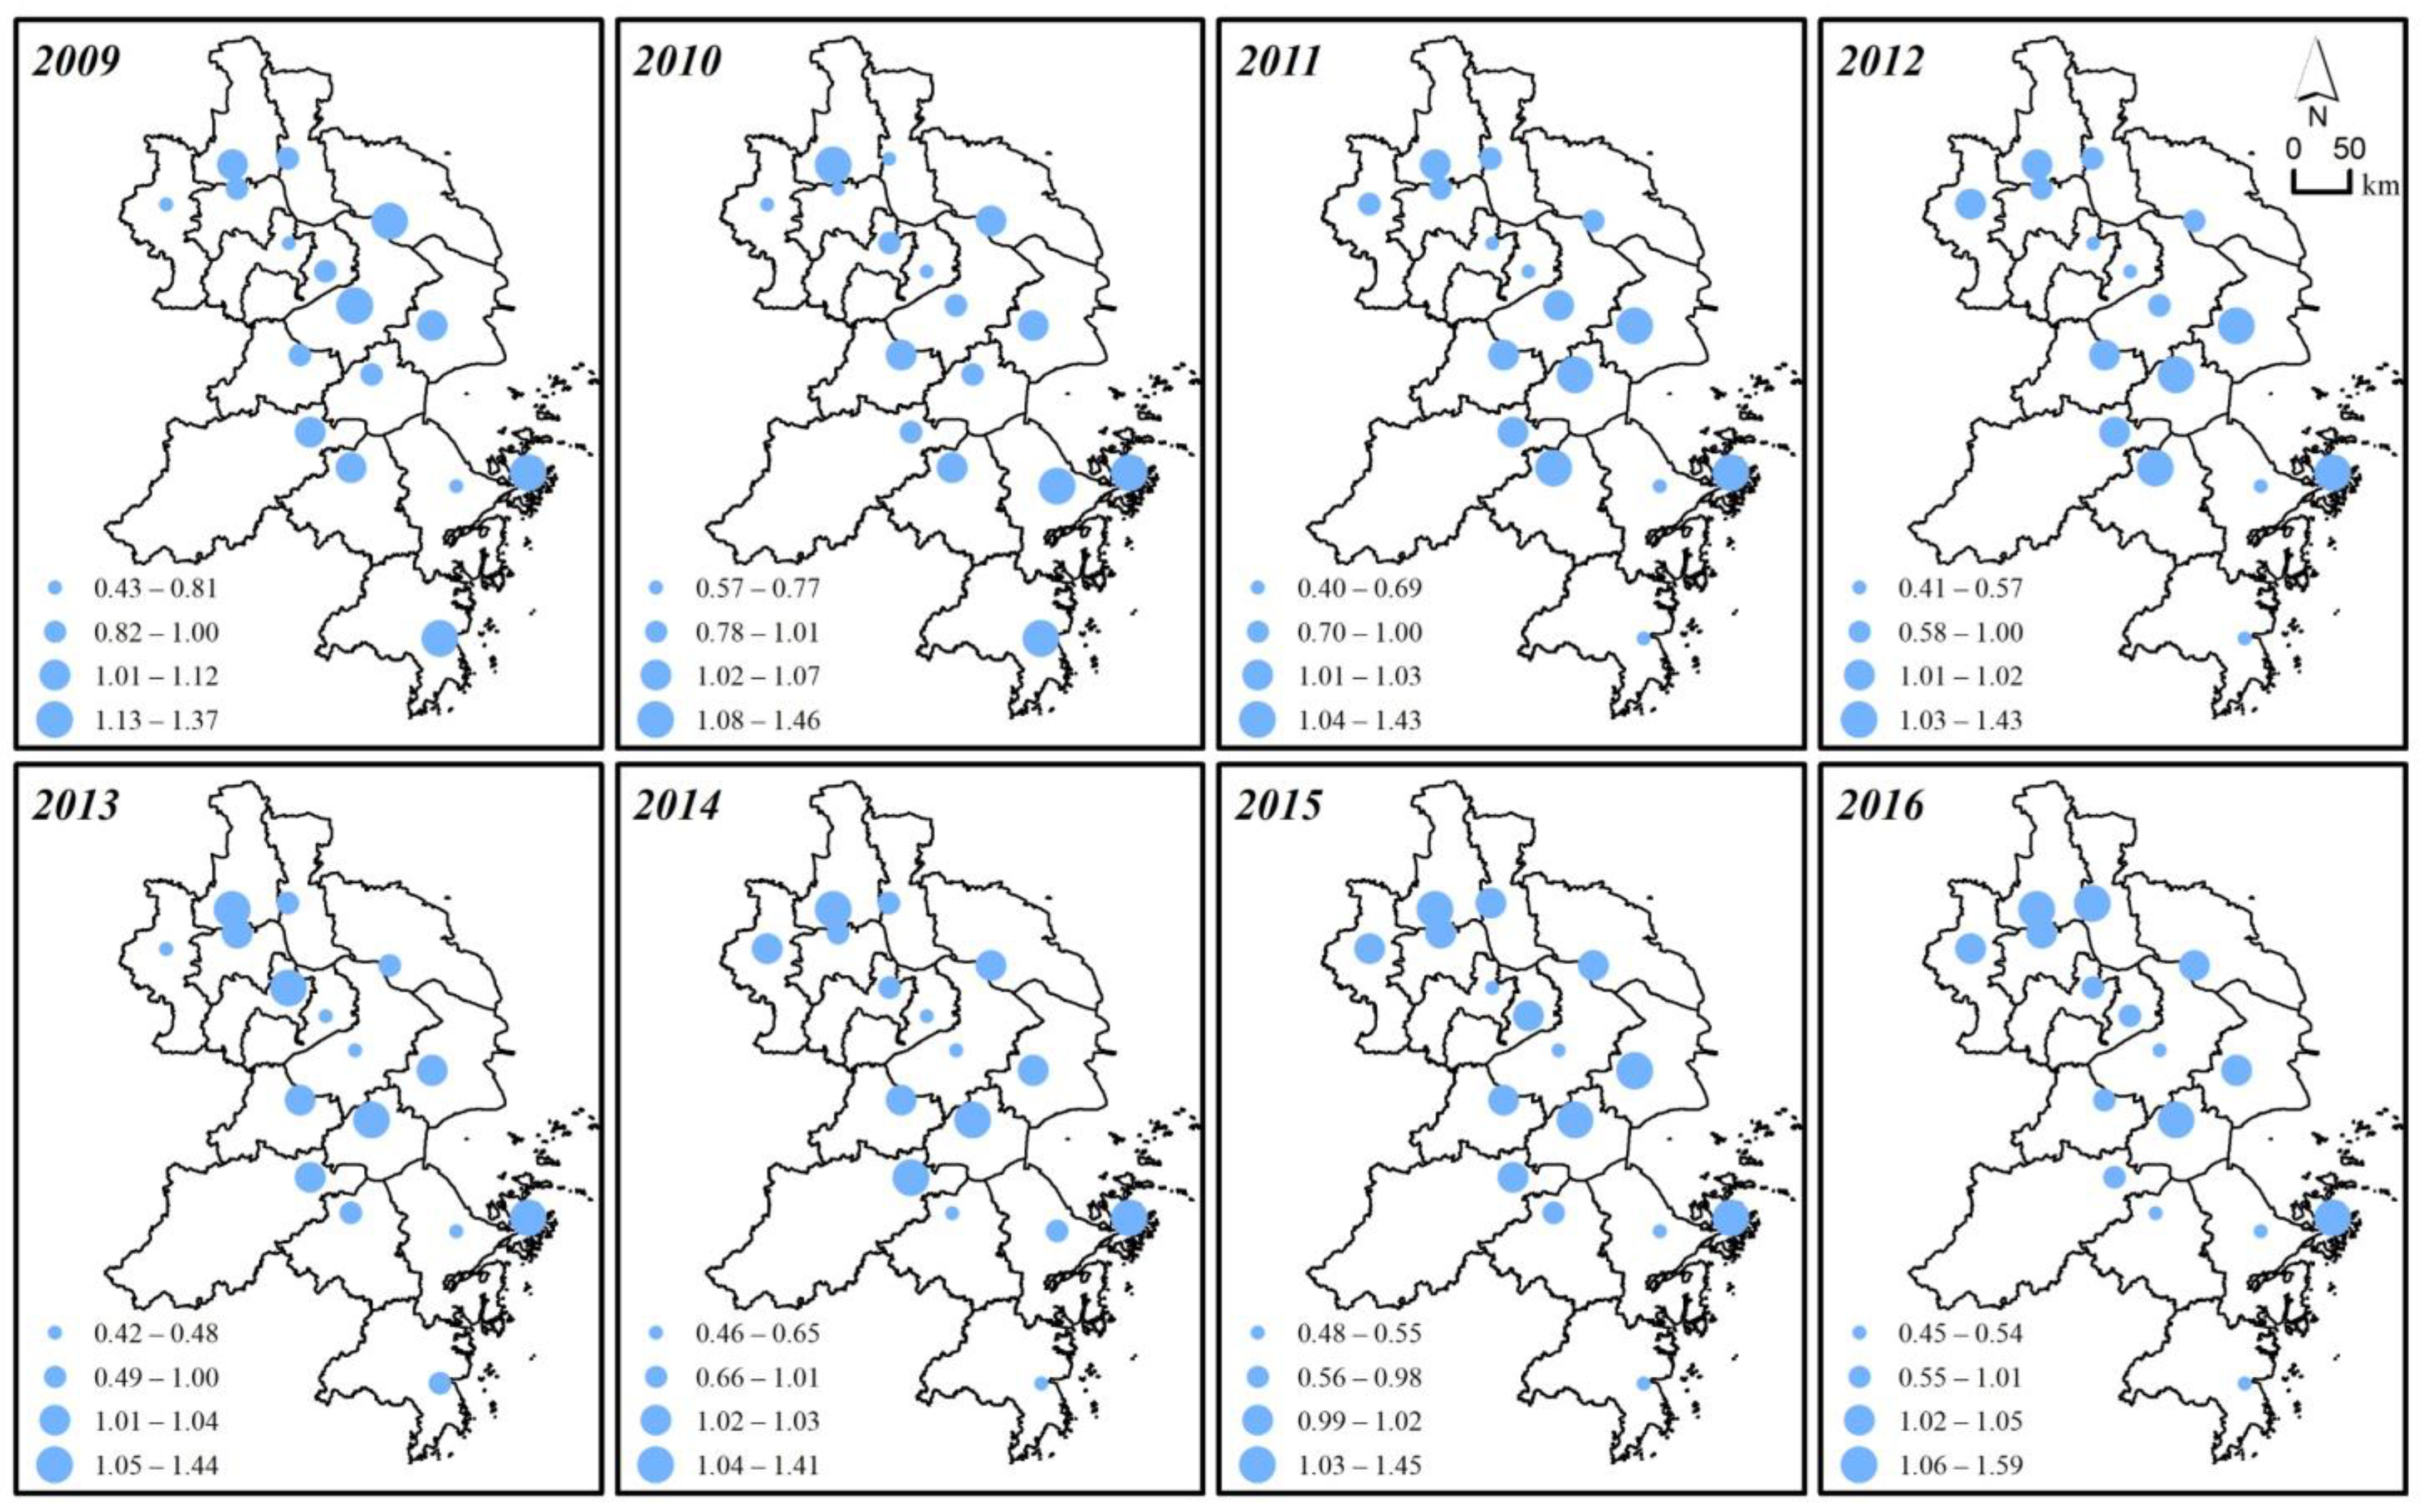
4.2. ULUE Changes in the Cities of the YRD

The ULUE of 16 cities from 2009 to 2016 is shown in Figure 4. The overall ULUE in these cities remains low; only seven cities are characterized by effective land use, and the other nine cities remain in an ineffective state of land use, when considering the average ULUE of 1 as the threshold for effective land use. Among them, Zhoushan (1.445) ranks first, and Ningbo (0.608) ranks last. From the temporal scale, the ULUE of 16 cities shows a slight decline, with an annual decline rate of 0.89%. Geographically speaking, cities in the middle of YRD have relatively high ULEUs from 2009 to 2016.
The characteristics of ULUE change vary across these cities. Shanghai, Yangzhou, Nantong, Hangzhou, Huzhou, Jiaxing, and Zhoushan remain in a high ULUE from 2009 to 2016. ULUEs of these cities are both above 1, reflecting the highest ULUE in the YRD. These cities balance the economic, social, and environmental benefits of land development yield, and make efforts to control urban land expansion. Nanjing, Changzhou, Zhenjiang, Taizhou (Jiangsu province), and Ningbo are featured by a slight increase in ULUEs from 2009 to 2016. ULUEs of these cities mainly range from 0.5 to 1. In particular, the land-use efficiency of Changzhou improves significantly, with an annual growth rate of 7.3%. The economic yield of land use is high, while social and environmental yield remains in a medium range. Suzhou, Wuxi, Shaoxing, and Taizhou (Zhejiang province) are featured by “multi-peak” fluctuation falling. ULUEs of these cities decrease from 2009 to 2016, with the decline range between 0.5 and 0.9. Especially in Taizhou, the annual decrease rate of ULUE achieves 10.8%. Suzhou and Wuxi have high industrial energy consumption and pollution emission, leading to considerable negative environmental output and the weakening of ULUE. The descending ULUE in Shaoxing and Taizhou (Zhejiang province) is attributed to their higher proportion of employees in secondary and tertiary industries, higher total investment in fixed assets, and lower average salary of employees, in comparison to land development.

4.3. The Impacts of Regional Cooperation on ULUE

The model fit of two traditional models (OLS and TWR) and GTWR are compared after the tests of multicollinearity and spatial autocorrelation (Table 3). It should be noted that the percentage of explanation of variance has increased from 37.21% in the OLS and 39.03% in the TWR to 76.44% in the GTWR. Besides, adjusted R2 values increase from 0.3460 in the OLS and 0.3653 in the TWR to 0.7547 in the GTWR. It reveals that the GTWR model is the best, even if the differences in degrees of freedom with the reduction in AICc (from −19.5304 for the OLS and −15.7549 for the TWR to −67.9987 for the GTWR) are taken into account. By comparing the residual sum of squares (RSS), the decreased value further indicates that the GTWR shows a better regression fitting than the OLS and TWR models.
The regression results of the GTWR are presented in Figure 5. The minimum, median, mean, and maximum coefficients of regional cooperation are 0.0021, 0.0057, 0.006, and 0.0108, respectively. This indicates a positive impact of regional cooperation on ULUE in the cities of the YRD. Meanwhile, the mean coefficients of regional cooperation are varied in the YRD, showing that the impacts of regional cooperation on ULUE vary among 16 cities. In general, the mean regression coefficients are large in the southern cities of the YRD, medium in the middle cities, and small in the northern cities. The mean regression coefficients of Ningbo, Zhoushan, and Taizhou (Zhejiang province), which are the top three cities in the YRD, are above 0.8. Wuxi and Changzhou results are also prominent in the northern YRD, with mean regional cooperation coefficients of 0.0063 and 0.0062, respectively. By contrast, those in Taizhou (Jiangsu province), Zhenjiang, Shanghai, Yangzhou, and Nanjing remain at low levels, with scores below 0.005. The mean regression coefficients in the other seven cities ranges from 0.005 to 0.0063.

5. Discussion

5.1. The Influence Mechanism of Regional Cooperation on ULUE

5.1.1. Improvement of ULUE by Co-Building Transportation Facilities

Our findings reveal that the mean regression coefficients of regional cooperation in Ningbo and Zhoushan are the highest in 16 cities of the YRD. The possible explanation is that co-building port facilities improve ULUE, which is inferred from a large amount of regional cooperation news about the Ningbo-Zhoushan Port between Ningbo and Zhoushan. The Ningbo-Zhoushan Port is one of the largest ports and the first port in the world with an annual cargo throughput of more than 1 billion tons. It was merged with Ningbo Port and Zhoushan Port in 2006. The positive effect of the Ningbo-Zhoushan Port on ULUE benefits are its spatial plans, efficient land-use mode, and high economic output. First, cooperative spatial plans contribute to compact land patterns. In 2006, Ningbo-Zhoushan Port Management Committee was established to regulate the major construction projects of Ningbo-Zhoushan Port integration. Local governments planned a comprehensive road network as “2 rings, 10 radials, 4 links, and 4 avenues” to gain the agglomeration effect in the Ningbo-Zhoushan Port. The master plan of Ningbo-Zhoushan Port (2014–2030) designed the spatial pattern of “1 port, 4 cores, and 19 districts”, which clarified functional positioning, respectively. Second, a series of strategies were adopted to promote effective land use in the Ningbo-Zhoushan Port. On the one hand, local authorities revitalized a large number of deserted islands in Zhoushan and built related infrastructure. The successive development of fishing villages, i.e., Jintang, Shulanghu, Huangzeshan, and Liuheng to core parts of Ningbo-Zhoushan Port contributes greatly to land economic yield. On the other hand, the Ningbo-Zhoushan Port was committed to developing intermodal systems to save transportation costs and ease traffic tension. For example, Meishan Port was opened as a free-trade zone of the Ningbo-Zhoushan Port, to play an important role in international trade in 2010. Third, the Ningbo-Zhoushan Port took advantage of increasing returns to scale to develop the port industry and port service industry. It expanded the scale of the port area from 2009 to 2016 by means of increasing the number of berths and lengths of wharves. In 2015, there was an increase to 170 large berths of 10,000 t class and 100 extra-large deep-water berths of 50,000 t class, which evolved into the busiest port for large ships in China.

5.1.2. The Positive Effects of JDZs on ULUE

As an important form of economic cooperation, the positive effects of cross-border industrial parks on ULUE can be confirmed by the regression coefficient of Wuxi and Changzhou, whose mean regression coefficients are prominent in the northern cities of the YRD. According to the news about regional cooperation, the news amount of JDZs in Wuxi and Changzhou leads other cities substantially. Since 2006, Jiangsu province has initiated the steps on the construction of cross-border industrial parks through north–south cooperation, to accelerate the industrialization process of northern Jiangsu and promote the industrial upgrading of southern Jiangsu. Wuxi and Changzhou are keen on cooperating with cities in northern Jiangsu and constructing industrial parks jointly, such as Wuxi-Xinyi industrial park, Xishan-Fengxian industrial park, Xinqiao industrial park, Yuehai industrial park, and Linjiang industrial park. According to Luo and Shen [40], such modes of JDZs in Wuxi and Changzhou play a crucial role in coordinating urban economy and industrial cooperation among cities. This is beneficial for improving ULUE.
Jiangyin economic development zone is a typical case of JDZs, which is a provincial development zone jointly established by Jiangyin (in Wuxi) and Jingjiang (in Taizhou, Jiangsu province) in 2003. Compared with other JDZs in Jiangsu province, which were initiated by some local enterprises for cross-border investment and conflict resolution, it has obtained the involvement of provincial governments, i.e., preferential policies, financial support, and management services. Such features provided new possibilities to guarantee intensive land development and land economic output. On one hand, joint land development is achieved by transferring industries, labor, and raw materials among cities, upon which land will be saved. On the other hand, the endowment of provincial government power may attract enterprises and maintain the smooth process of industrial production.

5.2. Policy Implications and Limitations

Detecting the impacts of regional cooperation on ULUE can provide policy implications for intensive urban land development. Firstly, joint land development among cities is an effective way to improve ULUE, such as the modes of co-building transportation facilities and JDZs. Due to the limited built-up land quotas in most cities in the YRD, joint land development can save built-up land quotas for multiple cities but also motivate related industries in a region to gain an agglomeration effect. Indeed, a few pioneer projects of joint land development were launched in the YRD and improved ULUE. For example, the Caohejing development zone has established a park with a planning area of 105 km2 in Yancheng and a zone with a planning area of 15 km2 in Haining, which saved Shanghai’s built-up land quota and stimulated industries to unitive parks in Yancheng and Haining. Our study also confirmed that the establishment of massive joint land development projects helps to improve ULUE in the cities of southern Jiangsu. The policy implication can be applied in cities in the Pearl River Delta and Beijing-Tianjin-Hebei urban agglomeration.
Meanwhile, joint land development as an instrument for transferring and upgrading industries helps economic yields of land use. Recently, the YRD is experiencing large-scale industrial relocation from big cities to surrounding cities, which provides the opportunity for joint land development among cities. On the one hand, joint land development projects in surrounding cities can relocate manufacturing industries from big cities to support economic development. On the other hand, it can provide more land for big cities to develop financial services, high-tech, and other industries to promote land-use benefits when manufacturing industries have been relocated. This strategy is particularly propitious to core cities, such as Shanghai and Hangzhou. In these, large-scale development of residential and commercial land indicates more economic and social yields than industrial output, which promotes ULUE.
Besides, local governments should be aware of the important role of cooperative spatial plans in improving ULUE, as revealed by the planning efforts in co-building transportation facilities and JDZs. Firstly, a cooperative spatial plan delimits the urban growth boundary in the urban agglomeration, which aims to restrain the disorder development and uncontrolled urban sprawl. It will prevent the inefficient development of urban land use. Secondly, spatial planning often portrays a spatial structure for compact land-use patterns, such as “points, axis, belts, and networks”, to guide the intensive land use. Thirdly, spatial planning can accelerate land, labor, and raw materials to industrial parks or development zones. Under the circumstances, overheated industrial land development and redundant facility construction are restrained.
There are some limitations to be further addressed. Firstly, the cities of the YRD were taken as a case to examine the hypothesis that regional cooperation is positively correlated with ULUE, due to the data unavailability. However, although the confirmation of the hypothesis in the case study may be typical, it is also to be verified in other regions, considering the differences in intercity cooperation and ULUE among regions. Secondly, while we preliminarily clarified the impacts of regional cooperation for economic, social, and institutional affairs on ULEUE in the conceptual framework, we failed to quantitatively explore the impacts from the perspective of different thematic areas of regional cooperation. Actually, regional cooperation could be further subdivided into many areas, including industrial development, infrastructure construction, urban planning, etc. [36]. Therefore, the impacts of multiple dimensions of regional cooperation on ULUE can be further explored.

6. Conclusions

The issue of what imposes impacts on urban land-use efficiency has attracted great attention from planners and governors across the world. Unfortunately, although a large body of literature was focused on analyzing the driving forces of urban land-use efficiency, those related to regional cooperation were rarely explored. To address the knowledge gap, we used the YRD, China as a case to examine the impacts of regional cooperation on urban land-use efficiency. Firstly, we developed a conceptual framework to uncover the potential impacts of regional cooperation on urban land-use efficiency. Secondly, official news about intercity cooperation was used to indicate regional cooperation through social network analysis. Urban land-use efficiency was measured through the super efficiency SBM model with undesirable outputs. Finally, geographically and temporally weighted regression was used to examine whether regional cooperation affects urban land-use efficiency.
The results show that regional cooperation increased from 2009 to 2016, indicating more frequent linkages among the cities in the YRD. Shanghai plays a leading role in the regional cooperation network in the YRD. Less than half of the cities in the YRD have good urban land-use efficiency. Shanghai, Yangzhou, Nantong, Hangzhou, Huzhou, Jiaxing, and Zhoushan maintain high land-use efficiency during 2009–2016, while Suzhou, Wuxi, Shaoxing, and Taizhou (Zhejiang province) feature low land-use efficiency, showing a declining trend. The regression results show a positive relationship between regional cooperation news and urban land-use efficiency, which verifies our hypothesis that regional cooperation will improve urban land-use efficiency. This impact in the southern cities of the YRD is more evident than that in the northern. The potential mechanism to explain the impacts of regional cooperation on improving urban land-use efficiency includes co-building transportation facilities and joint development zones. Therefore, cities are supposed to explore joint land development to save built-up land quotas and promote industrial transfer and upgrading. Besides, cooperative spatial plans can be regarded as local governments’ instruments to guide intensive land use.

Author Contributions

Conceptualization, L.P. and Y.C.; methodology, L.P., H.H., X.J. and Y.C.; validation, Y.Z. and G.L.; writing—original draft preparation, L.P.; writing—review and editing, Y.C., Z.X. and X.W. All authors have read and agreed to the published version of the manuscript.

Funding

This research was funded by the Fundamental Research Funds for the Provincial Universities of Zhejiang (Grant No. SJWY2022006, Grant No. SJWY2022004, and Grant No. SJWY2021002), Zhejiang Provincial Natural Science Foundation of China (Grant No. LQ21G030003 and Grant No. LQ22G030001), Zhejiang Provincial Social Science Foundation of China (Grant No. 22NDJC068YB and Grant No. 22NDJC070YB).

Institutional Review Board Statement

Not applicable.

Informed Consent Statement

Not applicable.

Data Availability Statement

Not applicable.

Conflicts of Interest

The authors declare no conflict of interest.

References

  1. Carlucci, M.; Grigoriadis, E.; Rontos, K.; Salvati, L. Revisiting a Hegemonic Concept: Long-term ‘Mediterranean Urbanization’ in Between City Re-polarization and Metropolitan Decline. Appl. Spat. Anal. Policy 2017, 10, 347–362. [Google Scholar] [CrossRef]
  2. Salvati, L.; Gargiulo Morelli, V. Unveiling Urban Sprawl in the Mediterranean Region: Towards a Latent Urban Transformation? Int. J. Urban Reg. Res. 2014, 38, 1935–1953. [Google Scholar] [CrossRef]
  3. Seto Karen, C.; Güneralp, B.; Hutyra Lucy, R. Global forecasts of urban expansion to 2030 and direct impacts on biodiversity and carbon pools. Proc. Natl. Acad. Sci. USA 2012, 109, 16083–16088. [Google Scholar] [CrossRef] [PubMed] [Green Version]
  4. Koroso, N.H.; Zevenbergen, J.A.; Lengoiboni, M. Urban land use efficiency in Ethiopia: An assessment of urban land use sustainability in Addis Ababa. Land Use Policy 2020, 99, 105081. [Google Scholar] [CrossRef]
  5. Jalilov, S.-M.; Chen, Y.; Quang, N.H.; Nguyen, M.N.; Leighton, B.; Paget, M.; Lazarow, N. Estimation of Urban Land-Use Efficiency for Sustainable Development by Integrating over 30-Year Landsat Imagery with Population Data: A Case Study of Ha Long, Vietnam. Sustainability 2021, 13, 8848. [Google Scholar] [CrossRef]
  6. Liu, S.; Xiao, W.; Li, L.; Ye, Y.; Song, X. Urban land use efficiency and improvement potential in China: A stochastic frontier analysis. Land Use Policy 2020, 99, 105046. [Google Scholar] [CrossRef]
  7. Wang, J.; Lin, Y.; Glendinning, A.; Xu, Y. Land-use changes and land policies evolution in China’s urbanization processes. Land Use Policy 2018, 75, 375–387. [Google Scholar] [CrossRef]
  8. Huang, Z.; Du, X.; Castillo, C.S.Z. How does urbanization affect farmland protection? Evidence from China. Resour. Conserv. Recycl. 2019, 145, 139–147. [Google Scholar] [CrossRef] [Green Version]
  9. Wanfu, J.; Chunshan, Z.; Tao, L.; Guojun, Z. Exploring the factors affecting regional land development patterns at different developmental stages: Evidence from 289 Chinese cities. Cities 2019, 91, 193–201. [Google Scholar] [CrossRef]
  10. Song, W.; Pijanowski, B.C.; Tayyebi, A. Urban expansion and its consumption of high-quality farmland in Beijing, China. Ecol. Indic. 2015, 54, 60–70. [Google Scholar] [CrossRef]
  11. Cao, X.; Liu, Y.; Li, T.; Liao, W. Analysis of Spatial Pattern Evolution and Influencing Factors of Regional Land Use Efficiency in China Based on ESDA-GWR. Sci. Rep. 2019, 9, 520. [Google Scholar] [CrossRef] [PubMed]
  12. Jiao, L.; Xu, Z.; Xu, G.; Zhao, R.; Liu, J.; Wang, W. Assessment of urban land use efficiency in China: A perspective of scaling law. Habitat Int. 2020, 99, 102172. [Google Scholar] [CrossRef]
  13. Zitti, M.; Ferrara, C.; Perini, L.; Carlucci, M.; Salvati, L. Long-Term Urban Growth and Land Use Efficiency in Southern Europe: Implications for Sustainable Land Management. Sustainability 2015, 7, 3359–3385. [Google Scholar] [CrossRef] [Green Version]
  14. Lu, X.; Zhang, Y.; Li, J.; Duan, K. Measuring the urban land use efficiency of three urban agglomerations in China under carbon emissions. Environ. Sci. Pollut. Res. Int. 2022, 29, 36443–36474. [Google Scholar] [CrossRef] [PubMed]
  15. Yu, J.; Zhou, K.; Yang, S. Land use efficiency and influencing factors of urban agglomerations in China. Land Use Policy 2019, 88, 104143. [Google Scholar] [CrossRef]
  16. Ding, T.; Yang, J.; Wu, H.; Liang, L. Land use efficiency and technology gaps of urban agglomerations in China: An extended non-radial meta-frontier approach. Socio-Econ. Plan. Sci. 2022, 79, 101090. [Google Scholar] [CrossRef]
  17. Masini, E.; Tomao, A.; Barbati, A.; Corona, P.; Serra, P.; Salvati, L. Urban Growth, Land-use Efficiency and Local Socioeconomic Context: A Comparative Analysis of 417 Metropolitan Regions in Europe. Environ. Manag. 2019, 63, 322–337. [Google Scholar] [CrossRef]
  18. Yang, X.; Wu, Y.; Dang, H. Urban Land Use Efficiency and Coordination in China. Sustainability 2017, 9, 410. [Google Scholar] [CrossRef] [Green Version]
  19. Koroso, N.H.; Lengoiboni, M.; Zevenbergen, J.A. Urbanization and urban land use efficiency: Evidence from regional and Addis Ababa satellite cities, Ethiopia. Habitat Int. 2021, 117, 102437. [Google Scholar] [CrossRef]
  20. Du, J.; Thill, J.-C.; Peiser, R.B. Land pricing and its impact on land use efficiency in post-land-reform China: A case study of Beijing. Cities 2016, 50, 68–74. [Google Scholar] [CrossRef]
  21. He, S.; Yu, S.; Li, G.; Zhang, J. Exploring the influence of urban form on land-use efficiency from a spatiotemporal heterogeneity perspective: Evidence from 336 Chinese cities. Land Use Policy 2020, 95, 104576. [Google Scholar] [CrossRef]
  22. Liu, J.; Hou, X.; Wang, Z.; Shen, Y. Study the effect of industrial structure optimization on urban land-use efficiency in China. Land Use Policy 2021, 105, 105390. [Google Scholar] [CrossRef]
  23. Xie, H.; Chen, Q.; Lu, F.; Wu, Q.; Wang, W. Spatial-temporal disparities, saving potential and influential factors of industrial land use efficiency: A case study in urban agglomeration in the middle reaches of the Yangtze River. Land Use Policy 2018, 75, 518–529. [Google Scholar] [CrossRef]
  24. Lu, X.; Chen, D.; Kuang, B.; Zhang, C.; Cheng, C. Is high-tech zone a policy trap or a growth drive? Insights from the perspective of urban land use efficiency. Land Use Policy 2020, 95, 104583. [Google Scholar] [CrossRef]
  25. Gao, X.; Zhang, A.; Sun, Z. How regional economic integration influence on urban land use efficiency? A case study of Wuhan metropolitan area, China. Land Use Policy 2020, 90, 104329. [Google Scholar] [CrossRef]
  26. Zhao, J.; Zhu, D.; Cheng, J.; Jiang, X.; Lun, F.; Zhang, Q. Does regional economic integration promote urban land use efficiency? Evidence from the Yangtze River Delta, China. Habitat Int. 2021, 116, 102404. [Google Scholar] [CrossRef]
  27. Bontenbal, M.; van Lindert, P. Transnational city-to-city cooperation: Issues arising from theory and practice. Habitat Int. 2009, 33, 131–133. [Google Scholar] [CrossRef]
  28. Shen, J. Not quite a twin city: Cross-boundary integration in Hong Kong and Shenzhen. Habitat Int. 2014, 42, 138–146. [Google Scholar] [CrossRef]
  29. Zhang, X.; Sun, Y. Investigating institutional integration in the contexts of Chinese city-regionalization: Evidence from Shenzhen–Dongguan–Huizhou. Land Use Policy 2019, 88, 104170. [Google Scholar] [CrossRef]
  30. Li, Y.; Wu, F.; Hay, I. City-region integration policies and their incongruous outcomes: The case of Shantou-Chaozhou-Jieyang city-region in east Guangdong Province, China. Habitat Int. 2015, 46, 214–222. [Google Scholar] [CrossRef]
  31. Douglass, M. From global intercity competition to cooperation for livable cities and economic resilience in Pacific Asia. Environ. Urban. 2002, 14, 53–68. [Google Scholar] [CrossRef]
  32. Zhang, X.; Shen, J.; Gao, X. Towards a comprehensive understanding of intercity cooperation in China’s city-regionalization: A comparative study of Shenzhen-Hong Kong and Guangzhou-Foshan city groups. Land Use Policy 2021, 103, 105339. [Google Scholar] [CrossRef]
  33. Asfaha, S.; Biadgleng, E.; Munoz Tellez, V. South-South Cooperation for Industrial Development; Social Science Research Network: Richester, NY, USA, 2007. [Google Scholar]
  34. Wu, F. China’s Emergent City-Region Governance: A New Form of State Spatial Selectivity through State-orchestrated Rescaling. Int. J. Urban Reg. Res. 2016, 40, 1134–1151. [Google Scholar] [CrossRef]
  35. Perkmann, M. Cross-Border Regions in Europe: Significance and Drivers of Regional Cross-Border Co-Operation. Eur. Urban Reg. Stud. 2003, 10, 153–171. [Google Scholar] [CrossRef] [Green Version]
  36. Zhang, X.; Guo, Q.-E.; Cheung, D.M.-W.; Zhang, T. Evaluating the institutional performance of the Pearl River Delta integration policy through intercity cooperation network analysis. Cities 2018, 81, 131–144. [Google Scholar] [CrossRef]
  37. Duranton, G.; Puga, D. Chapter 48—Micro-Foundations of Urban Agglomeration Economies. In Handbook of Regional and Urban Economics; Henderson, J.V., Thisse, J.-F., Eds.; Elsevier: Amsterdam, The Netherlands, 2004; Volume 4, pp. 2063–2117. [Google Scholar]
  38. Chan, R.C.K.; Xian, S. Assessing the incentives in regional city-to-city cooperation: A case study of Jiangyin–Jingjiang Industrial Park of Jiangsu Province in the Yangtze River Delta regionl. Asia Pac. Viewp. 2012, 53, 56–69. [Google Scholar] [CrossRef]
  39. Xian, S.; Chan, R.C.K.; Qi, Z. Booming provincial-led North–South City-to-city cooperation in China: A case study of Suzhou-Suqian Industrial Park of Jiangsu Province. Cities 2015, 46, 44–54. [Google Scholar] [CrossRef]
  40. Luo, X.; Shen, J. A study on inter-city cooperation in the Yangtze river delta region, China. Habitat Int. 2009, 33, 52–62. [Google Scholar] [CrossRef]
  41. Chen, Y.; Chen, Z.; Xu, G.; Tian, Z. Built-up land efficiency in urban China: Insights from the General Land Use Plan (2006–2020). Habitat Int. 2016, 51, 31–38. [Google Scholar] [CrossRef]
  42. Xie, X.; Fang, B.; Xu, H.; He, S.; Li, X. Study on the coordinated relationship between Urban Land use efficiency and ecosystem health in China. Land Use Policy 2021, 102, 105235. [Google Scholar] [CrossRef]
  43. Wu, C.; Wei, Y.D.; Huang, X.; Chen, B. Economic transition, spatial development and urban land use efficiency in the Yangtze River Delta, China. Habitat Int. 2017, 63, 67–78. [Google Scholar] [CrossRef]
  44. Zhang, J. Interjurisdictional competition for FDI: The case of China’s “development zone fever”. Reg. Sci. Urban Econ. 2011, 41, 145–159. [Google Scholar] [CrossRef]
  45. Wang, J. The economic impact of Special Economic Zones: Evidence from Chinese municipalities. J. Dev. Econ. 2013, 101, 133–147. [Google Scholar] [CrossRef]
  46. Huang, Z.; He, C.; Zhu, S. Do China’s economic development zones improve land use efficiency? The effects of selection, factor accumulation and agglomeration. Landsc. Urban Plan. 2017, 162, 145–156. [Google Scholar] [CrossRef]
  47. Balassa, B.; Toutjesdijk, A. Economic Integration Among Developing Countries. JCMS J. Common Mark. Stud. 1975, 14, 37–55. [Google Scholar] [CrossRef]
  48. Latham, A.; Layton, J. Social infrastructure and the public life of cities: Studying urban sociality and public spaces. Geogr. Compass 2019, 13, e12444. [Google Scholar] [CrossRef]
  49. Batley, R.; McLoughlin, C. The Politics of Public Services: A Service Characteristics Approach. World Dev. 2015, 74, 275–285. [Google Scholar] [CrossRef] [Green Version]
  50. Liu, Y.; Fan, P.; Yue, W.; Song, Y. Impacts of land finance on urban sprawl in China: The case of Chongqing. Land Use Policy 2018, 72, 420–432. [Google Scholar] [CrossRef]
  51. Zhou, Y.; Huang, X.; Xu, G.; Li, J. The coupling and driving forces between urban land expansion and population growth in Yangtze River Delta. Geogr. Res. 2016, 35, 313–324. [Google Scholar] [CrossRef]
  52. Martino, F.; Spoto, A. Social Network Analysis: A brief theoretical review and further perspectives in the study of Information Technology. PsychNology J. 2006, 4, 53–86. [Google Scholar] [CrossRef]
  53. Jinliao, H.; Xianpeng, W.; Gang, Z. Creative city networks: A social network analysis of a virtual community of designers in China. Cities 2022, 123, 103578. [Google Scholar] [CrossRef]
  54. Hui, E.C.M.; Li, X.; Chen, T.; Lang, W. Deciphering the spatial structure of China’s megacity region: A new bay area—The Guangdong-Hong Kong-Macao Greater Bay Area in the making. Cities 2020, 105, 102168. [Google Scholar] [CrossRef]
  55. Freeman, L.C. Centrality in social networks conceptual clarification. Soc. Netw. 1978, 1, 215–239. [Google Scholar] [CrossRef] [Green Version]
  56. Freeman, L.C.; Roeder, D.; Mulholland, R.R. Centrality in social networks: II. Experimental results. Soc. Netw. 1979, 2, 119–141. [Google Scholar] [CrossRef] [Green Version]
  57. Jiang, X.; Lu, X.; Liu, Q.; Chang, C.; Qu, L. The effects of land transfer marketization on the urban land use efficiency: An empirical study based on 285 cities in China. Ecol. Indic. 2021, 132, 108296. [Google Scholar] [CrossRef]
  58. Tone, K. A slacks-based measure of efficiency in data envelopment analysis. Eur. J. Oper. Res. 2001, 130, 498–509. [Google Scholar] [CrossRef] [Green Version]
  59. Tone, K. Dealing with undesirable outputs in DEA: A Slacks-Based Measure (SBM) approach. Nippon Opereshonzu Risachi Gakkai Shunki Kenkyu Happyokai Abus. 2004, 2004, 44–45. [Google Scholar] [CrossRef]
  60. Li, H.; Shi, J.-f. Energy efficiency analysis on Chinese industrial sectors: An improved Super-SBM model with undesirable outputs. J. Clean. Prod. 2014, 65, 97–107. [Google Scholar] [CrossRef]
  61. Li, H.; Fang, K.; Yang, W.; Wang, D.; Hong, X. Regional environmental efficiency evaluation in China: Analysis based on the Super-SBM model with undesirable outputs. Math. Comput. Model. 2013, 58, 1018–1031. [Google Scholar] [CrossRef]
  62. Huang, B.; Wu, B.; Barry, M. Geographically and Temporally Weighted Regression for Modeling Spatio-Temporal Variation in House Prices. Int. J. Geogr. Inf. Sci. 2010, 24, 383–401. [Google Scholar] [CrossRef]
  63. Wu, B.; Li, R.; Huang, B. A geographically and temporally weighted autoregressive model with application to housing prices. Int. J. Geogr. Inf. Sci. 2014, 28, 1186–1204. [Google Scholar] [CrossRef]
  64. Chu, H.-J.; Huang, B.; Lin, C.-Y. Modeling the spatio-temporal heterogeneity in the PM10-PM2.5 relationship. Atmos. Environ. 2015, 102, 176–182. [Google Scholar] [CrossRef]
Figure 1. Conceptual framework.
Land 11 00915 g001
Figure 2. Location of the YRD.
Land 11 00915 g002
Figure 3. Regional cooperation network and degree centrality in the YRD.
Land 11 00915 g003
Figure 4. ULUE change from 2009 to 2016.
Land 11 00915 g004
Figure 5. Distribution of the mean regression coefficients.
Land 11 00915 g005
Table 1. Variables of input and output.
Variable TypesDimensionsDefinitions
InputLandUrban area (km2)
LaborProportion of employees in secondary and tertiary industries (%)
CapitalTotal investment in fixed assets (10,000 Yuan)
TechnologyProportion of secondary and tertiary industries in GDP (%)
OutputDesirable outputAverage salary of employees (Yuan)
Park area per capita (m2)
Undesirable outputIndustrial wastewater discharge (10,000 t)
Industrial SO2 emissions (t)
Industrial smoke/power/dust emissions (t)
Table 2. Variable definitions and descriptive statistics.
Variable TypesVariablesMeanS.D.MinMax
Dependent variableUrban land-use efficiency0.940.270.401.59
Independent variableNumber of news about regional cooperation41.4025.766120
Control variablesGDP per capita (Yuan)85,054.7529,391.3033,166.00199,017.00
Proportion of fiscal expenditure in GDP (%)11.393.697.1424.64
Population density (Person/km2)821.67409.09411.802286.70
Science expenditure (10,000 Yuan)354,797.34601,108.7821,057.003,417,109.00
Table 3. Comparison results of OLS, TWR, and GTWR models.
Regression TypesAICcR2Adjusted R2RSS
OLS−19.53040.37210.34605.8581
TWR−15.75490.39030.36535.7326
GTWR−67.99870.76440.75472.2155
Publisher’s Note: MDPI stays neutral with regard to jurisdictional claims in published maps and institutional affiliations.

