Article

Slurry Spreading on a Silt Loam Soil: Influence of Tyre Inflation Pressure, Number of Passages, Machinery Choice and Tillage Method on Physical Soil Quality and Sugar Beet Growth

1
Department of Environment—Soil Physics Unit, Unesco Chair of Eremology, Ghent University, 9000 Ghent, Belgium
2
Plant Sciences Unit, Flanders Research Institute for Agriculture, Fisheries and Food (ILVO), 9820 Melle, Belgium
3
Royal Belgian Institute for the Breeding of Sugar Beets (IRBAB-KBIVB), 3300 Tienen, Belgium
*
Author to whom correspondence should be addressed.
Land 2022, 11(6), 913; https://doi.org/10.3390/land11060913
Submission received: 13 May 2022 / Revised: 6 June 2022 / Accepted: 13 June 2022 / Published: 15 June 2022

Abstract

:
Soil compaction forms a major threat to the well-functioning of agricultural soils. This threat is primarily driven by the increasing wheel loads of modern farming machinery and the increased frequency of field operations in periods when the soil is moist to wet and thus more prone to compaction. The application of slurry in early spring can have a highly detrimental impact, certainly for a crop like sugar beet, which is sensitive to soil compaction. A one-year experiment was set up on silt loam soil in the Belgian loess belt to assess the short-term impact of this field operation on soil under conventional ploughing and under non-inversion tillage. Two types of farming machinery were compared: a widely used tractor-trailer combination and a less common self-propelled slurry spreader, with the latter having higher wheel loads. Both machines were operated according to common or standard practice and a practice that aims at preventing soil compaction. For the tractor-trailer, this was with tyre inflation pressure recommended for road traffic and field traffic, respectively, corresponding with high and low tyre inflation pressure. The self-propelled slurry spreader was operated under standard and crab steering, respectively. Lowering the tyre inflation pressure to the recommended level for field traffic limited soil compaction and sugar beet yield loss. Although the effects of crab steering were less pronounced, it lowered the impact on the soil by limiting the number of passages. The overall machinery effect remained limited. The heavier self-propelled slurry spreader did not significantly increase the level of soil compactness and reduce sugar beet yield compared to the more common tractor-trailer combination. Soil under conventional ploughing showed more soil compaction, while the effectiveness of reducing tyre inflation pressure as a prevention strategy was lower compared to non-inversion tillage. The tillage practice, however, did not have any overall influence on sugar beet yield.

1. Introduction

Soil compaction forms a major threat to the well-functioning of agricultural soils [1]. By reducing the pore volume and continuity, crop growth and yield can be severely reduced [2], while ecological services, like water infiltration and storage, can also be negatively affected (e.g., [3,4,5,6]). Soil compaction is a world-wide problem, but soils in Europe seem to be most affected [7]. Estimations of Europe’s critically compacted soils range from 23 up to 43% of the total agricultural area [8,9].
The increased occurrence and severity of soil compaction results primarily from the ever-increasing size and thus load of farming machinery and the increased incidence of farming operations at soil moisture conditions that are suboptimal for traffic [10,11,12]. From 1990 up to 2010 the wheel load of a typical combine harvester used in western Europe increased by 50%, from approximately 6 to 9 tons [13]. From the same time up to 2020, in Belgium, for example (where this study was conducted), the area of crops with a late-season fall harvest has increased by 45% [14]. These factors have not only increased the extent and severity of soil compaction, but also expanded its impact further down into the subsoil (i.e., below the tillage layer) [13,15]. Traffic-induced compaction has been observed down to 1 m depth and as a general rule it is considered that a 5-ton wheel load will compact a moist (i.e., at field capacity) soil down to 50 cm depth [2,16]. At depths below 30 cm most compaction will be cumulative, persistent, and very difficult to sustainably remediate [2,17,18,19,20]. Prevention strategies are therefore needed.
Prevention strategies should seek to keep the traffic-induced stress lower than the soil strength. Previous studies have pointed to tyre–soil contact area, wheel load and number of passages as the most important factors determining the levels of soil stress. Contact area for the most part is linked to tyre dimensions, but tyre inflation pressure can also play a role. Correctly lowering tyre inflation pressure has been shown to reduce the mean and peak ground pressure [21,22,23,24,25]. However, at greater depths wheel load seems to become a much more determinative factor than the increased contact area, as earlier demonstrated by the modelling work of Söhne [26] and experimentally confirmed in [24,27,28,29,30]. Multiple studies link the number of passages with an increased risk of soil compaction. Jakobsen et al. [31] and Lipiec et al. [32] found that compaction increased linearly with the logarithm of the number of passages, while Peth et al. [33], Botta et al. [34] and Naderi-Boldaji et al. [35] observed a linear relationship. Compaction induced by the number of passages continues down into the subsoil. Schjønning et al. [36] found an increased penetration resistance until 60 cm depth after four passages, in contrast with one passage that did not induce measurable compaction. Schjønning et al. [37], Pulido-Moncada et al. [38] and Seehusen et al. [39] all found increased levels of subsoil compaction after multiple passages with smaller wheel loads compared to a single passage with a larger wheel load. ten Damme et al. [40] observed increased compaction with an increased number of passages, but this effect remained restricted to the topsoil. Manufacturers of farming machinery have tried to limit the growing impact on the soil by increasing the size of tyres, so as to increase the contact area with the soil, and by reducing the number of tyres that run in one track. The latter can be achieved by reducing the number of axles or tyres, but this will lead to an even bigger increase in wheel load. Altered steering modes for field traffic, such as crab steering, make it possible to limit the number of passages per location while keeping the number of axles and tyres constant. In comparing two types of manure application equipment, a traditional, widely used tractor-trailer combination and a self-propelled slurry spreader (tricycle frame), Schjønning et al. [37] and Pulido-Moncada et al. [38] found a significantly negative impact of a higher numbers of passages on subsoil compaction. While ten Damme et al. [40] looked into different steering modes of a specifically designed tractor-trailer combination to evaluate the impact of number of passages and traction on soil structure, to the best of our knowledge, the effect of different steering modes for practical farming machinery on soil compaction has not been reported in scientific literature.
The effectiveness of prevention strategies depends on the soil strength at trafficking. Soil moisture content, organic matter and structure are highly determinative factors for the soil strength [41] and can be influenced by farm management. For example, the time of field traffic [12], the presence of cover crops in the rotation [42] or tillage method [43] all affect soil strength. Several studies have demonstrated that inversion tillage (i.e., conventional ploughing) increases the susceptibility of soil to compaction compared to conservation or non-inversion tillage [44,45]. Since tyre deformation depends on the relative stiffness of tyre and soil [10], tillage will also influence the stress magnitude and distribution at the tyre–soil interface. Lamandé et al. [46] demonstrated that recent inversion tillage optimized the stress distribution at the tyre–soil interface. However, the reduced topsoil strength did not significantly affect the stress propagation deeper into the soil profile, as would be expected from the modified elasticity theory [47] that is widely used in modelling of soil compaction (e.g., [48]).
The response of crop yield to soil compaction is most often not linear, but parabolic, with an optimum at an intermediate level of compactness [49,50,51]. This optimum varies strongly between crops. Traditionally, root crops have been considered particularly sensitive to compaction [49]. The roots of sugar beets and carrots can be easily deformed in compacted soils by forking and fanging [52]. These effects have been shown to significantly increase with decreasing depth of the compacted layer [53,54]. The impact of different compaction levels on sugar beet growth and yield has been extensively studied in the past [51,55,56,57]. The experimental results pointed to clear reductions in root yield and sugar content [54], after field traffic with heavy farming machinery [57,58]. Pabin et al. [59] determined optimal levels of bulk density (1.51 g cm−3) and penetration resistance (1.75 MPa) by traffic-induced compaction and loosening of the soil for a sandy loam in Poland. Marinello et al. [60] linked the crop yield of sugar beets with the frequency of traffic and found that yield increases up to 10% could be possible with the implementation of careful traffic management. We do not know of any study that looks at the immediate effects of different manure application methods on sugar beet productivity. Yet, several studies did look at the effects of farming machinery commonly used in sugar beet cultivation on soil quality, with a particular focus on the long-term effects in the subsoil [37,38,61,62].
This study was set out to evaluate and quantify the short-term effects of tyre inflation pressure, number of passages and type of machinery during slurry spreading on the physical quality of a silt loam soil under different tillage practices and on the subsequent sugar beet crop. A widely used tractor-trailer combination was compared with a more recent self-propelled slurry spreader. The machines were different in wheel load, number of passages and tyre type (i.e., tyre dimensions). They were operated according to common or standard practice and a practice that aims at preventing soil compaction. For the tractor-trailer this was with tyre inflation pressure recommended for road traffic and field traffic, respectively, corresponding with high and low tyre inflation pressure. The self-propelled slurry spreader was operated under standard and crab steering, respectively. Since the application of measures to prevent soil compaction is still quite uncommon in Europe, it is highly relevant to look into the possible benefits their adoption might entail. We hypothesised that lowering tyre inflation pressure and limiting the number of tyre passages would be successful in limiting soil compaction and consequently improving sugar beet yield. The higher wheel loads of the self-propelled slurry spreader are expected to increase the impact on the soil, especially the subsoil, compared to the tractor-trailer combination. We further hypothesised that the traffic treatments would have a larger impact on conventionally ploughed soil because of its more disrupting effects on topsoil strength and thus higher susceptibility to soil compaction, than on non-inversion tilled soil. Since the experimental traffic was already preceded by tillage down to 20–30 cm and would only be followed up by a shallow (10–15 cm deep) cultivation before sowing, this study focuses on both topsoil and subsoil compaction. The experiment was limited to one year, since standard tillage operations in the winter after the harvesting of the sugar beet crop were expected to remediate most of the topsoil compaction resulting from the experimental treatment.

2. Materials and Methods

2.1. Study Site

The study site (50°43′39″ N–5°03′10″ E) was located in the Belgian loess belt, characterized by fertile silty soils. The Belgian soil map designates the field of interest as a dry silty soil with a texture B-horizon and a thin (<40 cm) A-horizon and could thus be classified as a Cutanic Luvisol (WRB, [63,64]). The soil texture is silty loam in the top 30 cm and silty clay loam from 30 to 60 cm (USDA). Basic soil properties of the top 60 cm are given in Table 1. The particle size distribution was determined with the sieving, sedimentation and pipette method (ISO 11277:2020; [65]) on three composite samples per depth interval, one per block (see Figure 1). A heated potassium dichromate oxidation was used to analyse soil organic carbon content (ISO 14235:1998) of the top 30 cm. The climate of the study area is temperate maritime with mild winters and warm summers [66], with a mean annual temperature of 9.2 °C and an average annual precipitation of 747 mm (data according to Bevekom weather station from the Royal Meteorological Institute of Belgium, RMI).

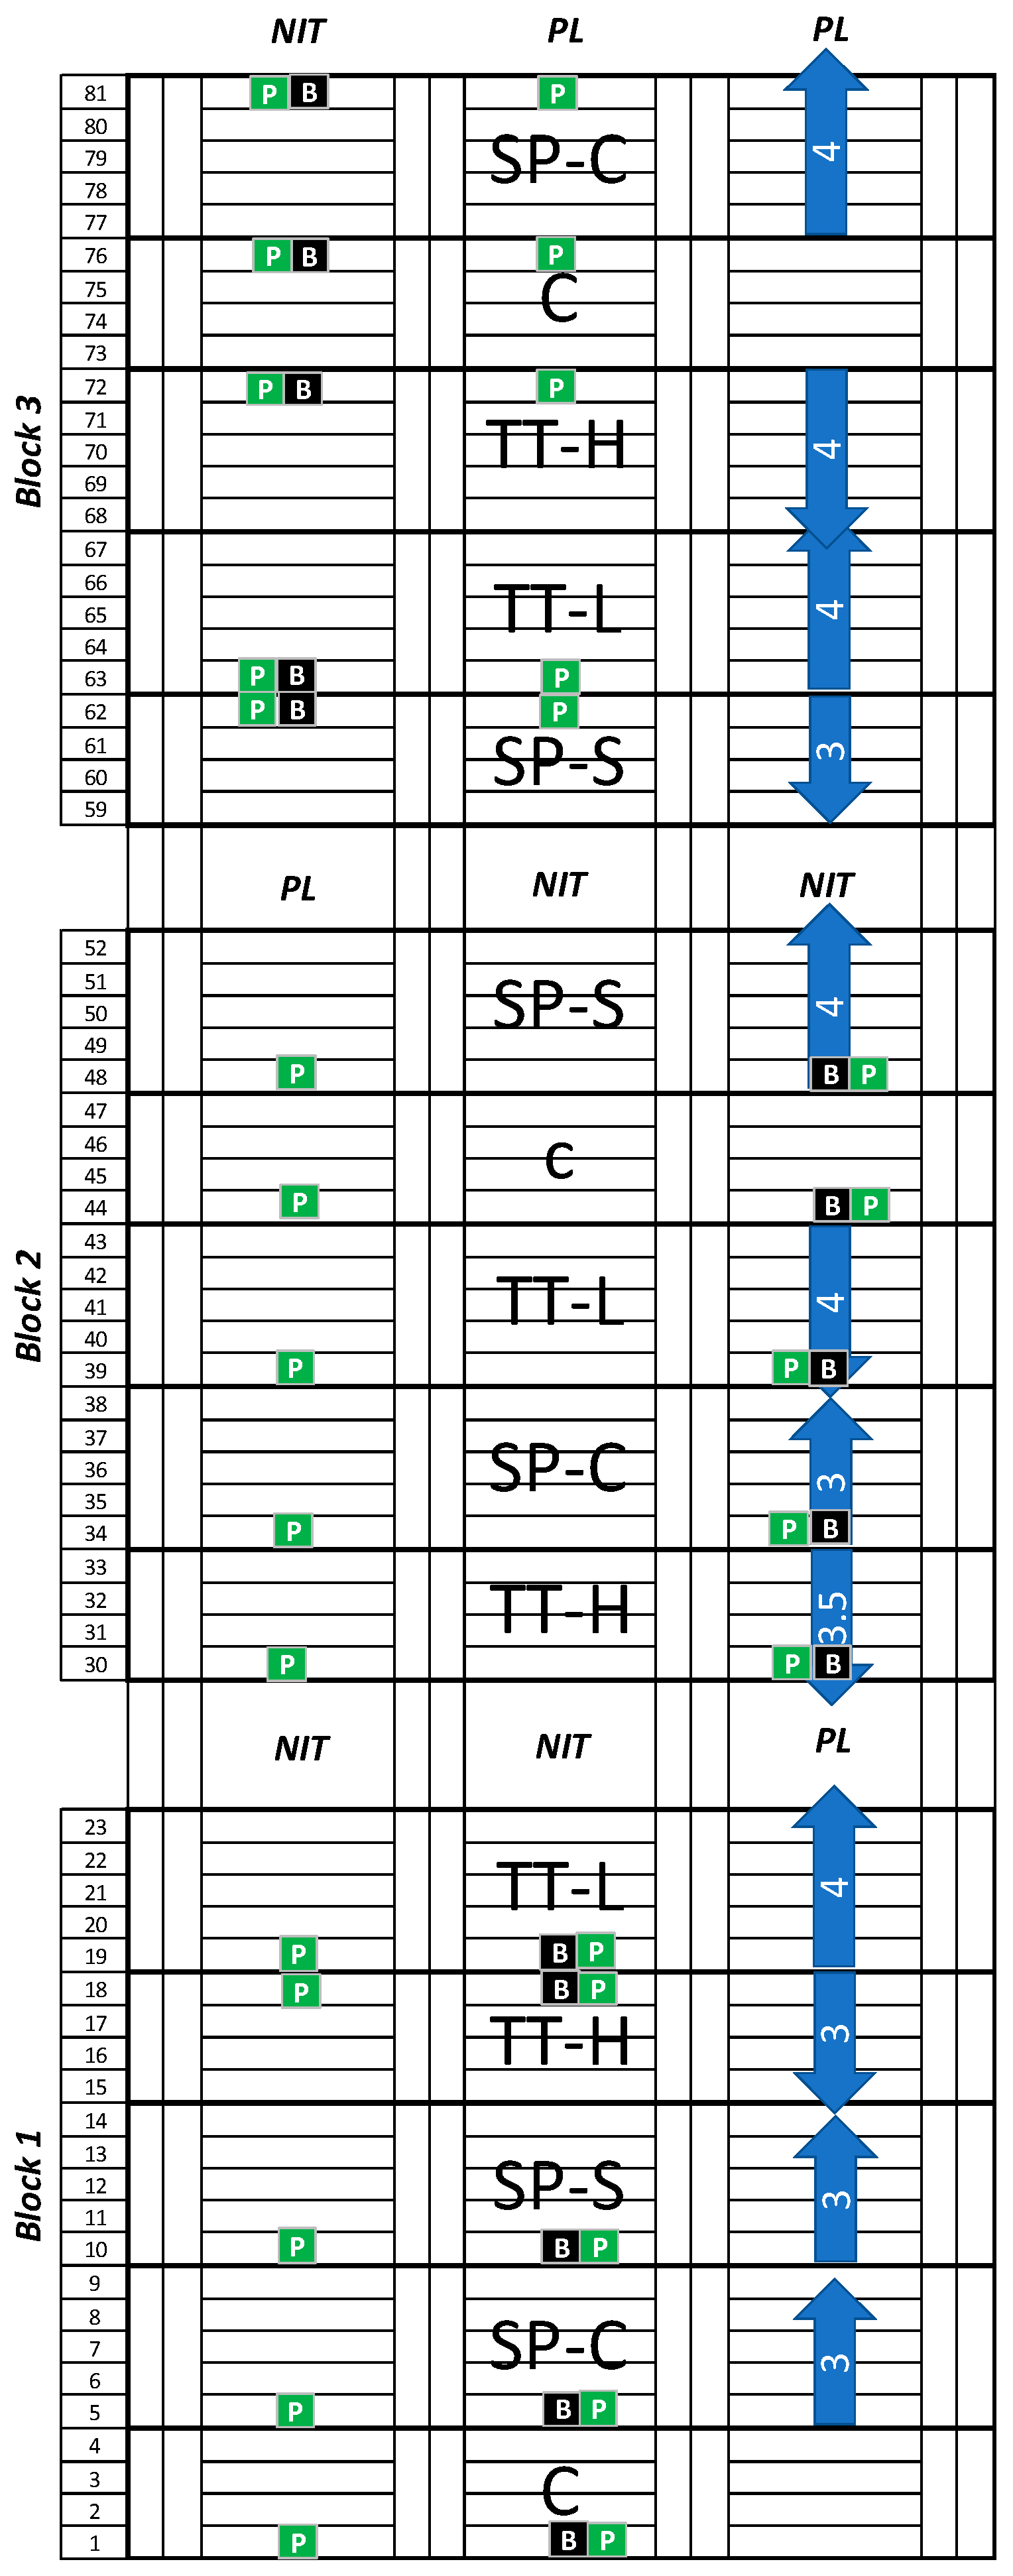
2.2. Experimental Design

The experiment looked at two main factors: tillage method and slurry application method. The applied tillage methods were ploughing or inversion tillage (PL) and non-inversion tillage (NIT). In this region tillage is standardly conducted in autumn/winter, so the field was already tilled three months before the slurry was applied in spring. The four tested slurry application methods will be discussed in more detail below. As a reference, an un-trafficked control with no passage of a slurry spreader (C) was added. Both factors were included in a randomized strip-plot design with three blocks and the tillage methods as whole-plot treatments (Figure 1). Block 1 was located on a gentle slope, and the other two on flatter ground. The slurry application methods each had three replications per tillage method. The cultivation methods had four and five repeats for inversion and non-inversion tillage, respectively. Due to practical constraints the tillage methods were only considered for the evaluation of the impact on rut depth, penetration resistance and the measured crop parameters. The evaluation of the other soil parameters was only done for the plots with non-inversion tillage (Figure 1). In the remainder, the term ‘treatment’ will refer to the slurry application methods.
Two of the slurry application treatments were performed with a self-propelled slurry spreader, one in crab steering (SP-C) and the other in standard steering (SP-S). These steering modes differ in the position of their axles during traffic. With crab steering the front axle is still perpendicular to the rear axle, but the tyres no longer drive in the same track, with only limited overlap between the tracks of front and rear axle. This allows the driver to limit the number of tyre passes per location to one. A conceptual drawing of both steering modes is given in Figure 2. The other two slurry application treatments used a tractor-trailer combination, with two axles on the trailer. All tyres of this combination were tested at an inflation pressure that is considered ideal for road traffic (TT-H) and at a level recommended for field traffic (TT-L). The inflation pressure of the tyres on the self-propelled slurry spreader was also at a level recommended for field traffic. The inflation pressures, the tyre types and the wheel loads for all treatments are given in Table 2. All tyres had the same design, i.e., they all were radial, but differed in tyre width: 1.05 m for both axles of the self-propelled slurry spreader and 0.54, 0.65, 0.75 and 0.75 m for the four axles of the tractor-trailer combination. The wheel load was measured prior to experimental traffic on a weighing scale designated for farming equipment.
The trafficking experiments were performed on 27 February 2019, a few months before the sowing of sugar beets. The year before, winter wheat was grown on the field. After the harvest in July 2018, the field had been cultivated and had remained fallow during the winter period. The depth of cultivation was 20 cm for the non-inversion plots and 30 cm for the ploughed plots. This was the first time in over 10 years that part of the field had been ploughed.
The traffic of all treatments was done wheel-to-wheel, with the intent of driving over the entire area of each plot. During traffic, the tank of the self-propelled slurry spreader and the trailer of the tractor-trailer combination remained completely full of water, to keep the wheel load constant for all plots. So, no slurry was applied during the experimental set-up. Only mineral fertilizers were applied prior to the sowing of the sugar beets.
The soil moisture conditions during the experimental traffic, shown by the gravimetric water content in Figure 3, were around field capacity, considered here at a matric suction of 10 kPa. The two tillage methods showed no differences in gravimetric water content in the subsoil but did in the topsoil. At the soil surface the inversion tillage plots had a significantly lower water content than the non-inversion plots, while it was markedly higher between 10 and 30 cm depth.

2.3. Field Measurements

In the tyre tracks, tyre contact area and rut depth were measured on the day of experimental traffic. The tyre contact area was measured once per axle by scattering chalk powder around the tyre, without repeats. These measurements were done at the edge of the field, which was cultivated with non-inversion tillage. The mean contact pressure per axle was calculated as the ratio between wheel load and contact area. The rut depth was determined by measuring the distance between the surface of the tyre track and a ruler placed perpendicular to the driving direction at the original surface level. This measurement was done five times in and five times between the tyre ridges, spread out over the track. The rut depth was measured during traffic with two repeats, once for each tillage method, per treatment per block. Because of the slight overlap of the front and rear tracks, which made it difficult to find the original surface level, the measurements for SP-C were done only twice at the edge of the field for non-inversion tillage.
Penetration resistance (PR) was measured with a hand-held penetrologger (Eijkelkamp Soil & Water) to 80 cm depth. The cone had a 1 cm2 base area, a 11.28 mm nominal diameter and a 60° top angle. These measurements were performed just before and after the experimental traffic, each time with eleven repeats per plot. The exact locations of the measurements are given in Figure 1. The pre-traffic measurements were performed to check the in-field variability and the differences in soil strength between the tillage methods. The post-traffic measurements were all taken in the centre of the tyre tracks (Figure 2). For the treatment SP-C the track created by the rear axle was chosen, since this axle carried the highest load. In summarizing previous studies, Bengough et al. [67] state that 2.0 and 3.0 MPa cause a 50% and 70% reduction in root elongation rate, respectively. These values are often used as general thresholds for PR.
The crop parameters were determined in September 2019. Firstly, 18.9 m2 was manually harvested to determine the percentage of deformed sugar beets. This was done in four and five plots for the ploughed and non-inversion tillage plots, respectively. The sugar beets were visually divided into four predefined classes based on the shape of their roots (KBIVB). Figure 4 shows an example for each of the four classes. The sugar beet roots in class 1 had an unbranched taproot. Class 2 was characterized by small root branches at the tip of the taproot, Class 3 by moderate splitting of the taproot and Class 4 by the absence of a clear taproot and strong splitting. In accordance with KBIVB procedure, classes 3 and 4 can be defined as seriously deformed. Further analysis of root deformation will therefore focus on the proportion of these two classes. Later, 18.9 m2 was harvested in five plots for both the ploughed and non-inversion tillage sections. The sugar beets were weighed after washing. A selection of the harvested sugar beets was then analysed for sugar content. Sugar content and total weight of sugar beets harvested were used to calculate total sugar yield, for which the farmer is actually paid.

2.4. Laboratory Measurements

All laboratory measurements were performed on undisturbed soil samples collected in 100 cm3 steel cores with 5.1 cm height and 5 cm diameter. The sampling was only done for non-inversion tillage at one location per plot at 5, 20 and 45 cm depth, resulting in three repeats per depth and treatment. The sampling was done after traffic and just like with the penetrometer, it was done in the centre of the tyre tracks (Figure 2).
First, water retention curves were determined with a sandbox and pressure chambers according to the procedure outlined in [68]. The samples were brought to the matric suctions of 1, 3, 5, 7, 10, 33, 100 and 1500 kPa.
At 10 kPa matric suction, air permeability (Ka) was determined with the steady-state method of Grover [69] according to the procedure described by Pulido Moncada et al. [70]. The used equipment consists of an annular water-filled reservoir with an open-bottomed float resting on the water. This creates an air chamber that goes through the inside of the water reservoir to the holding position of the sample. The float falls as the air in the air chamber passes through the soil sample. The rate of this fall is a measure for the air permeability.
A set of soil physical quality parameters and the pore size distribution were calculated from the water retention curves. Air capacity represents the pore volume filled with air at field capacity, here considered at a matric suction of 10 kPa (pF 2.0) [71]. Plant available water capacity, the ability of the soil to store and provide water to plant roots, is determined by subtracting the volumetric water content at field capacity by the volume at a matric suction of 1500 kPa [71]. Relative field capacity is a value for the ability of the soil to store water and air relative to the total pore volume, so the volumetric water content at field capacity divided by the volumetric water content at saturation [72]. Finally, the bulk density was determined by oven-drying the soil at 105 °C for 48 h [73]. Table 3 gives all relevant threshold values for the employed parameters.
Disturbed soil samples were taken concurrently with the PR measurements and at the time of the experimental traffic to determine the gravimetric water content by oven-drying the samples at 105 °C for 48 h [82].

2.5. Weather Conditions

Figure 5 presents the minimum and maximum temperature and total monthly rainfall for the experimental period (January–December 2019). These data are compared with the long-term averages for the period 1991–2020 (Data on the municipality of Landen from the Royal Meteorological Institute of Belgium, RMI). The growing period of sugar beets on the experimental field was from April to September 2019. The temperatures of this period were quite close to the long-term average. The precipitation, however, was relatively low, especially from July until September. June was the only month where the total monthly precipitation exceeded the long-term average.

2.6. Statistical Analysis

The statistical analysis was performed with SPSS Statistics 27 (SPSS, Chicago, IL, USA). The analyses of the rut depth, penetration resistance (per 10 cm depth interval) and crop parameters were performed as a two-way strip-plot ANOVA with tillage method as the vertical-factor, slurry application method (plus control) as the horizontal factor (fixed) and block as random factor. The analyses of the laboratory measurements were done as a one-way ANOVA with slurry application method as the fixed factor. If a significant effect was observed for the slurry application method (plus control), a Tukey post-hoc test was performed to show significant differences (p < 0.05) between the experimental treatments.

3. Results

3.1. Field Measurements

The area of tyre contact with the soil linked well with the tyre properties (Table 2 and Table 4). Tyres with the lowest width (0.54 m–front axle tractor) showed the lowest contact area, whereas the widest ones (1.05 m–self-propelled slurry spreader) had the highest contact area. Likewise, tyre inflation pressure had a substantial effect on the tyre contact area. The axles of the trailers showed a +46% and +31% increase in contact area after lowering the tyre inflation pressure. The higher contact area for the self-propelled slurry spreader resulted in mean contact pressures (1.29 and 1.68 kg cm−2) that were similar to those for the trailer of TT-L (1.37 and 1.58 kg cm−2) and lower than those for the trailer of TT-H (2.01 and 2.08 kg cm−2). This is noteworthy since the wheel load for the self-propelled slurry spreader was almost twice as high as for the tractor-trailer combination.
Table 5 shows the rut depth for the tested slurry application methods and tillage methods. The statistical analysis pointed out that both factors played a significant role in determining the rut depth. The traffic treatments on the inversion tillage plots caused 69% deeper ruts than for non-inversion. The differences between the traffic treatments were more modest, but still significant (p < 0.05). Treatment TT-H resulted in significantly deeper ruts than both SP-S and TT-L. Lowering the tyre inflation pressure reduced the rut depth by 23%. The rut depth in the treatment SP-C was measured only twice and only for non-inversion tillage, which prevented us from including it in the statistical analysis. So, although only demonstrative, these results do seem to point towards a clear reduction in rut depth with a reduction in number of passes.
Figure 6 presents the pre-traffic PR down to 80 cm depth for both tillage methods. These results can be viewed as an indication of the soil strength just before experimental traffic. As expected, the main differences between the tillage methods can be found in the topsoil. Down to 30 cm depth the inversion tillage caused a larger reduction in PR than the non-inversion tillage. The difference was significant (p < 0.05) between 0 and 20 cm, and a strong trend (p = 0.06) was observed between 20 and 30 cm depth. The disruption of soil by the inversion tillage also seems more homogeneous since the variation in PR was considerably lower than for non-inversion tillage. For the latter tillage method, a clear compacted layer, exceeding 1.75 MPa around 25 cm, was present between 20 and 40 cm depth. Inversion tillage partly disrupted this compacted layer, resulting in a peak occurring now deeper down the profile and the threshold value for sugar beet root growth (1.75 MPa) only being exceeded by the average PR measured around field capacity at 60 cm depth. The compacted layer, and what remains of it after inversion tillage, might work as a potential buffer against stress propagation reaching the deeper soil layers and causing subsoil compaction.
In Figure 7, PR after experimental traffic is presented, with Figure 7a showing the effects of the slurry application methods and the un-trafficked control (treatment), while Figure 7b displays the effects on the two tested tillage methods. The values shown were adjusted to take the rut depth into account. The statistical analysis pointed out that the experimental traffic treatments had a significant effect on PR down to 80 cm. In the top 20 cm all four slurry application methods significantly (p < 0.05) increased the PR compared to the un-trafficked control. Treatment SP-C had a significantly reduced impact compared to SP-S: −14% (0–10 cm) and −10% (10–20 cm), while it also showed a strong trend (0–10 cm: p = 0.06; 10–20 cm: p = 0.06) towards reduced impact compared to TT-L: −12% (0–10 cm) and −9% (10–20 cm). Deeper into the soil profile no significant increases in PR were caused by SP-C and TT-L, in contrast with SP-S and TT-H, which still showed significant PR differences between 20 and 30 cm depth. At this same depth interval TT-L showed a strong trend (p = 0.05) towards reduced impact (−13%) on PR compared to TT-H. Between 20 and 70 cm depth the highest average PR was measured for TT-H. Between 70 and 80 cm depth, the PR for TT-H was lower than that of the un-trafficked control, just like the other treatments, which did not differ much from each other. The un-trafficked control, SP-C and TT-L all surpassed the threshold value of 1.75 MPa for restriction of sugar beet root growth at 30 cm depth. For SP-S this was at 29 cm and for TT-H at 28 cm depth.
Even after experimental traffic the differences in PR between the tillage methods remained significant (p < 0.05) in the topsoil, with non-inversion tillage showing the highest values. The statistical analysis did also show a significant interaction between both tested factors for most of the depth intervals. When plotting PR of the slurry application methods and un-trafficked control per tillage method (Figure 8), it can be seen that the method of slurry application had a higher impact after inversion tillage in comparison with non-inversion tillage. This effect though was only significant in the topsoil of the inversion tillage plots. The difference in PR between SP-S and SP-C was clearer for inversion tillage. The opposite was true for TT-L and TT-H, with TT-L even resulting in higher topsoil PR than TT-H for inversion tillage.
Table 6 shows the effects of the traffic treatments and tillage methods on fresh beet yield, sugar yield and proportion of seriously deformed sugar beets. None of these parameters were clearly impacted by the tillage method and no significant interaction with the traffic treatment was observed. The traffic treatments, however, did result in significant effects on all three crop parameters. TT-H had the most negative effects with a significant 4% drop in sugar yield and 25% rise in seriously deformed sugar beet roots, compared to the un-trafficked control. The effects of the other treatments were much less pronounced and all insignificant. The SP-S treatment was the only other treatment that resulted in observable negative effects (−1% sugar yield and +1% seriously deformed beets), while the crop parameters under TT-L did not differ from that of the control, and those for SP-C were even higher than that of the control (+1% sugar yield and −1% seriously deformed beets). Between the traffic treatments, significant differences were limited to TT-H and SP-C. However, TT-L did show a trend (p = 0.08) towards reduced impact compared to TT-H for sugar yield. The effect of reduced tyre inflation pressure (TT-L compared to TT-H) was +3% for sugar yield and −25% for the portion of seriously deformed beets. The effect of reducing the number of passages (SP-C compared to SP-S) was +2% for sugar yield and −16% for the portion of seriously deformed beets.

3.2. Laboratory Measurements

The bulk density (Table 7) showed a substantial increase at 5 cm (+0.06 to 0.12 g cm−3) and 20 cm (+0.07 to 0.20 g cm−3) depth and a very limited increase at 45 cm (+0.02 to 0.04 g cm−3) depth after experimental traffic. However, none of these effects were statistically significant. Treatment TT-H did result in the highest bulk density at all sampled depths, while TT-L caused the least compaction. The differences between SP-C and SP-S were negligible.
For air permeability, a marginally significant effect of experimental traffic was only observed at 20 cm depth, but the post-hoc test did not show clear differences between the treatments. The post-hoc test only showed a trend between treatments TT-H and C (p = 0.08) and between SP-C and C (p = 0.09). The limited number of soil samples and the high variability of this parameter might help to explain this discrepancy between ANOVA and post-hoc test. The treatments SP-C and TT-H caused the clearest reduction, even below the limiting value of 20 µm2 as suggested by Fish and Koppi [80]. A similar, although insignificant, pattern was observed at 45 cm depth. At 5 cm depth the only clear reduction was observed for SP-C, which seemed to have made the surface layer practically impermeable for air (<1 µm2, [81]). The SP-S and TT-L treatments even showed an increase in air permeability. A very high variability was observed for all treatments and depths.
The water retention curves show some clear trends induced by experimental traffic (Figure 9). At 5 cm depth the traffic seems to have reduced the portion of larger pores, while increasing that of smaller ones. These effects were similar for all treatments. Only TT-H stood out with a slightly larger reduction in the portion of larger pores. Also at 20 cm depth, the treatments did show clear differences. Treatment TT-H had the largest effect on the pore space, more than SP-S and SP-C, which in turn, showed a larger impact on pore space than TT-L. At 45 cm depth the effects of the experimental traffic were negligible.
None of the soil physical parameters derived from the water retention curves were significantly (p < 0.05) affected by the experimental traffic (Table 8). At 5 cm depth the air capacity for all treatments was reduced by 0.03 m3 m−3 compared to the control. This is a small reduction, but considering the very low pre-traffic air capacity values, well below the limiting value of 0.10 m3 m−3 [71], it should not be neglected. The very low air capacities follow from the extremely high water content at field capacity at this depth, resulting also in high relative field capacity values. With pre-traffic soil physical quality at 20 cm depth being far better than at 5 cm, the tested parameters were more clearly impacted at this depth, which resulted in a trend (p = 0.06) in the statistical analysis. The effects on air capacity and relative field capacity were highest for TT-H and SP-C. Noteworthy is the higher plant available water capacity under the experimental traffic (p = 0.08). At 45 cm the biggest impact could be observed for TT-H, followed by SP-S and SP-C. Treatment TT-L showed no difference with the control at this depth.

4. Discussion

4.1. Tyre Inflation Pressure

The tyre inflation pressure had a noticeable impact on compacting the soil by the experimental traffic. At the soil surface, the higher tyre inflation pressure significantly increased rut depth by 39%. Higher values for bulk density and lower values for air permeability, air capacity and relative field capacity also pointed towards a higher reduction in soil quality. However, apart from rut depth, differences between TT-H and TT-L were only significant for PR. The high number of repetitions (i.e., 33) for PR compared to only three for the undisturbed samples could be a possible explanation. Several studies showed that lowering the tyre inflation pressure to the recommended value for field traffic resulted in reduced levels of soil compactness by lowering the mean and peak ground pressure, especially for tyres that allow for expansion of the tyre–soil contact area [21,22,23,24,25,83]. Although only demonstrative with one replication per axle, this experiment also showed a clear increase in contact area after lowering the tyre inflation pressure. This was clearest for both axles of the trailer, which had the highest reduction in tyre inflation pressure.
Contrary to our expectation, PR did not differ significantly between TT-H and TT-L near the soil surface (0–20 cm). The preventing effects of lowering the tyre inflation pressure only became observable from 20 cm downwards. Between 20 and 30 cm (−13%) and between 40 and 50 cm (−12%) the effect was clearest, although there was no significant difference with the un-trafficked control for both TT-H and TT-L at the latter depth interval. Deeper into the subsoil the effect of tyre inflation pressure did seem to fade away. Although not completely contradicting earlier findings that the effect of contact area on soil stress is highest in the topsoil, but decreases with depth, where wheel load comes to play a more important role [24,27,28,29,30], these results do show a less straightforward story. As said before, both treatments did not lead to significant increases in PR compared to the un-trafficked control in the subsoil. Thus, it could be that the attenuation of the stress through the soil profile was too high for it to cause noticeable soil compaction in the subsoil. This could be explained by the pre-existing compacted layer at the interface between top- and subsoil, which, as previously observed by Spoor et al. [84] and Schäfer-Landefeld et al. [19], could have prevented the stress from reaching the subsoil. It is also important to stress that previous studies that observed significant subsoil compaction after traffic with heavy farming machinery used in sugar beet cultivation all made use of repeated machinery passes in one year [36,61] or spread out over a period of three [39,62] to four years [37,38].
The treatment TT-H caused a 25% increase in seriously deformed sugar beet roots and a significant 4% reduction in sugar yield compared to the un-trafficked control, in contrast with TT-L, which showed almost no negative impact on crop growth. These results confirm that sugar beets are highly sensitive to soil compaction, especially topsoil compaction [53,54,58]. The only treatment that caused a significant reduction in sugar yield, TT-H, was also the only treatment that increased the bulk density (1.55 g cm−3) at 20 cm depth to a value above the threshold set by Pabin et al. [59] at 1.51 g cm−3. The threshold for PR (1.75 MPa) was exceeded at a slightly shallower depth for TT-H than for any of the other treatments. Unlike the other measured soil quality indicators, plant available water capacity was positively impacted (p = 0.08) by the experimental traffic. However, this does not necessarily mean that under the experimental traffic there was effectively more water available to the crops. After all, field capacity is dynamic rather than static [85], and water that may be available is not necessarily accessible [86]. It should be noted that our study concerns a one-year experiment which imposes some limitations on possible broad interpretations. However, the experimental period was characterized by a relatively dry summer, which is expected to become more prevalent with changing climate conditions [87,88,89].

4.2. Number of Passages

The impact of tyre passage number was studied by operating the self-propelled slurry spreader in crab (SP-C) and standard (SP-S) steering mode. The crab steering-mode made it possible to limit the number of passes per location to one, compared to two for SP-S. Even though both axles had the same tyre dimensions and similar wheel loads, SP-S caused a higher increase in PR than SP-C. Significant differences were restricted to the upper topsoil. So, our study confirms the results of ten Damme et al. [40], who reported an increased compaction with an increased number of passages, but with the effects mostly restricted to the topsoil. Yet, as also noted earlier, the relatively small impact on the subsoil was unexpected given such heavy wheel loads (9.405–10.375 tons) [2,16].
No differences between SP-C and SP-S were observed for the other physical soil parameters, except for air permeability. This parameter even shows a lower value for SP-C throughout the soil profile. These differences are, however, never significant. A possible reason could be the higher traction for SP-C since its track area and the soil that needs to be displaced is twice as high. This would increase the shear stress in the soil profile and thus promote soil deformation [90] and breaking the continuity of vertical pores, which determine the air permeability [91]. Indeed, ten Damme et al. [40] did find a substantial amplifying effect of traction on soil compaction. Whether this explains our observation remains speculative, since this study lacks any data on the traction of the machines during traffic.
The crop parameters were negatively impacted by the increased number of passages, although only slightly and insignificantly. Marinello et al. [60] did find a significant reduction in sugar beet yield after an increase in traffic intensity, although it is important to note that this study looked at machine passes and not wheel passes.

4.3. Machinery Choice

To evaluate the effect of the machine choice as such (TT vs. SP), we compared SP-C and TT-L, which both used the tyre inflation pressure recommended for field traffic but differed in wheel load, tyre dimensions and number of passages, which are intrinsic to the machine. Although mostly demonstrative, the results for the calculated mean normal pressure showed only minimal differences between SP-C and TT-L, which is noteworthy since the wheel loads for the self-propelled slurry spreader (9.405–10.375 tons) were almost twice as high as for the trailer of the tractor-trailer combination (5.080–5.845 tons). The rut depth did not show any significant differences between SP-C and TT-L, nor did PR. However, there was a strong trend at the surface (0–20 cm) towards a reduced impact on PR from SP-C compared to TT-L. Deeper into the soil profile the differences were mostly negligible, which does not support previously reported findings of wheel load being a more important factor than tyre–soil contact area for risk of subsoil compaction [24,26,27,28,29,30]. For the other soil physical parameters TT-L consistently had the lowest impact, but the observed differences were always insignificant. The crop parameters did not show any clear differences either.
The small differences in impact for such large differences in wheel load make us reject the starting hypothesis on machinery choice, which expected that the self-propelled slurry spread would have a bigger impact on the soil, especially the subsoil. However, it should be noted that the wheel load for both machines can be considered high, and high enough to have caused compaction into the subsoil in previous studies [2,16].

4.4. Tillage Method

The PR measured before experimental traffic showed clear differences in topsoil strength between both tillage methods. Inversion tillage had disrupted the soil much more than non-inversion tillage. It was therefore not surprising that the rut depth was 69% deeper after inversion tillage. However, the significant differences in topsoil PR between both tillage methods were still observed after experimental traffic. Both had been clearly compacted. There were some indications that non-inversion tillage preserved the soil from compaction to a higher extent from an increased number of passages, while at the same time resulting in better observable, although insignificant, differences between TT-H and TT-L. The first observation corresponds with the conclusion from previous studies that non-inversion tillage is less susceptible to soil compaction [44,45]. So, a soil with lower strength will be more affected by increasing the number of passages. The latter observation could possibly be explained by the differences in stiffness of the soil surface between both tillage methods. After all, the tyre deformation, which is needed for the reduced tyre inflation pressure to have an effect [21,22,23,24,25], depends on the relative stiffness of tyre and soil [10]. As Lamandé et al. [46] pointed out, the higher level of disruption of the soil surface after inversion tillage could have optimized the stress distribution at the tyre–soil interface for all traffic treatments. This in turn could have limited the influence of the prevention strategies that count on increasing the contact area and reducing peak stresses at the tyre–soil interface, such as reducing the tyre inflation pressure. However, since we did not measure the stress distribution beneath the experimental traffic treatments and only measured the contact area for non-inversion tillage, this line of reasoning remains a matter of conjecture.
Despite the partial disruption of the pre-existing compacted layer, inversion tillage did not result in more pronounced cases of subsoil compaction. For both tillage methods the effects on PR in the subsoil remained limited. This corresponds with the observations of Lamandé et al. [46], who did not observe significant differences in stress propagation reaching the subsoil between recent inversion tillage and a non-disturbed soil. This might have been expected for this experiment, since the difference in topsoil strength was even lower in this case, with both tillage methods disrupting the soil to some degree. Similarly, [62] did not observe an improved resistance to subsoil compaction by reduced tillage compared to deeper inversion tillage after repeated wheeling with heavy farming machinery.
The tillage method did not significantly influence the crop response. All measured crop parameters were almost identical for both tillage methods. These results correspond with the findings of previous Belgian field trials that observed no clear negative effects of non-inversion tillage on sugar beet yield [92,93,94]. Koch et al. [62] and Jabro et al. [95] pointed towards the importance of tillage depth for sugar beet yield when comparing conventional and conservation tillage. Shallower tillage did lead to significant reductions in yield.

5. Conclusions

This experiment looked at the effects of different slurry application methods, with a focus on prevention strategies, and preceding tillage method on soil compaction and sugar beet crop response, specifically for a silty loam soil. Since the experiment made use of machinery and practices that are available and commonly used by arable farmers in western Europe, it allowed us not only to come to theoretical conclusions, but also practical recommendations that are readily applicable.
(1).
Lowering the tyre inflation pressure to the recommended level for field traffic had a clear positive effect on the prevention of soil compaction and helped to avoid losses in sugar beet yield. Taking the time to alter the tyre inflation pressure before field traffic, possibly with a central, rapid tyre inflation system, should be a top priority.
(2).
The effects of repeated wheeling were less clear, but still observable, for PR and sugar beet yield. Crab steering can be used to prevent soil compaction by limiting the number of passages.
(3).
The overall effect of the machinery used remained limited. The heavier self-propelled slurry spreader did not significantly increase the level of soil compactness and reduce sugar beet yield compared to the more common tractor-trailer combination.
(4).
Experimental traffic after inversion tillage caused more soil compaction than after non-inversion tillage and it also led to a decreasing effectiveness of reducing tyre inflation pressure as a prevention strategy. The tillage method did not have any overall influence on sugar beet yield. Entering the field with heavy farming machinery when the topsoil has a low bearing capacity should be avoided.
It should be noted that our study concerns a one-year experiment, which imposes some limitations on possible broad interpretations. However, the experimental period was characterized by a relatively dry summer, which is expected to become more prevalent with changing climate conditions.

Author Contributions

Conceptualization, T.D. and R.E.; methodology, A.V., T.D., R.E. and W.C.; software, A.V.; validation, A.V.; formal analysis, A.V.; investigation, A.V.; resources, R.E.; data curation, A.V.; writing—original draft preparation, A.V.; writing—review and editing, T.D. and W.C.; visualization, A.V.; supervision, T.D. and W.C.; project administration, T.D.; funding acquisition, T.D. and W.C. All authors have read and agreed to the published version of the manuscript.

Funding

The research leading to these results received funding from the Flemish Government-Agentschap Innoveren & Ondernemen for the VLAIO LA project “Prevention and remediation of soil compaction” (HBC.2017.0834).

Institutional Review Board Statement

Not applicable.

Informed Consent Statement

Not applicable.

Data Availability Statement

The data that support the findings of this study are available from the corresponding author upon reasonable request.

Acknowledgments

The experimental work for this study was performed as a cooperation between the Royal Belgian Institute for the breeding of sugar beets (KBIVB), the Flanders Research Institute for Agriculture, Fisheries and Food (ILVO), Ghent University and the Belgian Soil Service. The study was supported by the VLAIO LA project “Prevention and remediation of soil compaction” (HBC.2017.0834).

Conflicts of Interest

The authors declare no conflict of interest. The funders had no role in the design of the study; in the collection, analyses, or interpretation of data; in the writing of the manuscript, or in the decision to publish the results.

References

  1. FAO. Status of the World’s Soil Resources; FAO: Rome, Italy, 2015; ISBN 9789251090046. [Google Scholar]
  2. Håkansson, I.; Reeder, R.C. Subsoil Compaction by Vehicles with High Axle Load—Extent, Persistence and Crop Response. Soil Tillage Res. 1994, 29, 277–304. [Google Scholar] [CrossRef]
  3. Soane, B.D.; Blackwell, P.S.; Dickson, J.W.; Painter, D.J. Compaction by Agricultural Vehicles: A Review I. Soil and Wheel Characteristics. Soil Tillage Res. 1980, 1, 207–237. [Google Scholar] [CrossRef]
  4. Horn, R.; Taubner, H.; Wuttke, M.; Baumgartl, T. Soil Physical Properties Related to Soil Structure. Soil Tillage Res. 1994, 30, 187–216. [Google Scholar] [CrossRef]
  5. Hartge, K.H.; Horn, R. Essential Soil Physics; Schweizerbart Science Publisher: Stuttgart, Germany, 2016. [Google Scholar]
  6. Keller, T.; Sandin, M.; Colombi, T.; Horn, R.; Or, D. Historical Increase in Agricultural Machinery Weights Enhanced Soil Stress Levels and Adversely Affected Soil Functioning. Soil Tillage Res. 2019, 194, 104293. [Google Scholar] [CrossRef]
  7. Oldeman, L.R.; Hakkeling, R.T.; Sombroek, W.G. World Map of the Status of Human-Induced Soil Degradation: An Explanatory Note; ISRIC: Wageningen, The Netherlands, 1991. [Google Scholar]
  8. Stolte, J.; Tesfai, M.; Øygarden, L.; Kværnø, S.; Keizer, J.; Verheijen, F.; Panagos, P.; Ballabio, C.; Hessel, R. Soil Threats in Europe; European Union: Luxembourg, 2016. [Google Scholar] [CrossRef]
  9. Brus, D.J.; Van Den Akker, J.J.H. How Serious a Problem Is Subsoil Compaction in the Netherlands? A Survey Based on Probability Sampling. Soil 2018, 4, 37–45. [Google Scholar] [CrossRef] [Green Version]
  10. Koolen, A.J.; Kuipers, H. Agricultural Soil Mechanics; Springer: New York, NY, USA, 1983; ISBN 978-3-642-69012-9. [Google Scholar]
  11. Saffih-Hdadi, K.; Défossez, P.; Richard, G.; Cui, Y.J.; Tang, A.M.; Chaplain, V. A Method for Predicting Soil Susceptibility to the Compaction of Surface Layers as a Function of Water Content and Bulk Density. Soil Tillage Res. 2009, 105, 96–103. [Google Scholar] [CrossRef]
  12. Gut, S.; Chervet, A.; Stettler, M.; Weisskopf, P.; Sturny, W.G.; Lamandé, M.; Schjønning, P.; Keller, T. Seasonal Dynamics in Wheel Load-Carrying Capacity of a Loam Soil in the Swiss Plateau. Soil Use Manag. 2015, 31, 132–141. [Google Scholar] [CrossRef]
  13. Schjønning, P.; van den Akker, J.J.H.; Keller, T.; Greve, M.H.; Lamandé, M.; Simojoki, A.; Stettler, M.; Arvidsson, J.; Breuning-Madsen, H. Driver-Pressure-State-Impact-Response (DPSIR) Analysis and Risk Assessment for Soil Compaction—A European Perspective. In Advances in Agronomy; Elsevier Inc.: Amsterdam, The Netherlands, 2015; Volume 133, pp. 183–237. ISBN 9780128030523. [Google Scholar]
  14. STATBEL Landbouwgegevens. Available online: https://statbel.fgov.be/nl/themas/landbouw-visserij/land-en-tuinbouwbedrijven#figures (accessed on 8 October 2021).
  15. Vermeulen, G.D.; Verwijs, B.R.; van den Akker, J.J.H. Vergelijking van de Bodembelasting Bij Agrarisch Veldwerk in 1980 En 2010; Wageningen University: Wageningen, The Netherlands, 2013; Volume 501. [Google Scholar]
  16. Alakukku, L. Long-Term Soil Compaction Due to High Axle Load Traffic; Agricultural Research Centre of Finland: Jokioinen, Finland, 1997. [Google Scholar]
  17. Soane, G.C.; Godwin, R.J.; Marks, M.J.; Spoor, G. Crop and Soil Response to Subsoil Loosening, Deep Incorporation of Phosphorus and Potassium Fertilizer and Subsequent Soil Management on a Range of Soil Types. Part 2: Soil Structural Conditions. Soil Use Manag. 1987, 3, 123–130. [Google Scholar] [CrossRef]
  18. Sharratt, B.; Voorhees, W.; McIntosh, G.; Lemme, G. Persistence of Soil Structural Modifications along a Historic Wagon Trail. Soil Sci. Soc. Am. J. 1998, 62, 774–777. [Google Scholar] [CrossRef]
  19. Schäfer-Landefeld, L.; Brandhuber, R.; Fenner, S.; Koch, H.J.; Stockfisch, N. Effects of Agricultural Machinery with High Axle Load on Soil Properties of Normally Managed Fields. Soil Tillage Res. 2004, 75, 75–86. [Google Scholar] [CrossRef]
  20. Schjønning, P.; Rasmussen, S.T.; Lamandé, M.; Nielsen, J.M.; Christensen, B.B.; Nørgaard, H.; Bak, H.; Nielsen, J.A. Soil Characterization of Experimental Fields Prior to Soil Compaction Experiments; Aarhus University: Tjele, Denmark, 2011. (In Danish) [Google Scholar]
  21. van den Akker, J.J.H.; Arts, W.B.M.; Koolen, A.J.; Stuiver, H.J. Comparison of Stresses, Compactions and Increase of Penetration Resistances Caused by a Low Ground Pressure Tyre and a Normal Tyre. Soil Tillage Res. 1994, 29, 125–134. [Google Scholar] [CrossRef]
  22. Arvidsson, J.; Ristic, S. Soil Stress and Compaction Effects for Four Tractor Tyres. J. Terramech. 1996, 33, 223–232. [Google Scholar] [CrossRef]
  23. Bailey, A.C.; Raper, R.L.; Way, T.R.; Burt, E.C.; Johnson, C.E. Soil Stresses under a Tractor Tire at Various Loads and Inflation Pressures. J. Terramech. 1996, 33, 1–11. [Google Scholar] [CrossRef]
  24. Arvidsson, J.; Keller, T. Soil Stress as Affected by Wheel Load and Tyre Inflation Pressure. Soil Tillage Res. 2007, 96, 284–291. [Google Scholar] [CrossRef]
  25. ten Damme, L.; Stettler, M.; Pinet, F.; Vervaet, P.; Keller, T.; Munkholm, L.J.; Lamandé, M. The Contribution of Tyre Evolution to the Reduction of Soil Compaction Risks. Soil Tillage Res. 2019, 194, 1–10. [Google Scholar] [CrossRef] [Green Version]
  26. Söhne, W. Druckverteilung Im Boden Und Bodenverformung Unter Schlepperreifen. Grundl. Landtech.-Konstr. 1953, 5, 49–63. [Google Scholar]
  27. Taylor, J.H.; Burt, E.C. Total Axle Load Effects on Soil Compaction. J. Terramech. 1987, 24, 179–186. [Google Scholar] [CrossRef]
  28. Smith, D.L.O.; Dickson, J.W. Contributions of Vehicle Weight and Ground Pressure to Soil Compaction. J. Agric. Eng. Res. 1990, 46, 13–29. [Google Scholar] [CrossRef]
  29. Lamandé, M.; Schjønning, P.; Tøgersen, F.A. Mechanical Behaviour of an Undisturbed Soil Subjected to Loadings: Effects of Load and Contact Area. Soil Tillage Res. 2007, 97, 91–106. [Google Scholar] [CrossRef]
  30. Lamandé, M.; Schjønning, P. Transmission of Vertical Stress in a Real Soil Profile. Part II: Effect of Tyre Size, Inflation Pressure and Wheel Load. Soil Tillage Res. 2011, 114, 71–77. [Google Scholar] [CrossRef]
  31. Jakobsen, B.F.; Greacen, E.L. Compaction of Sandy Forest Soils by Forwarder Operations. Soil Tillage Res. 1985, 5, 55–70. [Google Scholar] [CrossRef]
  32. Lipiec, J.; Szustak, A.; Tarkiewicz, S. Soil Compaction: Responses of Soil Physical Properties and Crop Growth. Zesz. Probl. Postep. Nauk Rol.-Pol. Akad. Nauk 1992, 398, 113–117. [Google Scholar]
  33. Peth, S.; Horn, R. The Mechanical Behavior of Structured and Homogenized Soil under Repeated Loading. J. Plant Nutr. Soil Sci. 2006, 169, 401–410. [Google Scholar] [CrossRef]
  34. Botta, G.F.; Becerra, A.T.; Tourn, F.B. Effect of the Number of Tractor Passes on Soil Rut Depth and Compaction in Two Tillage Regimes. Soil Tillage Res. 2009, 103, 381–386. [Google Scholar] [CrossRef]
  35. Naderi-Boldaji, M.; Kazemzadeh, A.; Hemmat, A.; Rostami, S.; Keller, T. Changes in Soil Stress during Repeated Wheeling: A Comparison of Measured and Simulated Values. Soil Res. 2018, 56, 204–214. [Google Scholar] [CrossRef]
  36. Schjønning, P.; Rasmussen, K.J. Danish Experiments on Subsoil Compaction by Vehicles with High Axle Load. Soil Tillage Res. 1994, 29, 215–228. [Google Scholar] [CrossRef]
  37. Schjønning, P.; Lamandé, M.; Munkholm, L.J.; Lyngvig, H.S.; Nielsen, J.A. Soil Precompression Stress, Penetration Resistance and Crop Yields in Relation to Differently-Trafficked, Temperate-Region Sandy Loam Soils. Soil Tillage Res. 2016, 163, 298–308. [Google Scholar] [CrossRef]
  38. Pulido-Moncada, M.; Munkholm, L.J.; Schjønning, P. Wheel Load, Repeated Wheeling, and Traction Effects on Subsoil Compaction in Northern Europe. Soil Tillage Res. 2019, 186, 300–309. [Google Scholar] [CrossRef]
  39. Seehusen, T.; Riggert, R.; Fleige, H.; Horn, R.; Riley, H. Soil Compaction and Stress Propagation after Different Wheeling Intensities on a Silt Soil in South-East Norway. Acta Agric. Scand. Sect. B Soil Plant Sci. 2019, 69, 343–355. [Google Scholar] [CrossRef]
  40. ten Damme, L.; Schjønning, P.; Munkholm, L.; Green, O.; Nielsen, S.; Lamandé, M. Soil Structure Response to Field Traffic: Effects of Traction and Repeated Wheeling. Soil Tillage Res. 2021, 213, 105–128. [Google Scholar] [CrossRef]
  41. Horn, R.; Lebert, M. Soil Compactability and Compressibility. In Soil Compaction in Crop Production; Soane, B.D., van Ouwerkerk, C., Eds.; Elsevier Science B.V.: Amsterdam, The Netherlands, 1994; pp. 45–69. ISBN 9780444882868. [Google Scholar]
  42. Blanco-Canqui, H.; Shaver, T.M.; Lindquist, J.L.; Shapiro, C.A.; Elmore, R.W.; Francis, C.A.; Hergert, G.W. Cover Crops and Ecosystem Services: Insights from Studies in Temperate Soils. Agron. J. 2015, 107, 2449–2474. [Google Scholar] [CrossRef] [Green Version]
  43. Horn, R. Auswirkung Unterschiedlicher Bodenbearbeitung Auf Die Mechanische Belastbarkeit von Ackerböden. Z. Für Pflanz. Und Bodenkd. 1986, 149, 9–18, (In German with English Summary). [Google Scholar] [CrossRef]
  44. Horn, R. Time Dependence of Soil Mechanical Properties and Pore Functions for Arable Soils. Soil Sci. Soc. Am. J. 2004, 68, 1131–1137. [Google Scholar] [CrossRef]
  45. Wiermann, C.; Werner, D.; Horn, R.; Rostek, J.; Werner, B. Stress/Strain Processes in a Structured Unsaturated Silty Loam Luvisol under Different Tillage Treatments in Germany. Soil Tillage Res. 2000, 53, 117–128. [Google Scholar] [CrossRef]
  46. Lamandé, M.; Schjønning, P. Transmission of Vertical Stress in a Real Soil Profile. Part I: Site Description, Evaluation of the Söhne Model, and the Effect of Topsoil Tillage. Soil Tillage Res. 2011, 114, 57–70. [Google Scholar] [CrossRef]
  47. Fröhlich, O.K. Druckverteilung Im Baugrunde (Pressure Distribution in Foundation Soils); Springer: Vienna, Austria, 1934. [Google Scholar]
  48. Lassen, P.; Lamandé, M.; Stettler, M.; Keller, T.; Jørgensen, M.S.; Lilja, H. Terranimo®—A Soil Compaction Model with Internationally Compatible Input Options. In Proceedings of the EFITA-WCCA-CIGR Conference “Sustainable Agriculture through ICT Innovation”, Torino, Italy, 24–27 June 2013. [Google Scholar]
  49. Lipiec, J.; Simota, C. Role of Soil and Climate Factors in Influencing Crop Responses to Soil Compaction in Central and Eastern Europe. In Soil Compaction in Crop Production; Soane, B.D., van Ouwerkerk, C., Eds.; Elsevier: Amsterdam, The Netherlands, 1994; pp. 365–389. ISBN 9780444882868. [Google Scholar]
  50. Håkansson, I.; Lipiec, J. A Review of the Usefulness of Relative Bulk Density Values in Studies of Soil Structure and Compaction. Soil Tillage Res. 2000, 53, 71–85. [Google Scholar] [CrossRef]
  51. Arvidsson, J.; Håkansson, I. Response of Different Crops to Soil Compaction-Short-Term Effects in Swedish Field Experiments. Soil Tillage Res. 2014, 138, 56–63. [Google Scholar] [CrossRef]
  52. Glinski, J.; Lipiec, J. Soil Physical Conditions and Plant Roots; CRC Press: Boca Raton, FL, USA, 1990; ISBN 9781315897608. [Google Scholar]
  53. Birkás, M.; Gyuricza, C. INCO-Copernicus Concerted Action on ‘Expertiences with the Impact of Subsoil Compaction on Soil Nutrition, Crop Growth and Environment and Ways to Prevent Subsoil Compaction’; Gödöllö, Hungary, 2001. [Google Scholar]
  54. Lipiec, J.; Medvedev, V.V.; Birkas, M.; Dumitru, E.; Lyndina, T.E.; Rousseva, S.; Fulajtár, E. Effect of Soil Compaction on Root Growth and Crop Yield in Central and Eastern Europe. Int. Agrophys. 2003, 17, 61–69. [Google Scholar]
  55. Arvidsson, J.; Bölenius, E.; Maria, K.; Cavalieri, V. Effects of Compaction during Drilling on Yield of Sugar Beet (Beta vulgaris L.). Eur. J. Agron. 2012, 39, 44–51. [Google Scholar] [CrossRef]
  56. Gemtos, T.A.; Lellis, T. Effects of Soil Compaction, Water and Organic Matter Contents on Emergence and Initial Plant Growth of Cotton and Sugar Beet. J. Agric. Eng. Res. 1997, 66, 121–134. [Google Scholar] [CrossRef]
  57. Hebblethwaite, P.D.; McGowan, M. The Effects of Soil Compaction on the Emergence, Growth and Yield of Sugar Beet and Peas. J. Sci. Food Agric. 1980, 31, 1131–1142. [Google Scholar] [CrossRef]
  58. Brereton, J.C.; McGowan, M.; Dawkins, T.C.K. The Relative Sensitivity of Spring Barley, Spring Field Beans and Sugar Beet Crops to Soil Compaction. F. Crop. Res. 1986, 13, 223–237. [Google Scholar] [CrossRef]
  59. Pabin, J.; Sienkiewicz, J.; Włdek, S. Effect of Loosening and Compacting on Soil Physical Properties and Sugar Beet Yield. Soil Tillage Res. 1991, 19, 345–350. [Google Scholar] [CrossRef]
  60. Marinello, F.; Pezzuolo, A.; Cillis, D.; Chiumenti, A.; Sartori, L. Traffic Effects on Soil Compaction and Sugar Beet (Beta vulgaris L.) Taproot Quality Parameters. Spanish J. Agric. Res. 2017, 15, 1–8. [Google Scholar] [CrossRef] [Green Version]
  61. Arvidsson, J. Subsoil Compaction Caused by Heavy Sugarbeet Harvesters in Southern Sweden: I. Soil Physical Properties and Crop Yield in Six Field Experiments. Soil Tillage Res. 2001, 60, 67–78. [Google Scholar] [CrossRef]
  62. Koch, H.-J.; Heuer, H.; Tomanova, O.; Bernwar, M. Cumulative Effect of Annually Repeated Passes of Heavy Agricultural Machinery on Soil Structural Properties and Sugar Beet Yield under Two Tillage Systems. Soil Tillage Res. 2008, 101, 69–77. [Google Scholar] [CrossRef]
  63. Dondeyne, S.; Vanierschot, L.; Langohr, R.; Van Ranst, E.; Deckers, J.A. The Soil Map of the Flemish Region Converted to the 3rd Edition of the World Reference Base for Soil Resources; Vlaamse Overheid—Departement Leefmilieu, Natuur & Energie, 2014. [Google Scholar] [CrossRef]
  64. IUSS Working Group WRB. World Reference Base for Soil Resources 2006, First Update 2007; World Soil Resources Reports No 103; FAO: Rome, Italy, 2007. [Google Scholar]
  65. Gee, G.W.; Bauder, J.W. Particle-Size Analysis. In Methods of Soil Analysis: Part 1—Physical and Mineralogical Methods (Methods of Soil Analysis); Klute, A., Ed.; American Society of Agronomy/Soil Science Society of America: Madison, WI, USA, 1986; pp. 383–411. [Google Scholar]
  66. Kottek, M.; Grieser, J.; Beck, C.; Rudolf, B.; Rubel, F. World Map of the Köppen-Geiger Climate Classification Updated. Meteorol. Z. 2006, 15, 259–263. [Google Scholar] [CrossRef]
  67. Bengough, A.G.; McKenzie, B.M.; Hallett, P.D.; Valentine, T.A. Root Elongation, Water Stress, and Mechanical Impedance: A Review of Limiting Stresses and Beneficial Root Tip Traits. J. Exp. Bot. 2011, 62, 59–68. [Google Scholar] [CrossRef] [Green Version]
  68. Cornelis, W.M.; Khlosi, M.; Hartmann, R.; Van Meirvenne, M.; De Vos, B. Comparison of Unimodal Analytical Expressions for the Soil-Water Retention Curve. Soil Sci. Soc. Am. J. 2005, 69, 1902–1911. [Google Scholar] [CrossRef] [Green Version]
  69. Grover, B.L. Simplified Air Permeameters for Soil in Place1. Soil Sci. Soc. Am. J. 1955, 19, 414. [Google Scholar] [CrossRef]
  70. Pulido Moncada, M.; Helwig Penning, L.; Timm, L.C.; Gabriels, D.; Cornelis, W.M. Visual Examination of Changes in Soil Structural Quality Due to Land Use. Soil Tillage Res. 2017, 173, 83–91. [Google Scholar] [CrossRef]
  71. White, R.E. Principles and Practice of Soil Science, 4th ed.; Blackwell Publishing: Oxford, UK, 2006; ISBN 9781118685730. [Google Scholar]
  72. Reynolds, W.D.; Drury, C.F.; Yang, X.M.; Tan, C.S. Optimal Soil Physical Quality Inferred through Structural Regression and Parameter Interactions. Geoderma 2008, 146, 466–474. [Google Scholar] [CrossRef]
  73. Grossman, R.B.; Reinsch, T.G. 2.1 Bulk Density and Linear Extensibility. In Methods of Soil Analysis: Part 4—Physical Methods; Dane, J.H., Topp, G.C., Eds.; American Society of Agronomy/Soil Science Society of America: Madison, WI, USA, 2002; pp. 208–228. ISBN 9780891188933. [Google Scholar]
  74. Goldsmith, W.; Marvin, S.; Fischenich, C. Determining Optimal Degree of Soil Compaction for Balancing Mechanical Stability and Plant, Ecosystem Management and Restoration Research Program; ERDCTN EMRRP-SR-26; United States Army Engineer Research and Development Center: Vicksburg, MS, USA, 2001. [Google Scholar]
  75. United States Department of Agriculture (USDA). Soil Quality Test Kit Guide. 1999. Available online: https://www.nrcs.usda.gov/wps/portal/nrcs/detail/soils/health/assessment/?cid=nrcs142p2_053873 (accessed on 10 May 2022).
  76. Hall, D.G.M.; Reeve, M.J.; Thomasson, A.J.; Wright, V.F. Water Retention, Porosity and Density of Field Soils; Rothamsted Experimental Station: Harpenden, UK, 1977. [Google Scholar]
  77. Verdonck, O.; Penninck, R.; De Boodt, M. The Physical Properties of Different Horticultural Substrates. Acta Hortic. 1984, 150, 155–160. [Google Scholar] [CrossRef]
  78. Cockroft, B.; Olsson, K.A. Case Study of Soil Quality in South-Eastern Australia: Management of Structure for Roots in Duplex Soils. In Soil Quality for Crop Production and Ecosystem Health; Gregorich, E.G., Carter, M.R., Eds.; Elsevier Inc.: Amsterdam, The Netherlands, 1997; Volume 25, pp. 339–350. ISBN 9780080541402. [Google Scholar]
  79. Doran, J.W.; Mielke, L.N.; Power, J.F. Microbial Activity as Regulated by Soil Waterfilled Pore Space. In Proceedings of the Symposium III-3, Ecology of Soil Microorganisms in the Microhabitat Environments III. Transactions of the 14th International Congress of Soil Science, Kyoto, Japan, August 1990; pp. 94–99. [Google Scholar]
  80. Fish, A.N.; Koppi, A.J. The Use of a Simple Field Air Permeameter as a Rapid Indicator of Functional Soil Pore Space. Geoderma 1994, 63, 255–264. [Google Scholar] [CrossRef]
  81. Ball, B.C.; O’Sullivan, M.F.; Hunter, R. Gas Diffusion, Fluid Flow and Derived Pore Continuity Indices in Relation to Vehicle Traffic and Tillage. J. Soil Sci. 1988, 39, 327–339. [Google Scholar] [CrossRef]
  82. Topp, C.G.; Ferré, P. 3.1 Water Content. In Methods of Soil Analysis, Part 4—Physical Methods; Dane, J.H., Topp, G.C., Eds.; American Society of Agronomy/Soil Science Society of America: Madison, WI, USA, 2002; pp. 255–293. ISBN 978-0-891-18893-3. [Google Scholar]
  83. Moitzi, G.; Sattler, E.; Wagentristl, H. Effect of Cover Crop, Slurry Application with Different Loads and Tire Inflation Pressures on Tire Track Depth, Soil Penetration Resistance and Maize Yield. Agriculture 2021, 11, 641. [Google Scholar] [CrossRef]
  84. Spoor, G.; Tijink, F.G.J.; Weisskopf, P. Subsoil Compaction: Risk, Avoidance, Identification and Alleviation. Soil Tillage Res. 2003, 73, 175–182. [Google Scholar] [CrossRef]
  85. Hillel, D. Environmental Soil Physics: Fundamentals, Applications, and Environmental Considerations; Academic Press: Cambridge, MA, USA, 1998; ISBN 9780080544151. [Google Scholar]
  86. Colombi, T.; Torres, L.C.; Walter, A.; Keller, T. Feedbacks between Soil Penetration Resistance, Root Architecture and Water Uptake Limit Water Accessibility and Crop Growth—A Vicious Circle. Sci. Total Environ. 2018, 626, 1026–1035. [Google Scholar] [CrossRef]
  87. Christensen, J.H.; Hewitson, B.; Busuioc, A.; Chen, A.; Gao, X.; Held, R.; Jones, R.; Kolli, R.K.; Kwon, W.K.; Laprise, R.; et al. Observations: Surface and Atmospheric Climate Change. In Climate Change 2007: The Physical Science Basis; Hoskins, B.J., Karl, T.R., Jallow, B., Eds.; Cambridge University Press: Cambridge, UK, 2007; pp. 235–336. ISBN 9780521880091. [Google Scholar]
  88. Olesen, J.E.; Trnka, M.; Kersebaum, K.C.; Skjelvåg, A.O.; Seguin, B.; Peltonen-Sainio, P.; Rossi, F.; Kozyra, J.; Micale, F. Impacts and Adaptation of European Crop Production Systems to Climate Change. Eur. J. Agron. 2011, 34, 96–112. [Google Scholar] [CrossRef]
  89. Porter, J.R.; Xie, L.; Challinor, A.J.; Cochrane, K.; Howden, S.M.; Iqbal, M.M.; Lobell, D.B.; Travasso, M.I. Food Security and Food Production Systems. In Climate Change 2014: Impacts, Adaptation, and Vulnerability. Part A: Global and Sectoral Aspects. Contribution of Working Group II to the Fifth Assessment Report of the Intergovernmental Panel on Climate Change; Cambridge University Press: Cambridge, UK, 2014; pp. 485–533. [Google Scholar]
  90. Tijink, F.G.J. Quantification of Vehicle Running Gear. In Soil Compaction in Crop Production; Soane, B.D., van Ouwerkerk, C., Eds.; Elsevier B.V.: Amsterdam, The Netherlands, 1994; Volume 11, pp. 391–415. ISBN 9780444882868. [Google Scholar]
  91. Ball, B.C. Pore Characteristics of Soils from Two Cultivation Experiments as Shown by Gas Diffusivities and Permeabilities and Air-Filled Porosities. J. Soil Sci. 1982, 32, 483–498. [Google Scholar] [CrossRef]
  92. Vandergeten, J.; Roisin, C. Ploegloze Teelttechnieken in de Suikerbietenteelt; IRBAB-KBIVB: Tienen, Belgium, 2004; Available online: https://www.irbab-kbivb.be/wp-content/uploads/2015/10/GidsTeelttechnieken.pdf (accessed on 10 May 2022).
  93. Casamitjana Causa, M.; D’Haene, K.; Usuga, J.C.L.; Gabriels, D.; De Neve, S. Influence of Tillage Systems on Soil Structural Properties. In No-Till Farming: Effects on Soil, Pros and Cons and Potential; Nardali, E.T., Ed.; Nova Science Publishers Inc.: Hauppauge, NY, USA, 2009; Chapter 1; pp. 1–26. ISBN 9781607414025. [Google Scholar]
  94. Van den Putte, A.; Govers, G.; Diels, J.; Langhans, C.; Clymans, W.; Vanuytrecht, E.; Merckx, R.; Raes, D. Soil Functioning and Conservation Tillage in the Belgian Loam Belt. Soil Tillage Res. 2012, 122, 1–11. [Google Scholar] [CrossRef]
  95. Jabro, J.D.; Stevens, W.B.; Iversen, W.M.; Evans, R.G. Tillage Depth Effects on Soil Physical Properties, Sugarbeet Yield, and Sugarbeet Quality. Commun. Soil Sci. Plant Anal. 2010, 41, 908–916. [Google Scholar] [CrossRef] [Green Version]
Figure 1. Experimental plan with a two-factor strip-plot design. The two tested tillage methods, ploughing or inversion tillage (PL) and non-inversion tillage (NIT) were whole plot (three per block-vertical) treatments. The slurry application methods, self-propelled slurry spreader, in crab steering (SP-C) and in standard steering (SP-S), and tractor-trailer combination, with inflation pressure that is recommended for road traffic (TT-H) and at a level recommended for field traffic (TT-L), each were repeated once per block (horizontal). The traffic of all slurry application methods was done wheel-to-wheel, with the intent of driving over the entire area of each plot. The control (C) plots remained un-trafficked. The blue arrow indicates the sequence of passages per treatment and the number inside corresponds with the number of passages needed to drive over the entire plot. The numbering on the left of the plan (1–81) shows each passage during sowing. These passages all had a width of 2.7 m. The B in a black square and the P in a green square indicate the location of, respectively, the collected soil samples and the measurement of penetration resistance.
Land 11 00913 g001
Figure 2. Conceptual drawings of the tested slurry application methods, showing the two steering modes of the self-propelled slurry spreader, i.e., standard steering, SP-S (a) and crab steering, SP-C (b) and the tractor-trailer combination with both high and low tyre inflation pressure, TT-H and TT-L, respectively (c). The red star locates the position where the undisturbed soil samples were taken, and the penetration resistance was measured. This position corresponds with the centre of the tyre track that was driven over by, at least, the rear axle.
Land 11 00913 g002
Figure 3. Average gravimetric water content during experimental traffic for non-inversion (dark blue) and inversion (light blue) plots ± standard deviation (n = 4) for three depth intervals (0–10, 10–30 and 30–60 cm). The given field capacity (−10 kPa-red) was determined for the non-inversion plots. The horizontal axis is scaled from 0 up to gravimetric water content at saturation (0.36 g g−1).
Land 11 00913 g003
Figure 4. Four root deformation classes from not to seriously deformed ((14), respectively). Classes 3 and 4 are here defined as seriously deformed.
Land 11 00913 g004
Figure 5. Precipitation (mm), maximum temperature (Tmax-°C) and minimum temperature (Tmin-°C) in Landen for the experimental period (January–December 2019) and the 1991–2020 average.
Land 11 00913 g005
Figure 6. Average penetration resistance (MPa) ± standard deviation (n = 165) between 0 and 80 cm depth after tillage (non-inversion: dark blue; inversion: light blue), but before experimental traffic. The red dashed line represents the threshold values for sugar beet root growth (1.75 MPa).
Land 11 00913 g006
Figure 7. Average penetration resistance (MPa) ± standard deviation for the untreated control (C) and the four experimental treatments (a) (n = 66) and for the tested tillage methods (b) (n = 165) between 0 and 80 cm depth, adjusted for rut depth. The red dashed line represents the threshold values for sugar beet root growth (1.75 MPa).
Land 11 00913 g007
Figure 8. Average penetration resistance (MPa) ± standard deviation of the untreated control (C) and the four experimental treatments (n = 33) for the tested tillage methods: non-inversion (a) and inversion (b), adjusted for rut depth. The red dashed line represents the threshold values for sugar beet root growth (1.75 MPa).
Land 11 00913 g008
Figure 9. Water retention curves for the control and the four experimental treatments at 5 cm (a), 20 cm (b) and 45 cm (c) depth (n = 3). The dashed lines indicate field capacity (pF = 2.0) and permanent wilting point (pF = 4.2). The vertical bars represent repeated-measures LSD (5%) values for the matric suctions at which the water content was determined: 1, 3, 5, 7, 10, 33, 100 and 1500 kPa.
Land 11 00913 g009
Table 1. Average soil texture and organic carbon content ± standard deviation and the resulting texture class (USDA) for the depth intervals 0–30 cm and 30–60 cm (n = 3). The organic carbon content of the upper subsoil (30–60 cm) was not determined.
Depth (cm)Sand
(g kg−1)
Silt
(g kg−1)
Clay
(g kg−1)
Organic Carbon Content 1
(g kg−1)
Texture Class
(USDA)
0–3099.0 ± 18.0688.7 ± 51.8212.3 ± 33.912.1 ± 1.7Silt loam
30–6082.2 ± 13.5618.8 ± 68.5299.0 ± 56.4-Silty clay loam
1 Detection limit organic carbon content: 3 g kg−1.
Table 2. Tyre properties and wheel load for each axle of the four slurry application methods. The numbering of the axles is given from front to rear.
Treatment Axle
1234
SP-CTyre typeMichelin Mega X BIB 1050/50R32 17A8/172D TLMichelin Mega X BIB 1050/50R32 17A8/172D TL--
Wheel load
(103 kg)
9.40510.375--
Tyre inflation pressure
(kPa)
220220--
SP-STyre typeMichelin Mega X BIB 1050/50R32 17A8/172D TLMichelin Mega X BIB 1050/50R32 17A8/172D TL--
Wheel load
(103 kg)
9.40510.375
Tyre inflation pressure
(kPa)
220220--
TractorTrailer
TT-HTyre typeCultor RD03 540/65 R30Cultor RD03 650/65 R42Alliance 750/45 R26.5 Flotation radialAlliance 750/45 R26.5 Flotation radial
Wheel load
(103 kg)
1.3304.4455.0805.845
Tyre inflation pressure
(kPa)
250250450450
TT-LTyre typeCultor RD03 540/65 R30Cultor RD03 650/65 R42Alliance 750/45 R26.5 Flotation radialAlliance 750/45 R26.5 Flotation radial
Wheel load
(103 kg)
1.3304.4455.0805.845
Tyre inflation pressure
(kPa)
6013090140
Table 3. Relevant threshold values for the investigated soil physical parameters.
ParameterThreshold ValuesReferences
Bulk density (g cm−3)Ideal: <1.30 g cm−3 (silt soil)
Restricting root growth: >1.60 g cm−3
Optimum for sugar beet yield: 1.51 g cm−3
[74,75]

[59]
Penetration resistance (MPa)Restricting root growth: >2 MPa
Optimum for sugar beet yield: 1.75 MPa
[67]
[59]
Air capacity (m3 m−3)Limiting value: 0.10 m3 m−3[71]
Plant available water capacity (m3 m−3)Ideal for root growth: ≥0.20
Limiting value: 0.10 m3 m−3
[71,76,77,78]
Relative field capacity (-)Optimal range: >0.60 & <0.70[79]
Air permeability (µm2)Limiting value: 20 µm2
Impermeable: <1 µm2
[80]
[81]
Table 4. Wheel load (kg), tyre contact area with the soil (cm2) and the resulting mean contact pressure (kg cm−2) for all axles of the four experimental treatments (n = 1). The numbering of the axles is given from front to rear, as shown in Table 2.
Axle
1234
Wheel Load
(kg)
Tyre Contact Area
(cm2)
Mean Contact Pressure
(kg cm−2)
Wheel Load
(kg)
Tyre Contact Area
(cm2)
Mean Contact Pressure
(kg cm−2)
Wheel Load
(kg)
Tyre Contact Area
(cm2)
Mean Contact Pressure
(kg cm−2)
Wheel Load
(kg)
Tyre Contact Area
(cm2)
Mean Contact Pressure
(kg cm−2)
Treatment
SP-C940572801.2910,37561601.68------
SP-S940572801.2910,37561601.68------
TT-H133020260.66444538761.15508025282.01584528142.08
TT-L133021410.62444543501.02508036971.37584536921.58
Table 5. Average rut depth (cm) ± standard deviation for the four experimental treatments (n = 6) and for the two tillage methods (inversion or ploughed and non-inversion) applied in this experiment (n = 9). The treatment SP-C was kept out of the statistical analysis since it was only measured twice and only in the non-inversion plots. Different letters indicate significant differences (p < 0.05) for the Tukey post-hoc test.
TreatmentRut Depth
(cm)
SP-C2.3 ± 1.6 -
SP-S6.4 ± 2.3 a
TT-H7.5 ± 3.0 b
TT-L5.8 ± 1.9 a
Tillage
Non-inversion4.5 ± 2.2 a
Inversion7.6 ± 2.6 b
Statistical analysisp-value
Treatment<0.01
Tillage<0.01
Treatment*Tillage<0.01
-: Not taken into account during statistical analysis.
Table 6. Average fresh beet yield (kg ha−1), sugar yield (kg ha−1) and proportion of (seriously) deformed sugar beet roots (%-Classes 3 and 4) ± standard deviation (n = 5) for the untreated control and the four experimental treatments and for the two tillage methods (inversion or ploughed and non-inversion) applied in this experiment. Different letters indicate significant differences (p < 0.05) for the Tukey post-hoc test, n.s. points out insignificant (p > 0.10) differences.
TreatmentFresh Beet Yield
(kg ha−1)
Sugar Yield
(kg ha−1)
Deformed Beets
(%)
C85,919 ± 2355 ab17,896 ± 669 b40 ± 8 ab
SP-C86,687 ± 2278 b18,048 ± 530 b36 ± 13 a
SP-S84,570 ± 3730 ab17,639 ± 775 ab43 ± 11 ab
TT-H83,056 ± 2398 a17,246 ± 431 a50 ± 7 b
TT-L84,818 ± 1133 ab17,843 ± 474 ab40 ± 10 ab
Tillage
Non-inversion85,111 ± 2529 n.s.17,733 ± 631 n.s.42 ± 8 n.s.
Inversion84,909 ± 2914 n.s.17,736 ± 636 n.s.41 ± 13 n.s.
Statistical analysisp-value
Treatment0.020.010.05
Tillage0.660.900.82
Treatment*Tillage0.090.090.30
n.s.: Not significant.
Table 7. Average bulk density (g cm−3) and air permeability (µm2) ± standard deviation (n = 3) at 5 cm, 20 cm and 45 cm depth. The letters underneath the results indicate the statistical grouping (p < 0.05) of the Tukey post-hoc test, n.s. points out insignificant differences.
Bulk Density (g cm−3)Air Permeability (µm2)
Depth (cm)5204552045
C1.50 ± 0.07 1.35 ± 0.151.52 ± 0.0522.96 ± 18.45109.58 ± 68.9229.42 ± 17.50
n.s.n.s.n.s.n.s.n.s.n.s.
SP-C1.58 ± 0.041.50 ± 0.071.55 ± 0.040.54 ± 0.7113.27 ± 4.929.58 ± 9.44
n.s.n.s.n.s.n.s.n.s.n.s.
SP-S1.56 ± 0.081.50 ± 0.091.56 ± 0.0447.99 ± 70.1976.21 ± 54.0433.83 ± 14.08
n.s.n.s.n.s.n.s.n.s.n.s.
TT-H1.62 ± 0.021.55 ± 0.051.56 ± 0.0120.94 ± 29.7311.04 ± 6.129.42 ± 6.68
n.s.n.s.n.s.n.s.n.s.n.s.
TT-L1.56 ± 0.041.42 ± 0.091.54 ± 0.0148.72 ± 61.3927.27 ± 21.6017.94 ± 14.13
n.s.n.s.n.s.n.s.n.s.n.s.
Statistical analysisp-values
Treatment0.180.150.140.650.050.49
n.s.: Not significant.
Table 8. Average air capacity (m3 m−3), plant available water capacity (m3 m−3) and relative field capacity (m3 m−3) ± standard deviation (n = 3) at 5 cm, 20 cm and 45 cm depth. The letters underneath the results indicate the statistical grouping (p < 0.05) of the Tukey post-hoc test, n.s. points out insignificant differences.
Air Capacity
(m3 m−3)
Plant Available Water Capacity (m3 m−3)Relative Field Capacity
(m3 m−3)
Depth (cm)520455204552045
C0.04 ± 0.050.17 ± 0.080.07 ± 0.030.23 ± 0.010.16 ± 0.030.16 ± 0.020.90 ± 0.110.66 ± 0.130.84 ± 0.08
n.s.n.s.n.s.n.s.n.s.n.s.n.s.n.s.n.s.
SP-C0.01 ± 0.010.05 ± 0.040.05 ± 0.010.24 ± 0.010.21 ± 0.020.17 ± 0.010.97 ± 0.010.88 ± 0.070.87 ± 0.02
n.s.n.s.n.s.n.s.n.s.n.s.n.s.n.s.n.s.
SP-S0.01 ± 0.010.08 ± 0.040.05 ± 0.030.23 ± 0.010.20 ± 0.030.17 ± 0.010.96 ± 0.020.83 ± 0.090.88 ± 0.07
n.s.n.s.n.s.n.s.n.s.n.s.n.s.n.s.n.s.
TT-H0.01 ± 0.010.05 ± 0.030.04 ± 0.010.22 ± 0.010.19 ± 0.020.17 ± 0.010.98 ± 0.010.88 ± 0.060.90 ± 0.03
n.s.n.s.n.s.n.s.n.s.n.s.n.s.n.s.n.s.
TT-L0.01 ± 0.010.08 ± 0.050.07 ± 0.010.23 ± 0.020.22 ± 0.020.16 ± 0.020.96 ± 0.010.82 ± 0.090.83 ± 0.01
n.s.n.s.n.s.n.s.n.s.n.s.n.s.n.s.n.s.
Statistical analysisp-values
Treatment0.340.070.470.140.080.950.400.060.41
n.s.: Not significant.
Publisher’s Note: MDPI stays neutral with regard to jurisdictional claims in published maps and institutional affiliations.

