Article

Study on the Evolution, Driving Factors, and Regional Comparison of Innovation Patterns in the Yangtze River Delta

1
Public Administration School, Hohai University, Nanjing 211100, China
2
Nanjing Institute of Geography and Limnology, Chinese Academy of Sciences, Nanjing 210008, China
*
Author to whom correspondence should be addressed.
Land 2022, 11(6), 876; https://doi.org/10.3390/land11060876
Submission received: 12 May 2022 / Revised: 3 June 2022 / Accepted: 7 June 2022 / Published: 9 June 2022
(This article belongs to the Special Issue Regional Sustainable Development of Yangtze River Delta, China)

Abstract

:
The differences in innovation, and the resulting inefficient allocation of innovation resources, are key factors affecting the high-quality development of urban agglomerations. In the context of China’s upgrading of the integrated development of the Yangtze River Delta (YRD) to a national strategy, the study of innovation patterns and driving factors in this highly developed urban agglomeration provide references and experiences for high-quality development and innovation improvements in other urban agglomerations. Using prefecture-level patent data from 2000 to 2018, this study analyses the evolution characteristics of the innovation patterns in the YRD, from the perspective of innovation level and innovation growth, based on the coefficient of variation, locational Gini coefficient, and the relative development rate index. Then, using the knowledge production function, this study quantitatively explores the driving factors for innovation from multiple perspectives. The main findings are as follows. The differences in urban innovation levels decrease with improvements in the innovation level of urban agglomerations. In terms of the evolution of the spatial pattern of innovation levels, the “core–periphery” and “south–north” differences are highly stable; however, the innovation levels of some peripherical cities improve. The growth of urban innovation levels show significant regional differences, with fast-growing cities clustered in the core area, and high-value areas characterized by proximity diffusion. Based on the innovation level in different periods, cities are divided into low–low, low–high, high–low, and high–high types. There are spatio–temporal differences in the driving factors for innovation. On the one hand, different periods show an intensification of factor inputs and external linkage effects, as well as the differentiation of urban development state effects. On the other hand, there are differences among different types of cities, with low–low cities mainly driven by factor inputs, urban development state, and internal opening-up; low–high and high–high cities are greatly influenced by factor inputs and urban development state. By expanding on existing studies, the present research provides a refined reference for the formulation of scientific policies aimed at promoting innovation development in China.

1. Introduction

Innovation is an important driver of regional development in the era of the knowledge economy, and improving the level of innovation has always been a core element of innovation geography research [1,2,3]. The endogenous growth theory, experiences of developed countries, and empirical studies show that with improvements in economic development, the “latecomer advantage” of under-developed economies is significantly weakened, and innovation becomes a new driver for economic growth and catch-up, with a weak innovation capacity likely causing social development to fall into a “middle-income trap” [1,4,5].
As the world’s largest developing country, China’s economic development has long been characterized by crude development, with high inputs and low outputs, resulting in a situation of weak industrial competitiveness [3]. In recent years, as China’s economy entered the stage of high-quality development, the long-term quantitative growth model is no longer suitable for the needs of economic development. The shift from factor-driven to innovation-driven development has become an inevitable path for the transformation of economic growth kinetic energy, and for overcoming the middle-income trap [3,6,7]. As the importance of innovation gradually emerged, a series of policies aimed at promoting urban innovation development were developed from central to local governments. Many empirical studies find that relevant policies play a positive role, but do not eliminate significant regional disparities in China’s innovation development [8,9]. However, the significant differences in, and irrational spatial organization of, innovation bring about problems, such as the inefficient allocation of innovation resources and the widening regional differences, severely restricting the development of regional innovation and the construction of a national innovation system in China [2,6,10]. Therefore, in the process of relying on innovation to achieve high-quality development in China, it is not only necessary to strengthen innovation investment, but more importantly, to narrow the regional innovation development gap, and then optimize resource allocation, improve innovation coordination, and achieve rapid development of regional innovation [4,11].
Currently, urban agglomerations are not only the regions with concentrations of innovation factors and important vehicles of national participation in global competition, but also the regions with the most frequent innovation interactions, and the most complex spatio–temporal pattern evolution and innovation systems in urban agglomerations that garnered extensive attention from scholars [12]. For China, urban agglomeration is an important vehicle for building an innovative country [7,13]. In the present research, taking the Yangtze River Delta (YRD), the most economically developed region in China with a high concentration of innovation resources, as a case study area, factors driving the innovation development in the YRD are explored, based on an analysis of the spatio–temporal evolution of innovation from the perspectives of innovation level and innovation growth, followed by a comparative spatial study based on the classification of realistic development conditions. Similar to existing research, this paper focuses on regional differences in innovation development in the YRD, and verifies the spatio–temporal heterogeneity of driving factors. Compared with related research, the possible innovations of this paper are as follows: on the one hand, accurate identification of the driving factors is an important foundation for promoting urban innovation development. The research on the driving factors based on the knowledge production function has a strong scientific character. On the other hand, based on the evolutionary characteristics of urban innovation development, the division method of urban types is proposed and as the basis for spatio–temporal evolution and driver identification. The relevant conclusions are more in line with the development reality of the YRD [9]. This study takes the YRD as an example to conduct a multi-faceted study, which not only enriches the existing research on the evolution of innovation patterns, but also provides a scientific reference for refining policy formulation.

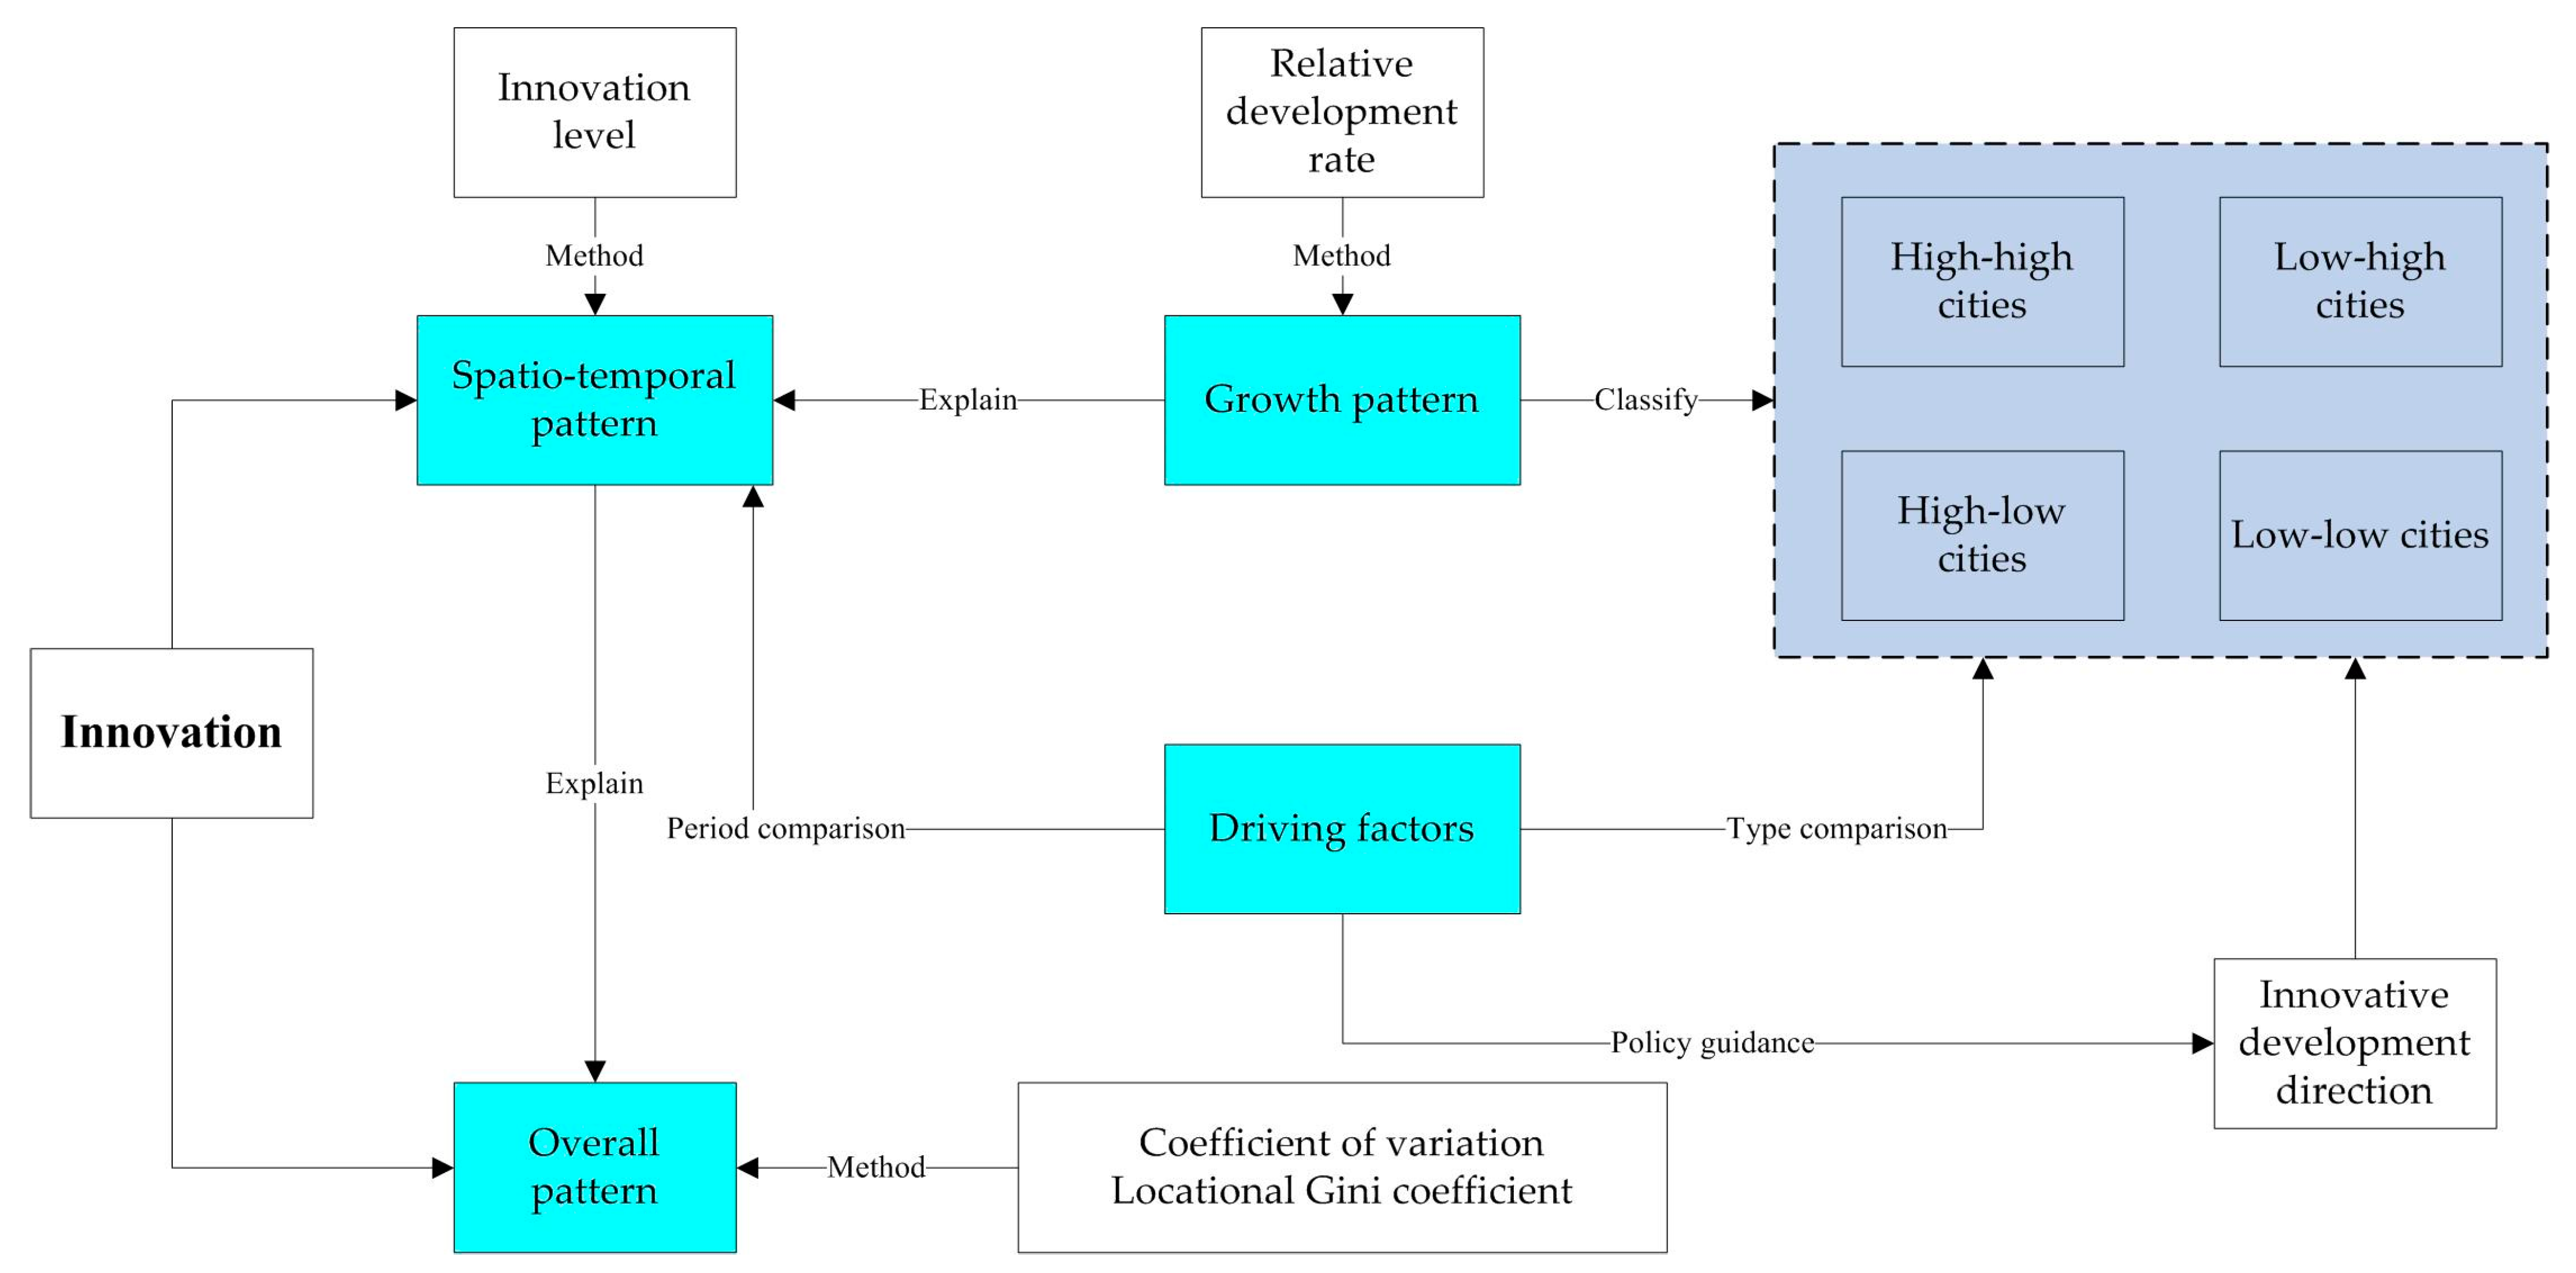
2. Literature and Research Framework

Under the background of the new round of global industrial revolution driven by innovation, it has become a social consensus to improve the level of urban innovation development. From the perspective of theory guiding practice, solving this problem requires answering two questions: (1) What is the regional innovation pattern and its evolution characteristic? (2) What are the driving factors for innovation development?
Since Schumpeter introduced innovation into the economic growth theory, scholars conducted in-depth discussions on the evolution patterns and driving factors based on relevant theories [1,14,15], finding that there is a strong spatial concentration of innovation, which promotes economic and social development by improving resource utilization efficiency and optimizing industrial structure, and factor inputs, industrial structure, and innovation environment, which are all important factors that influence innovation development [10,14,15,16]. With the introduction of frontier theories, and the improvement of statistical data, scholars conducted in-depth studies on the evolution patterns and driving factors in multiple regions and at different scales [8,13,17]. The evolution of spatio–temporal patterns from multiple perspectives verifies the regional differences in innovation development. Using single or composite innovation indicators [2,3,17] and based on methods such as location quotient, the Gini coefficient, the relative development rate, and kernel density [8,11,18], many studies reveal that innovations in different regions, and on different scales, in China exhibit spatial concentration and significant regional differences [2,17]. Based on social network analysis, spatial interaction models, and gravity models [13,17,19], many studies highlight that, with the transformation of the innovation network from a single centre to multiple centres, China’s innovation network strengthened, but the “core–periphery” difference in innovation linkages have not changed significantly [13,19]. Using data envelopment analysis and the Malmquist index model [9,20], many studies find that, from an “input–output” perspective, China’s innovation efficiency is generally low, and there are significant regional differences, such as a “T-shaped” pattern at the national level, and a stepwise decreasing trend from eastern, through central, to western China [9]. Considering the emergence of the importance of innovation to economic and social development, the coordination of innovation with financial development [5] and economic growth [21] is explored, revealing that there is also a significant regional difference in the level of coordination, and that highly coordinated regions are mostly economically developed [21]. In a study of driving factors, scholars use qualitative analysis [4], or quantitative methods such as multiple linear regression [22], panel cointegration [11], geographically weighted regression [8], and generalized method of moments estimation [20], to find that innovation development is driven by factors such as factor inputs, macro policies, opening-up, industrial structure, and infrastructure [2,8,18,22]. However, there are differences in the effects of different factors, as well as in driving factors on different scales (e.g., provinces and cities), and in different periods in the same region [6,22].
Studies show that innovation is a dynamic and complex evolutionary process. On the one hand, the “cumulative effect” of the concentration of innovation factors in developed regions, under the effect of increasing returns to scale, brings about a widening in regional differences. On the other hand, innovation factor spillover and the latecomer advantage drive the narrowing of the gap in regional innovation development. That is, in the game of the distribution mechanism of innovation elements, the innovation pattern exhibits complex evolution in both the spatial and temporal dimensions [9,17,22]. In fact, the exploration of the spatial and temporal differences in innovation patterns has always been a focus of relevant studies [8]. For example, the urban innovation patterns in China shifted from polarized growth to balanced development [17]; regional comparisons reveal that the single-core driver evolved to multicore resonance in Shanghai, which differs from Beijing, where the single-core driver dominates [23]; in terms of driving factors, cities in the lower reaches of the Yangtze River Economic Belt are driven by economic development and government behaviour, while cities in the middle reaches are influenced by technology spillover, spatial location, government behaviour, and financial support [18]. Many studies verify the spatio–temporal differences in innovation [6,8,12], but there is also room for further improvement. More attention has been paid to comparisons of innovation patterns in different regions and their driving factors, with studies involving spatio–temporal comparisons of driving factors within a single region relatively lacking. The regional classification in spatial comparisons is mainly based on spatial location and administrative division [9,18], and spatial classification is rarely carried out from the perspective of actual development. For example, scholars classify Chinese provinces into four categories, i.e., science and technology (S&T) innovation-leading region, S&T breakthrough region, S&T improvement region, and S&T catch-up region, based on the dimensions of input scale and innovation efficiency, but no comparative study has been conducted on different types of driving factors [9]. With the implementation of China’s innovation-driven strategy, the spatio–temporal pattern of innovation is characterized by a complex evolution. It is urgent to explore the evolution of regional innovation, and its driving factors, from spatio–temporal perspectives, the core focus of the present research, and an important supplement to existing research.
The spatio–temporal heterogeneity of regional innovation development is the consensus of current relevant research [4,5,10]. Facing this complex phenomenon, how to scientifically classify relevant cities is not only the basis for optimal policy formulation, but also the core issue discussed in this paper. To supplement this problem, this paper constructed the following analytical framework on the base of existing researches (Figure 1). First, the evolutionary trend of innovation patterns in the YRD was studied by combining the coefficient of variation and the locational Gini coefficient to verify the overall status of the innovation gap. Second, we conducted a comparative spatio–temporal study of the evolutionary patterns of urban innovation levels. On this basis, the relative development rate index was used to analyze the factors inherent of the pattern evolution characteristics. Thirdly, the classical knowledge production function was introduced into the study of drivers, and a comparative analysis of drivers in different periods was conducted. Finally, we conducted further discussions based on relevant research, including city classification and innovation development orientation based on relative development rate index, the identification and comparison of innovation development drivers in different types of cities, and how to better guide urban innovation development in the future.

3. Study Area, Methods and Data

3.1. Study Area

Since the reform and opening-up, urban agglomeration has increasingly become an important spatial form of urban organization in China, as well as an important vehicle for promoting regional integration development and narrowing regional development gaps. In particular, the YRD urban agglomeration (Figure 2), located on the eastern coast of China, as a typical natural plains region, gradually transformed from a physical geographical area to an economic region, and the multi-level and wide-ranging cooperation mechanism among cities increasingly improved under the impetus of multiple actors, such as government, academia, and enterprises. Since the 1990s, relying on an integrated cooperation system, the status of urban agglomerations was significantly enhanced by the gradual transformation of single to integrated development of cities, as well as by the expansion of the spatial scope of urban agglomerations. In recent years, the economic and social development of the YRD became a focus of scholars. Although the definitions of the scope of urban agglomerations differ among scholars [7,12], they all reflect the necessity of relying on urban agglomeration to promote regional development.
On 5 November 2018, at the opening ceremony of the First China International Import Expo held in Shanghai, China, the president of Chinese, Xi Jinping, mentioned in his keynote speech that China would support regional integration development of the YRD, and upgrade such developments to a national strategy, which enhances the urban agglomeration strategic position while further imposing higher requirements for the development. Subsequently, the Central Committee of the Communist Party of China and the State Council issued the outline for the Yangtze River Delta Regional Integration Development Plan, which specifies the scope of the YRD as the entire region of Shanghai, Jiangsu, Zhejiang, and Anhui; this document is also an important basis for selecting the scope of the present research. In general, the YRD, known as China’s “Golden Triangle”, is one of the regions with the most active economic development, the highest degree of opening-up, and the strongest innovation capacity in China, and has a pivotal strategic position in national modernization and all-round opening up. In 2018, the YRD had a GDP of approximately CNY 21.15 trillion, and a resident population of 225 million, accounting for 23.12% of the GDP and carrying 16.15% of the population, with a land area accounting for approximately 3.74% of China, showing a significantly high concentration of factors. In the future, with the emergence of the importance of innovation development, and the accelerated implementation of China’s urban agglomeration strategy, the YRD will play a vital leading role in the construction of China as an innovative country, and its “core–periphery” differences in regional innovation development are also highly representative.

3.2. Research Methods for Analyzing Spatio–Temporal Pattern of Innovation

The scientific measurement of innovation level is the key basis for subsequent research. Currently, single indicators and composite indicators are used in academia to measure innovation level [18]. The former include S&T research articles, the output value of new products, and patents [22,24], while the latter include factors such as knowledge, and innovation base for composite measurements [4]. Due to the differences in the determination of new products in different regions, and the limited S&T research articles [24], there are issues with regard to repeated calculations and difficulty in obtaining long time-series data for composite indicators. In comparison, patents are advantageous because they are generated using unified identification standards and provide good data availability [3], and, thus, have become a common indicator of innovation level in existing studies [7,12]. Under the patent “application-review” system in China, patents granted can better characterize the actual output of innovation than patent applications [7].
(1) Coefficient of variation (CV) and locational Gini coefficient (G). A variety of methods, such as the CV, the Gini coefficient, the entropy index, and the Herfindahl–Hirschman Index (HHI), are proposed in the study of spatial characteristics of regional innovation [18,24]. Referring to existing studies, the present research selects the CV and the locational Gini coefficient to measure the overall pattern of innovation development in the YRD. Specifically, the CV, also known as the standard deviation rate, or the coefficient of dispersion, is the ratio of the standard deviation to the mean. As a statistic to measure the degree of variation in observed values, the CV reflects the relative equilibrium of innovation development in urban agglomerations [14]. CV is calculated as follows:
C V = i = 1 n ( x i x ¯ ) 2 n / x ¯
where n is the number of study units, x i is the innovation status of city I, and x ¯ is the mean of the innovation status of the urban agglomeration. Overall, the smaller the CV, the more balanced the regional innovation pattern, and conversely, the larger the CV, the more significant the regional differences.
Unlike the CV, the locational Gini coefficient is more mathematically conceived, simple, and fast to calculate, and uses the most readily available data to measure the degree of innovation concentration in an urban agglomeration [18]. For this reason, the locational Gini coefficient (G) is adopted in the present research to measure the degree of innovation concentration in the geographical space, and it is calculated as follows:
G = 1 2 n 2 x ¯ i = 1 n j = 1 n | x i x j |
where n represents the number of study units, x ¯ represents the mean of the innovation status of the urban agglomeration, and x i and x j represent the innovation status of cities i and j, respectively. The larger the locational Gini coefficient, the stronger the regional innovation imbalance, and the higher the degree of geographical concentration of innovation.
(2) Relative development rate index (NICH). The NICH index intuitively characterizes the innovation development rate of a city relative to an urban agglomeration in a certain period of time [4,8]. It is calculated as follows:
N I C H = Y 2 i Y 1 i Y 2 Y 1
where Y1i and Y2i denote the innovation status of city i at the beginning and end of a certain period, respectively; and Y1 and Y2 represent the innovation status of the urban agglomeration at the beginning and the end of a certain period, respectively.

3.3. Research Methodology for Innovation Driving Factors

An accurate understanding of the driving factors of innovation development is an important basis for formulating scientific policies to guide the balanced implementation of factors, and improve the innovation level of urban agglomerations. Based on agglomeration theory, innovation systems theory, and evolutionary economic geography [2,23], scholars obtained a multitude of results using qualitative analysis and quantitative research [18,25]. The driving factors for innovation as a dynamic process of knowledge production have been studied from multiple perspectives, and diverse models proposed [3,22]. Among them, the knowledge production function (KPF), which is proposed on the basis of the economic growth model, is commonly used in innovation research [26,27]. Based on the KPF and drawing on existing studies [26], this research classifies the driving factors into three categories: factor inputs, development status, and external linkage. On this basis, the following econometric model is constructed:
Y = A X 1 α X 2 β X 3 γ ε
where Y is the urban innovation output; X1, X2, and X3 are factor input, urban development state, and external linkage factors, respectively; A is a constant; α , β , and γ are elasticity coefficients; and ε is the random error.
To further eliminate the effect of heteroscedasticity, the logarithm of both sides of Equation (4) is taken to obtain the following regression model:
ln Y = ln A + α ln X 1 + β ln X 2 + γ ln X 3 + ε
Based on the comprehensive consideration of the endogeneity and collinearity of variables, in conjunction with data availability, relevant indicators are selected and measured as follows:
(1)
Factor inputs. As a complex knowledge production process, factor inputs are the basis of innovation outputs, and mainly include human input and capital input [27,28]. The total number of employees in scientific research and technical services (unit: person) is used to reflect the status of urban talent input (Tal), and the scale of expenditure on S&T and education (unit: CNY 100 million) is used to reflect the intensity of urban innovation input (Fund);
(2)
Urban development state. Industry is the subject of urban innovation development, and the added value of secondary industry (unit: CNY 100 million) is used as an indicator for the urban industrial scale (Ind). The level of financial development effectively drives urban innovation development, by lowering the threshold of innovation, improving financing constraints, and increasing the local technology absorption capacity [13,29]. The financial institution loan balance of the city at the end of the year (unit: CNY 100 million) is used to characterize the financial development level of the city (Fin);
(3)
External linkage. Improving transportation facilitates the transformation of local innovation resources and the promotion of resource sharing between cities [7]. City passenger volume (unit: 10,000 person-times) is used to characterize urban traffic conditions (Tra). Market guidance, the competition effect, and the crowding-out effect brought by opening-up, and the higher technology spillover from foreign enterprises, talent competition, and global mergers and acquisitions, all have an impact on the innovation development of Chinese cities [4,27]. The total amount of foreign capital actually utilized (unit: CNY 100 million) is selected to characterize the level of urban openness (Ope).

3.4. Research Data

The study period of the present research is from 2000 to 2018. Considering that prefecture-level cities, which are an important support for the implementation of regional development strategies and national macroeconomic policies, play key roles in economic development, this study uses cities as the basic units for the study. However, it must be emphasized that the administrative divisions of the YRD underwent major adjustments during the study period. For example, Chaohu, a prefecture-level city in Anhui Province, was abolished in 2010, and one district and four counties originally under the jurisdiction of Chaohu were transferred to the cities of Hefei, Wuhu, and Ma’anshan, after which a series of administrative divisions in Anhui were adjusted. Therefore, to obtain robust research findings, it is necessary to select a suitable administrative division as the research benchmark. Considering data availability, the present research uses the administrative division in 2010 as the benchmark.
The relevant data in this study were obtained from provincial and municipal statistical yearbooks, as well as city statistical yearbooks and statistical bulletins from 2000 to 2019. The data were processed as follows: (1) data from cities involving zoning adjustments are estimated with county-level data; (2) economic data are based on the year 2000, and adjusted with relevant price indices; and (3) some missing or adjusted data are estimated, based on the average growth rate for previous years.

4. Results

4.1. Overall Trend of Innovation Level Evolution

The innovation level of the YRD is calculated based on granted patent data, and the evolution characteristics of the innovation pattern are analyzed using Equations (1) and (2) (Figure 3). From 2000 to 2018, the number of granted patents increases from 19,500 to 763,800, and the number of patents granted per 10,000 people increases from 0.99 to 33.89, indicating significant improvement in the innovation level. Both the CV and G, based on the number of patents granted per 10,000 people, show significant decreasing trends; in particular, there is a rapid increase in the number of patents in Jiangsu, Zhejiang, and Anhui, driven by the active innovation of enterprises and improvements in innovation platforms in recent years, which is an important force in promoting the transformation of innovation patterns [27]. The comparison reveals that there are differences in the spatial evolution among different periods. Specifically, between 2000 and 2008, the urban innovation level steadily increases, and the spatial difference fluctuates down, showing a significant trend of running at a high level. Since 2009, the innovation level fluctuates up, and the regional difference steadily decreases, with a relatively small overall difference and fluctuation range. In particular, since 2014, the fluctuating growth in innovation level and the stability of regional differences obviously coexist. In general, in the context of the transformation development environments, as well as the acceleration of industrial transformation and transfer, the innovation level in the YRD significantly improves, along with the complex distribution of innovation resources [30], but the imbalance in innovation level significantly weakens.

4.2. Evolution Characteristics of the Spatial Pattern of Innovation

Since the beginning of the 21st century, national strategic support, enhanced innovation input, and an optimized industrial structure brought about a rapid rise in innovation development; however, this cannot conceal significant regional differences. To eliminate the influence of city size, the number of patents granted per 10,000 people is used as an indicator to characterize the level of urban innovation. Based on the threshold values of 1.75, 1.25, 0.75, and 0.25 times the innovation level of urban agglomeration [22,24], the cities are classified into five categories: high, medium high, medium, medium low, and low. The spatio–temporal pattern evolution of innovation in different periods (2015, 2008, and 2018) is compared (Figure 4).
In the follow-up research, we will see many comparative studies using 2008 as a cut-off point. Therefore, it is necessary to explain the considerations that led us to make this choice. For China, urban development is not only regulated by national macro policies, but is also closely related to the global development environment. For example, many studies identify the opening-up to the outside world as an important driver of economic growth and innovative development in Chinese cities [3,18]. On the one hand, the impact of the global financial crisis in 2008 made more and more cities recognize the importance of innovation development as an endogenous driving force for regional economic growth. On the other hand, the “Guiding Opinions on Further Promoting Reform and Opening Up and Socioeconomic Development in the Yangtze River Delta Region”, promulgated by the State Council in 2008, indicate that regional development entered the national macro strategy, which promotes the integration development process of urban agglomerations. The empirical research used in this paper also finds that the regional innovation development pattern changes under the impetus of macro policies and the impact of the global financial crisis since 2008 (Figure 3). Therefore, the comparative study with 2008 as the cut-off point has a certain practical feasibility. The results are as follows:
(1)
In 2000, there are 8 high-level cities and 20 low-level cities, with the former (except Wenzhou) distributed in the core area and concentrated around the Shanghai–Nanjing–Hangzhou–Ningbo axis, and the latter (except Huzhou) located in the peripheral area and clustered in Anhui and northern Jiangsu;
(2)
In 2008, there are 5 high-level cities and 17 low-level cities. From 2000 to 2008, the former are concentrated around the Shanghai–Nanjing axis to the Shanghai–Hangzhou–Ningbo axis, and the latter are still clustered in Anhui and northern Jiangsu. From 2000 to 2008, the spatial evolution decreases in Nanjing, Changzhou, Wuxi, Wenzhou, and Hefei; and increases in Zhenjiang, Yangzhou, Nantong, Shaoxing, Jiaxing, Huzhou, Quzhou, and Lishui, with the former clustered in southern Jiangsu, and the latter dominated by cities in Zhejiang. This is the direct reason for the shift in the regional innovation axis from “Shanghai–Nanjing–Hangzhou–Ningbo” to “Shanghai–Hangzhou–Ningbo”.
(3)
In 2018, there are two high-level cities and nine low-level cities, with the former being Huzhou and Shaoxing, and the latter still distributed within Anhui; the decrease in the number of high-level and low-level cities, and the narrowing of the extreme differences in innovation levels, both confirm the narrowing of regional differences in innovation. From 2008 to 2018, the spatial evolution decreases in Shanghai, Suzhou, Hangzhou, Jinhua, and Ningbo, and increases in 19 cities including Nanjing, Suqian, Lianyungang, Hefei, and Huainan, but the spatial distribution differs significantly from that of 2000–2008, with the former dominated by cities along the Shanghai–Hangzhou–Ningbo axis, and the latter clustered around peripheral cities in Jiangsu and Anhui. This shift also explains the narrowing of the regional differences in innovation.
Overall, the spatio–temporal evolution of urban innovation level in the YRD is characterized as follows: (1) although the innovation level of some neighboring cities increases, “the core–edge” difference is still significant under the constraint of spatial dependence, i.e., there is spatial concentration and stability in the innovation pattern of urban agglomerations. (2) The north–south divergence in innovation levels is not only manifested within the scope of urban agglomerations, but also clearly exists in the core areas and some provinces, such as southern and northern Jiangsu, which indicates the diversity and complexity of innovation patterns in the YRD. (3) The innovation diffusion in high-value areas is characterized by distance proximity, and the “Z-shaped” belt along the Shanghai–Nanjing–Hangzhou–Ningbo axis is an innovation-active area in the YRD, and the center of diffusion to cities with high and medium-high innovation levels.

4.3. Evolution Characteristics of the Spatial Pattern of Innovative Growth

The differential growth of urban innovation levels under the combined effect of internal and external factors is a direct factor in the evolution of the spatial pattern of innovation in urban agglomerations [22]. Using the number of patents granted per 10,000 people as an indicator for the urban innovation level, the evolution of the spatial pattern of innovation growth in urban agglomerations is characterized (Figure 5) by calculating the NICH index (Equation (3)), and then classifying cities into four categories [24]. In the 2000–2018 period, there are regional differences and spatial steady-state characteristics of the NICH index results, for example, “core–periphery” differences and north–south differences, caused by generally high values in Zhejiang. Comparisons of the different periods reveal the following:
(1)
From 2000 to 2008, there are 22 low-growth cities, concentrated in Anhui and northern Jiangsu, and only 8 high-growth cities, which include Shanghai, Zhenjiang, Hangzhou, Ningbo, and Huzhou. The high-growth cities are also cities with high innovation levels, reflecting the “Matthew effect” of innovative development, a finding that is also confirmed by the high fluctuations in the CV and the G;
(2)
In 2008–2018, while high-growth cities are concentrated in the core area, there are also cities in the peripheral area (for example, Hefei and Wuhu), and the low-growth cities are still clustered around the periphery. Compared to those in the 2000–2008 period, the growth rates for cities such as Nanjing, Wuxi, Hefei, Ma’anshan, and Wuhu increase substantially, and the growth rates for Shanghai, Ningbo, Shaoxing, and Jinhua decrease significantly, becoming a direct factor in driving the diffusion of innovation from core high-value areas to peripheral areas, and narrowing the regional differences.
From 2000 to 2018, high-growth and low-growth cities are clustered in the core and peripheral areas, respectively, with a stable “core–edge” difference in innovation growth, indicating that innovation resources are consistently concentrated in developed cities [11], becoming an important factor in the stability of innovation levels and innovation growth patterns. In particular, the innovation level and the NICH index are generally higher in Zhejiang cities, due to the more active private economy, and the more developed modern financial sector. For example, the establishment and improvement of innovation platforms, represented by the online technology market since 2002, fostered entrepreneurship and promoted the rapid development of innovation [27]. In addition, the spatial concentration of high-value areas (innovation and the NICH index) confirms the spatial concentration of innovation development.

4.4. Identification of Driving Factors for Innovation Development

Based on Equation (5), the driving factors for innovation development in the YRD are discussed from the perspective of the scale of innovation output. The correlation test [30] results indicate that the variance inflation factor (VIF) is 5.66, i.e., there is no multicollinearity between the variables, and the Hausman test results indicate that the fixed effects (FE) model should be selected. The regression results (Table 1) show that the increase in factor inputs, improvements in the urban development state, and the enhancement of external linkages all promote innovation development. Based on the evolutionary characteristics of the innovation patterns of urban agglomerations, and taking into account the comparability of different time periods and the balance of samples, the driving factors for innovation development in the 2000–2008 and 2009–2018 periods are comparatively studied. In general, the effect of driving factors varies among different periods under the development orientation and factors competition, indicating that policies for promoting innovation development should be formulated to “keep up with the times”, as follows:
(1)
Factor inputs. Through qualitative and quantitative evolution, innovation factor inputs have differentiated effects in different periods, and show a shift from a non-significant positive effect to a significant positive effect. The non-significant factor input-driven effect from 2000 to 2008 is related to the low efficiency of factors in the low-level innovation stage. In the economic growth process under GDP competition, innovation is not the focus of development in all cities, and innovation resources are concentrated in a few cities, such as Shanghai, Nanjing, and Hangzhou. Due to institutional mechanisms and the market environment, factor input growth exhibits a “Solow paradox” because of low human labor skills and a non-optimized infrastructure, explaining the non-significant correlation [27]. From 2009 to 2018, as the global development environment changes and the comparative advantages of urban agglomeration elements change, more and more cities realize the importance of innovation. Improvements in talent and increases in capital input in the process of urban development increasingly become the core drivers of innovation development, by enriching the knowledge pool, mobilizing high-end innovative talents, and optimizing innovation policies. However, under the “Matthew effect” mechanism of factor distribution, the concentration of innovative talent in the core area, and strong capital input in developed cities, become important factors for the stability of the “core–periphery” differences in innovation development;
(2)
Urban development state. In the process of economic and social development, the degree of coupling between the level of urban development and the demand for innovation is an important factor affecting innovation efficiency [5,21]. The development of the manufacturing industry, as an important innovation subject, promotes improvements in urban innovation, with the enhancement of innovation capacity and competitiveness brought by industrial transformation and upgrading. Export-oriented low-end development of industry during rapid economic growth in the 2000–2008 period is an important reason for the relative weakness of this effect. From 2009 to 2018, the innovation level of enterprises increases significantly and promotes the development of urban innovation under market demand, government guidance, and urban development enhancement. Financial development can reduce the risk and cost of innovation for enterprises, and promote urban innovation development. However, as the quality of innovation improves, the financial development of traditional businesses cannot meet the demand of higher-end innovation (e.g., original innovation); the high cost and capital redundancy of traditional finance in China may be one of the factors leading to the negative effect from 2009 to 2018 [20,29]. In addition, the strengthening of inter-city financial ties and cross-regional venture capital through deepening integration are among the important driving factors for this shift and regional innovation differences [20]. In the future, improving the level of industrial development, and vigorously developing modern finance, will become important measures to promote the development of urban innovation;
(3)
External linkage. The spillover effect and the Matthew effect are important driving mechanisms for the evolution of innovation patterns in urban agglomerations, with the former manifesting as innovation synergy through the sharing of innovation resources and gradient transfer of factors, and the latter emphasizing that the spatial concentration and path dependence of innovation factors further concentrate innovation resources and widen the innovation level gap. Urban innovation is driven by factor distribution, knowledge diffusion, and city competition and cooperation within urban agglomerations, but urban innovation resources also faces the risk of “siphoning” [13,17]. The traffic effect changes from a negative effect to a significant positive effect, indicating a strong “Matthew effect” of innovation factors in the 2000–2008 period, i.e., improvements in the transportation accessibility of the most under-developed cities is accompanied by the siphoning off of innovation factors. From 2009 to 2018, with improvements in high-level transportation networks, such as high-speed rail, and changes in regional macroeconomic policies, the strengthening of inter-city cooperation brings about a significant increase in the exchange of innovative talents and the spillover effect of innovation, for example, the frequent flow of innovative talent among cities, entrepreneurship, and job-hopping, which enhances the efficiency of resources, and promotes the collaborative development of innovation in regional interaction and exchange [28]. The advanced management and cutting-edge innovations brought by multinational corporations are important drivers of imitative innovation by local firms; however, foreign investors also inhibit the innovation of local firms, through resource competition and mergers, to maintain their global competitive advantage [4,22,27]. This effect is significantly negative in the 2000–2008 period, indicating that factor competition, and the innovation inhibition effect, in the process of foreign capital concentration, are more significant, and that the weak learning and absorptive capacity, due to the low-level of urban innovation, is an important factor. The significant positive effect in the 2009–2018 period is driven by improvements in urban innovation, the deepening of regional opening patterns, and the increase in innovation capacity brought by high-end foreign investment. In recent years, the deepening of China’s internal and external opening-up, as well as the increasing degree of integration of cities into the global production network, are important driving factors for innovation development in under-developed cities.

5. Discussion

5.1. City Classification Based on the Evolution of Innovation Growth

Under the combined effect of internal and external factors, the change in the innovation pattern in the YRD from 2000 to 2018 do not significantly change the “core–periphery” differences in innovation development. The core area, especially the cities along the G60 (an innovation collaboration region initiated by Shanghai that passes through the cities of Shanghai, Jiaxing, Hangzhou, Jinhua, Suzhou, Huzhou, Xuancheng, Wuhu, and Hefei), dominate innovation growth among urban agglomerations, and the spatio–temporal evolution shows an acceleration of the relative growth of some cities in southern and central Jiangsu. The uneven innovation level among urban agglomerations is an important manifestation and key driver of urban development differences, and balancing innovation patterns become a key measure to achieve high-quality development. Additionally, the complex evolutionary patterns of urban innovation also require differentiated policy formulation. In this regard, this section divides the cities into four categories, based on the NICH index (Figure 6), and proposes the main directions of innovation development for each category of cities, from the perspective of regional coordination.
(1)
High–high cities. Cities of this type have a NICH index greater than 1.00 in both periods and, thus, significantly high urban innovation growth capacity; this group includes eight core-area cities (e.g., Hangzhou, Ningbo, Suzhou, and Zhenjiang) and one non-core area city (Jinhua), which are mainly in Zhejiang. However, with innovation transformation and industrial migration, the NICH index declines for most cities. A developed economy, superior infrastructure, and a concentration of innovative resources are important drivers for rapid innovation development, but the quality of such innovation requires further improvement (e.g., the proportion of invention patents granted in Zhejiang is only 11.44% in 2018, significantly lower than that in Shanghai (23.07%)). In the future, transformation to higher-quality innovation, improvements in the level of industries, both independent and controllable, and the realization of more competitive innovation development will become important directions for promoting high-quality economic development;
(2)
High–low cities. Cities of this type have a NICH index greater than 1.00 in the 2000–2008 period, and less than 1.00 in the 2008–2018 period; this group includes Shanghai and Nantong, with the NICH index of the former decreasing significantly, and that of the latter remaining stable. The innovation in Shanghai is characterized by “high input and slow output”. The transformation from practical innovation to original innovation, coupled with an increase in factor costs and the acceleration of industrial transfer leading to the out-migration of some industries, becomes an important factor for the significant decline in the NICH index [27]. The development of urban innovation is comprehensively influenced by factor inputs and inter-city interactions. The significant “siphoning effect” of cities such as Shanghai on innovation resources is a key factor for the decline in the NICH index in Nantong. For these cities, an important future direction is to explore the path of industrial transformation and high-quality innovation based on their own foundations, and by participating in urban agglomeration innovation integration, so as to provide a reference for other cities in the process of innovation development and industrial transformation;
(3)
Low–high cities. Cities of this type have a NICH index less than 1.00 in the 2000–2008 period, and greater than 1.00 in the 2008–2018 period; this group includes five core-area cities (e.g., Nanjing, Taizhou, and Yangzhou) and four peripheral area cities (e.g., Hefei and Lishui). In terms of time comparisons, driven by the increase in endogenous power, the modernization of southern Jiangsu and the government-led innovation inputs in Hefei accelerate, and, therefore, the NICH index of the cities in Jiangsu and Hefei increases significantly; the other cities rely on their location and cost advantages and, through industrial transfer and innovation spillover from developed cities, achieve innovation growth, but their NICH index values increase relatively little. In the process of integration, for these cities, urban innovation development should include taking advantage of their superior location and policies to utilize innovation factors and lead innovation networks to achieve innovation improvements and structural optimization, while driving the innovation development of surrounding areas;
(4)
Low–low cities. Cities of this type have a NICH index of less than 1.00 in both periods, and, thus, have weak urban innovation growth; this group includes 21 peripheral area cities (e.g., Anqing, Huai’an, and Quzhou) and 1 core area city (Zhoushan). An important reason for the relatively slow innovation growth is the strong concentration of innovation factors in the YRD, influenced by the low level of development, and the strong “siphoning effect” of innovation factors in developed cities. Sustained low-level innovation is not conducive to urban economic growth or the narrowing of the development gap in urban agglomerations. In the future, these cities should optimize their innovation environment, take advantage of the innovation spillover effect of developed cities in the core area, actively promote industries that meet their needs, and strengthen the level of coordinated innovation with developed cities to achieve high-quality development.

5.2. Comparative Study on the Driving Factors for Different Types of Cities

There are significant differences in the innovation development and evolution of different cities in the YRD, a finding that poses higher requirements for the future formulation of policies aimed at improving the innovation development of urban agglomerations, especially highlighting the urgent relevance of guiding urban innovation development “based on local conditions”. The “precise implementation of policies” that drives innovation development in urban agglomerations requires the identification of the driving factors for innovation development in different types of cities. Based on the city classification results in Section 4.1, a comparative study of the driving factors for innovation development in low–low, low–high, and high–high cities was conducted, based on the sample size and the corresponding robustness of the results (Table 2). The Hausman test results indicate that the FE model is the most appropriate, and that there are differences in the driving factors for innovation development in different types of cities, as follows:
(1)
Factor inputs show positive effects in different regions, but there is also regional heterogeneity. The more developed a city is, the more significant the importance of innovation in economic growth is, and the higher the skill requirements for innovative talents. The strong innovation capacity and weak driving effect in high–high cities indicate that in urban innovation development, the marginal effect of increasing the quantity of innovative talent decreases, while improving the quality of talent becomes an important measure to accelerate urban innovation development. Capital input promotes urban innovation development. However, low–low cities with a low innovation level still have incomplete innovation facilities, and have the highest capital efficiency in the rapid development of innovation. For low–high and high–high cities with relatively small differences in innovation levels and capital input intensity, the difference in the capital input effect is related to market, government powers, and differences in industrial structures. Specifically, low–high cities with obvious government drive require higher government investment and input in innovation facilities, and the marginal effect of capital input slows during the stage involving the enhancement of human capital and gradual improvements in innovation facilities. High–high cities, mainly in Zhejiang, are dominated by small and medium-sized enterprises, and low–high cities are dominated by large manufacturing industries; the difference in innovation subjects and the gap between government–enterprise collaboration are the factors that bring about short-term differences in the effects;
(2)
Improvements in urban development promote the innovation development of all cities, but the higher the innovation level, the stronger the effect. From the perspective of industrial structure, the higher the urban innovation level, the more significant the effect, indicating that, with improvements in urban development and the transformation of the industrial structure, the innovation level of industrial enterprises also significantly improves. Developed and complete financing provides sufficient financial support for innovation, and improvements in financial development are conducive to improving financing constraints, further boosting the efficiency of financial capital in innovation development, and providing strong support for optimizing urban innovation environments [5]. A regional comparison reveals that the coordinated development of a better innovation foundation and high-end service industries in low–high and high–high cities has a more significant driving effect on urban innovation development. In general, the development of the manufacturing industry promotes urban innovation through scale growth and structural optimization, and the development of service industries (e.g., finance) drives innovation development by improving the innovation environment and providing convenient services [29], further improving the quality of industrial development and promoting service industries (especially finance), and becoming an important driver for the promotion of urban innovation development;
(3)
Compared with factor inputs and the development environment, the external linkage differences brought about by location and the gradual opening-up policy have significantly different influences on different types of cities. The enhancement of transportation accessibility has both positive and negative effects on urban innovation development, by influencing the distribution of innovation factors. Specifically, with the coordinated development of innovation and the cross-regional transfer of industries, the deepening of integration provides conditions for under-developed cities in peripheral areas to participate in industrial transfer, and take advantage of innovation spillover from developed cities. For high–high cities, the change in comparative advantage brought by economic development, especially the increase in the costs of labor and land, is also accompanied by the spillover of some labor-intensive industries. For example, the coordinated construction of the G60 corridor, and the accelerated transfer of labor-intensive industries from Zhejiang to Anhui in recent years, are among the important factors for the significant negative effect. Participation in global competition also has a complex effect on the urban innovation [4]. For low–low cities, the low-quality of foreign investment, and the significant gaps in urban innovation levels, are important reasons for the significant negative effect. For low–high and high–high cities, the narrowing of the technological gap with foreign countries brought by the enhancement of urban innovation, the decrease in innovation effect relanced on external channels, the competition for high-end innovation resources, and the innovation “crowding-out effect” of foreign capital [8,27], as well as the transnational industrial transfer in high-level opening-up, all have impacts on urban innovation development; the non-significant negative effect suggests that independent innovation should become an important guide for urban innovation development in the future.

5.3. Better Formulation of Policies to Support Integrated Innovation Development

Innovation is a key driver of high-quality urban development. However, in the context of China’s macro-strategic adjustment and accelerated industrial transfer in recent years, the transformation of regional economic development patterns has not led to a simultaneous evolution of innovation patterns [30], indicating that there is still a long way to go with regard to promoting a rational layout of innovation resources in urban agglomerations and guiding coordinated innovation development. Promoting coordinated urban innovation is an important element in the implementation of China’s innovation development strategy. Although the innovation space cannot be evenly distributed [8], the significant innovation gradient among urban agglomerations indicates that innovation chain-based vertical collaboration, and division of labor between cities, should be strengthened, based on the foundation of urban development, for example, promoting the transfer and transformation of related industries and innovation achievements from developed cities to surrounding areas, and improving innovation efficiency through cooperation, which are important directions for the development of high-quality innovation in urban agglomerations.
From the perspective of the driving factors for innovation development, with improvements in urban development, and changes in internal and external development environments, the driving factors in different periods manifest as the intensification of factor inputs and external linkage effects, as well as the differentiation of the effect of urban development. In the accelerated transformation of the macro strategy of urban agglomeration from “polarized development” to “coordinated development”, the development level and business environment of under-developed cities significantly improve. However, under the influence of boundary barriers, location conditions, and policy bias, the distribution of innovation resources in the YRD still exhibit a strong “Matthew effect”, leading to the stabilization of “core–periphery” differences in innovation. In the process of collaborative innovation, it is necessary not only to optimize the quality and quantity of the input factors for urban innovation, but also to formulate scientific policies to guide innovation cooperation based on industrial chains, for example, building integrated transportation facilities, lowering barriers to the cross-regional flow of resources, deepening high-level opening-up and coordination, and co-establishing a modern financial support system to promote the coordinated development and competitiveness of urban agglomerations, through a reasonable and orderly environment and support system for innovation factors. However, changes in the driving factors for innovation indicate that relevant policies should be formulated to “keep up with the times”.
With the transformation of regional development patterns, the deepening of integration, and the evolution of factor competition, there are certain differences in the effects of relevant driving factors in different regions, indicating that, in the process of guiding urban innovation development in the future, differentiated means should be adopted at different development stages and in different regions to promote higher-quality innovation development in urban agglomerations through “precise policy implementation”. For high-level central cities, while further improving the quality of innovation, they should enhance the spillover effect of innovation in internal opening-up, and shift from “attracting investments” to “selecting investments” in external opening-up, in order to cultivate local independent innovation capacity and build a highly competitive innovation-led zone. For other developed cities, they should make full use of their own manufacturing development base, take advantage of their good locations, further strengthen joint innovation efforts with cities such as Shanghai and Hangzhou, build cross-border external channels to promote innovation interactions with other cities, concentrate high-end foreign investment, and strive to achieve new advantages in the transformation of S&T achievements and innovation in key fields. For under-developed cities, based on their own comparative advantages in resources and natural environments, they should accelerate their innovation development and catch-up strategies, optimize their own development environment, construct high-level drivers for internal and external opening-up, and build a reasonable path to regional innovation network integration, so as to enhance the efficiency of innovation with more a precise policy implementation.

5.4. Research Limitations

Limited by data availability, there is still room for further improvement of this research. First, there are three types of patents (i.e., invention, utility model, and appearance design), and there are significant differences in the technical level and economic and social benefits of different patents. However, the present study does not differentiate between the three types of patents for in-depth comparisons. As a complex “input–output” system, urban innovation development is the result of the combined effect of multiple factors, including measurable factor inputs, as well as non-measurable policies and spatial linkages. Although this research constructs an econometric model based on the KPF, the selection and measurement of the driving factors need to be optimized. As an example, the differentiated innovation support policies in different cities, and the level of cross-city innovation linkages, are not adequately considered. These equally important issues require in-depth consideration and study in the future.

6. Conclusions

As the largest developing country in the world, innovation is a core driver of China’s high-quality development. In the context of China’s accelerated construction of the “19 + 2” urban agglomeration development pattern, and the upgrading of the regional integration development of the YRD as a national strategy, the present research uses the CV, Gini coefficient, and NICH to explore the evolution of innovation spatio–temporal patterns in the YRD from 2000 to 2018, and to carry out a multi-faceted and quantitative investigation of driving factors for innovation development. The main findings are as follows. Since the beginning of the 21st century, the innovation level in the YRD significantly improves, accompanied by the weakening of innovation differences among cities. However, the larger CV and Gini coefficient indicate that the gap in innovation level between cities is still large, which is a key factor limiting balanced development. Therefore, stimulating the innovation development of cities, especially under-developed cities, is one of the important directions to promote coordinated regional development in the future. From the perspective of urban agglomeration comparison, whether the relevant features are universal is worthy of further in-depth study.
Unbalanced development is one of the important features of China’s economic growth. Differences in location, resource endowment, and macro policies of different cities brought about significant gaps in innovation levels. The analysis of spatio–temporal pattern evolution reveals that although the innovation level of some peripherical cities improves, the innovation pattern of urban agglomeration shows stable “core–periphery” and “south–north” differences, with a “Z”-shaped belt space with cities such as Shanghai, Nanjing, Hangzhou, and Ningbo as nodes, and always being the active innovation axis of urban agglomeration. The analysis of the pattern of innovation growth based on the NICH finds that fast-growing cities are clustered in the core area, and that the increase in high-growth cities is characterized by proximity diffusion. Both spatial and temporal comparisons show that the innovation development gap in the YRD is large, and this situation is highly stable. In this regard, it is necessary to give full play to the government’s macro-control role to narrow the innovation development gap. However, in this process, relevant policies should be formulated to “keep up with the times” and “adapt to local conditions”. In the follow-up research, it is of great practical significance to deeply explore the formation mechanism of the development gap steady-state.
Scientific identification of drivers is an important foundation to better promote innovation development and narrow the innovation development gap. Based on the empirical study of knowledge production function, this paper finds that factor inputs, urban development state, and external linkages are all important driving factors for urban innovation development in the YRD. However, with improvements in the urban development level, and the changes in internal and external development environments, the driving factors in different periods manifest as the intensification of factor inputs and external linkage effects, as well as the differentiation of urban development state effects. This shows that in factor-driven innovation development, cities should not only increase the input of innovation factors, but also work on the quality of factors and innovation environment, such as strengthening innovation connection with developed cities in urban agglomerations. Based on the NICH in different periods, the cities are divided into low–low, low–high, high–low, and high–high types, and this is our possible theoretical contribution to the classification method of urban innovative development types. The results of the quantitative study reveal that there are differences in the driving factors for innovation in different types. For example, the innovation in low–low cities is mainly driven by factor inputs, urban development state, and internal opening-up, and innovation in low–high and high–high cities is largely influenced by factor inputs and urban development state. The differences in the evolutionary characteristics and driving factors of innovation development indicate that cities should actively explore innovation paths suitable for their own development, and fully consider their reasonable positioning in the innovation pattern of urban agglomerations. For example, developed cities should enhance the driving effect through industrial transfer, and under-developed cities should optimize the development environment, improve the factor concentration level, and enhance endogenous growth momentum. In general, the efficiency of urban innovation development, and the quality of innovation, can be maximized through the multi-faceted synergy within and among cities. Further directions for investigation, based on more detailed data, such as the effect evaluation of government policies and the comparative research on the driving factors on a finer scale, are of great significance to better promote the innovative development of urban agglomerations.

Author Contributions

Conceptualization, data curation, and analysis, D.Y.; writing—original draft preparation, W.S. and D.Y. All authors have read and agreed to the published version of the manuscript.

Funding

This study was funded by the National Natural Science Foundation of China (Grant Nos. 42101183, 41871119, and 41871209) and the Strategic Priority Research Program of the Chinese Academy of Sciences (grant No. XDA23020102).

Institutional Review Board Statement

Not applicable.

Informed Consent Statement

Not applicable.

Data Availability Statement

The data presented in this study are available on request from the corresponding author.

Conflicts of Interest

The authors declare no conflict of interest.

References

  1. Tödtling, F.; Asheim, B.; Boschma, R. Knowledge sourcing, innovation and constructing advantage in regions of Europe. Eur. Urban Reg. Stud. 2013, 20, 161–169. [Google Scholar] [CrossRef] [Green Version]
  2. Song, H.; Min, Z. Spatial spillovers of regional Innovation. Emerg. Mark. Financ. Trade 2017, 53, 2104–2122. [Google Scholar] [CrossRef]
  3. Duan, D.; Zhang, Y.; Chen, Y.; Du, D. Regional integration in the inter-city technology transfer system of the Yangtze River Delta, China. Sustainability 2019, 11, 2941. [Google Scholar] [CrossRef] [Green Version]
  4. Fan, F.; Du, D.; Wang, X. The measure and characteristics of spatial-temporal evolution of China’s science and technology resource allocation efficiency. J. Geogr. Sci. 2014, 24, 492–508. [Google Scholar] [CrossRef]
  5. Berger, A.; Deyoung, R. Technological progress and the geographic expansion of the banking industry. J. Money Credit Bank. 2006, 38, 1483–1513. [Google Scholar] [CrossRef] [Green Version]
  6. Ding, J.; Huang, R.; Lv, L. Multiscale analysis of innovation difference in the Yangtze river economic belt based on the number of patents. Resour. Environ. Yangtze Basin 2016, 25, 868–876. [Google Scholar]
  7. Liu, J.; Yang, Q.; Jiang, X.; Zhang, Y. Spatial agglomeration of city innovation and its spillover effects in Yangtze River Delta urban agglomeration. Resour. Environ. Yangtze Basin 2018, 27, 225–234. [Google Scholar]
  8. Teng, T.; Fang, W. The evolution of innovation space and its mechanism in Yangtze River Delta urban agglomeration. Econ. Geogr. 2017, 37, 66–75. [Google Scholar]
  9. Liu, H.; Fan, J.; Zhou, K. Development pattern of scientific and technological innovation and typical zone in China based on the analysis of scale and efficiency. Geogr. Res. 2018, 37, 910–924. [Google Scholar]
  10. Méndez, R.; Moral, S. Spanish cities in the knowledge economy: Theoretical debates and empirical evidence. Eur. Urban Reg. Stud. 2011, 18, 136–155. [Google Scholar] [CrossRef]
  11. Xiao, Z.; Zhu, W.; Fan, F.; Wei, W. Research on the spatial pattern for innovative input and innovation performance of urban agglomeration: A case of urban agglomerations of Yangtze River Economic Belt. Hum. Geogr. 2017, 32, 61–67. [Google Scholar]
  12. Wang, C.; Sun, F. Spatial agglomeration and spillover effects of urban innovation in Yangtze River Delta. Geogr. Res. 2017, 36, 1042–1052. [Google Scholar]
  13. Cao, X.; Zeng, G.; Ye, L. The structure and proximity mechanism of formal innovation networks: Evidence from Shanghai high-tech ITISAs. Growth Chang. 2019, 50, 569–586. [Google Scholar] [CrossRef]
  14. Griliches, Z. Issues in assessing the contribution of R&D to productivity growth. Bell J. Econ. 1979, 10, 92–116. [Google Scholar]
  15. Black, D.; Henderson, V. A theory of urban growth. J. Political Econ. 1999, 107, 252–284. [Google Scholar] [CrossRef]
  16. Strange, W.; Hejazi, W.; Tang, J. The uncertain city: Competitive instability, skills, innovation and the strategy of agglomeration. J. Urban Econ. 2006, 59, 331–351. [Google Scholar] [CrossRef]
  17. Fang, C.; Ma, H.; Wang, Z.; Li, G. The sustainable development of innovative cities in China: Comprehensive assessment and future configuration. J. Geogr. Sci. 2014, 24, 1095–1114. [Google Scholar] [CrossRef] [Green Version]
  18. Xu, W.; Yang, L.; Liu, C.; Zhang, L.; Li, L. Temporal-spatial evolution characteristics and its causes of innovation output in the Yangtze River Economic Belt. Sci. Geogr. Sin. 2017, 37, 502–511. [Google Scholar]
  19. Zhang, K.; Qian, Q.; Zhao, Y. Evolution of Guangzhou biomedical industry innovation network structure and its proximity mechanism. Sustainability 2020, 12, 2456. [Google Scholar] [CrossRef] [Green Version]
  20. Zhu, L.; He, R.; Zheng, W.; Wang, H.; Han, L. Study on spatial-temporal pattern and driving factors of urban innovation efficiency of urban agglomeration in the middle reaches of Yangtze River. Resour. Environ. Yangtze Basin 2019, 28, 2279–2288. [Google Scholar]
  21. Li, E.; Cui, Z. Coupling coordination between China’s regional innovation capability and economic development. Sci. Geogr. Sin. 2018, 38, 1412–1421. [Google Scholar]
  22. Jiang, T. Study on spatial and temporal evolution and factors of regional innovation in China. Econ. Geogr. 2013, 33, 22–29. [Google Scholar]
  23. Duan, D.; Du, D.; Liu, C.; Grimes, S. Spatio-temporal evolution of urban innovation structure based on zip code geodatabase: An empirical study from Shanghai and Beijing. J. Geogr. Sci. 2016, 26, 1707–1724. [Google Scholar] [CrossRef] [Green Version]
  24. Jiang, T.; Xie, M.; Liu, G. Spatial linkage of regional innovation output based on gravity model: A case study in Zhejiang province. Sci. Geogr. Sin. 2014, 34, 1320–1326. [Google Scholar]
  25. Drivasa, K.; Economidoua, C.; Karkalakosa, S.; Tsionas, E. Mobility of knowledge and local innovation activity. Eur. Econ. Rev. 2016, 85, 39–61. [Google Scholar] [CrossRef] [Green Version]
  26. Jaffe, A. Technological opportunity and spillovers of R&D: Evidence from firm’s patents, profits and market value. Am. Econ. Rev. 1986, 76, 984–1001. [Google Scholar]
  27. Liu, S.; Du, D.; Qin, X.; Hou, C. Spatial-temporal pattern and influencing factors of China’s innovation efficiency based on innovation value chain. Sci. Geogr. Sin. 2019, 39, 173–182. [Google Scholar]
  28. Berliant, M.; Reed, R.; Wang, P. Knowledge exchange, matching, and agglomeration. J. Urban Econ. 2006, 60, 69–95. [Google Scholar] [CrossRef] [Green Version]
  29. Dushnitsky, G.; Lenox, M. When do incumbents learn from entrepreneurial ventures? Corporate venture capital and investing firm innovation rates. Res. Policy 2005, 34, 615–639. [Google Scholar] [CrossRef]
  30. Yan, D.; Sun, W.; Sun, X. Spatial-temporal pattern evolution and driving factors of population in the Yangtze River Delta. Sci. Geogr. Sin. 2020, 40, 1285–1292. [Google Scholar]
Figure 1. The basic research framework.
Land 11 00876 g001
Figure 2. Location map and administrative division of the YRD.
Land 11 00876 g002
Figure 3. Overall evolution of innovation in the YRD from 2000 to 2018.
Land 11 00876 g003
Figure 4. Evolution of the spatial and temporal patterns of innovation in the YRD from 2000 to 2018.
Land 11 00876 g004
Figure 5. Evolution of innovation growth pattern in the YRD from 2000 to 2018.
Land 11 00876 g005
Figure 6. Cities with different types of innovation growth in the YRD.
Land 11 00876 g006
Table 1. Regression results for driving factors for innovation development in the YRD.
2000–20182000–20082009–2018
FEREFEREFERE
Tal0.301 ***
(5.78)
0.163 ***
(3.38)
0.0815
(1.04)
−0.0112
(−0.16)
0.298 ***
(4.05)
0.403 ***
(3.08)
Fund0.0879 **
(2.05)
0.242 ***
(6.49)
0.0386
(0.71)
0.0861 **
(2.01)
0.257 **
(2.20)
0.712 ***
(8.71)
Ind1.450 ***
(11.61)
1.099 ***
(10.76)
1.075 ***
(6.42)
0.960 ***
(7.10)
2.382 ***
(11.65)
1.427 ***
(11.74)
Fin0.491 ***
(7.27)
0.510 ***
(7.49)
0.767 ***
(5.48)
0.691 ***
(5.62)
−0.399
(−0.86)
−0.231
(−1.07)
Tra0.243 ***
(4.81)
0.276 ***
(6.08)
−0.0164
(−0.15)
−0.0527
(−0.61)
0.144 **
(2.14)
0.142 ***
(2.70)
Ope−0.0908 ***
(−3.10)
−0.103 ***
(−3.58)
−0.0986 **
(−2.42)
−0.0960 **
(−2.48)
0.138 ***
(2.79)
0.0567
(1.35)
Constant−0.853 ***
(−3.72)
−0.168
(−0.72)
−0.0744
(−0.19)
0.391
(1.20)
0.106 ***
(4.25)
0.103 ***
(4.44)
R20.9240.9200.7430.7400.7820.765
Hausman104.42 ***14.02 **61.72 ***
Note: **, and *** indicate significance levels of 0.05, and 0.01, respectively, and t-statistics are in parentheses.
Table 2. Regression results for driving factors for innovation development in different types of cities.
Low–Low CitiesLow–High CitiesHigh–High Cities
FEREFEREFERE
Tal0.359 ***
(4.92)
0.235 ***
(3.15)
0.386 ***
(2.91)
0.0874
(0.91)
0.212 *
(1.95)
−0.0263
(−0.31)
Fund0.340 ***
(5.53)
0.0517
(0.79)
0.231 ***
(2.86)
0.0235
(0.24)
0.278 ***
(3.28)
0.107
(0.92)
Ind1.495 ***
(8.15)
0.723 ***
(5.04)
1.805 ***
(6.57)
1.703 ***
(7.91)
1.868 ***
(5.40)
1.143 ***
(6.03)
Fin0.320 ***
(3.34)
0.511 ***
(4.84)
0.359 **
(2.26)
0.261 *
(1.84)
0.586 ***
(3.20)
0.622 ***
(4.04)
Tra0.466 ***
(6.89)
0.321 ***
(4.63)
0.00121
(0.01)
0.0714
(0.76)
−0.471 ***
(−3.40)
−0.332 **
(−2.55)
Ope−0.0920 **
(−2.28)
−0.0272
(−0.62)
−0.0616
(−0.83)
−0.275 ***
(−4.45)
−0.121
(−1.59)
−0.227 ***
(−4.36)
Constant−1.535 ***
(−5.00)
0.0290
(0.09)
−0.585
(−1.13)
0.290
(0.62)
1.215 *
(1.70)
1.900 ***
(3.22)
R20.9250.9150.9390.9310.9370.933
Hausman120.64 ***34.10 ***24.14 ***
Note: *, **, and *** indicate significance levels of 0.1, 0.05, and 0.01, respectively, and t-statistics are in parentheses.
Publisher’s Note: MDPI stays neutral with regard to jurisdictional claims in published maps and institutional affiliations.

