Article

Assessing the Impacts of Population Growth and Roads on Forest Cover: A Temporal Approach to Reconstruct the Deforestation Process in District Kurram, Pakistan, since 1972

1
Department of Geography, Shah Abdul Latif University, Khairpur 66020, Pakistan
2
Department of Geography, University of Peshawar, Peshawar 25000, Pakistan
3
Department of Geography, The Islamia University of Bahawalpur, Bahawalpur 63100, Pakistan
4
CEN Center for Earth System Research and Sustainability, Institute of Geography, University of Hamburg, Bundesstr. 55, 20146 Hamburg, Germany
*
Author to whom correspondence should be addressed.
Land 2022, 11(6), 810; https://doi.org/10.3390/land11060810
Submission received: 12 April 2022 / Revised: 17 May 2022 / Accepted: 27 May 2022 / Published: 30 May 2022
(This article belongs to the Special Issue Mountains in Transition)

Abstract

:
Deforestation in remote mountainous regions is considered to be one of the fundamental elements for triggering changes in the biophysical environment driven by various socioeconomic parameters, particularly population growth and road construction in a previously inaccessible environment. A sudden increase in population exerts adverse impacts on the local natural resources, specifically forests. The present study is conducted in Tribal District Kurram, located in the northwestern mountainous belt of Pakistan. This study is aimed to analyze the temporal pattern of deforestation and to explore the impacts of population growth and accessibility on forest cover. It is based on remotely sensed data, focused group discussions, interviews and field observations. The satellite images were processed and classified using ArcGIS and ERDAS IMAGINE. The time span of this study is 1972 to 2019, which is further divided into three periods. The results revealed that almost half (48%) of the forest cover was reduced in ca. five decades. However, considerable variation has been observed in the deforestation rate during the study period. The results of this study revealed that both population change and accessibility have played a vital role in the deforestation process.

1. Introduction

Forests provide countless services to humanity and the environment in terms of provisioning, regulating/supporting and cultural services [1,2]. Forests protect surface soil, store CO2, sustain healthy environment, and provide food, shelter and fresh water to living organisms [3]. Nevertheless, presently this ecologically important and economically valuable resource is under immense pressure, and deforestation is going on in most of the less developed countries of the world. From 2010 to 2019, on average 4.7 million hectares of forest were cleared annually [4]. In the global environmental change research, deforestation is considered to be one of the main driving forces for the current environmental challenges. Moreover, at the global level, the emission of carbon dioxide and the anticipated climate change is the most debated issue, closely connected with land use and land cover changes driven by deforestation [5]. Hu et al. [6] have estimated 12.3 Gt carbon losses from above and belowground biomass, due to deforestation between 2010 and 2018, which was equal to 1.5 Gt per annum.
The Worldwide literature on deforestation [7,8,9,10,11,12,13] identified a number of anthropogenic causes. However, population growth, accessibility and associated socio-economic factors have been considered major causes of deforestation [14]. Generally, most of the less developed countries have experienced rapid population growth and are heavily dependent on biomass to fulfill domestic energy needs [13], which is often argued by researchers, e.g., [15,16,17,18] as the main driver of deforestation and forest degradation. It is estimated that a total of 3.97 billion m3 of wood was removed in 2018, half of which was fuelwood. The extraction of fuelwood was highly concentrated in the less developed world, i.e., in Africa 90%, in Asia ≥60% and in South America 42% [4].
Fulfilling the increasing demand of the population for fuelwood and timber is facilitated by the improvement in accessibility of mountainous environments, and a very close relationship is found between access to motorized transport and deforestation in many studies around the world, as well as in Pakistan [19,20,21,22,23,24]. Researchers have explored the idea that new roads encourage deforestation because forests become accessible to many legal and illegal actors [25]. For example, the construction of the Karakoram Highway and its feeder roads in the formerly secluded high mountain region of northern Pakistan has caused dramatic changes in socio-economic development and natural resource utilization [26,27,28]. The improved transport facilities resulted in reinforced exploitation of forest stands, indicating that road building is a major factor of forest degradation and deforestation [20]. Ali et al. [19] reported more than 50% forest loss after the construction of a link road in Basho Valley, Pakistan from 1968 to 1987.
Due to topographic and climatic constraints, only 3.726 million hectares are under forest cover in Pakistan [4,29]. Forests are concentrated in the northern mountainous belt. Pakistan has a high dependency on forest biomass for energy requirements, and more than 3/4 of households (70–79%) are dependent on wood for domestic fuel [30,31], which constitutes almost 46% of the total consumed energy. With the increase in population, consumption is increasing significantly, due to the exceeding energy needs of the growing population. In the near future, no alternative source is expected to replace wood biomass consumption, and it has been estimated that fuelwood consumption will increase by 3% per annum in Pakistan [32]. The high consumption rate of fuelwood and timber has exerted strain on forest cover and, therefore, the deforestation rate is high in Pakistan. Between 1981 and 1990, Pakistan experienced the highest deforestation rate of 2.9% among Asian countries [33]. From 1990 to 2000, it was reduced to 1.7% per annum but again increased to 2.1% in 2005 and 2.4% between 2005 and 2010 [34]. Onward from 2010 to 2020, total forest loss was 36,800 hectares per year with an annual deforestation rate of 0.94% [4,29]. Despite continuous deforestation, however, Pakistan has registered a slight increase in forest area, due to large-scale afforestation and regeneration processes [35,36,37]. In this context, to evaluate the situation of forest cover change and measure the pace of deforestation, a physically remote district in the North-Western Mountains—the Kurram District—has been selected. The major objective of this study is to determine the impact of population growth and accessibility on forest cover changes from 1972 to 2019. During this period, the political turmoil in Afghanistan has not only been the main catalyst of change in the study area but also severely affected the vegetation resources.

2. Material and Methods
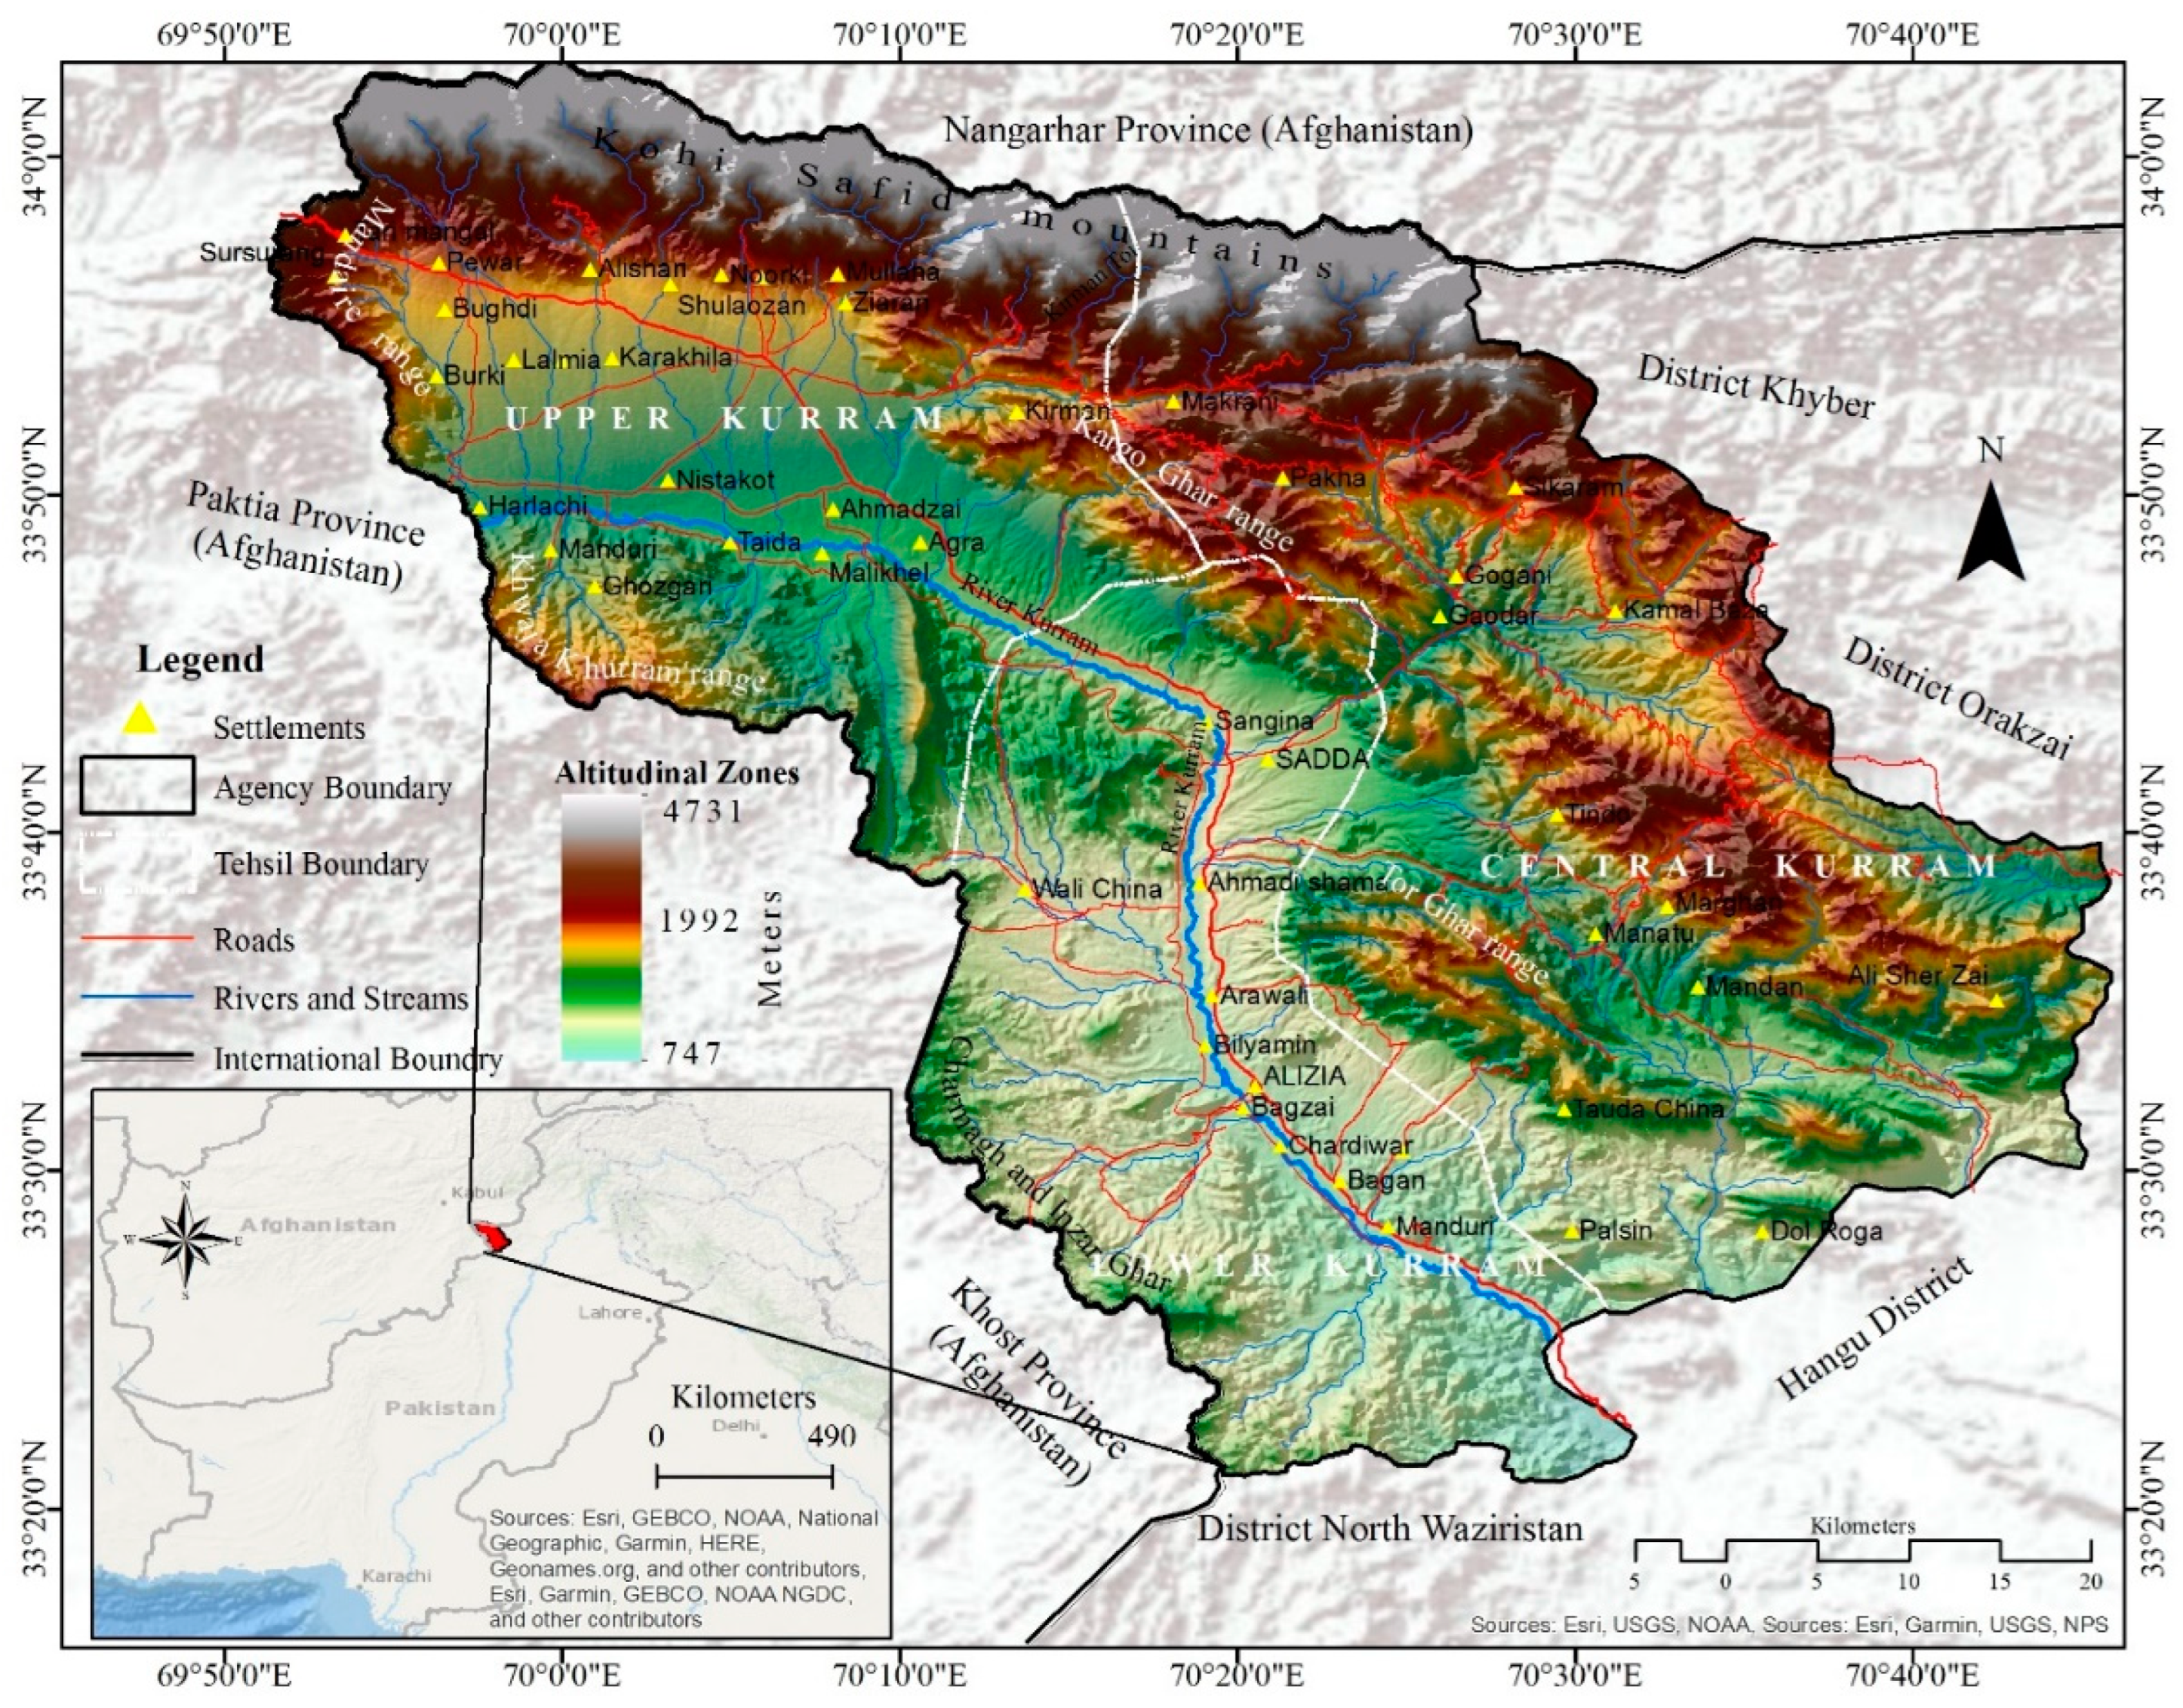
2.1. Study Area

The present study has been conducted in the former Kurram Agency, one of the newly merged districts of Khyber Pakhtunkhwa Province. Kurram has been the second oldest agency after Khyber and was integrated into British India in 1892 [38]. It has an area of 3380 km2, and extends from 33°20′ to 34°10′ N and from 69°50′ to 70°50′ E. The district has its northeastern border with the tribal districts of Khyber and Orakzai, its eastern border with Hangu District, the southeastern border with the tribal district of North Waziristan, and is surrounded by Afghanistan on the northern, western and southwestern sides (Figure 1). Administratively, it is divided into three tehsils, the Upper, Lower and Central Kurram. The upper and lower Kurram are predominantly inhabited by the Turi tribe and the central Kurram by Para Chamkani, Massuzai, Ali Sherzai and other tribes [39].
District Kurram has a typical mountainous milieu and is framed on three sides by high mountain ranges, among them the Safed Koh or Spin Ghar range, which is the highest with an average altitude of 3600 m a.s.l., usually covered with snow for most part of the year. The mountains, constituting the natural boundary between Pakistan and Afghanistan in District Kurram, are covered with coniferous forests at higher elevations and oak forests at foothills. The southern mountain ranges (Charmagh, Tor Ghar) have less elevation and are covered with patches of oak forest, sparse vegetation, scrubland and shrubs. Most of the human settlements are located along the valleys in alluvial fans, where flat land availability coincides with perennial water supply. The hills and mountains are used by the nearby villagers for grazing livestock and collecting firewood (Figure 1).
Forest in Kurram district is treated as communal property and had been distributed among the villages and tribes residing within the territorial limits, except a parcel of Spina Shaga 3000 acres that is kept as state property and maintained as reserved forest. Forest in upper and lower Kurram tehsils has proper ownership records in the revenue department with detailed demarcations during the land settlement process. The communal forest is managed by the respective co-owners.
Temperature of the study area decreases and rainfall increases with the change of elevation. The northern and western mountains and the Parachinar plateau receive snowfall and experience cold weather during the winter season and remain pleasant during summer. The southeastern parts, which have low elevation, receive no snowfall, and the weather is comparatively less cold in the winter season than in the northern parts of District Kurram. The northern parts and areas of high elevation receive more precipitation. The Parachinar meteorological station, located at 1720 m a.s.l., records more than 750 mm annual precipitation. There is considerable variability in the seasonal distribution of precipitation and the average value from 1971 to 2015 for the winter season (December to March) is 35%. The summer season, (July to September), receives 30.5% rainfall and the intermediate periods from April to June and October to November receive 27% and 7.4% rainfall, respectively. The mean minimum temperature of December, January and February remains below the freezing point and the maximum temperature is less than 13 °C. January is the coldest month with a mean temperature of 1.5 °C. The warmest month is June, having a mean maximum of 30.9 °C, a mean minimum of 17.3 °C, and a mean temperature of 24.3 °C [40].

2.2. Study Design

This study is based on Landsat satellite images of 60 m spatial resolution of 1972 and 30-m spatial resolution of 1987, 2000 and 2019. In addition, data were also collected through focus group discussions, key respondents’ interviews and field observations. Data from secondary sources were collected from population census reports of the study area. To supplement the field and published data, unpublished official data were also collected from the directorate of archive and library department Peshawar, the work and construction department Parachinar, and the Parachinar forest office.

2.2.1. Selection of Study Period

The temporal span of this study extends over five decades from 1972 to 2019. Four years, 1972, 1987, 2000 and 2019 were selected for data generation and analysis. The entire study period was divided into three time periods, i.e., 1972 to 1987 is taken as period 1, 1987 to 2000 as period 2, and 2000 to 2019 as period 3 for comparative analysis.

2.2.2. Data Collection

Field Survey

Data were collected in a field survey through focus group discussions (FGDs), interviews and field observations. Three focus group discussions were arranged with the elders of different villages, one in each subdivision (Upper, Lower and Central Kurram) in order to get information about the history, causes and driving forces of deforestation. The sessions were conducted in July 2018 in the premises of local court (Kachehri ) of Parachinar and Sadda Bazar, as the village elders (Malaks) usually came to the courts for guiding and helping villagers in government offices and for streamlining and processing of pending communal works. These elders have considerable knowledge about their resources, utilization mechanism and the process of deforestation, as they are involved in every communal activity.
To cross-check and verify information collected through focus group discussions, at least 15 knowledgeable persons of 60 and above age group from each subdivision belonging to different villages were also interviewed in their respective tehsil headquarters through unstructured questionnaires. Most of them were village elders (Malaks), farmers, retired school teachers and retired frontier constabulary men, who were actively involved, in resource management systems and have considerable knowledge and practical experience regarding forest exploitation and deforestation process.

Acquisition of Satellite Images

District Kurram is covered by two scenes of Landsat satellite images of 36/163 and 37/163 (Row/path) of Landsat 1, and 36/152 and 37/152 of Landsat 5, 7 and 8. Satellite images of 60 m spatial resolution of Landsat 1 MSS with a spectral resolution of 4 bands for 15 October 1972, 30 m spatial resolution of Landsat 5 TM with a spectral resolution of seven bands for 8 November 1987, Landsat 7 ETM+, with eleven bands for 18 October 2000 and Landsat 8 OLI of 2 December 2019 were acquired from USGS official website. The autumn season was selected to clearly differentiate between agricultural land and forest cover.

2.2.3. Pre-Processing of Images

All the images were geometrically corrected and rectified. Color composites of both scenes of four bands of 1972, six bands of 1987, and the first seven bands of 2000 and 2019 were created. Both scenes of each image were mosaic, and the area of District Kurram was extracted using a shape file of District Kurram through the extract by mask operation. For enhancing the images’ visibility, their histogram was stretched by using the standard deviation operation [41].

2.2.4. Image Classification

The images were classified through supervised classification operation in ERDAS Imagine 2014. Six digital land use and land cover classes, i.e., forest cover, agriculture land, rangeland, bare soil rock outcrops, water bodies and snow cover were developed for 1972, 1987, 2000 and 2019 classified images. The land use classes were selected on the basis of previous research studies such as [42,43,44]. To tackle with the tonal similarities, each class was subdivided into many subclasses, i.e., forest into forest 1, forest 2 and forest 3, etc., and more than 100 training samples were taken for each class. Signature files were created based on the training samples, and the images were classified using the maximum likelihood supervised classification algorithm which has been successfully applied in forest change detection studies [45,46,47,48]. The images were converted into vector data and the subclasses of each major class were dissolved into their respective single class, using dissolved operation. The area of land use classes was calculated in square kilometers, using the field calculator. In addition, periodic and annual deforestation rates during each of the periods were calculated in percentages with help of the following formula:
Deforestation   rate   in   period = D p = ( y 2 y 1   ) y 1   100
Annual   deforestation   rate   = D a = ( ( y 2 y 1   ) y 1   100 ) / y n  
where:
  • y1 = forest area in the starting year of a period, i.e., 1972 for period 1
  • y2 = forest area in end year, i.e., 1987 for period 1
  • yn = number of years in a period
Land use/land cover maps were prepared in ArcGIS 10.5. Based on classified images, change detection maps were created for all three periods using reclassification and addition operations in ArcGIS 10.5. In addition, 3 km (km) buffers were created around refugee camps and local settlements and 2 km around roads. Using the buffer shape files, the area around refugee camps, settlements and roads was extracted, maps were prepared and the area was calculated for each period.

2.2.5. Accuracy Assessments

Accuracy assessments of the four satellite data sets of 1972, 1987, 2000 and 2019 were carried out. For 1972, 1987 and 2000, training sites were collected from the Landsat satellite images of the corresponding years, respectively. This method is used to confirm whether a particular LULC class area in a satellite image is correctly classified as that class in the resulted map, but low spatial resolution images are not conducive for this process, which can negatively affect the results. For 2019, classified image data were collected using Google Earth-based Very High Resolution Satellite (VHRS) images. More than 100 ground truth points were randomly taken in each class, except for snow cover because it was confined to small areas. The point data were then converted to raster pixels of 60 m resolution for the 1972 image, 30 m resolution for the 1987, 2000 and 2019 images, using ‘point to raster’ operation in conversion tools. The pixels and classified images for each year were combined separately, and for the formation of the confusion matrix, a pivot table was used for attribute data. The pivot table was exported to MS Excel for further analysis. User accuracy, producer accuracy and omission and commission errors were calculated for each class and for whole images. To measure the agreement between the model prediction (classified image) and the ground reality Kappa coefficient was calculated for all data sets separately. The values of the Kappa coefficient are between 0 and 1. The 0 indicates complete randomness and 1 describes a perfect agreement, so the value nearer to 1 shows significant agreement and nearer to 0 shows the randomness of agreement.
Overall accuracy was 91.3%, 85.76%, 89% and 85.4% for 1972, 1987, 2000 and 2019 classified images, respectively. Kappa coefficient values were 0.88 for 1972, 0.83 for 1987, 0.92 for 2000 and 0.84 for 2019 classified images.

3. Results and Discussion

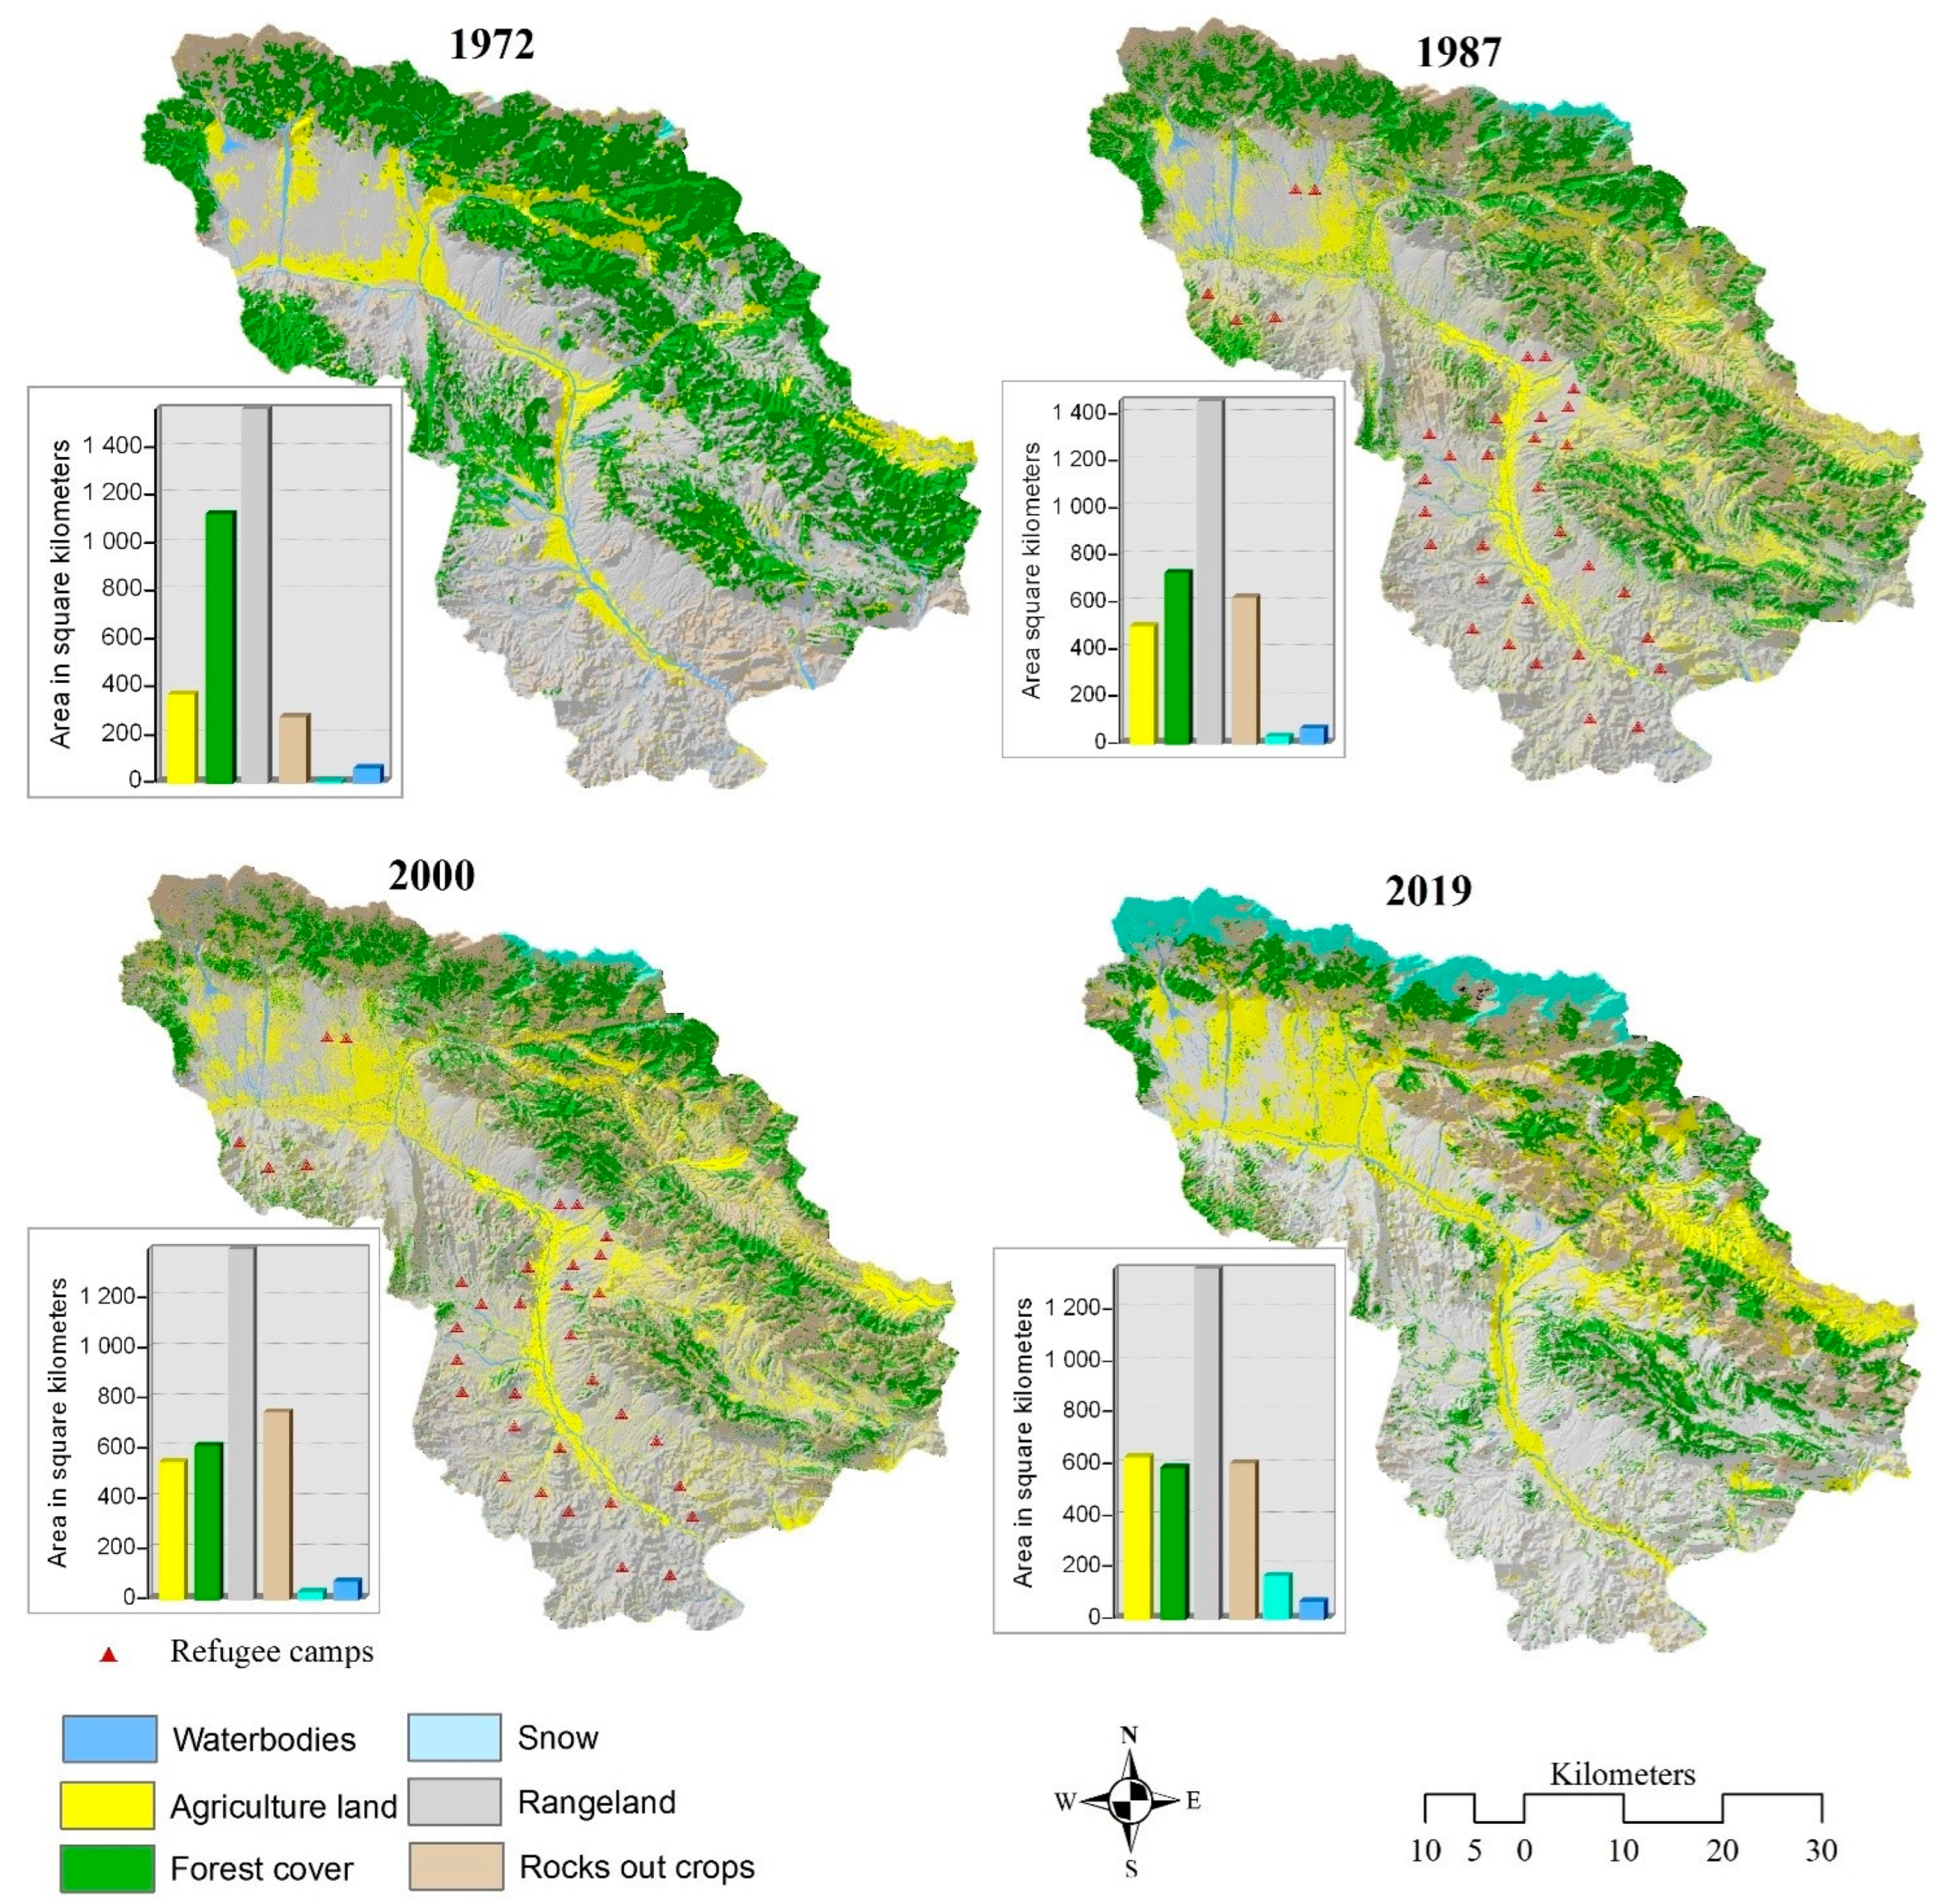
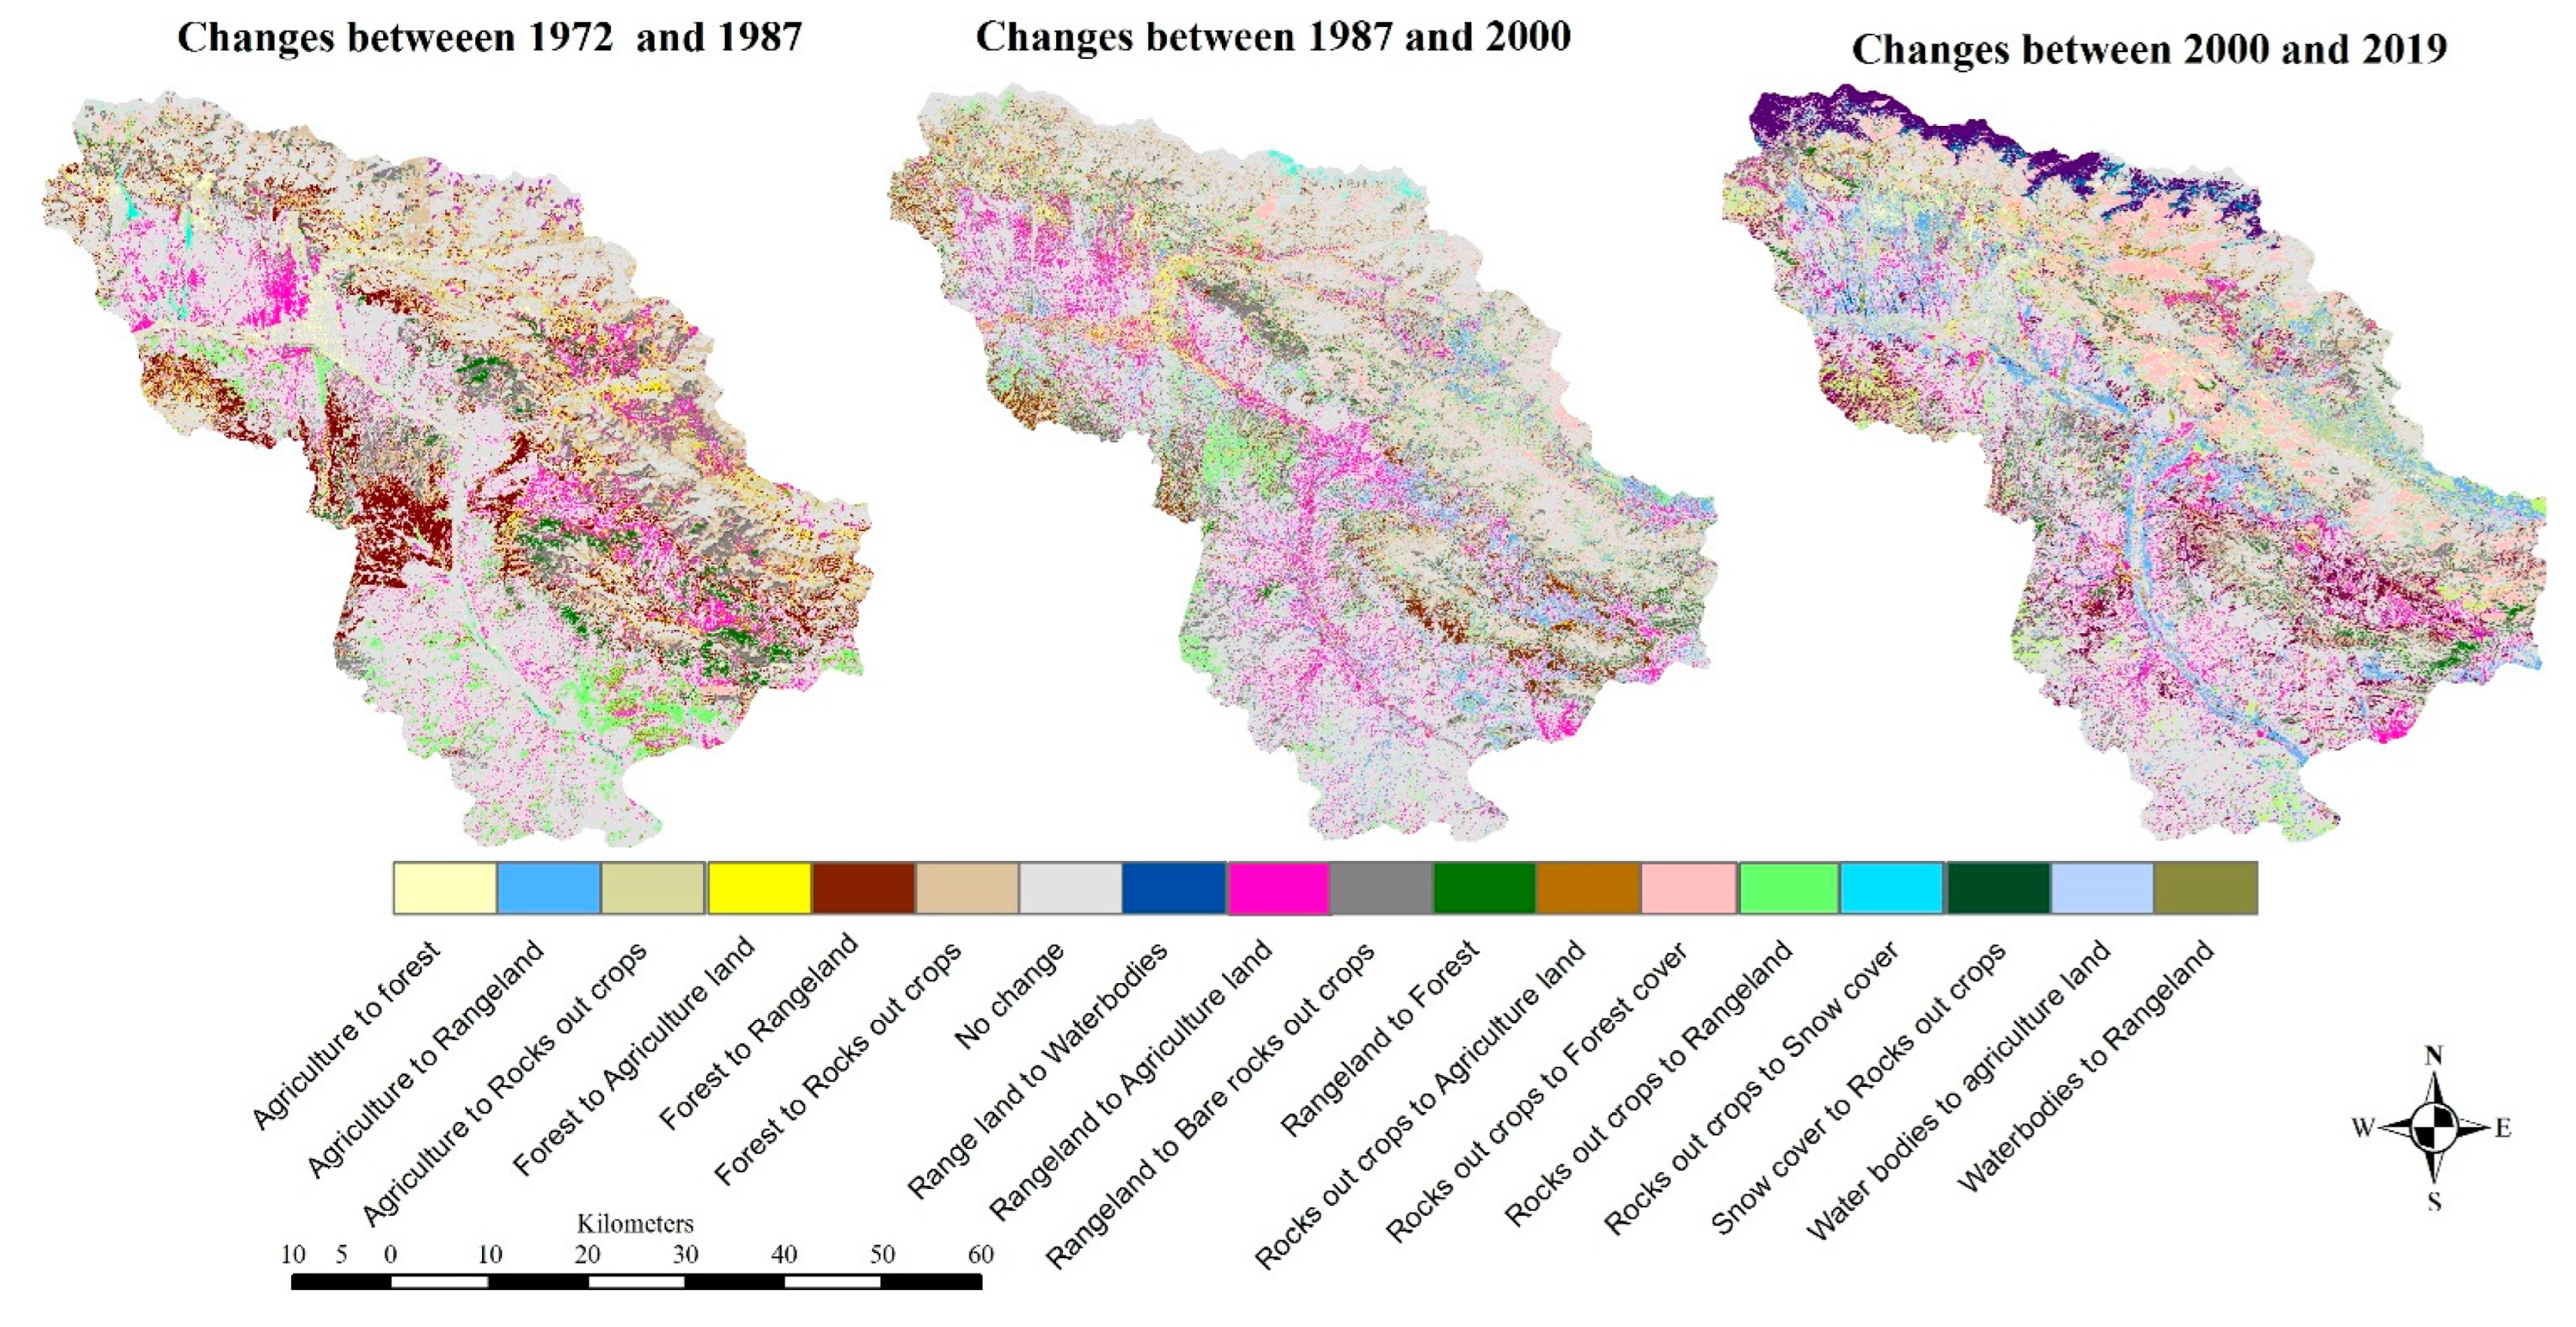
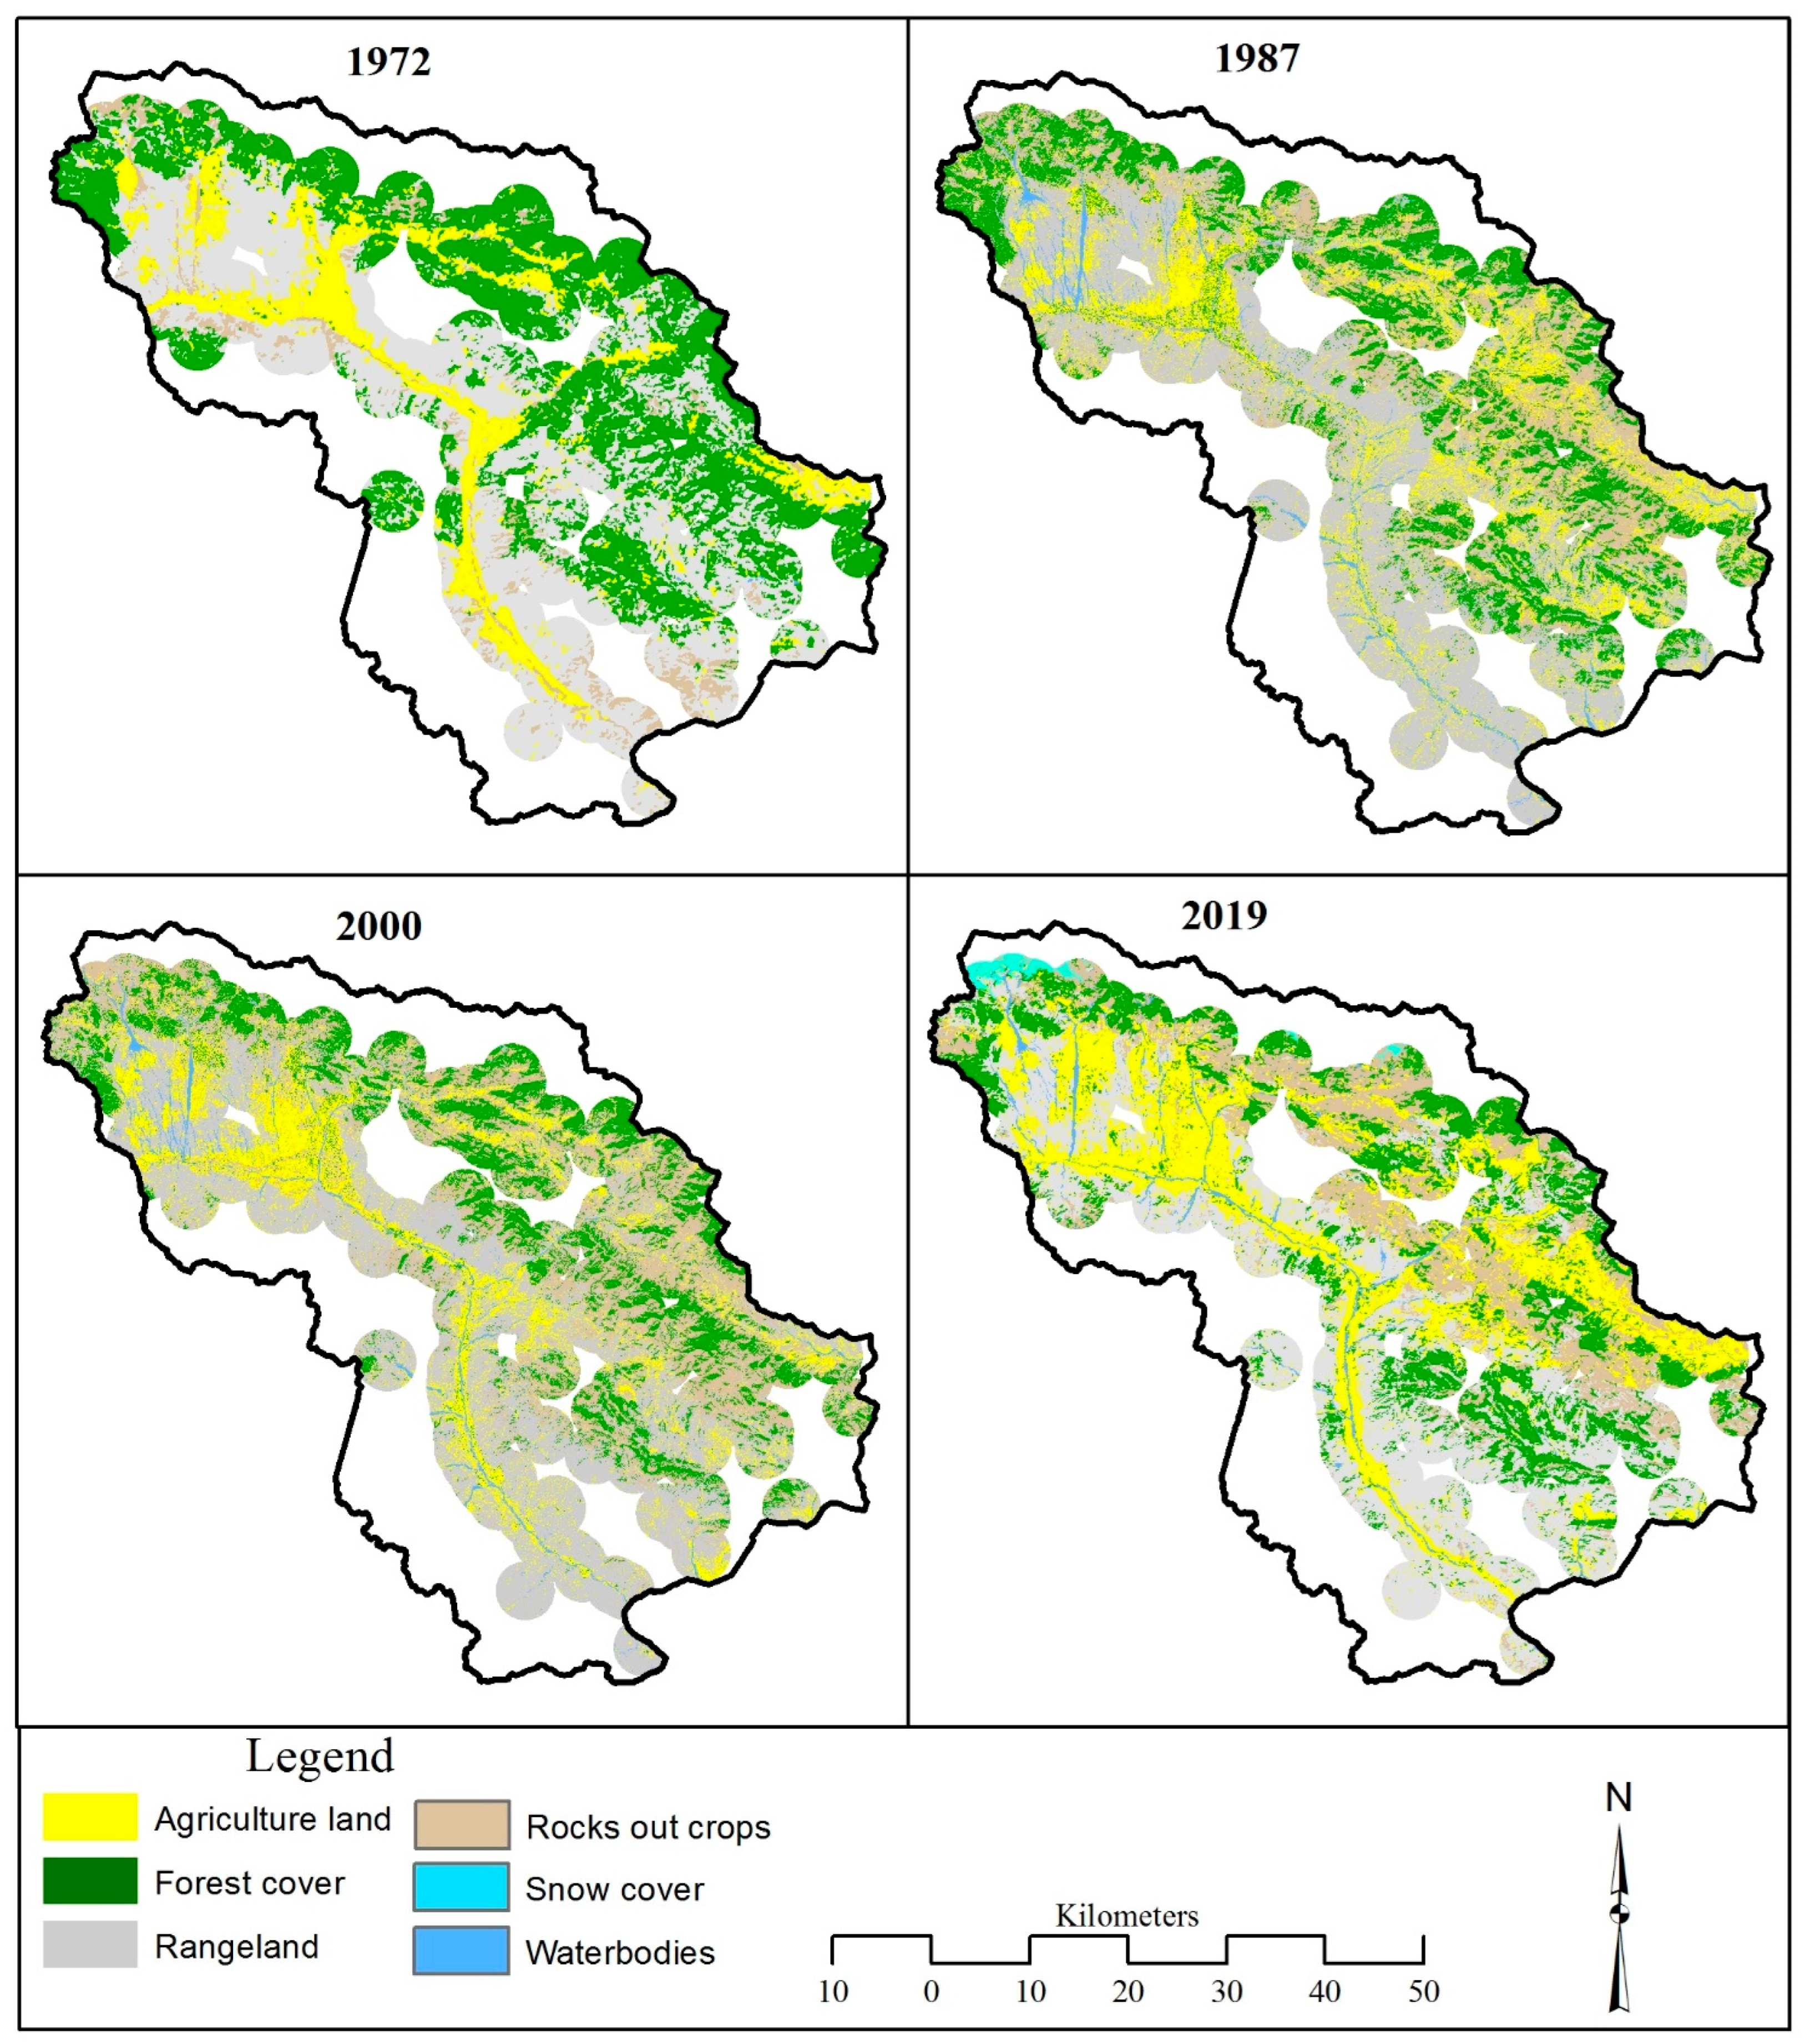
3.1. Forest Cover Change

The results of the study revealed a continuous decrease in forest cover in the study area. Forest decreased from 33.2% in 1972 to 21.3% in 1987; it further decreased to 17.9% in 2000 and 17.2% in 2019. During the study period, forest cover shrank by 48.2% of the total area of District Kurram. The annual deforestation rate remained at 0.98%, with considerable variations in the selected periods. Forest cover decreased by 36% in period 1, 15.7% in period 2 and 4% in period 3. The annual deforestation rate reduced from 2.4% in period 1 to 1.2% in period 2 and again to 0.2% in period 3 (Table 1). The high deforestation rate in period 1 can be partly attributed to the low spatial resolution of 1972 image because the difference in resolution influences the results.
Change in forest cover is closely associated with changes in other land uses. Two different trends of change are identified in four major land cover classes. Forest and rangeland have shrunk at the expense of agricultural land and bare soil rock outcrops. In most cases forest area has been converted into bare soil rock outcrops and in some cases agricultural land also encroached on forest area, while a major portion of rangeland has been converted to bare soil rock outcrops as well as to agricultural land (Figure 2). The area of bare soil rock outcrops has, therefore, expanded by 120.6% from 8% in 1972 to 17.8% in 2019. Agricultural land has expanded by 68.8% and rangeland has shrunk by 13% from 46.1% in 1972 to 40% in 2019 (Table 1). The area under water bodies remained almost unchanged during the study period, but snow cover has recorded an increase from 0.7% in 2000 to 4.7% in 2019, and most areas of bare soil rock outcrops came under snow cover during the time of the image acquisition in December 2019, therefore, the area of bare soil rock outcrops has reduced in period 3. (Figure 2; Table 1).
Details of land use/land cover changes over the three time periods are reproduced in Figure 3, and the statistics are given in Table 2. From the data, it is apparent that high percentage of forests have been converted into bare soil rock outcrops, especially in period 1 during which excessive deforestation on accessible slopes had taken place [44]. Secondly, major negative changes have occurred in rangelands [49], which have been converted mostly to agricultural land and bare soil rocks outcrops. Nevertheless, the reconversion of rangeland to forest cover can be attributed to regrowth, reforestation, and artificial plantation in rangeland during the last period.
The remote sensing-based result of forest loss is also confirmed by the evaluations of respondent interviews and focus group discussions. Majority of the respondents remembered dense forests once existing near their houses. The rangeland in the vicinity of the villages was covered with large number of trees, and shrubs. Which was elaborated by a respondent
“The surroundings of our houses and village were covered with dense forest, shrubs, and bushes. The grazing animals were out of sight there”.
The inhabitants were mostly collecting dry wood and shrubs for fuel from the rangeland and forest areas were conserved by the villagers through local institutions. A respondent explained
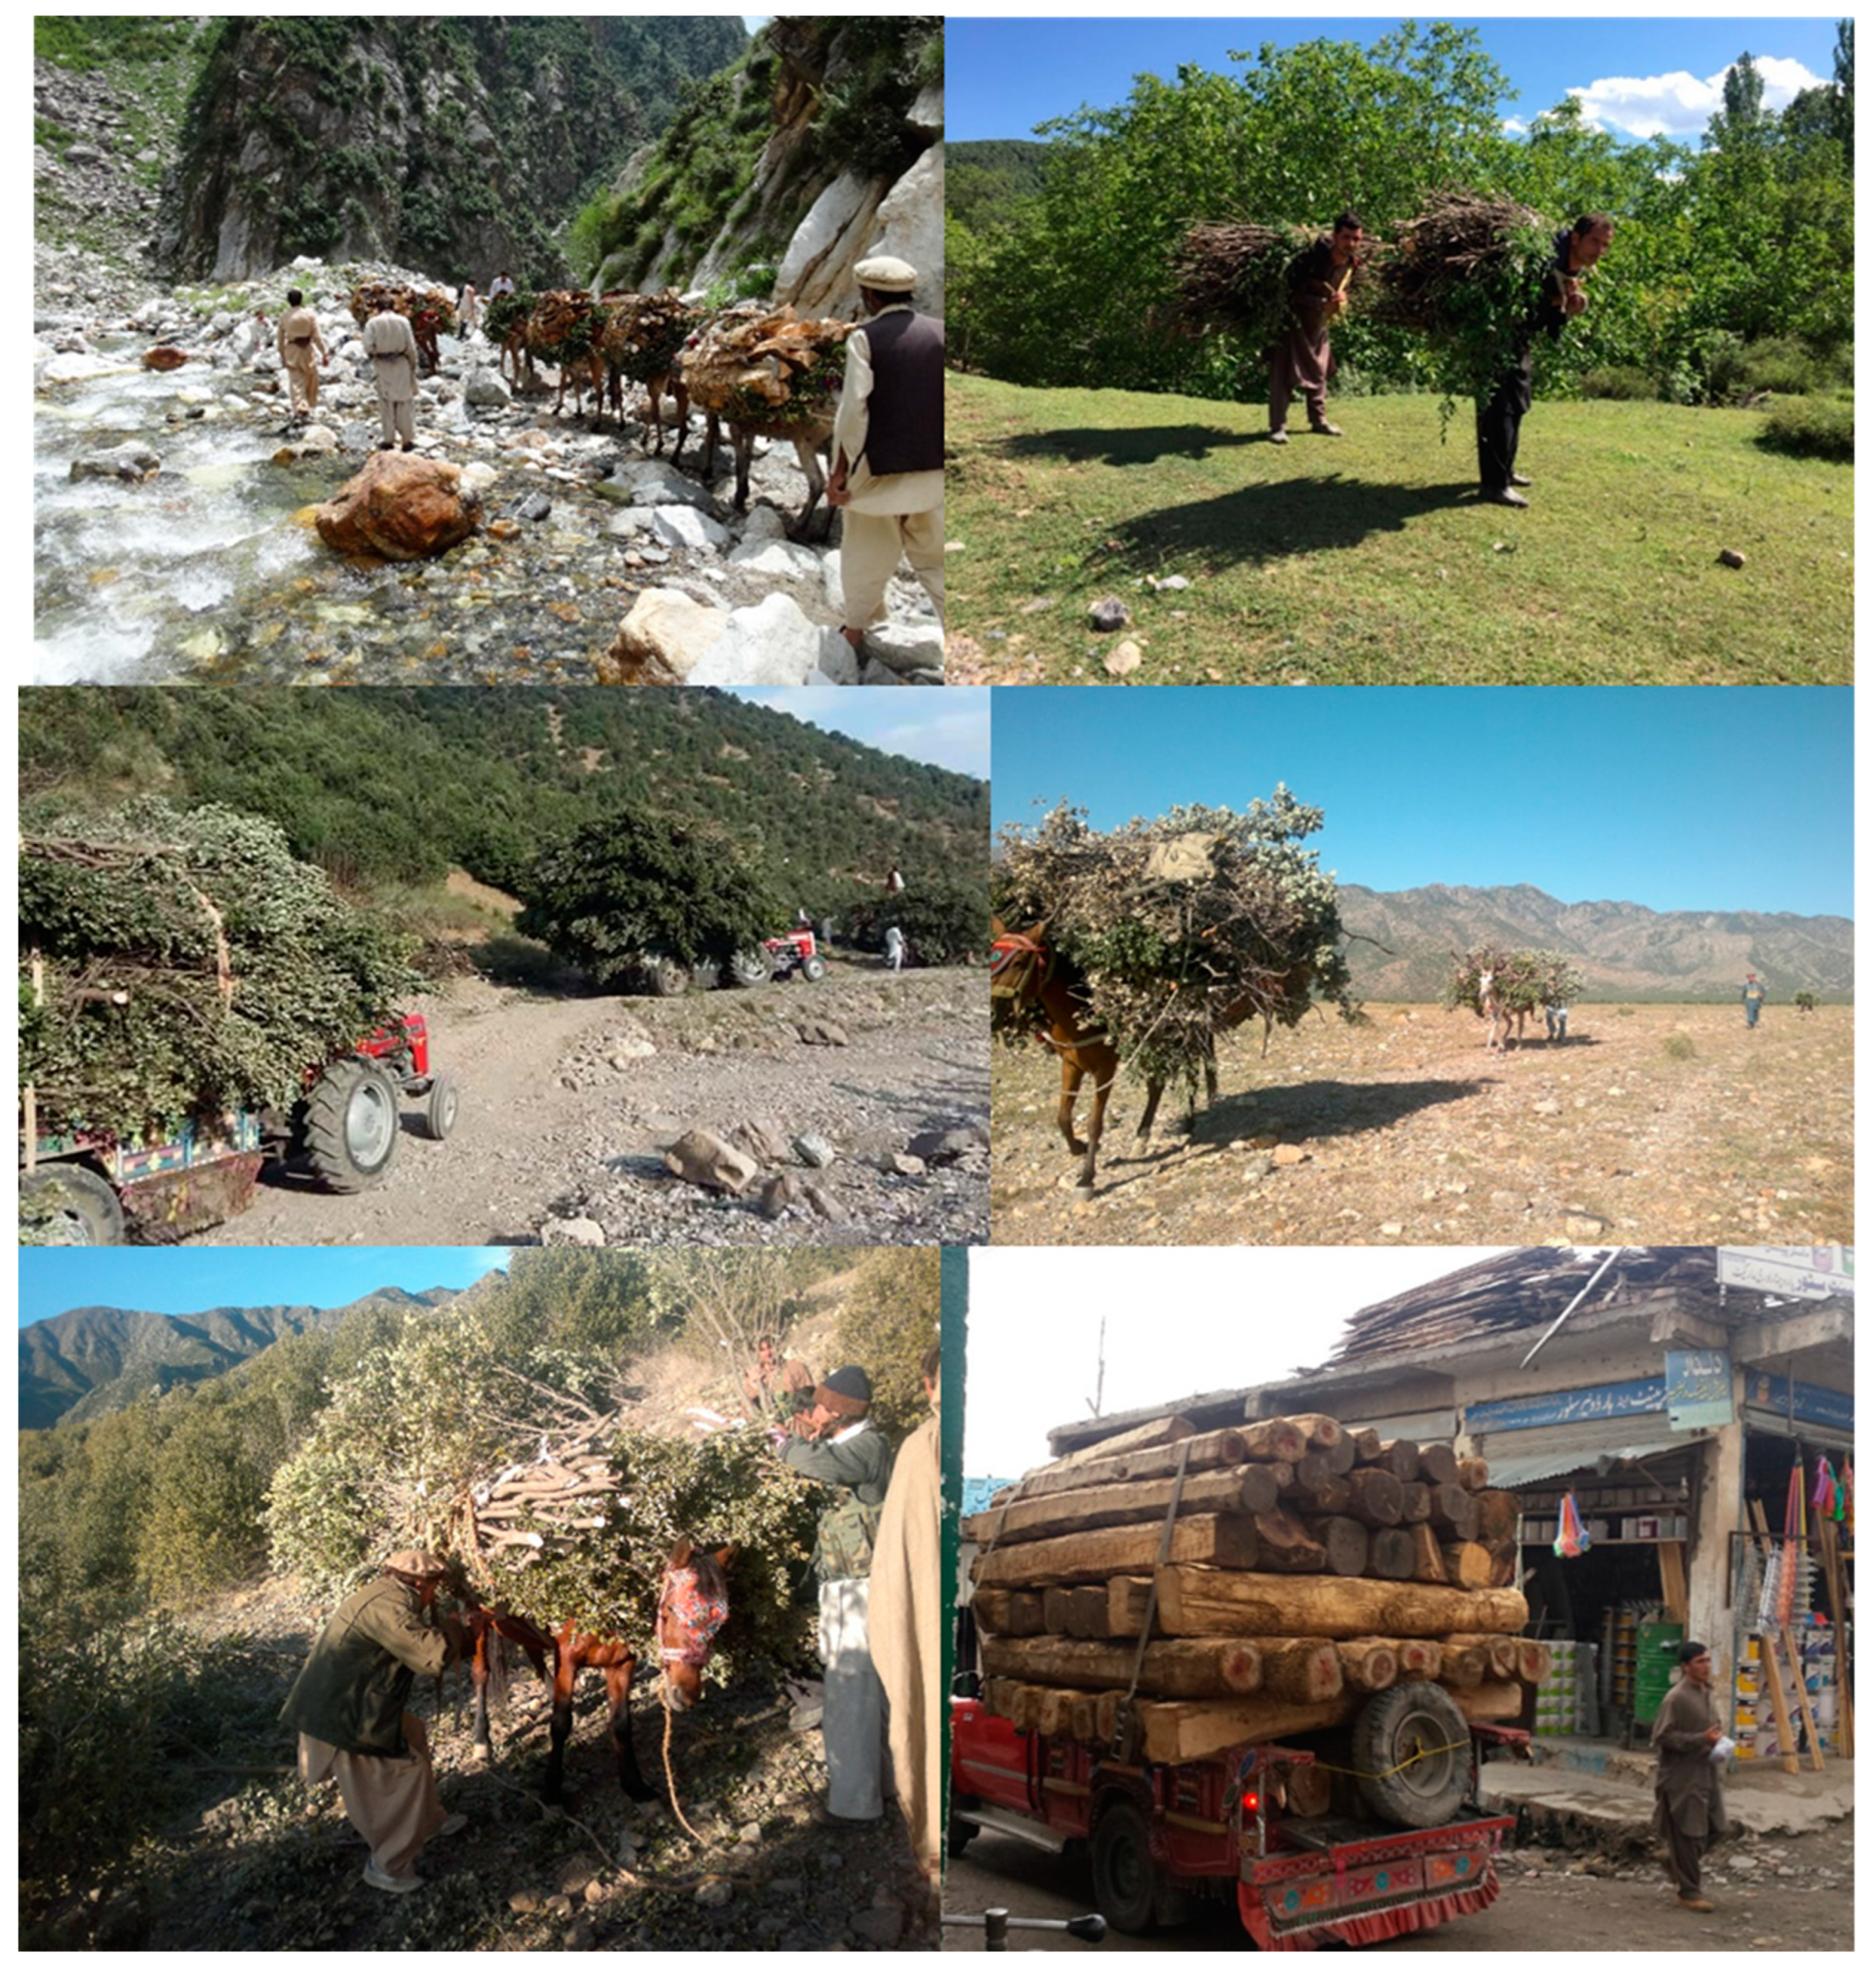
“We were collecting fuelwood from the vicinity of our villages. We did not collect fuelwood from remote mountains like we are collecting it nowadays”.
As a result of population growth, forest close to villages, camps and rangelands were exploited. Woody biomass was harvested and the natural forest disappeared. Presently, fuelwood is brought on donkeys and vehicles from forests located in remote mountains. It was narrated by another respondent as
“Continuous cutting of naturally grown trees and shrubs during the 1980s and 1990s resulted in the clearance of vegetation from village surroundings. Now forest is vanished from the vicinity of settlements and remained only on the slopes of remote mountains”.

3.2. Drivers of Deforestation

Many empirical studies in the world as well as in Pakistan have found out population growth and accessibility as the main factors enhancing deforestation processes [20,42,50,51,52,53,54,55,56,57], corroborated also by the present study. Nevertheless, deforestation is a complex process driven by the interrelationships of a multitude of ecological and socioeconomic driving forces, and monocausal explanations are not appropriate [58].

3.3. Population Growth

The rapid population growth can be considered one of the main driving forces behind deforestation in the present study. The Pearson correlation coefficient has confirmed the high negative (−0.906) and significant (p = 0.047) correlation between populating growth and forest cover change (Table 3).
The major role in the rapid increase of population in the study area was played by the Afghan refugees, whose immigration to Pakistan started in 1979 after the Russian invasion of Afghanistan. According to Weinbaum [59], the number of refugees in Pakistan reached 1.8 million by March 1981 and it increased to 2.8 million by 1984. By the end of the decade, their number exceeded 3.5 million people. Most of these refugees were settled in the tribal districts of Kurram, Orakzai and North Waziristan, and the population of these districts increased many folds. The refugee population outnumbered the local inhabitants of District Kurram for more than two decades until 2005. According to Khan et al. [60], the number of refugees settled in District Kurram ranged from 300,000 to 500,000 persons. Carter [61] has given a detailed account of refugees and as a whole 34 Afghan refugee camps were established in the study area (Figure 2), and by June 1989 the number of families living in these camps exceeded 49,298 with a total population of 347,849 persons. In addition, a large number of unregistered refugees were also living in these camps and in other villages and towns of District Kurram. Even in 2005, when a large number of families had been shifted to the settled districts, 3929 families with 25,256 individuals were still living outside these camps (Table 4). According to the official record of the Afghan Refugees Commissionerate Peshawar, more than 350,000 refugees remained in the camps and outside the camps in District Kurram until 2000. Thereafter, these camps were cleared step by step. In 2005, the last 5 remaining camps with 20,477 families and 114,801 individuals were removed from the territorial limits of the study area to settled districts of Khyber Pakhtunkhwa and thus the shifting process of refugees was completed (Table 4).
The large numbers of refugees enlarged the local population by more than double. The combined number of refugees and local population exceeded the figure 600,000 in 1981 and almost reached 800,000 in 1998, with the local population at that time being 294,362 and 448,310 persons, respectively. The local population had a very slow annual growth rate of 0.59% in period 1 and the population increased by only 5% from 1972 to 1981 (Table 5). However, data collection during that time was based on each village elders’ estimations which was not a reliable source [62]. Onward, it increased by 52.3% from 1981 to 1998, with an annual growth rate of 2.5% and again increased by 37.2% (to 615,372 persons) from 1998 to 2017. The total increase in the local population of District Kurram from 1972 to 2017 is registered as 119.8%, and the density of the population increased from 83 to 182 persons per square kilometer (Table 5). However, combined with refugees, the density of the population increased from 82 persons per km2 in 1972 to 190 persons in 1981 and again to 236 persons in 1998 (Table 5).
The rapid growth of population exerted negative impacts on forest resources in district Kurram. In areas near to refugee camps, forest was severely degraded. In lower Kurram, where most of the refugee camps were established, forest cover decreased from 17.3% to only 3.4% [66]. A similar situation was also created in other parts of District Kurram near their camps (Figure 1 and Figure 2). The buffer-based proximity analysis can further highlight the situations of forest cover near the camps.

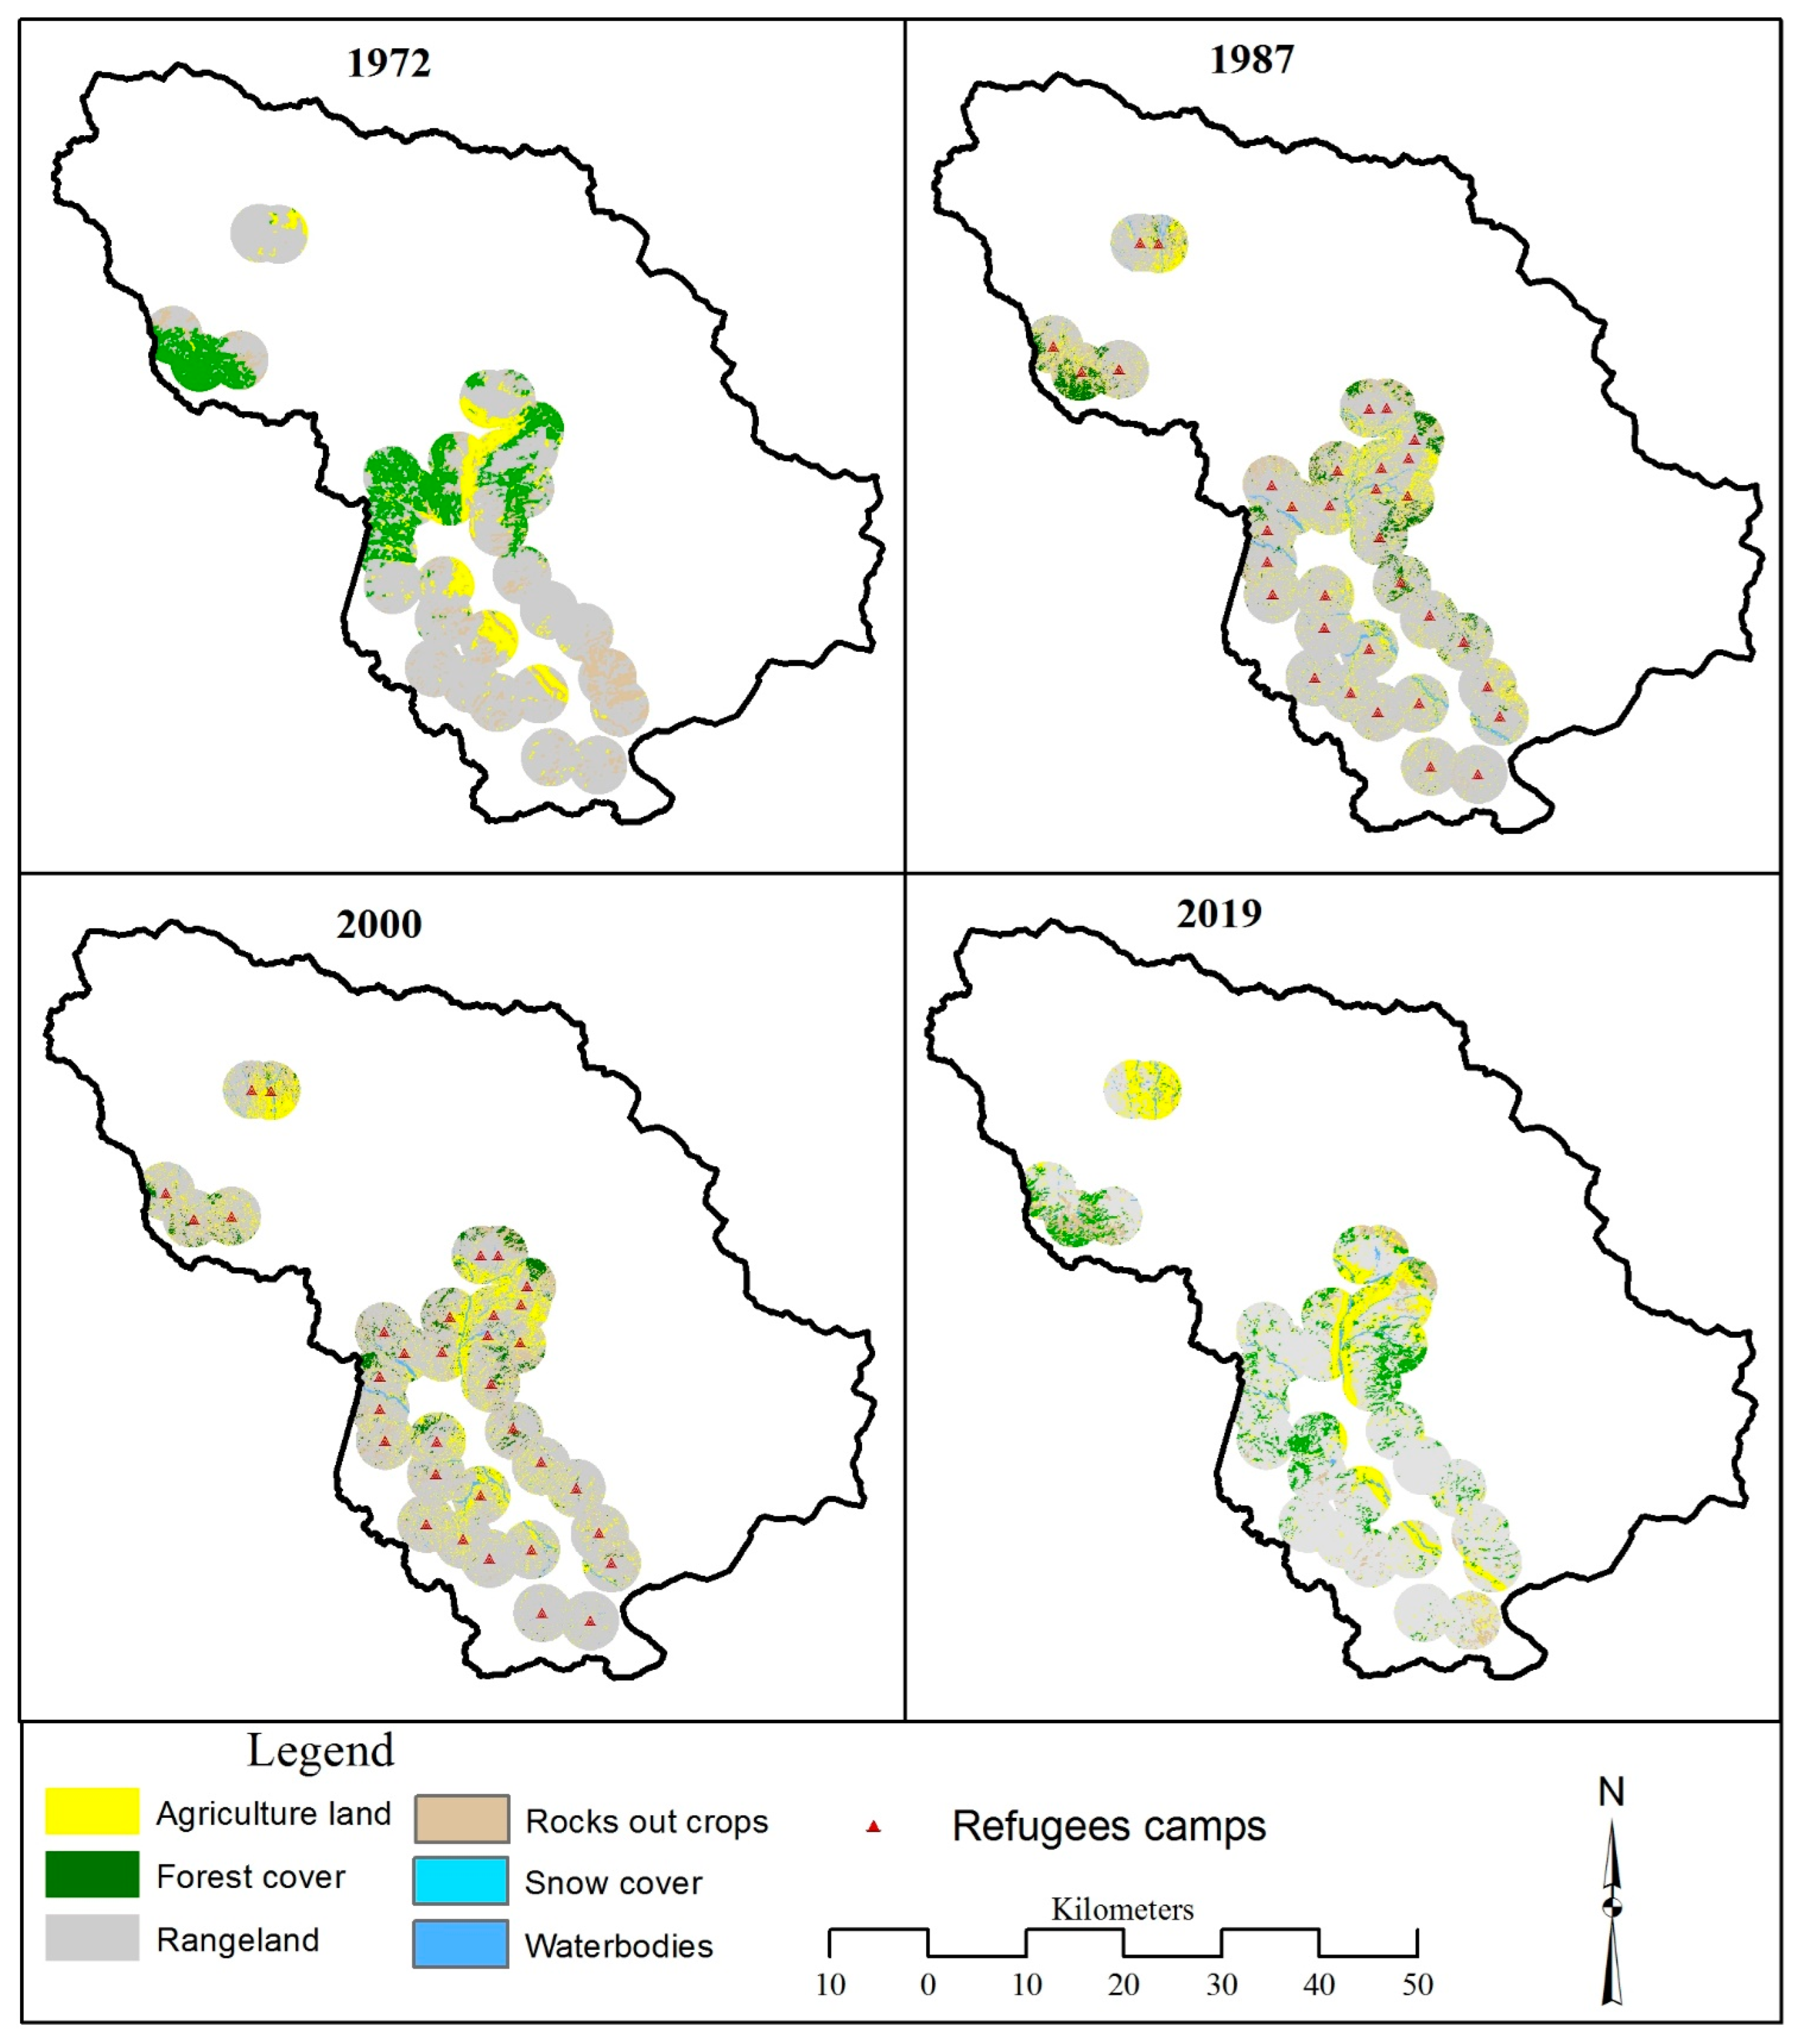
Forest Cover Change within 3 km Zones around Camps

Within the 3 km zone around the refugee camps, forest area had been reduced from 18.9% in 1972 to only 5% in 1987 and again decreased to 4% in 2000. After the shifting of refugees from Kurram valley, forest cover increased to 8.07%. In period 1, deforestation rate was quite high, reflected by a decrease in forest cover by 73.5%. Onward, the rate of deforestation slowed down because less forest remained within the 3 km of camps. In period 2, the forest was again reduced by 19.4%. Only when refugees were moved to settled districts in 2005, forest cover began to increase. This increase amounted to 100% in period 3. Similarly, area under rangelands also reduced during the presence of refugees and increased after their removal. However, compared to forest and rangeland, agricultural land increased in the presence of refugees and decreased after their repatriation. Details of these changes are presented in Figure 4, Table 6.
The focus group discussions and interviews revealed that most of the respondents had the perception that the refugees had widely cut the forest in the camps’ surroundings, and in some cases, they even uprooted the saplings. They harvested shrubs, bushes and Nannorhops ritchiana (Mazari palm) from the rangeland for domestic as well as commercial purposes. An old age respondent noted
“At the time of refugees settling in Kurram, I remembered, our village people were used to drive their animals to the communal grazing land where few of these camps were established. The trees and bushes were cleared in few years near these camps which they used for domestic purposes and surplus woods were sold to the market”.
Another respondent explained that
“Refugees were very hardworking people they harvested Mazari plant from the surrounding rangeland for making different goods and utensils like baskets, pots, mats, ropes, and many more things on large scale. These goods were sold in the markets. They were able to earn enough money and sent it to their family members residing in Afghanistan”.
It was also described in a focus group discussion that many tracts of forest in the vicinity of camps were cleared and others were severely degraded but with the passage of time some parts were recovered through regrowth and some were converted into barren land. The Khawajakhuran Mountain Range, demarcating the southern border with Afghanistan, is an example of this degradation (Figure 1 and Figure 2).
The respondent explained during the interview that the refugees while harvesting the forest resources, violated the traditional rules of local management systems that prevailed in Kurram valley [40]. These illegal activities of refugees were strongly supported by local actors who had no dejure ownership in the local forest. Thus, tensions developed between local tribes which resulted in sectarian clashes several times during this study period. Lodhi et al. [50] pointed out that the arrival of such a large number of Afghan refugees had exerted a profound impact on the ethnic composition of the local inhabitants, which gradually resulted in sectarian crises between different tribes in District Kurram. When tensions intensified due to these crises in District Kurram, the refugees were removed from Kurram to settled districts between 2000 and 2005. Subsequently, the pressure on forest resources was reduced, and during the period of 2000 to 2019 the deforestation rate slowed down.
The local population also contributed to the deforestation process because of their higher dependency on the fuelwood for domestic requirements. In the 1970s and 1980s there were very limited off-farm activities. They were involved in agriculture and fuelwood collection from their natural forest. Most of the villagers collected and stored fuelwood and sold in their times of need. This activity has low impact on forest. However, with the passage of time population increased, the demand for natural resources including forest biomass has also increased. Like in other marginalized and remote mountain communities of Pakistan [67,68,69], the energy consumption of the inhabitants of District Kurram is mainly based on fuelwood. It is the only energy source to fulfill the basic needs of the inhabitants of the study area. Large quantities of fuelwood are consumed for cooking and heating, mainly during the long winter seasons from November to April. According to the respondents’ interviews and focus group discussions, each household uses 60 to 80 mounds of fuelwood on average only in winter seasons, which they acquire from the communal forest (Figure 5), markets and private tree harvesting. Markets are also provided with wood from these forests through legal and illegal harvesting.
The disintegration of joint families has further accelerated the pressure on forest resources, as in most cases nuclear and joint families consumed an almost equal amount of wood with little differences. In Kurram valley, the customary laws allow each household an equal amount of wood extraction during the stipulated period of wood collection [40]. Households have increased by 315.1% from 1972 to 2017 in District Kurram (Table 7). The new households also get equal rights of wood collection. Therefore, with the increase in population and number of households, the pressure on forest resources has increased many folds which resulted in an ongoing deforestation process.
Buffer-based proximity analysis has also identified the temporal forest loss around local settlements. In the 3 km buffer zones, forest area has shrunk from 35.6% in 1970 to 22.2% in 1987 with a total of 19% decrease in period 1, and the annual deforestation rate was 2%. This decrease in period 1 can be partly attributed to the low resolution of the 1972 image. Forest again decreased to 18.7% in 2000 with a total of 16% deflation in period 2 and again reduced to 17.7% in 2019. The annual deforestation rate was 1.2% in period 2 and 0.3% in period 3. Details of other land use and land cover classes are presented in Figure 6 and Table 8.

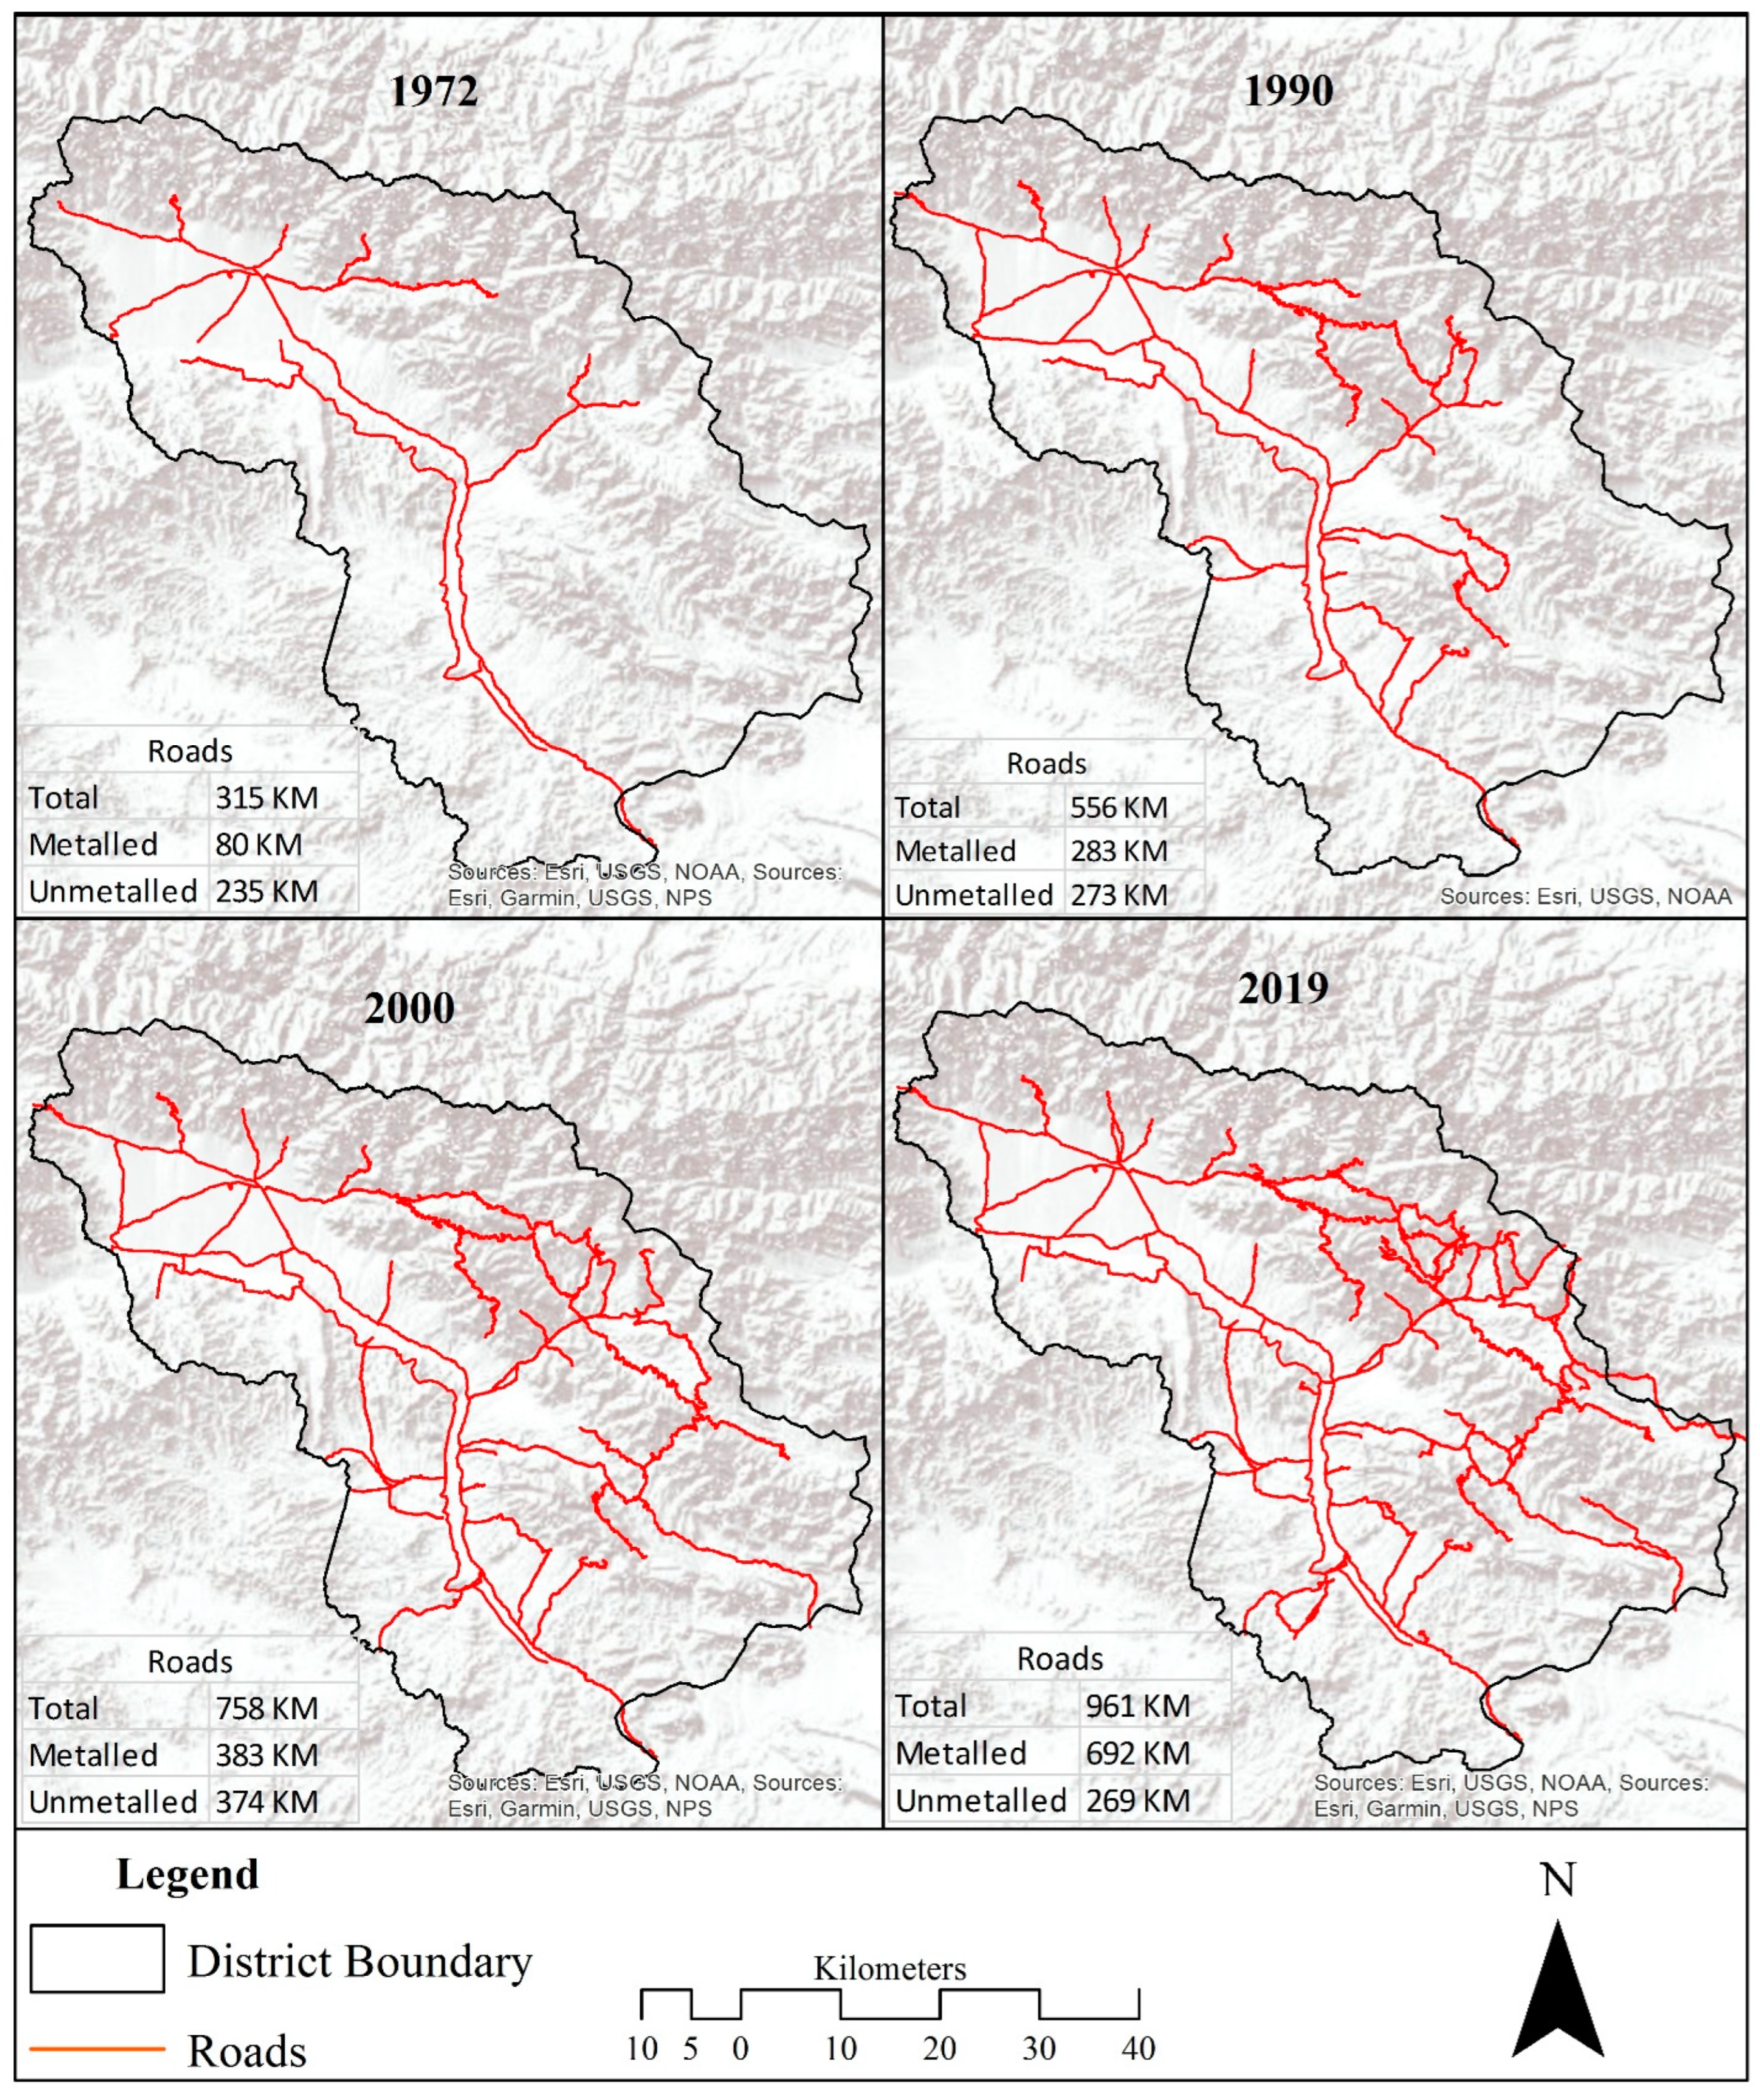
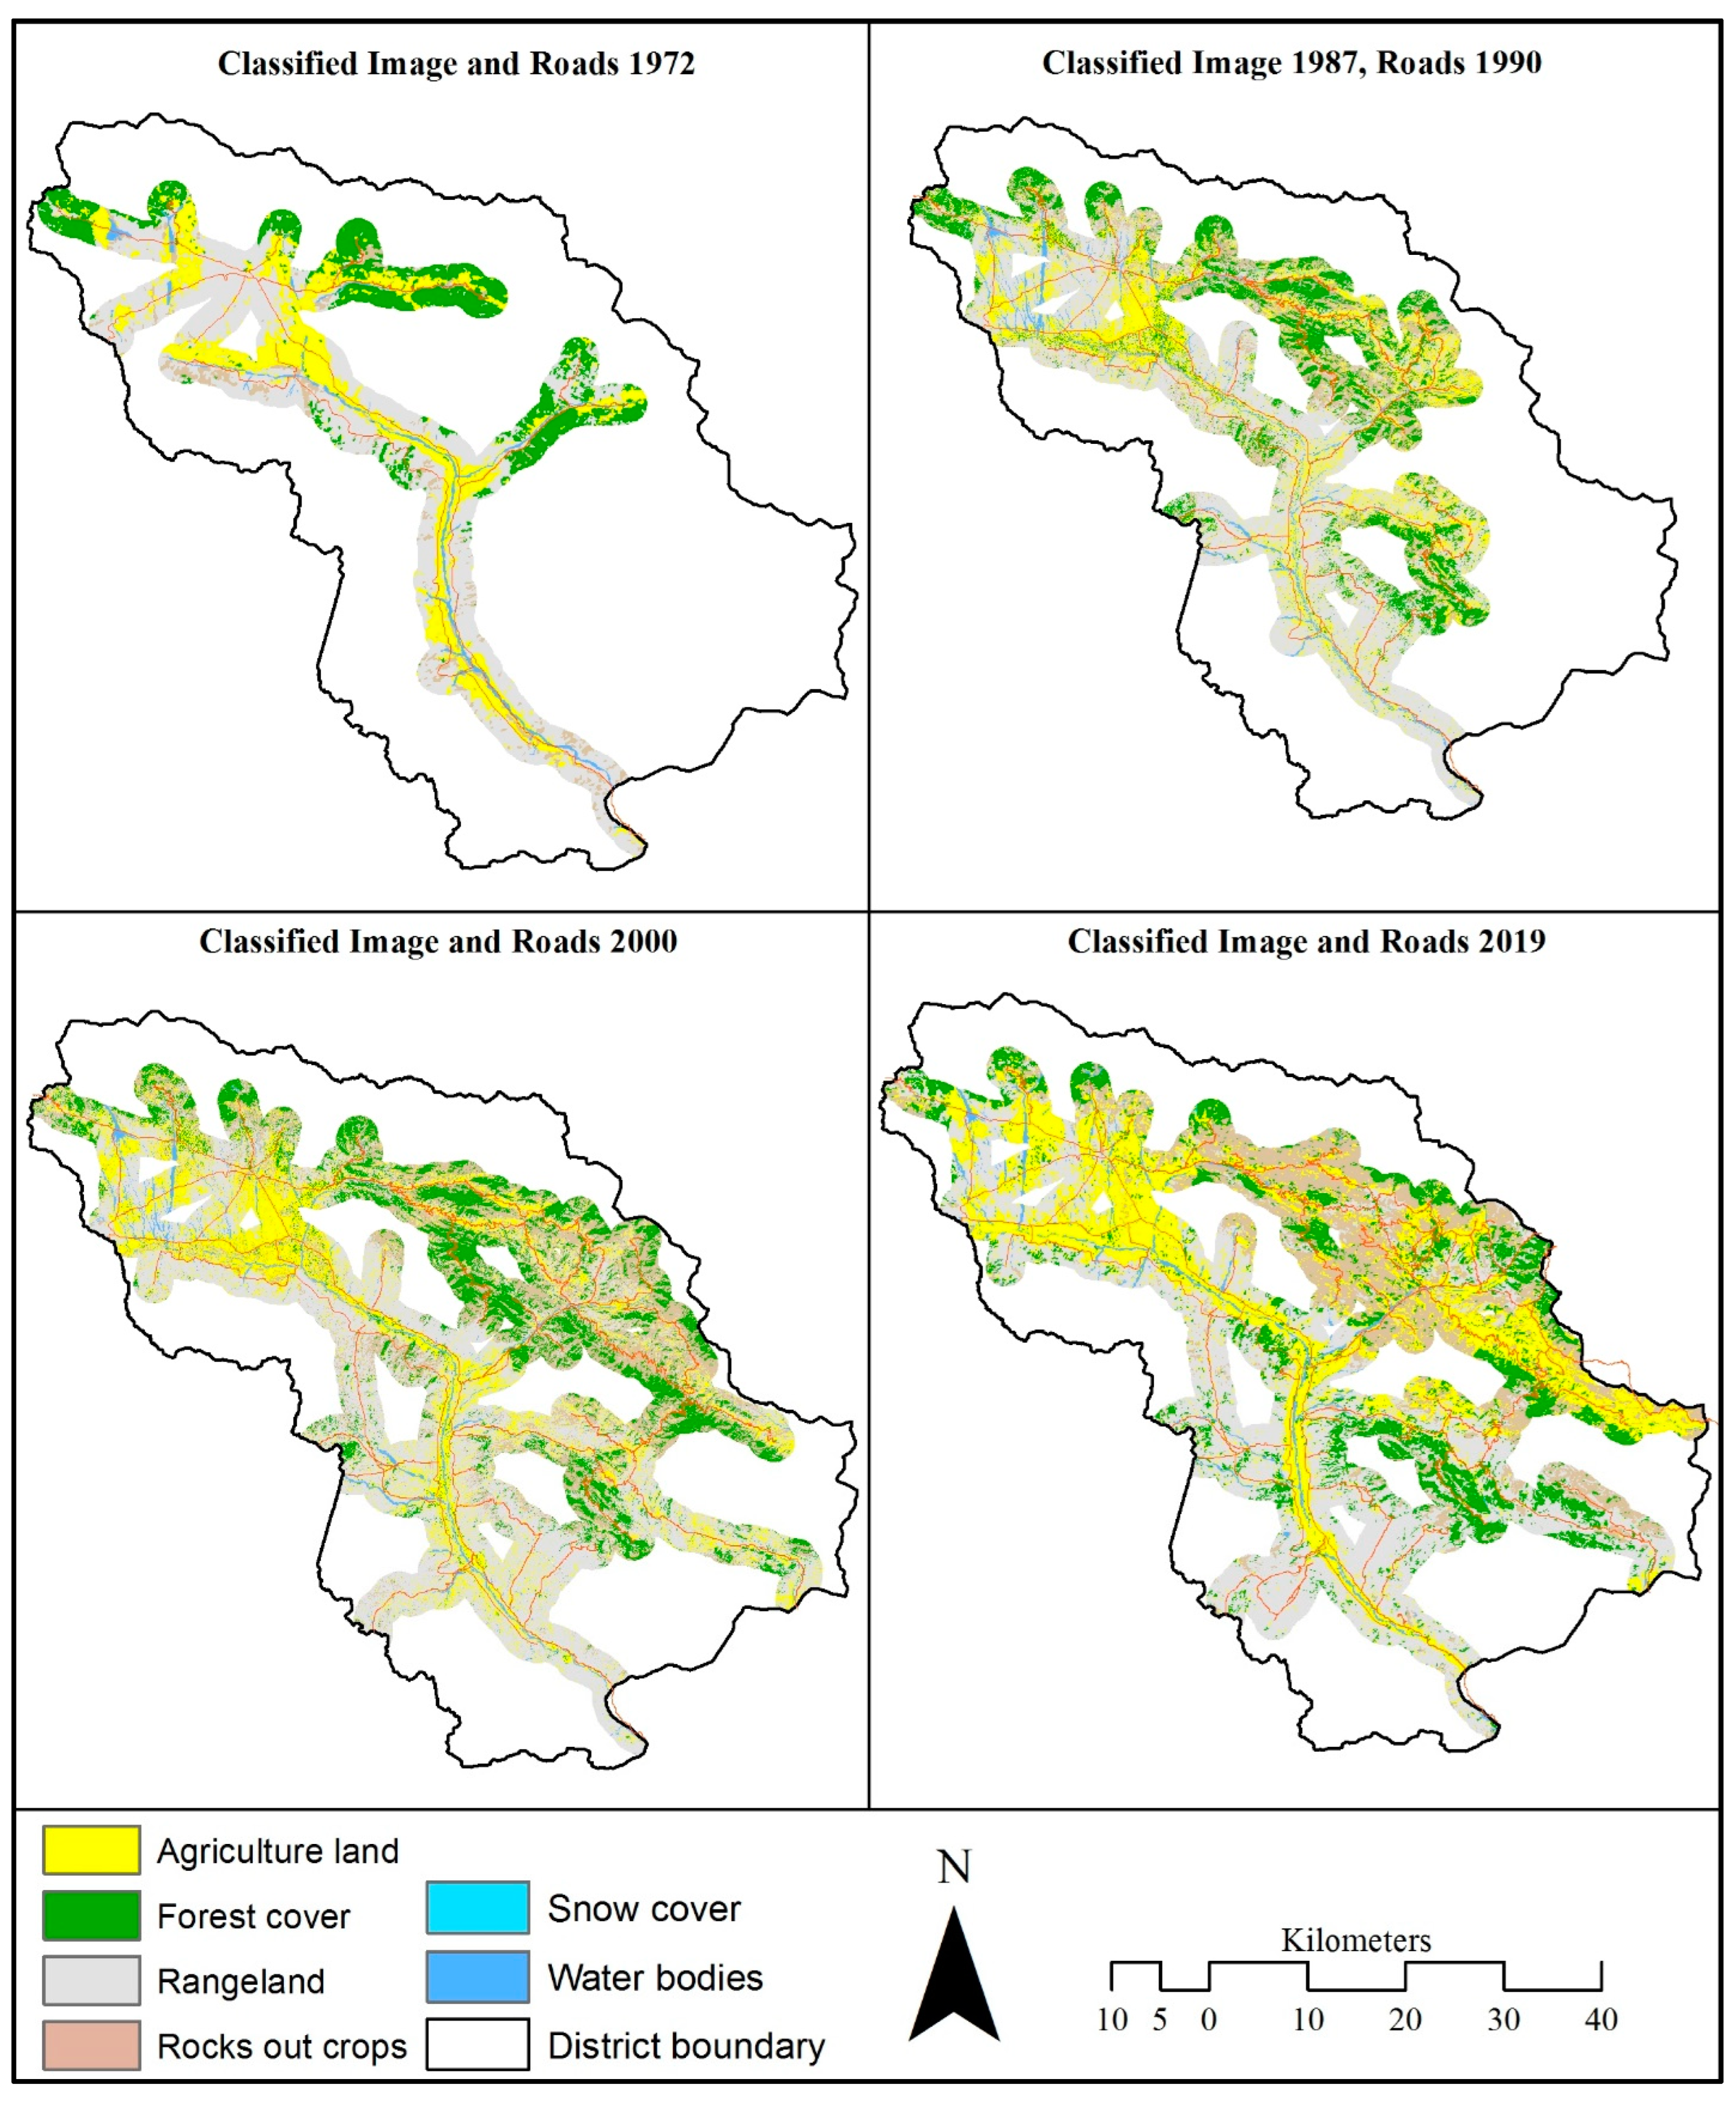
3.4. Roads and Forest Cover Decrease

Almost all of the natural forest in district Kurram has grown on mountains slopes, which were, in the past, only accessible to humans and beasts of burden for transporting forest products, not to motorized transport (before the last 3 to 4 decades). As described by Cropper et al. [55] for North Thailand, physical factors, such as steep slopes and poor soils, also provided natural protection to the forest resources located in the mountains in District Kurram. However, with the passage of time, these mountain slopes became accessible due to the construction of roads and improvements in accessibility. The first roads constructed by the government were four penetration roads into Central Kurram Tehsil and one into Upper Kurram Tehsil before 1980. Although villages and forest areas on remote mountain slopes were not accessed by these roads (only the main towns were accessed), they exerted negative impacts on forest cover, and the trees along the roadsides disappeared [60]. However, after the 1990s, the means of transportation improved and road networks extended further into most of the villages located on steep slopes and at higher elevations. Road length increased from 315 km in 1972 to 961 km in 2019. In 1972, only 80 km (25%) of roads were metaled and that was the main Thall–Parachinar road, while the rest of 235 km of village roads were shingle. However, with the increase in length, the quality of roads also improved, and in 2019 major part of the roads (63%) were metaled and most of the inaccessible villages were connected to motorized transport (Figure 7). The Pearson correlation coefficient has also revealed a strong inverse (−0.927) and significant (p = 0.036) correlation between road length and forest cover change (Table 9).

Forest Cover Change within 2 km of Roads

Within 2 km of roads, forest cover has reduced considerably over the entire study period. Total forest cover was 20.7% in 1972, which decreased to 17.7% in 1987, again decreased to 15.8% in 2000 and 14.8% in 2019. Here again, change was high in the first two periods and decreased in the last period. With changes in forest cover, reciprocal changes have also occurred in other land use and land cover classes (see Table 10 and Figure 8 for a detailed account of changes in other land use and land cover classes).
The northern parts of central Kurram were covered with dense forest in 1972 and 1987, although the rate of deforestation was very high in upper and lower Kurram due to the influence of Afghan refugees (Figure 2). The rate was lowest in central Kurram which was free from refugees. In period 1, forest was only reduced by 2.5% in central Kurram, while it was reduced by 28.6% in upper Kurram and 76.6% in lower Kurram. Onward from 1987, deforestation increased in central Kurram to 13.5% from 1987 to 2000 and 15.3% from 2000 to 2014 [66]. The cause for increase in deforestation was the construction of roads to the northern parts of central Kurram. Accordingly, mountain tops or high elevation slopes that are still inaccessible have more extensive forest cover. Some portions of the northern Safid Koh Mountains in upper and central Kurram are not accessible due to high elevation and rugged terrain, and thus still show a dense forest cover (Figure 2). Recently, the government of Pakistan is fencing the western border of Pakistan with Afghanistan, and for this purpose, roads are constructed on top of mountains in all the border areas of District Kurram. These roads are constructed in forest cover areas, resulting in the direct destruction of a large number of trees and also improving accessibility to motorized transport (Figure 9), which will further intensify deforestation process.

3.5. Other Causes

In addition to the causes of deforestation, the interview and focus group discussions also highlighted other area-specific factors. These factors include sectarian clashes, implementation of forest policy and compliance with forest rules and regulations, illegal harvesting and high market prices, which are also linked to the ever growing population. The consideration of these driving forces is very important for further research.

3.5.1. Sectarian Clashes

In District Kurram, sectarian crises erupted from time to time between different tribes on several issues, including the most important natural resources. The latest crisis erupted in 2007 and continued until 2012 due to the increasing influence of Talibanization in tribal districts. In addition to the loss of hundreds of lives from both sides, considerable forest cover was also cleared. During this crisis, the tribes located near the forest of a disputing sect cut forest resources ruthlessly to economically harm the opposite sect. In some cases, one sect occupied the areas of the opposite sect, and the forest was cut and removed completely. During this period, most of the rangeland and forest cover was cleared in lower parts of Kurram, some patches in the mountainous area of Shalazan Tangi, and in the border area of village Pewar.

3.5.2. High Market Prices

The prices of timber and fuelwood have increased many times in just over a decade. In the past, fuelwood was transported from Afghanistan as well. In the year 2000, the per mound (37.3 kg) fuelwood price was less than PKR 50. As soon as import from Afghanistan was banned, the prices went up. In October 2019, the per mound fuelwood price was PKR 800 to PKR 900 in Parachinar Bazar. The high market prices are hardly affordable for the inhabitants. Whereas, forest wood extractions are allowed seasonally for a certain stipulated period of days, one or two times during a year. Only seasonally collected wood from the communal forest, however, does not meet the needs of the inhabitants for the entire year. Local people buy wood from the market or illegally harvest communal forests, which has intensified the process of deforestation in many villages.

3.5.3. Sale of Communal Forest

In few villages of District Kurram, conserved forest tracts are sold to a contractor through a joint decision of village elders. The contractor cut all the trees and the area converts from forest cover to barren land. This practice has been common in many villages of central and upper Kurram. According to a respondent
“Few forest tracts covered with dense forest had been conserved for several years in our village Jallandhar. These forest tracts named Bahira Jawara, Hamna Dara and Marchu Ghar were inaccessible to motorized transport and were sold to contractors one by one. The contractors built roads and cut all the forest using electric saws, and later on, the trees were uprooted using heavy machinery. Thus the forest of these tracts disappeared”.

3.5.4. Local Institutions

In District Kurram all forest resources, with the exception of a few hundred acres of Government Reserved Forest, have communal ownership. Forestry institutions of Pakistan have no role in the management of the communal forest. For management and proper utilization, villagers have developed local institutions called Rafaqyan which implement traditional utilization rights. In the past, these institutions were very strong in the entire Kurram District, and forest conservation and management were the responsibility of these institutions. Presently, they have lost their effectiveness, and sustainability-oriented management of forest resources is no longer sufficiently practiced in many villages, which is also one of the driving forces of deforestation.

4. Conclusions

The present study is an attempt to quantify temporal patterns of deforestation in District Kurram. The results of this study revealed continuous deforestation, and 48.2% of forest cover has been removed during the entire study period with considerable annual variations. A high rate of deforestation (2.4%) was recorded in period 1, which can be partially attributed to the data source of 1972. In addition, forest loss was also high (1.2%) in period 2 but reduced (0.2%) in period 3. The main driving forces behind this rate of deforestation was abrupt population change in the early two periods that rapidly increased due to political turmoil in Afghanistan. The results of this study revealed that in the post 2000 era, the rate of deforestation is continuously decreasing due to population change that is substantiating our argument of population growth and deforestation. Additionally, improvement in accessibility and extensions of the road network has also played a visible role in deforestation. Within 2 km of road, forest cover decreased from 20% in 1972 to 15% in 2019. The result of the study confirms that more accessible forests were severely degraded in the study area throughout the study period. That further confirms our second hypothesis of accessibility and forest loss.
Further in-depth research is needed to highlight contributing factors and to analyze interrelationships between ecological and socioeconomic driving forces in explaining the deforestation processes in remote mountain regions. The rate of deforestation can further be reduced by taking some forest conservation measures, including: 1. Government should take an interest in forest conservation by empowering and supporting local institutions; 2. The forest department should extend afforestation activities to the hilly and piedmont areas which have been degraded in the past, and the vast area is laying barren which can be brought under forest cover through plantations; 3. As mentioned earlier, most trees in the communal forest are cut for domestic energy requirements; deforestation can be further reduced if alternative energy sources are provided to local inhabitants at affordable rates; 4. Local communities should be involved in afforestation activities.

Author Contributions

Conceptualization, K.H. and F.R.; methodology, K.H.; software, K.H. and I.U. and Z.A.; validation, K.H., I.U. and Z.A.; formal analysis, K.H.; investigation, K.H.; data curation, K.H., Z.A. and I.U.; writing—original draft preparation, K.H.; writing—review and editing, K.H., U.S. and F.R.; visualization, K.H.; supervision, F.R. and U.S. All authors have read and agreed to the published version of the manuscript.

Funding

This research received no external funding.

Institutional Review Board Statement

Not Applicable.

Informed Consent Statement

Not Applicable.

Data Availability Statement

The new data created and presented in this study are available on request from the first author.

Conflicts of Interest

The authors declare no conflict of interest.

References

  1. Grover, V.I.; Borsdorf, A.; Breuste, J.; Tiwari, P.C.; Frangetto, F.W. (Eds.) Impact of Global Changes on Mountains Responses and Adaptation; CRC Press; Taylor & Francis Group: Boca Raton, FL, USA, 2015. [Google Scholar]
  2. Price, M.; Gratzer, G.; Alemayehu Duguma, L.; Kohler, T.; Maselli, D. Mountain Forest in a Changing World—Realizing Values, Addressing Challenges; FAO: Rome, Italy, 2011. [Google Scholar]
  3. FAO. State of the World‘s Forests—Enhancing the Socioeconomic Benefits from Forests; FAO: Rome, Italy, 2014. [Google Scholar]
  4. FAO. Global Forest Resource Assessment; Main Report; Food and Agriculture Organization: Rome, Italy, 2020. [Google Scholar]
  5. IPCC. Climate Change 2014; Synthesis Report: Contribution of Working Groups I, II and III to the Fifth Assessment Report of the Intergovernmental Panel on Climate Change; IPCC: Geneva, Switzerland, 2014. [Google Scholar]
  6. Hu, X.; Næss, J.S.; Iordan, C.M.; Huang, B.; Zhao, W.; Cherubini, F. Recent global land cover dynamics and implications for soil erosion and carbon losses from deforestation. Anthropocene 2021, 34, 100291. [Google Scholar] [CrossRef]
  7. Allen, C.J.; Barnes, D.F. The causes of deforestation in developing countries. Ann. Assoc. Am. Geogr. 1985, 75, 163–184. [Google Scholar] [CrossRef]
  8. Angelsen, A.; Kaimowitz, D. Rethinking the causes of deforestation: Lessons from economic models. World Bank Res.Obs. 1999, 14, 73–98. [Google Scholar] [CrossRef]
  9. Robinson, B.E.; Holland, M.B.; Naughton-Treves, L. Does secure land tenure save forests? A meta-analysis of the relationship between land tenure and tropical deforestation. Glob. Environ. Change 2014, 29, 281–293. [Google Scholar] [CrossRef]
  10. Haq, F.; Rahman, F.; Tabassum, I.; Farzana. Socio-economic factors threatening the sustainability of natural resource base in Roghani Valley, Hindu Raj Mountains, Northern Pakistan Pakistan. J. Soc. Sci. 2014, 34, 139–154. [Google Scholar]
  11. Leblois, A.; Damette, O.; Wolfersberger, J. What has driven deforestation in developing countries since the 2000s? Evidence from new remote-sensing data. World Dev. 2017, 92, 82–102. [Google Scholar] [CrossRef]
  12. Austin, K.G.; Schwantes, A.; Gu, Y.; Kasibhatla, P.S. What causes deforestation in Indonesia? Environ. Res. Lett. 2019, 14, 024007. [Google Scholar] [CrossRef]
  13. Ngwira, S.; Watanabe, T. An analysis of the causes of deforestation in Malawi: A case of Mwazisi. Land 2019, 8, 48. [Google Scholar] [CrossRef] [Green Version]
  14. Tejaswi, G. Manual on Deforestation, Degradation, and Fragmentation Unsing Remore Sensing and GIS. Strengthining Monitoring, Assessment and Reporting on Sustainable Forest Managemnet in Asia (GCP/INT/988/JPN); Forestry Department, Food and Agriculture Organization of the United Nations: Rome, Italy, 2007. [Google Scholar]
  15. Dhakal, M.; Masuda, M. Local pricing system of forest products and its relations to equitable benefit sharing and livelihood improvement in the lowland community forestry program in Nepal. For. Policy Econ. 2009, 11, 221–229. [Google Scholar] [CrossRef] [Green Version]
  16. Illukpitiya, P.; Yanagda, J. Farming vs. forests: Trade-off between agriculture and the extraction of non timber forest products. Ecol. Econ. 2010, 69, 1952–1963. [Google Scholar] [CrossRef]
  17. Rayamajhi, S.; Smith-Hall, C.; Helles, F. Empirical evidence of the economic importance of central Himalayan forests to rural households. For. Policy Econ. 2012, 20, 25–35. [Google Scholar] [CrossRef]
  18. Lax, J.; Kothke, M. Livelihood strategies and forest product utilisation of rural households in Nepa. Small-Scale For. 2017, 16, 505–520. [Google Scholar] [CrossRef]
  19. Ali, J.; Benjaminsen, T.A.; Hammad, A.A.; Dick, B. The road to deforestation: An assessment of forest loss and its causes in Basho Valley, Northern Pakistan. Glob. Environ. Change 2005, 15, 370–380. [Google Scholar] [CrossRef]
  20. Schickhoff, U. Human Impact on High Altitude Forests in Northern Pakistan: Degradation Processes and Root Causes. Biogeography and Biodiversity; Rawat Publications: New Delhi, India, 2009; pp. 76–90. [Google Scholar]
  21. Fernández-Llamazares, Á.; Helle, J.; Eklund, J.; Balmford, A.; Moraes, R.M.; Reyes-García, V.; Cabeza, M. New law puts Bolivian biodiversity hotspot on road to deforestation. Curr. Biol. 2018, 28, R15–R16. [Google Scholar] [CrossRef] [Green Version]
  22. Aguirre, J.; Guerrero, E.; Campana, Y. How effective are protected natural areas when roads are present? An analysis of the Peruvian case. Environ. Econ. Policy Stud. 2021, 23, 831–859. [Google Scholar] [CrossRef]
  23. Haq, N.U.; Haq, F.; Rahman, F.; Tabssum, I.; Ahmad, Z.; Tariqi, I.U. Extension of roads towards forest in Palas Valley Indus Kohistan, Hindu Kush-Himalayan Mountains, Pakistan. GeoJournal 2021, 1–15. [Google Scholar] [CrossRef]
  24. Milien, E.J.; Rocha, K.D.S.; Brown, I.F.; Perz, S.G. Roads, deforestation and the mitigating effect of the Chico Mendes extractive reserve in the southwestern Amazon. Trees For. People 2021, 3, 100056. [Google Scholar] [CrossRef]
  25. Cropper, M.; Puri, J.; Griffiths, C.; Barbier, E.B.; Burgess, J.C. Predicting the location of deforestation: The role of roads and protected areas in North Thailand. Land Econ. 2001, 77, 172–186. [Google Scholar] [CrossRef]
  26. Schickhoff, U. Ecological change as a consequence of recent road building: The case of the high altitude forests of the Karakorum. In Perspectives on History and Change in the Karakorum, Hindukush, and Himalaya. Cultural Area Karakorum, Scientific Studies 3; Stellrecht, I., Winiger, M., Eds.; R. Koppe: Koln, Germany, 1997; pp. 277–286. [Google Scholar]
  27. Schickhoff, U. Socio-Economic Background and Ecological Effects of Forest Destruction in Northern Pakistan. Karakorum-Hindukush-Himalaya: Dynamics of Change (Culture Area Karakorum, Scientific Studies, 4/I); Stellrecht, I., Ed.; R. Köppe: Köln, Germany, 1998; pp. 287–302. [Google Scholar]
  28. Schickhoff, U. Die Degradierung der Gebirgswälder Nordpakistans. Faktoren, Prozesse und Wirkungszusammenhänge in einem regionalen Mensch-Umwelt-System; Erdwissenschaftliche Forschung, Steiner Verlag: Stuttgart, Germany, 2002; p. 41. [Google Scholar]
  29. FAO. Global Forest Resource Assessment 2020; Report Pakistan; Food and Agriculture Organization of the United Nation: Rome, Italy, 2020. [Google Scholar]
  30. Siddiqui, K.M. Wood Fuel in the National Energy Balance. In RWEDP [Regional Wood Energy Development Programme], Proceedings of the National Workshop on Wood Fuel Production and Marketing, Faisalabad, Pakistan, 28–30 October 1997; Food and Agriculture Organization of the United Nations: Bangkok, Thailand, 2000; pp. 25–30. [Google Scholar]
  31. Hafeez, S.M. Bioenergy for Meeting Growing Needs. In RWEDP [Regional Wood Energy Development Programme], Proceedings of the National Workshop on Wood Fuel Production and Marketing, Faisalabad, Pakistan, 28–30 October 1997; Food and Agriculture Organization of the United Nations: Bangkok, Thailand, 2000; pp. 143–149. [Google Scholar]
  32. Nazir, N.; Olabisi, L.S.; Ahmad, S. Forest wood consumption and wood shortage in Pakistan: Estimation and projection through system dynamics. Pak. Dev. Rev. 2018, 57, 73–98. [Google Scholar] [CrossRef] [Green Version]
  33. Tole, L. Sources of deforestation in tropical developing countries. Environ. Manag. 1998, 22, 19–33. [Google Scholar] [CrossRef]
  34. FAO. Global Forest Resources Assessment 2010; Country Report Pakistan; Forestry Department, Food and Agriculture Organization of the United Nations: Rome, Italy, 2010. [Google Scholar]
  35. GoP. Pakistan’s Implementation of the 2030 Agenda for Sustainable Development—Voluntary National Review; SDG Section, Ministry of Planning, Development and Reforms: Islamabad, Pakistan, 2019. [Google Scholar]
  36. FAO. 2019 Forestry Sector Review: Pakistan; FAO: Islamabad, Pakistan, 2020. [Google Scholar] [CrossRef]
  37. Nazir, N.; Farooq, A.; Jan, S.A.; Ahmad, A. A system dynamics model for billion trees tsunami afforestation project of Khyber Pakhtunkhwa in Pakistan: Model application to afforestation activities. J. Mt. Sci. 2019, 16, 2640–2653. [Google Scholar] [CrossRef]
  38. Sahai, L.G. Assessment Repport of the Kurram Valley, 1905; Government Printing and Stationary, North West Frontire Provice: Peshawar, Pakistan, 1905.
  39. Khan, T.M. The Tribal Area of Pakistan: A Contemporary Profile; Sang-e-Meel Publications: Lahor, Pakistan, 2008; p. 376. [Google Scholar]
  40. Hussain, K. Demorgaphic Growth, Accessibility and Changes in Mountains Forest Cover: A Study of Kurram Agency (1970–2014); Department of Geography, University of Peshawar: Peshawar, Pakistan, 2016. [Google Scholar]
  41. Qamer, F.; Abbas, S.; Saleem, R.; Shehzad, K.; Ali, H.; Gilani, H. Forest cover change assessment in conflict-affected areas of northwest Pakistan: The case of swat and shangla districts. J. Mt.Sci. 2012, 9, 297–306. [Google Scholar] [CrossRef]
  42. Qasim, M.; Hubacek, K.; Termansen, M.; Khan, A. Spatial and temporal dynamics of land use pattern in District Swat, Hindu Kush Himalayan region of Pakistan. Appl. Geogr. 2011, 31, 820–828. [Google Scholar] [CrossRef]
  43. Bukhari, S.S.B.; Haider, A.; Laeeq, M.T. Land Cover Atlas of Pakistan; Pakistan Forest Institute: Peshawar, Pakistan, 2012.
  44. Shehzad, K.; Qamer, F.M.; Murthy, M.S.R.; Abbas, S.; Bhatta, L.D. Deforestation trends and spatial modelling of its drivers in the dry temperate forests of northern Pakistan: A case study of Chitral. J. Mt.Sci. 2014, 11, 1192–1207. [Google Scholar] [CrossRef]
  45. Brinkmann, K.; Noromiarilanto, F.; Ratovonamana, R.Y.; Buerkert, A. Deforestation processes in South-Western Madagascar over the past 40 years: What can we learn from settlement characteristics? Agric. Ecosyst. Environ. 2014, 195, 231–243. [Google Scholar] [CrossRef]
  46. Gautam, A.P.; Shivakoti, G.P.; Webb, E.L. Forest cover change, physiography, local economy, and institutions in a Mountain Watershed in Nepal. Environ. Manag. 2004, 33, 48–61. [Google Scholar] [CrossRef]
  47. Gong, P.; Pu, R.; Biging, G.S.; Larrieu, M.R. Estimation of forest leaf area index using vegetation indices derived from hyperion hyperspectral data. IEEE Trans. Geosci. Remote Sens. 2003, 41, 1355–1362. [Google Scholar] [CrossRef] [Green Version]
  48. Rozenstein, O.; Karnieli, A. Comparison of methods for land-use classification incorporating remote sensing and GIS inputs. Appl. Geogr. 2011, 31, 533–544. [Google Scholar] [CrossRef]
  49. Khan, S.R.; Khan, S.R. Assessing poverty deforestation links: Evidence from Swat, Pakistan. Ecol. Econ. 2009, 68, 2607–2618. [Google Scholar] [CrossRef]
  50. Lodhi, M.A.; Echavarria, F.R.; Keithley, C. Using remote sensing data to monitor land cover changes near Afghan refugee camps in northern Pakistan. Geocarto Int. 1998, 13, 33–39. [Google Scholar] [CrossRef]
  51. Schickhoff, U. Himalayan forest-cover changes in historical perspective: A case study in the Kaghan Valley, Northern Pakistan. Mt. Res. Dev. 1995, 15, 3–18. [Google Scholar] [CrossRef]
  52. Nüsser, M. Change and persistence: Contemporary landscape transformation in the Nanga Parbat region, northern Pakistan. Mt. Res. Dev. 2000, 20, 348–355. [Google Scholar] [CrossRef] [Green Version]
  53. Imbernon, J. A comparison of the driving forces behind deforestation in the Peruvian and the Brazilian Amazon. Ambio 1999, 28, 509–513. [Google Scholar]
  54. Deng, X.; Huang, J.; Uchida, E.; Rozelle, S.; Gibson, J. Pressure cookers or pressure valves: Do roads lead to deforestation in China? J. Environ. Econ. Manag. 2011, 61, 79–94. [Google Scholar] [CrossRef]
  55. Cropper, M.; Griffiths, C.; Mani, M. Roads, population pressures, and deforestation in Thailand, 1976–1989. Land Econ. 1999, 75, 58–73. [Google Scholar] [CrossRef]
  56. Southworth, J.; Tucker, C. The influence of accessibility, local institutions, and socioeconomic factors on forest cover change in the mountains of Western Honduras. Mt. Res. Dev. 2001, 21, 276–283. [Google Scholar] [CrossRef] [Green Version]
  57. Haq, F.; Rahman, F.; Tabassum, I.; Ullah, I.; Sher, A. Forest dilemma in the Hindu Raj Mountains Northern Pakistan: Impact of population growth and household dynamics. Small-Scale For. 2018, 17, 323–341. [Google Scholar] [CrossRef]
  58. Geist, J.H.; Lambin, E.F. What Drives Tropical Deforestation? A Meta-Analysis of Proximate and Underlying Causes of Deforestation Based on Subnational Case Study Evidence; LUCC International Project Office, Department of Geography, University of Louvain: Brussels, Belgium, 2001. [Google Scholar]
  59. Weinbaum, M.G. The Impact and the Legacy of the Afghan Refugees in Pakistan. In Contemporary Problems of Pakistan; Korson, J.H., Ed.; Pak Book Corp: Punjab, Pakistan; Westview Press: Boulder, CO, USA, 1993. [Google Scholar]
  60. Khan, A.; Garner, D.A.; Conner, C.M. Feasibility of GIS as a regional planning tool for sustainable development: A case study of Kurram and Orakzai Agencies of FATA. Pak. J. Geogr. 1993, 3, 1–18. [Google Scholar]
  61. Carter, L. Socio Economic Profile of Kurram Agency; Prepared for the Planning and Development Department NWFP; US Agency for International Devolopment Peshawar: Peshawar, Pakistan, 1991.
  62. GoP. Census Report of Federally Administered Tribal Areas (FATA); Population Census Organization: Islamabad, Pakistan, 1984.
  63. GoP. Block Wise Provisional Summary Results of 6th Population & Housing Census—2017. Available online: https://www.pbs.gov.pk/census-2017-district-wise/results/027 (accessed on 15 January 2019).
  64. GoP. Census Report of Kurram Agency; Population Census Organization Statistics Division Govrnment of Pakistan Islamabad: Islamabad, Pakistan, 2000.
  65. GoP. Population Sensus of Pakistan 1972. In Census Report of Kurram Agency; Census Report of Federally Administered Tribal Area (FATA); Census Organization Ministry of Interior, State and Frontier Regions: Islamabad, Pakistan, 1972. [Google Scholar]
  66. Hussain, K.; Haq, F.; Rahman, F. Shrinking greenery: Land use and land cover changes in Kurram Agency, Kohi Safid Mountains of north-western Pakistan. J. Mt. Sci. 2018, 15, 296–306. [Google Scholar] [CrossRef]
  67. Rahman, F.; Haq, F.; Tabassum, I.; Ullah, I. Socio-economic drivers of deforestation in Roghani Valley, Hindu-Raj Mountains, Northern Pakistan. J. Mt. Sci. 2014, 11, 167–179. [Google Scholar] [CrossRef]
  68. Zeb, A.; Hamann, A.; Armstrong, G.; Acuna-Castellanos, D. Identifying local actors of deforestation and forest degradation in the Kalasha valleys of Pakistan. For. Policy Econ. 2019, 104, 56–64. [Google Scholar] [CrossRef]
  69. Zeb, A.; Armstrong, G.W.; Hamann, A. Forest conversion by the indigenous Kalasha of Pakistan: A household level analysis of socioeconomic drivers. Glob. Environ. Change 2019, 59, 102004. [Google Scholar] [CrossRef]
Figure 1. Location Map of district Kurram, major settlements and roads network.
Land 11 00810 g001
Figure 2. Land use and land cover of District Kurram (1972–2019) with Afghan refugee camps in 1987 and 2000 images. Source: Classified images of 1972, 1987, 2000 and 2019.
Land 11 00810 g002
Figure 3. Change detection in land use and land cover classes in all three periods.
Land 11 00810 g003
Figure 4. Land use and land cover around 3 km of refugee camps.
Land 11 00810 g004
Figure 5. Forest harvesting and transporting mechanisms in different villages of District Kurram. Source: Photos in different parts of Kurram Valley © Kamal Hussain, between 2015 and 2019.
Land 11 00810 g005
Figure 6. Land use and land cover around 3 km of refugee camps.
Land 11 00810 g006
Figure 7. Road length in different years. Source: [58,59,60] (Construction and Work Department Parachinar 2019).
Land 11 00810 g007
Figure 8. Land use and land cover within 2 km of roads from 1972 to 2019.
Land 11 00810 g008
Figure 9. Road construction on top of Mundaire Mountain for border protection. Source: Photo © Kamal Hussain, 12 April 2020).
Land 11 00810 g009
Table 1. Land use/land cover and changes in District Kurram (1972 to 2019).
Land Use ClassesLand Use Land Cover in %Periodic Change in %
1970198720002019Period 1Period 2 Period 3 Total
Forest cover33.221.317.917.2−36.0−15.7−4.0−48.2
Agricultural land10.914.716.118.434.89.913.968.8
Rangeland46.14341.340−6.7−4.1−2.9−13.0
Bare soil/rocks 818.322.117.8127.220.7−19.6120.6
Snow cover0.10.90.74.7 −20.0562.50.0
Water bodies1.41.91.91.912.5−14.316.512.3
Total100100100100
Annual Deforestation rate−2.4−1.2−0.2−0.98
Source: Classified images of 1972, 1987, 2000 and 2019.
Table 2. Land use and land cover conversion in all three time periods (percentage out of total area).
LC ClassesPeriodsBare Soil/RocksForestAgricultural LandRangelandWater BodiesSnow Cover
Bare soil/rocksP12.20.80.83.50.300.40
P210.82.41.24.10.170.17
P37.75.21.03.60.100.10
ForestP18.916.52.77.40.200.10
P24.013.00.83.40.020.12
P33.78.80.94.90.000.00
Agricultural landP11.31.07.90.40.070.02
P22.40.77.72.50.220.00
P34.01.56.26.40.400.00
RangelandP16.42.96.128.60.160.88
P25.51.86.030.00.440.00
P34.41.64.527.80.000.50
Water bodiesP10.00.00.00.00.050.00
P20.120.010.370.510.910.00
P30.200.000.400.500.700.00
Snow coverP10.000.000.000.000.000.00
P20.320.040.070.020.010.41
P33.000.700.100.200.100.60
TotalP118.821.217.539.90.81.4
P223.117.916.140.51.80.7
P323.017.813.143.41.31.2
Source: GIS analysis.
Table 3. Correlations between population density and forest cover change.
Forest CoverPopulation
Forest coverPearson Correlation1−0.906
Sig. (1-tailed) 0.047
N44
PopulationPearson Correlation−0.9061
Sig. (1-tailed)0.047
N44
Source: SPSS analysis.
Table 4. Afghan refugee camps with families and population in District Kurram in 1989 and 2005.
1989S. No.Camps NameNo. of FamiliesPopulationS. No.Camps NameNo. of FamiliesPopulation
1Ahmadi Shama174911,31719Old Bagzai219915,524
2Arawali765585820Parachinar111888548
3Asgharo 1940739321Parachinar2179812,544
4Asgharo 21293934022Saraghura147111,299
5Asgharo 3135410,15823Shashu196313,876
6Asgharo 4745641324Shabak12588824
7Bushera167912,87225Satin 1149611,304
8Bassu1343733326Satin 27815660
9Chappri134010,04227Tindo 1146910,333
10Durrani1105759328Tindo 29897048
11Gerzandi129510,88429Khapyanga 1162710,028
12Gawaki164111,31330Khapyanga 2166410,067
13Ghuzgari772603931Khapyanga 3264317,230
14Muzaffer Kot1046818532Khapyanga 415129078
15Matasangar180914,45633Zamo235815,166
16New Bagzai1241117,38334Bachelors 1500
17New Bagzai 2212813,633Total of (1989)49,298347,849
18New Bagzai 314679608
20051Tindo 2591230,8165Old Bagzai226511,182
2Shashu171212,0476Outside camps392925,256
3CR 2 (Baggan)446722,881Total of (2005)20,477114,801
4Muzaffer Kot219212,619
Source: Carter [61]; Afghan Refugees Commissionerate Office Peshawar (2005).
Table 5. Population statistics of District Kurram.
YearsPopulation (Persons)Density (sq. km)Annual Growth Rate (%)
LocalRefugeesBothLocalRefugeesBothLocal
1972279,998 279,99883 83
1981294,362347,860642,222871031900.59
1998448,310347,860796,1701331032362.5
2017615,372 615,372182 1821.68
Source: [61,62,63,64,65].
Table 6. Land use and land cover changes within 3 km of refugee camps (%).
Class NameYearsChange in Periods
1972198720002019Period 1Period 2Period 3
Forest cover18.925.014.038.07−73.53−19.44100.00
Agriculture land9.6011.4014.8814.1918.8430.49−4.67
Rangeland61.0675.6671.3567.8223.92−5.70−4.95
Bare soil/rocks9.185.567.657.15 37.50−6.55
Water bodies1.252.362.092.7888.89−11.7633.33
Source: GIS analysis.
Table 7. Household size and housing units in District Kurram.
YearsHousehold SizeHouses Units% Increase (1972–2017)
19727.816,196315.1
19817.837,907
199810.639,445
20179.267,244
Source: [62,63,64,65].
Table 8. Land use land cover within 3 km of local settlements.
Class NameYearsPeriods
1972198720002019Period 1Period 2Period 3
Forest cover35.622.218.717.7−37.5−16.0−5.0
Agricultural land14.516.417.424.612.96.141.4
Rangeland43.940.239.636.3−8.3−1.6−8.4
Bare soil/rocks6.118.422.117.9201.420.3−19.2
Snow cover0.00.30.00.8 −92.9
Water bodies2.22.52.22.513.7−10.313.5
Table 9. Correlations between road length and forest cover change.
Forest CoverRoads
Forest coverPearson Correlation1−0.927
Sig. (1-tailed) 0.036
N44
RoadsPearson Correlation−0.9271
Sig. (1-tailed)0.036
N44
Source: SPSS analysis.
Table 10. Land use and land cover changes within 2 km of roads (%).
Class nameYears
1972198720002019
Forest cover20.717.715.815.3
Agriculture land23.418.618.326.5
Rangeland46.046.743.537.4
Bare soil/rocks7.013.419.718.5
Snow cover0.00.20.10.0
Water bodies2.83.42.62.6
Source: Buffer analysis in ArcGIS.
Publisher’s Note: MDPI stays neutral with regard to jurisdictional claims in published maps and institutional affiliations.

