Article

Impact Mechanism of the Urban Network on Carbon Emissions in Rapidly Developing Regions: Example of 47 Cities in Southwest China

College of Architecture and Environment, Sichuan University, Chengdu 610065, China
*
Author to whom correspondence should be addressed.
Land 2022, 11(4), 458; https://doi.org/10.3390/land11040458
Submission received: 2 March 2022 / Revised: 18 March 2022 / Accepted: 22 March 2022 / Published: 23 March 2022
(This article belongs to the Special Issue The Eco-Environmental Effects of Urban Land Use)

Abstract

:
Southwest China faces harsh environmental pollution challenges and rapid development. Against this backdrop, exploring the impact mechanism of the urban network on carbon emissions in rapidly developing regions is of great significance to the balance between regional development and carbon emissions reduction, as well as regional sustainable development. The objective of this study is to quantify the relationship between carbon emissions and the urban network, using panel data analysis for 47 cities in southwest China from 2010 to 2019. Therefore, several urban network indices were selected and quantitatively studied by using the spatial Durbin model to reveal the impact mechanism of the urban network on carbon emissions in rapidly developing regions. The results show that: (1) the growth of carbon emissions in a city has a significant positive spatial spillover effect on the surrounding areas; (2) the temporal and spatial distribution of carbon emissions is highly coincident with the urban network; (3) the urban network has a two-sided impact mechanism of promoting and inhibiting carbon emissions; and (4) the effect of the impact mechanism is affected by regional development conditions, and the promotion effect plays the main role in rapidly developing regions.

1. Introduction

Global carbon emissions increased by 3.5% from 2017 to 2019 [1]. Although in 2020 global carbon emissions were significantly reduced because of COVID-19 [2], they have once again aroused widespread concern globally. At the 75th General Assembly of the United Nations in 2020, China proposed for the first time achieving a carbon peak by 2030 and carbon neutralization by 2060. Meanwhile, China put forward the “double control” system to control the carbon emissions intensity, which essentially controls total carbon emissions intensity [3]. Subsequently, Bosch, Pepsi, IKEA and other world-famous enterprises proposed carbon reduction targets. Based on the data from the economic industry, environmental protection, and land use [4,5,6], scholars worldwide have quantitatively studied climate change and carbon emissions through mathematical models and sensitivity analysis [7,8,9,10]. Then, specific studies on various factors that influence carbon emissions have been developed [11,12,13,14].
As major carriers of energy consumption and carbon emissions, cities are important research objects for exploring the factors affecting carbon emissions. The literature highlighted three important aspects. First, different types of urban land were found to have different effects on carbon emissions: an increase in residential, industrial and commercial areas significantly increases carbon emissions [15,16]. The increase in land-use intensity and mixed degree reduces carbon emissions by improving the utilization efficiency of public resources and reducing traffic volume [17,18]. Second, urbanization is another important factor affecting carbon emissions. Urbanization can accelerate the growth of carbon emissions through the influence of population and GDP [19,20,21]. However, some scholars found that upgrading the industrial structure and improving the production level cause carbon emissions to decline when urbanization develops to a certain stage, and an inverted “U” relationship eventually forms between urbanization and carbon emissions [14,22,23]. Third, the urban spatial form is closely related to carbon emissions [24]. Larger urban areas and more complex forms reduce carbon emission efficiency [25,26]. In contrast, more compact cities have improved carbon emission efficiency [27,28,29]. At present, research on the relationship between cities and carbon emissions only focused on the city-level aspects, such as the economy, industry, and space, but ignored the interaction between cities. This interaction can affect the degree of development of regions and cities through regional cooperation and competition [30,31,32], and then affects carbon emissions through the urban scale, economic production, transportation, and other forms. Therefore, by discussing the interactions between cities on a regional scale, this study provides a theoretical basis for urban carbon reduction and serves as a reference for scientific urban layouts.
The compression of time and space brought about by the transportation and information revolution has significantly changed the development process of the urban systems. Consequently, the connection between cities has broken through the boundary limit of traditional planning theory and has formed a cross-regional network connection [33,34]. Urban network theory is based on the complementary regional functions and a specialized division of labor, and the research focus has shifted to the relationship between cities from the traditional urban hierarchy and spatial distribution [35,36]. At present, urban network theory primarily analyzes the interaction between cities from the perspectives of traffic flow, information flow, and enterprise organization, and reveals their effects [37,38,39]. Zhang et al. (2021) and Lao et al. (2016) used air passenger flow to verify the diamond structure of China’s urban network and found that the transportation network promoted balanced regional development [40,41]. Xia et al. (2019) concluded that the bi-directional flow between cities has a significant impact on the city and urbanization levels by analyzing the flow of people and information among the megacities in the middle reaches of the Yangtze River [42]. Cheng and Zhao (2015) found that the urban network promoted the regional division of labor and specialized production to a certain extent on the basis of the headquarters–branch relationship [43]. The development of cities, the change in the regional division of labor, and the flow of resources have brought about changes in carbon emissions, indicating that urban networks affect carbon emissions.
According to the Northan Curve of urban development research, when the urbanization rate is between 30% and 70%, the city is in a period of rapid development. Compared with developed regions, rapidly developing regions face more severe carbon emissions problems because of urban expansion, population growth, and industrial agglomeration. However, most existing studies focused on developed regions, and insufficient attention was paid to rapidly developing regions.
Southwest China is in a period of rapid urban development, with the urbanization rate increasing from 39.76% to 56.50% from 2010 to 2020 [44]. This increased rate was accompanied by a surge in carbon emissions, making the carbon emissions situation increasingly critical. Therefore, this study was conducted in southwest China, including 47 cities and states distributed in Sichuan, Yunnan, and Guizhou. This study investigates the relationship between the urban network and carbon emissions through a social network analysis and the spatial Durbin model and reveals the urban network mechanism on carbon emissions in rapidly developing regions.
On the one hand, this paper innovates the research perspective of the influencing factors on carbon emissions, which is conducive to reducing carbon emissions during rapid development. On the other hand, this paper explores how to balance the relationship between rapid regional development and carbon emissions through the two-sided impact of the urban network. The conclusions of this study are helpful to provide guidance for the low-carbon development of southwest China and provide action references for other fast-growing regions.

2. Materials and Methods

2.1. Research Area

In this study, southwest China refers to three provinces and one municipality, Sichuan, Yunnan, Guizhou, and Chongqing, and includes 47 cities (Figure 1). The seventh national census in 2021 showed that the region’s total population has reached 201.5 million, and the region has a total area of 1.14 million square kilometers [45]. In recent years, Chengdu–Chongqing Urban Agglomeration and Central Yunnan Urban Agglomeration—important economic growth poles in western China providing important support for the “Belt and Road” strategy and the “Yangtze River Economic Belt” strategy—have brought unprecedented opportunities for development in southwest China [46,47]. From 2010 to 2019, southwest China has achieved a GDP growth of 1.92 times and an urbanization rate increment of 14.01%, becoming one of the typical regions with the fastest economic growth in China [44]. However, southwest China is restricted by geographical conditions and still has large gaps in regional development levels and low overall development. This situation shows that the driving role of Chengdu, Chongqing, Kunming, and other central cities to the remote areas is not noticeable, and regional production cooperation and the economic radiation effect are insufficient [48]. From the urban network perspective, these problems are caused by the fact that the efficient circulation of a variety of resources between central cities and remote areas is unachievable, because of the immature urban network and the geographical and distance barriers.
The urban network plays a significant role in promoting the overall development of a region. However, it also affects the figure and spatial distribution of carbon emissions through industrial agglomeration, regional division of labor, and population flow. From 2010 to 2019, the environment in southwest China continued to deteriorate during the rapid development process, with carbon emissions increasing by 23.4%. Given rapid economic and carbon emissions growth, exploring the impact mechanism of the urban network on carbon emissions is of significant importance to maintaining the balance between regional development and carbon emissions reduction, and promoting the realization of carbon peak in southwest China. In addition, this exploration provides a salutary lesson for other rapidly developing regions.

2.2. Data Sources

The data on 2010–2019 railway trains and stations used in this study are from the China Railway [49]. The data on the GDP, population and energy balance sheet of each city and state are from the statistical yearbooks (2011–2020) of Chongqing, Sichuan, Guizhou, and Yunnan [44,50,51,52].

2.3. Research Methods

First, this study measures the urban network and carbon emissions of southwest China during several years through social network analysis and carbon emissions calculation formula. The data were used to realize the visualization expression of the spatial-temporal distribution of the urban network and carbon emissions with the assistance of urban geographic information and ArcGIS, to intuitively analyze their evolutionary characteristics. Then, this study uses the spatial Durbin model to reveal and quantify the impact, and its mechanism, of the urban network on carbon emissions. The main research methods are as follows.

2.3.1. Social Network Analysis

Social network analysis is a method used to analyze the status of a node, the correlations between nodes, and the entire network. This method is a common approach in fields such as economics and management. In addition, this method has been widely used in recent years in spatial structure research on urban agglomeration [53]. By using social network analysis to measure the centrality, network density, network efficiency, and other indicators of the urban network in southwest China, this study discusses the evolutionary characteristics of the urban network.
  • Degree Centrality (DC)
DC measures a certain city’s connection ability, importance, and level in the network. Improvements in connection ability can promote the local economy, and production activities, and the overall development of the regional economy by strengthening the division of labor and cooperation among regions, thus having a stronger impact on carbon emissions. The larger the degree centrality, the closer the connection between the city and other cities in the network, and the higher the city’s level in the urban network [54]. For a directed urban network, the DC of one city includes two parts: in-degree centrality and out-degree centrality.
D C i = I D C i + O D C i
I D C i = j = 1 k T i j
O D C i = j = 1 k T j i
where D C i , I D C i , and O D C i are the degree centrality, in-degree centrality and out-degree centrality of city i ; k is the number of urban network nodes;   T i j   and T j i are the contact times of in-degree and out-degree between city i   and   j .
2.
Closeness Centrality (CC)
CC measures the sum of the shortest distances between one city and all other cities to express the contact degree between the node and other nodes. A larger CC means that reaching other cities is easier. The expectation is that less traffic carbon emissions can be generated in the contact network [54].
D i = j = 1 n d i j   , i j
where d i j is the shortest distance between city i and j .
3.
Network Density (ND)
ND indicates the development degree of the urban network. A larger ND indicates a closer relationship between cities and a more mature urban network [55].
ND = T k k 1
where k is the number of urban network nodes; T is the actual number of contacts in the city network.
4.
Network Centralization (NC)
NC indicates the centrality of the entire urban network [56]. An NC closer to 1 indicates a concentrated urban network distribution. An NC closer to 0 indicates a more balanced urban network distribution.
NC = i = 1 k   C m a x C i m a x i = 1 k   C m a x C i
where k is the number of urban network nodes; C m a x is the maximum DC of the network; C i is the DC of city i .
5.
Eff Size (ES)
ES measures the non-redundant factor in the network [57].
E S i = j   1 q p i q m j q ,   q i ,   j
where j is all cities connected to city i ; q is the other cities except i and j ; p i q m j q is the redundancy between city i and city j .
6.
Constra (CST)
CST indicates the degree to which one city directly or indirectly depends on other cities, which is the control ability and pivotal role of one city in the network connection [57]. A stronger pivotal role of the city results in a more frequent flow of various resources and economic activities that affects carbon emissions.
C S T i j = p i j + q p i q p q i 2
where j is all cities connected to city i ; p i j is the proportion of the connection between city i and j in all the connections of city; i , p i q , p q i is the indirect connection between city i and j through another city q .
7.
Node Connection Efficiency (NCE)
NCE represents the connection efficiency and speed of one city in the network given the ratio of the number of high-speed trains in one city to all trains. A higher NCE results in a lower time cost of inter-city connections and a higher production efficiency, which further influence carbon emissions.
N C E i = T i h T i
where T i h is the number of high-speed trains passing through city i ; T i is the number of all trains passing through city i .
8.
Node Symmetry (NS)
NS represents the strength of the siphon effect of one city in the network by the ratio of arriving trains to all trains. The enhancement of the siphon effect brings about the agglomeration of population and industry, which is expected to lead to an increment in carbon emissions.
N S i = T i a T i
where T i a is the number of arriving trains in city i ; T i is the number of all trains passing through city i .

2.3.2. Calculation of City-Level Carbon Emissions

Because city-level carbon emissions cannot be directly obtained from the public data, these data are calculated indirectly. The calculation method is common and is based on the energy consumption per unit of GDP and the GDP of the secondary and tertiary industries [58]. In this study, the energy consumption of each city is calculated according to the GDP ratio of primary, secondary, and tertiary industries and the permanent resident population in the entire province. Finally, the carbon emissions of each city and state are obtained by multiplying the carbon emission coefficient of standard coal. The calculation formula is as follows:
C E i = C E f × F G D P i F G D P + C E s × S G D P i S G D P + C E t × T G D P i T G D P + C E l × P O P i P O P × k
where C E f ,   C E s , C E t , and C E l , respectively, refer to the energy consumption of the primary, secondary, and tertiary industries and the domestic consumption of the entire province (unit: 10,000 tons of standard coal); F G D P ,   S G D P , T G D P , P O P , and F G D P i , S G D P i , T G D P i , P O P i , respectively, refer to the GDP of the primary, secondary, and tertiary industries (unit: 100 million yuan) and the permanent resident population (unit: 10,000 people) of the entire province and city i ; k is the carbon emission coefficient of standard coal.

2.3.3. Spatial Durbin Model

Theoretical research and current situation analysis showed that spatial agglomeration [59] and spatial spillover [60] are the two main characteristics of carbon emissions. Therefore, a spatial Durbin model approach was used to perform the analysis. The spatial Durbin model is one of the spatial econometric models, which take into account both spatial lags of dependent and explanatory variables [61]. A major advantage of the spatial Durbin model is that it can overcome the shortcoming that each variable is independent in the traditional regression model, make up for its spatial limitations [62], and explore the impact of the geographical proximity on variables, to quantify the urban network’s impact on carbon emissions and its spatial spillover effect.
  • Variable selection
In this study, carbon emissions were selected as the explained variable; DC was the core explanatory variable; and CC, NCE, NS, CST and ES were used as control variables. To eliminate the influence of different variable dimensions on the regression analysis, all variables were logarithmically processed. The descriptive statistics for each variable are shown in Table 1.
2.
Research method
The spatial spillover effect is the premise of the spatial Durbin model. Therefore, the spatial autocorrelation analysis was used to detect the spatial spillover effect of carbon emissions in southwest China using the Global Moran’s I. The Global Moran’s I is one of the most well-known tools for assessing the spatial agglomeration dependence of one phenomenon or attribute value in an entire region [63]. The calculation formula is as follows:
I = n i = 1 n j = 1 n W i j X i a X ¯ a X j b X ¯ b i = 1 n j = 1 n W i j i = 1 n X i a X ¯ a X j b X ¯ b
where, n is the total number of cities in the research area; W i j is the spatial weight matrix;   x i a and x j b are the values of attribute a for city i and attribute b for city j , respectively; x ¯ a and x ¯ b are the average values of attribute a and b , respectively. The value range of I is [−1, 1]. When I > 0, the spatial correlation is positive; a larger I indicates a stronger positive correlation. When I = 0, no spatial correlation exists. When I < 0, the spatial correlation is negative; a smaller I indicates a stronger negative correlation.
The spatial Durbin model reflects the impact of carbon emissions from surrounding cities through a spatial weight matrix. GeoDa software was used to generate contiguity weights on the basis of rook contiguity. The calculation rule is as follows: if city i and city j have the same edge, then W i j = 1 ; otherwise, W i j = 0 , and the diagonal entry is 0. To avoid the influence of regions on the results, the contiguity weight is standardized to make the sum of the elements in each row equal to 1.
Based on the algorithm of the spatial Durbin model [61], the formula is set as follows:
l n C E i t = ρ W l n C E i t + β 1 l n D C i t + β 2 l n C C i t + β 3 l n N C E i t + β 4 l n N S i t + β 5 l n C S T i t + β 6 l n E S i t + θ 1 W l n D C i t + θ 2 W l n C C i t + θ 3 W l n N C E i t + θ 4 W l n N S i t + θ 5 W l n C S T i t + θ 6 W l n E S i t + ε
where ρ   is the spatial autoregressive coefficient, β i is the regression coefficient of the explanatory variables; θ i is the regression coefficient of spatial lag term of explanatory variables; ε is the residual term of the model; i refers to city i ; t refers to year.

3. Results and Analysis

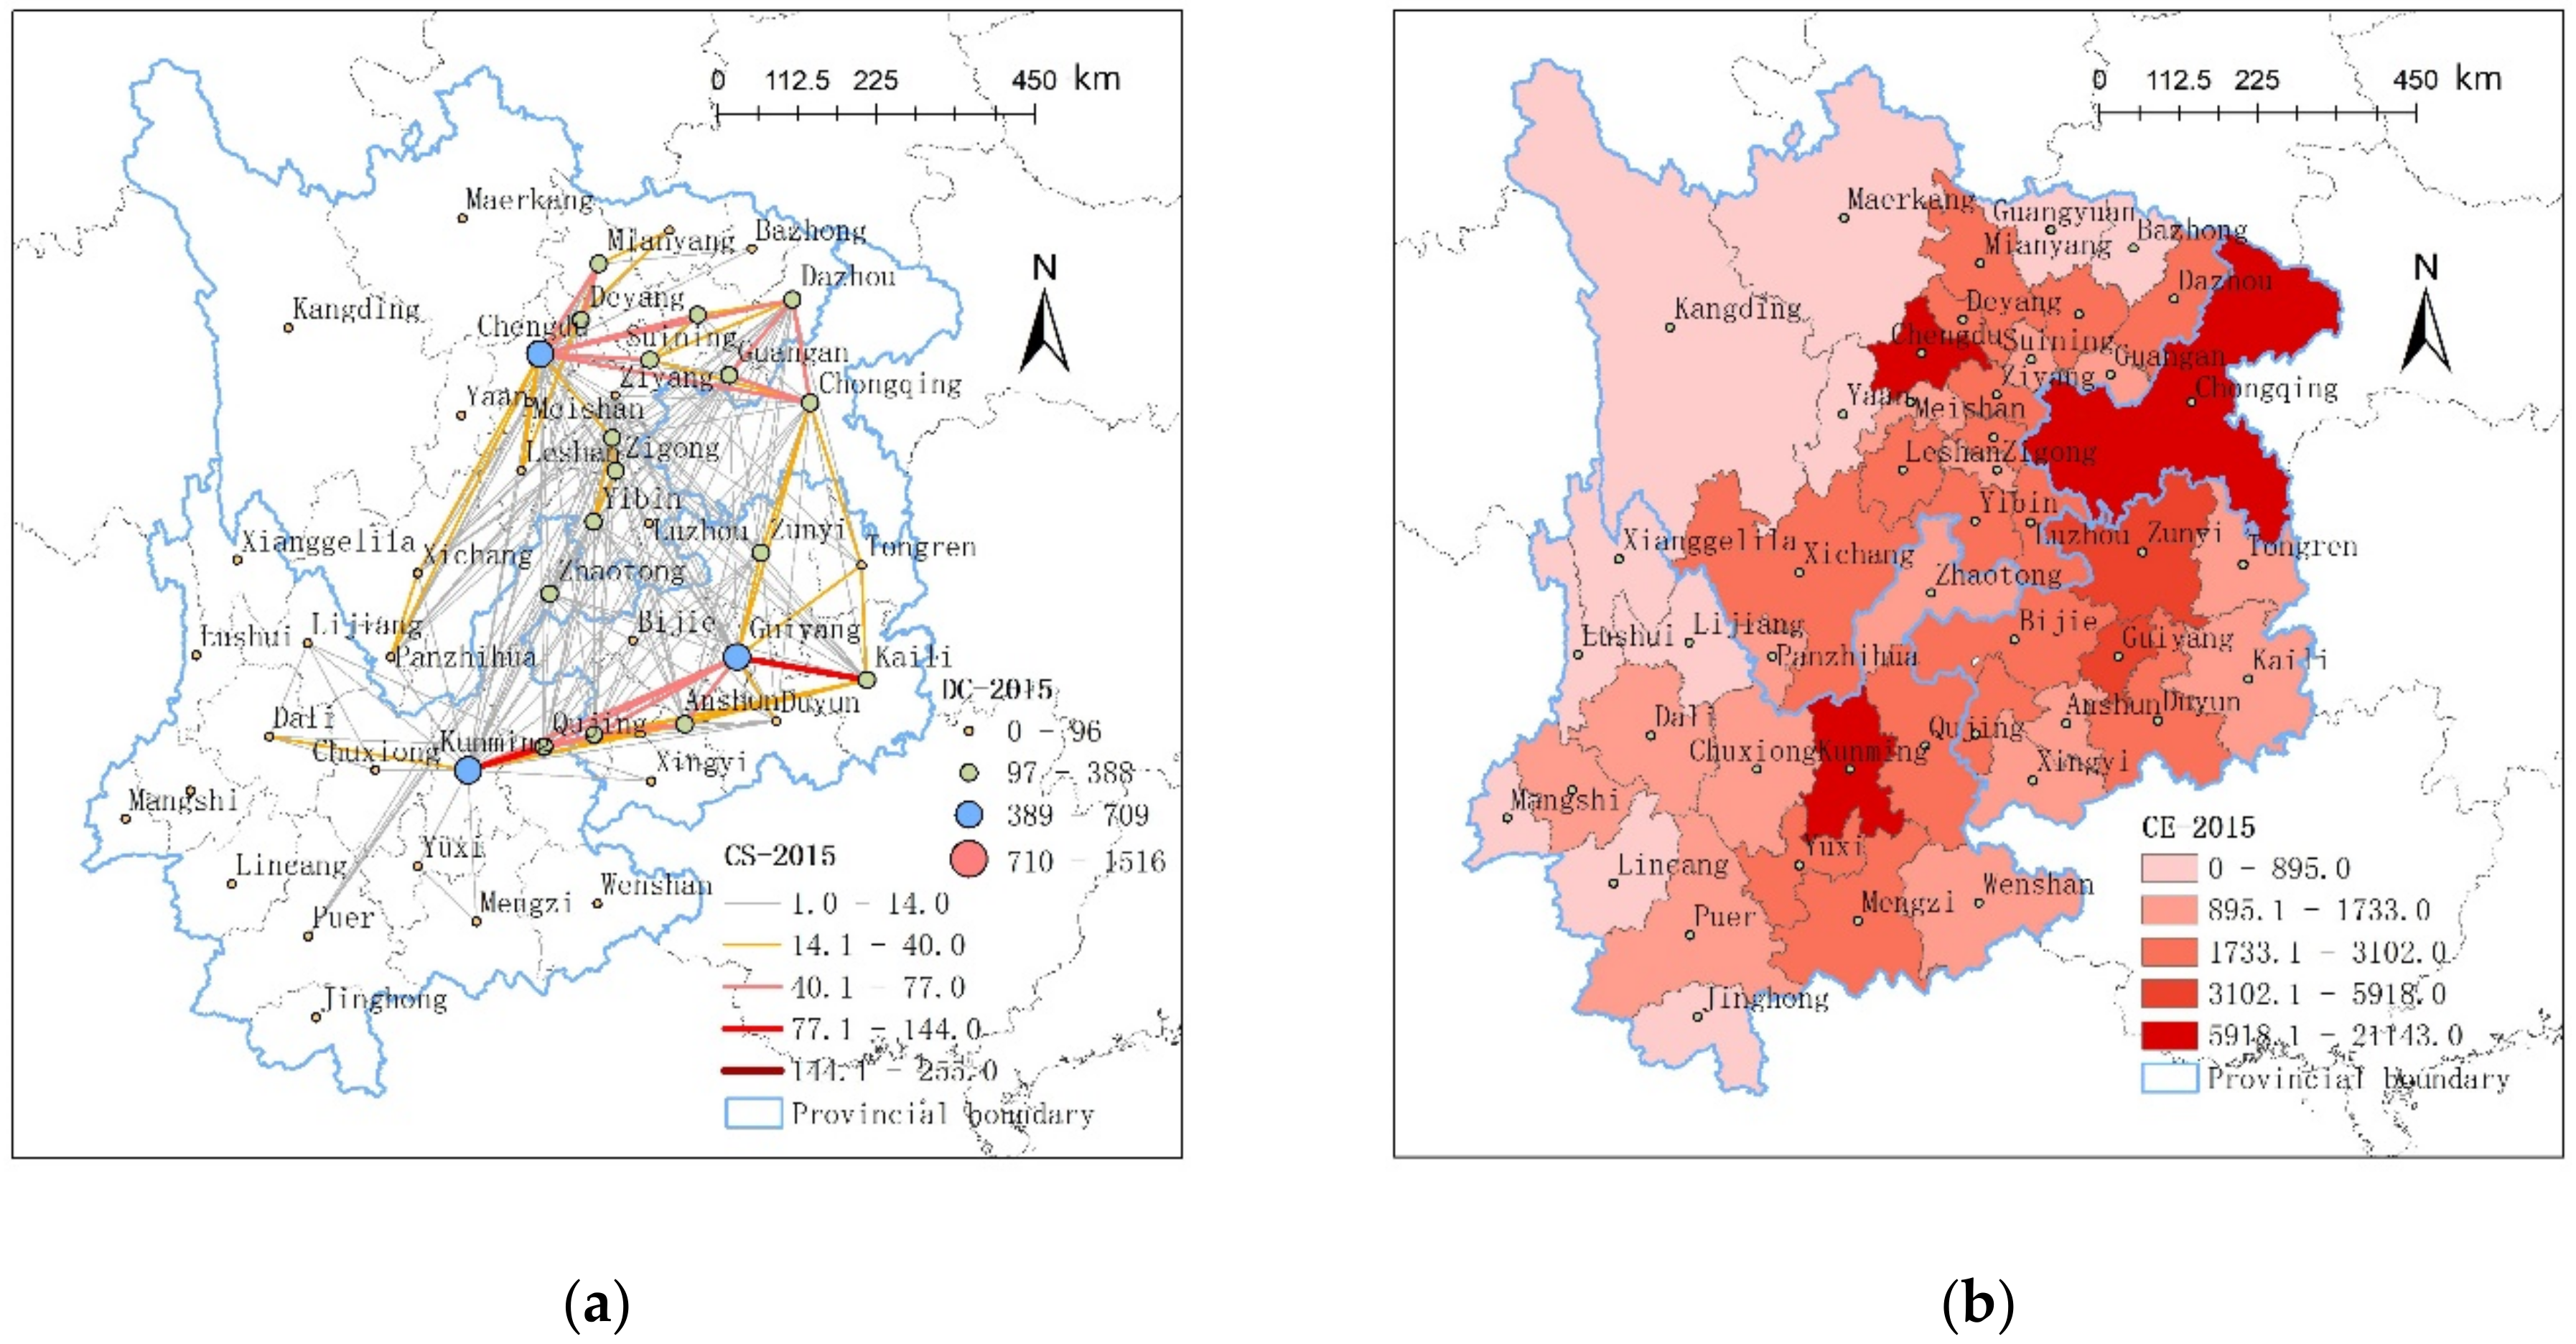
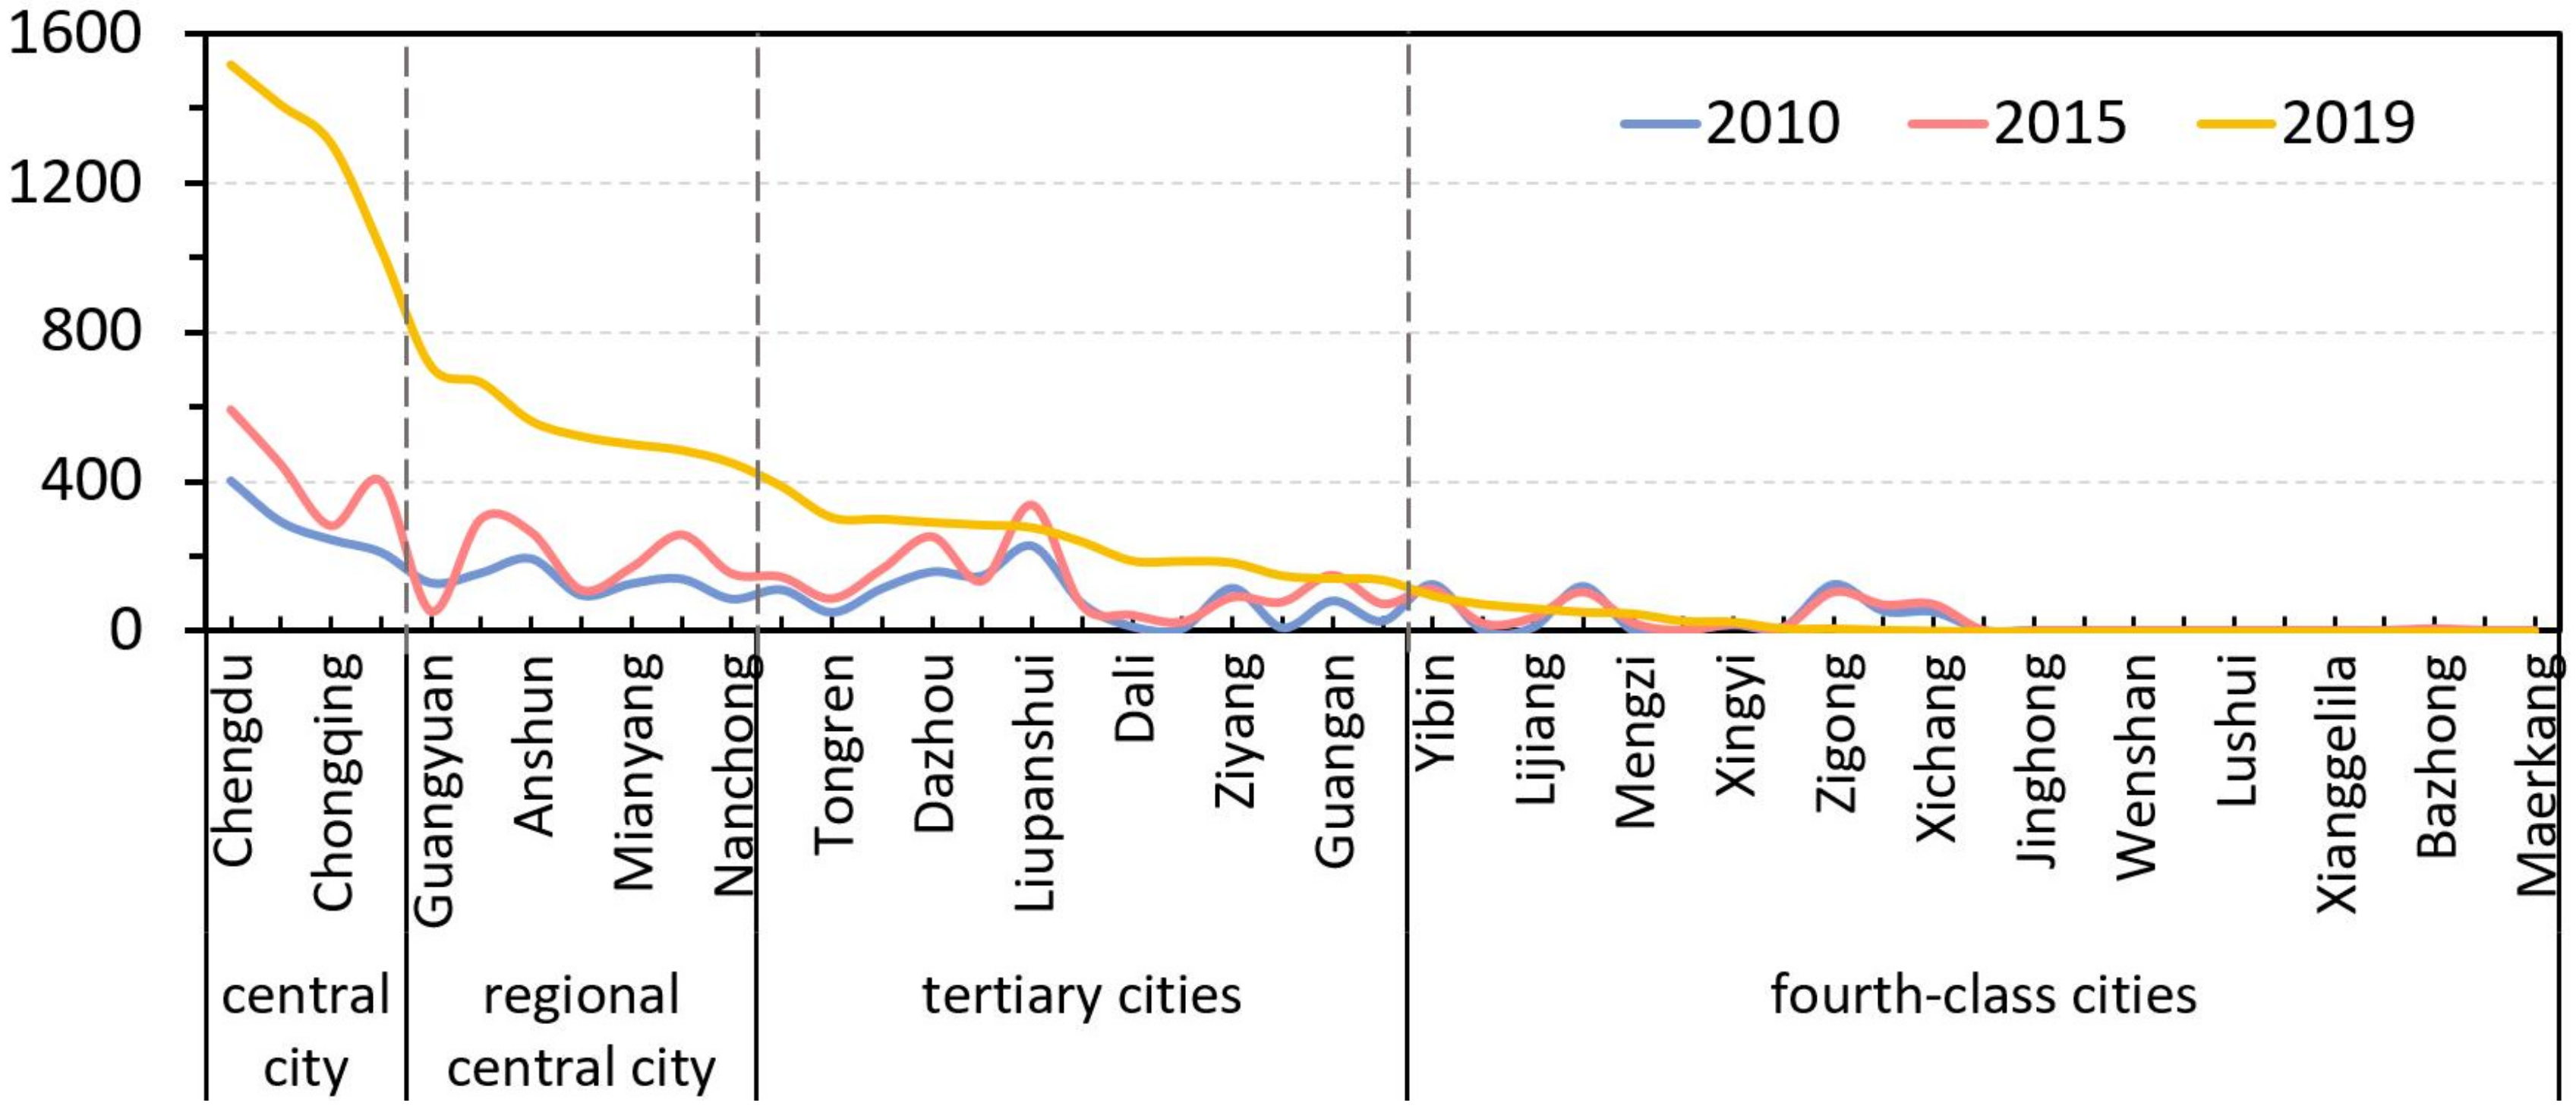
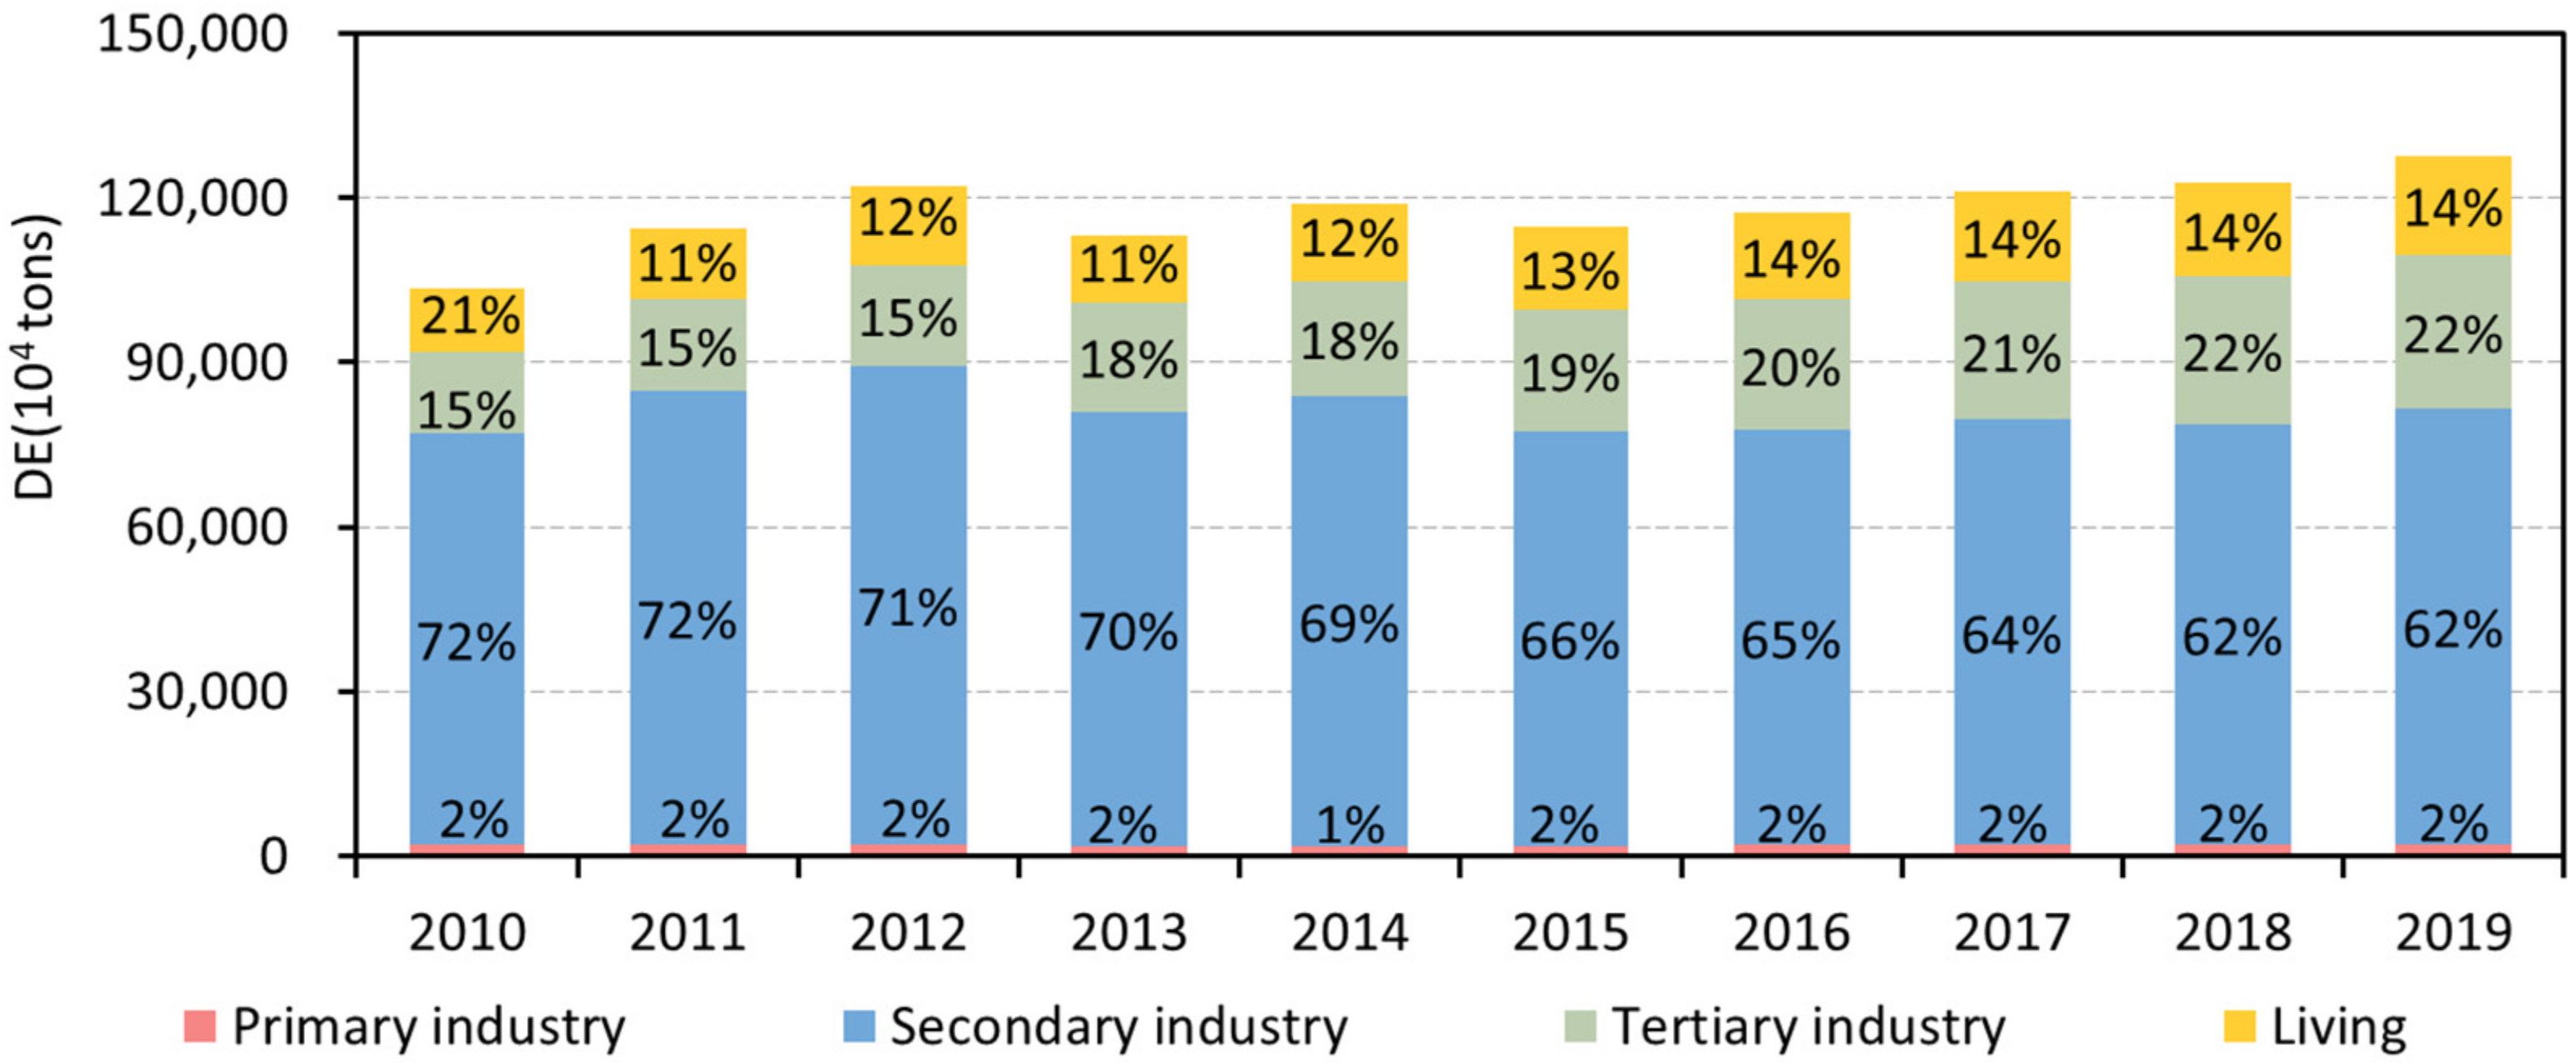
3.1. Evolutionary Characteristics of the Urban Network and Carbon Emissions

The urban ND, DC and carbon emissions of southwest China in 2010, 2015, and 2019 were divided into different grades by natural breaks. Visualization of the urban network and carbon emissions was realized by combining the geographical information of each city. To preliminarily judge whether the urban network affects carbon emissions, this section analyzes the evolutionary characteristics of both.
From 2010 to 2015, given the continuous improvement in urban ND in southwest China, the connection between cities became closer and the network distribution became more balanced. Simultaneously, carbon emissions increased. Both the urban network and carbon emissions entered a rapidly increasing stage after 2015 (Table 2). In general, they had the same developmental trend, which requires further analysis.
In 2010, the major contacts in southwest China were concentrated in Chengdu, Chongqing, Kunming, Guiyang and their surrounding cities, whereas the inter-provincial contact between regions was relatively weak (Figure 2a). The urban network had the characteristics of a low-level connection, a small scale, and centralization, indicating that the urban network was still in its infancy. The urban hierarchical structure exhibited a low-level flattening trend. The urban ties were loose for the urban network, and the radiation capacity of cities was weak, resulting in few tertiary cities and many fourth-class cities in remote areas (Figure 2a).
The spatial distributions of the urban network and carbon emissions were highly coincident (Figure 2b). Cities with high carbon emissions were identified in the urban network. In addition, the higher-level cities in the urban network, such as Chengdu, Chongqing, Kunming, Guiyang, and their surroundings, usually produced higher carbon emissions.
In 2015, the dominant flows in southwest China broke the boundaries of the administrative regions. Chengdu, Chongqing, and its surrounding cities—Mianyang, Suining, Guang’an and Dazhou—formed the Chengdu–Chongqing urban agglomeration, which was the tightest urban network in the region. The urban network of the southeastern part was further improved, forming the central Yunnan and central Guizhou urban agglomerations (Figure 3a). However, the topographic features in the central part of southwest China significantly restricted the relationship between the cities, which led to a lack of close network connections among the three major urban agglomerations in the south and north. Consequently, the urban level in the central region obviously declined.
The spatial distribution of carbon emissions and the urban network significantly overlapped (Figure 3b). Carbon emissions in central Yunnan have increased significantly through further improvements in the urban network. In addition, the increase in carbon emissions in the core cities of these three urban agglomerations also drove the growth in carbon emissions in surrounding areas, such as Ziyang and Kaili, which indicated the potential for carbon emissions to have a spatial spillover effect.
With the opening of Chengdu–Guiyang high-speed railway, Chongqing–Guiyang railway, Kunming–Guiyang high-speed railway, and other lines, the urban network in southwest China entered a rapid development stage. At the regional level (Figure 4a): Chengdu, Chongqing, Kunming and Guiyang constituted a C-shaped backbone network, connecting the three major urban agglomerations in the northern and southern regions. The connection between the three major urban agglomerations and other low-ranked cities was significantly improved (Figure 4a). Therefore, an urban network has a significant feature of area development. Since 2015, the gap among the central, regional central, tertiary, and fourth-class cities in terms of their connection ability and status has gradually widened. The prominent position of the four central cities was consolidated, and connection ability was significantly improved, creating a large gap with other cities (Figure 5). This finding indicates that the trend in urban hierarchy in southwest China was intensifying.
During 2015–2019, carbon emissions also grew rapidly, especially in the four central cities, and the cities around the C-shaped backbone network, such as Qujing, Mianyang and Zunyi, (Figure 4b). Furthermore, the carbon emissions of Zhaotong, Yibin, Yuxi, Chuxiong, and other fourth-class cities increased significantly, whereas the connection between low-ranked cities tightened in central Sichuan and southern Yunnan.
The strong consistency of the spatial and temporal distribution features between the urban network and carbon emissions shows that the development of the urban network directly or indirectly causes carbon emissions to increase, thus indicating spatial spillover characteristics. These characteristics might result from the fact that close ties among cities increase the carbon emissions of the transportation industry. From 2010 to 2019, carbon emissions from the transportation and postal industries in southwest China have increased by nearly 1.61 times (Figure 6). Moreover, the frequent exchange of people and production among cities promotes regional economic activities and improves regional economic development, resulting in increased carbon emissions and spatial spillover effects [60]. However, this focused only on the skin-deep evolutionary characteristics of the urban network and carbon emissions. Quantitatively exploring the effect of the key factors of the urban network on carbon emissions and revealing their impact mechanisms is necessary.

3.2. Influence of the Urban Network Factors on Carbon Emissions

This paper applied the spatial Durbin model to quantitatively explore the impact of the urban network on carbon emissions and the spatial spillover effect of carbon emissions. From 2010 to 2019, the global Moran’s I index of carbon emissions of 47 cities in southwest China was positive and passed the spatial autocorrelation test under the 1% significance (Table 3). This finding shows that a significant positive spatial dependence of carbon emissions exists among the 47 cities.
The Lagrange multiplier test on panel data showed that the spatial error effect and spatial lag effect of panel data are significant at the 1% level; therefore, the mixed ordinary least squares regression model should be rejected and the spatial panel regression model should be adopted. The Hausman test was negative, which indicated that the asymptotic hypothesis of the basic hypothesis of the random effects model could not be satisfied, and the fixed effects model should be used. The likelihood ratio test was then used to determine the specific form of the fixed effect. Tests using time-, space-, and double-fixed models found that the double-fixed model was better. Furthermore, the likelihood ratio and Wald tests were used to test the robustness of the model. All of the test values were 0.00, which indicated that the spatial Durbin model could not degenerate into a spatial autoregressive model or a spatial error model. Therefore, this study chose the spatial Durbin model under the double-fixed effects of time and space. Table 4 presents the results.
According to the estimation results of the spatial Durbin model (Table 4), the spatial lag coefficient of carbon emissions, ρ, was 0.4108 and significant at the 1% level, indicating that carbon emissions had a significant positive spatial spillover effect. In other words, the increase in carbon emissions in this region significantly enhanced the carbon emissions in the surrounding areas, which confirmed the previous conclusion. In addition, all five variables passed the significance test at the 1%, 5% or 10% levels.
This result is somewhat counterintuitive. In contrast to evolutionary characteristics previously analyzed, the evolution results show that DC did not significantly promote carbon emissions but had a significant negative spatial spillover effect on carbon emissions. Generally, an increase in inter-city ties promotes the exchange of labor and capital elements, increases economic and production activities, and causes local carbon emissions to increase. However, under the rapid improvement of the urban network, the quick flow of labor and capital elements promotes division of labor and cooperation among regions, the degree of specialized production, and the increase in production efficiency, and thus accelerating industrial upgrading to a certain extent (Figure 7). Along with the secondary industry with high energy consumption and low efficiency being replaced by the tertiary industry with low energy consumption and high efficiency, carbon emissions have decreased. Therefore, under the interaction of these two aspects, an increase in the DC does not lead to an increase in carbon emissions. The improvement in DC in surrounding areas does not directly increase the economic activities of the local region but benefits the realization of the industrial upgrading during the process of regional cooperation and specialized production, thereby significantly reducing carbon emissions of the local region.
NCE had a weak positive effect and a significant negative spatial spillover effect on carbon emissions. The promotion of NCE reduces the time cost and improves the performance of inter-city connections, which is similar to the effect and mechanism of DC on carbon emissions.
CC had a significant negative effect on carbon emissions. This is because cities with higher CC have shorter commuting distances in the contact network, resulting in lower traffic carbon emissions. This advantage has been further magnified in the context of increasingly close ties among cities, thereby reducing carbon emissions.
NS had a significant inhibitory effect and negative spatial spillover effect on carbon emissions, which means that the enhanced siphoning effect of one city notably reduces its carbon emissions and those of surrounding cities. The loss of population, industry, and other resources in surrounding cities affected by the siphon effect significantly reduces the carbon emissions of daily life and secondary and tertiary industries. The massive inflow of people, industry, and other resources in cities with a relatively strong siphon effect increases carbon emissions. However, industrial agglomeration reduces the transportation energy consumption and public resource consumption between upstream and downstream industries. In addition, enterprises continue to improve production efficiency in the competitive relationships, thereby reducing carbon emissions. Furthermore, population gathering promotes the mixing of urban functions and the utilization efficiency of public service facilities, which is beneficial for carbon emissions reduction [64]. Through these two effects, NS finally showed an inhibitory effect on carbon emissions, but the inhibition intensity was lower than the negative spatial spillover effect.
CST had a significant negative effect on carbon emissions. The greater the degree of restriction of city nodes, the more marginal they are in the urban network. In these circumstances, the city development and economic activities face stronger restrictions, resulting in lower carbon emissions.

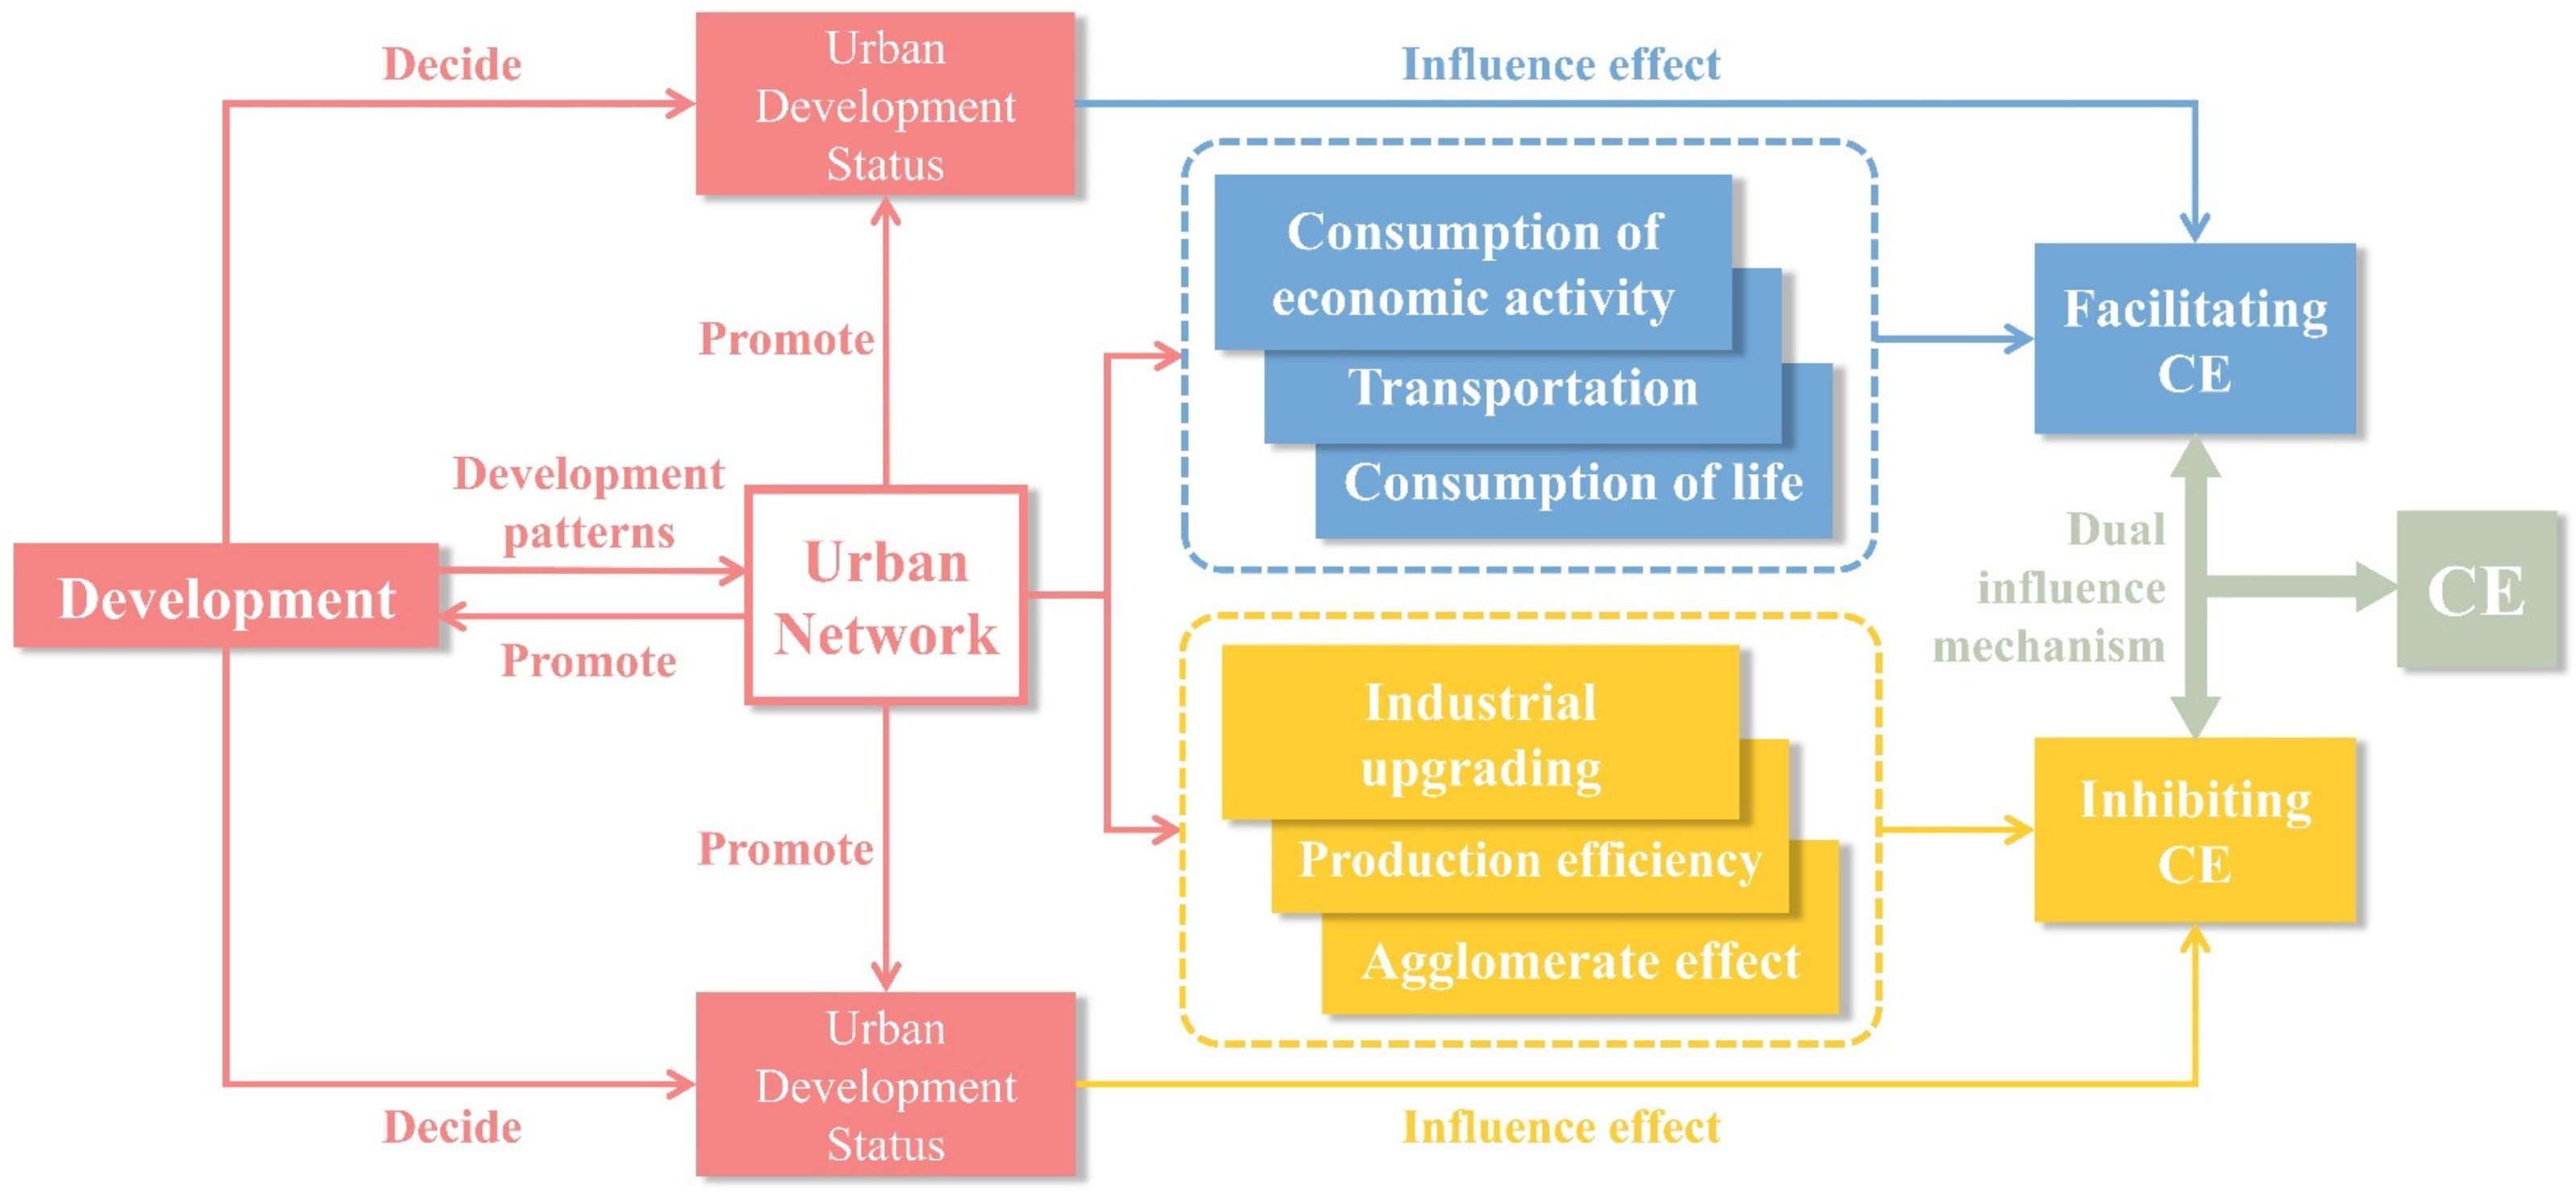
3.3. Influence Mechanism of the Urban Network Factors on Carbon Emissions

To further examine this finding, we constructed a linear regression model between carbon emissions and GDP (Figure 8). The results indicate that the carbon emissions per unit of GDP of southwest China decreased from 2010 to 2019, showing that the carbon emissions efficiency of southwest China increased. However, no significant reduction in the total amount of carbon emissions was found with an improvement in efficiency; in contrast, it increased. In addition, as shown in Figure 8, cities with relatively low carbon emission efficiency (above the regression line) were mostly those with higher connection levels and rank in the urban network. These phenomena show that, given rapid development, the urban network in southwest China played a stronger role in promoting economic and transportation activities than in improving the efficiency of carbon emissions. In other words, at this stage, the urban network promoted carbon emissions under the two-sided impact mechanism.
This finding seems to contrast with the previous results that most factors play inhibitory roles. However, the urban network is only one of the factors affecting carbon emissions. Similar to the situation in most rapidly developing regions, the analysis indicates that the tertiary industry in southwest China is mainly the catering and transportation industry with higher carbon emissions, whereas a high-tech industry with lower carbon emissions, such as finance and IT, is eliminated. The inefficient internal structure of the tertiary industry leads to the rapid growth of carbon emissions (Figure 9), which breaks the carbon reduction effect of industrial upgrading. In addition, numerous cities in rapidly developing regions are still dominated by resource- and labor-intensive secondary industries. Problems such as backward industrial structure, insufficient industrial agglomeration and inefficient resource utilization, are difficult to polish up in the short term, which means that time is still needed to achieve the negative impacts [65]. Furthermore, the lack of regional central cities with driving effects on the surroundings in rapidly developing regions results in the slow development of marginal areas. Too many medium-sized and small cities weaken the agglomeration effect. Last but not least, at present, the new energy vehicles have not been widely popularized. The rapid increase in inter-city links in rapidly developing regions leads to a quick and substantial increase in the consumption of energy and fossil fuels for the transportation industry, further aggravating the promotional effect on carbon emissions (Figure 6).

4. Discussion

Minimizing carbon emissions along with rapid economic development has been an ongoing goal of researchers in recent years. An increasing number of studies showed that the urban spatial structure might have a relationship with carbon emissions [32,66,67,68,69]. Most existing studies focused on urban morphology and less on urban networks, for which this study provides further empirical support.
Our study shows that carbon emissions are positively correlated with the degree of urban network development in rapidly developing regions. For example, the high-value areas of carbon dioxide emissions in southwest China are mainly concentrated in the urban clusters of Chengdu–Chongqing, central Guizhou, and central Yunnan, in which the urban networks are more closely connected. Additionally, carbon emissions have a significant positive spatial spillover effect, indicating that an increase in carbon emissions in this region leads to an increase in carbon emissions in the surrounding areas. This finding is consistent with those of previous studies [70,71], which poses a stronger requirement for policymakers to consider overall carbon reduction from a regional perspective rather than targeting only a single city.
Through an in-depth study of the various factors of the urban network, we find that the urban network has both promoting and inhibiting effects on carbon emissions (Figure 10). On the one hand, the development of the urban network promotes the economic activities and transportation energy consumption [72], thus increasing carbon emissions. On the other hand, the urban network improves the efficiency of carbon emissions by traffic accessibility improvement, production efficiency promotion, industrial upgrading and agglomeration effects [32], leading to a reduction in carbon emissions. Therefore, the two-sided impact mechanism of the urban network can be influenced by the development of different regions, which coincides with the results of other studies that showed that a dynamic perspective should be adopted for regions with different development situations when developing carbon reduction policies that use the intrinsic characteristics of the regions in which they are located [55,73]. Currently, in the rapidly developing areas, the development of the urban network has clearly promoted carbon emissions. Therefore, we believe that policymakers should improve the spatial layout of urban networks to enhance the radiation-driving effect of the city network in peripheral areas. Such an approach enables small and medium-sized cities to realize intra-regional divisions of labor and specialized production through the urban network to improve the problems of backward industrial structures and low production efficiency, and to give full play to the inhibiting effect of carbon emissions, thus achieving a balance between development and carbon reduction.

5. Conclusions

Based on the panel data of 47 cities, this study has analyzed the evolutionary characteristics of the urban network and carbon emissions in southwest China since 2010, determined the urban network factors, and revealed the impact mechanisms of the urban network on carbon emissions in rapidly developing regions. The main conclusions are as follows. The spatial and temporal distribution features of the urban network and carbon emissions are highly consistent in rapidly developing regions, and carbon emissions also have a significant positive spatial spillover effect. Additionally, the urban network has a two-sided impact on carbon emissions that is restricted by regional development conditions. In rapidly developing regions, the urban network shows a stronger promoting effect.
The findings pose higher requirements for rapidly developing regions, and maximizing the inhibitory effect of the urban network on carbon emissions is a key point to which those rapidly developing regions need to pay attention. In general, the spatial layout of an urban network must be improved to enhance the radiation-driving effect of the urban network in peripheral areas. Specifically, in terms of functions, the division of functions should be reasonably adjusted. Secondary industries with high energy consumption and carbon emissions in central cities should be decentralized, and high-tech industries such as IT and finance should be cultivated to optimize the structure of tertiary industries. The division of labor and specialized production in small- and medium-sized cities should be realized to improve the problems of a backward industrial structure and low production efficiency. In terms of linkages, direct links between central cities should be strengthened, and an efficient network of trunk cities should be built to reduce carbon emissions from transportation while improving the efficiency of economic activities and boosting the development of backward areas along the route.
This study provides direction for analyzing urban networks under the major demand of carbon reduction, and the results can be used as a reference for decision makers in urban development in fast-growing regions. However, given the limitations of the data acquisition, this study is still limited to fast-growing regions represented by southwest China, with no comparison for other regions with different levels of development. Further studies are needed to compare and analyze the differences in the impact mechanisms of urban networks with different development processes on carbon emissions and to seek emission reduction measures adapted to different regions from the perspective of spatial optimization.

Author Contributions

Conceptualization, T.F. and J.S.; Data curation, Y.L. and C.W.; Formal analysis, J.S.; Funding acquisition, B.Z.; Methodology, J.S.; Project administration, T.F.; Validation, T.F.; Visualization, J.S.; Writing—original draft, J.S.; Writing—review and editing, T.F. All authors have read and agreed to the published version of the manuscript.

Funding

This research was funded by Sichuan University-Yibin Strategic Cooperation Fund Project grant number 2020CDYB-24 and Chengdu Philosophy and Social Sciences Project grant number 2021BS143.

Institutional Review Board Statement

Not applicable.

Informed Consent Statement

Not applicable.

Data Availability Statement

Data used in this study are available upon request.

Conflicts of Interest

The authors declare no conflict of interest. The funders had no role in the design of the study; in the collection, analyses, or interpretation of data; in the writing of the manuscript, or in the decision to publish the results.

References

  1. Zhou, C.; Wang, S.; Wang, J. Examining the influences of urbanization on carbon dioxide emissions in the Yangtze River Delta, China: Kuznets curve relationship. Sci. Total Environ. 2019, 675, 472–482. [Google Scholar] [CrossRef] [PubMed]
  2. Liu, Z.; Ciais, P.; Deng, Z.; Lei, R.; Davis, S.J.; Feng, S.; Zheng, B.; Cui, D.; Dou, X.; Zhu, B.; et al. Near-real-time monitoring of global CO2 emissions reveals the effects of the COVID-19 pandemic. Nat. Commun. 2020, 11, 5172. [Google Scholar] [CrossRef] [PubMed]
  3. Zhang, R.; Hanaoka, T. Deployment of electric vehicles in China to meet the carbon neutral target by 2060: Provincial disparities in energy systems, CO2 emissions, and cost effectiveness. Resour. Conserv. Recycl. 2021, 170, 105622. [Google Scholar] [CrossRef]
  4. Alam, M.M.; Murad, M.W. The impacts of economic growth, trade openness and technological progress on renewable energy use in organization for economic co-operation and development countries. Renew. Energy 2020, 145, 382–390. [Google Scholar] [CrossRef]
  5. Li, G.; Wei, W. Financial development, openness, innovation, carbon emissions, and economic growth in China. Energy Econ. 2021, 97, 105194. [Google Scholar] [CrossRef]
  6. Sheng, P.; Li, J.; Zhai, M.; Huang, S. Coupling of economic growth and reduction in carbon emissions at the efficiency level: Evidence from China. Energy 2020, 213, 118747. [Google Scholar] [CrossRef]
  7. Zlatev, Z.; Dimov, I.; Faragó, I.; Georgiev, K.; Havasi, Á. Studying the Influence of Climate Changes on European Ozone Levels; Springer International Publishing: Cham, Switzerland, 2020. [Google Scholar]
  8. Ostromsky, T.; Todorov, V.; Dimov, I.; Zlatev, Z. Sensitivity Studies of an Air Pollution Model by Using Efficient Stochastic Algorithms for Multidimensional Numerical Integration; Springer International Publishing: Cham, Switzerland, 2021. [Google Scholar]
  9. Branger, F.; Quirion, P. Reaping the carbon rent: Abatement and overallocation profits in the European cement industry, insights from an LMDI decomposition analysis. Energy Econ. 2015, 47, 189–205. [Google Scholar] [CrossRef] [Green Version]
  10. Todorov, V.; Dimov, I.; Ostromsky, T.; Apostolov, S.; Georgieva, R.; Dimitrov, Y.; Zlatev, Z. Advanced stochastic approaches for Sobol’ sensitivity indices evaluation. Neural Comput. Appl. 2021, 33, 1999–2014. [Google Scholar] [CrossRef]
  11. Dong, K.; Jiang, H.; Sun, R.; Dong, X. Driving forces and mitigation potential of global CO2 emissions from 1980 through 2030: Evidence from countries with different income levels. Sci. Total Environ. 2019, 649, 335–343. [Google Scholar] [CrossRef]
  12. Majeed, M.T.; Mazhar, M. An empirical analysis of output volatility and environmental degradation: A spatial panel data approach. Environ. Sustain. Indic. 2021, 10, 100104. [Google Scholar] [CrossRef]
  13. Su, K.; Wei, D.; Lin, W. Influencing factors and spatial patterns of energy-related carbon emissions at the city-scale in Fujian province, Southeastern China. J. Clean. Prod. 2020, 244, 118840. [Google Scholar] [CrossRef]
  14. Sun, W.; Huang, C. How does urbanization affect carbon emission efficiency? Evidence from China. J. Clean. Prod. 2020, 272, 122828. [Google Scholar] [CrossRef]
  15. Chuai, X.; Yuan, Y.; Zhang, X.; Guo, X.; Zhang, X.; Xie, F.; Zhao, R.; Li, J. Multiangle land use-linked carbon balance examination in Nanjing City, China. Land Use Policy 2019, 84, 305–315. [Google Scholar] [CrossRef]
  16. Wang, S.; Huang, S.; Huang, P. Can spatial planning really mitigate carbon dioxide emissions in urban areas? A case study in Taipei, Taiwan. Landsc. Urban Plan. 2018, 169, 22–36. [Google Scholar] [CrossRef]
  17. Enríquez-de-Salamanca, Á.; Martín-Aranda, R.M.; Díaz-Sierra, R. Potential of land use activities to offset road traffic greenhouse gas emissions in Central Spain. Sci. Total Environ. 2017, 590, 215–225. [Google Scholar] [CrossRef]
  18. Sider, T.; Alam, A.; Zukari, M.; Dugum, H.; Goldstein, N.; Eluru, N.; Hatzopoulou, M. Land-use and socio-economics as determinants of traffic emissions and individual exposure to air pollution. J. Transp. Geogr. 2013, 33, 230–239. [Google Scholar] [CrossRef]
  19. Wang, Y.; Chen, L.; Kubota, J. The relationship between urbanization, energy use and carbon emissions: Evidence from a panel of Association of Southeast Asian Nations (ASEAN) countries. J. Clean. Prod. 2016, 112, 1368–1374. [Google Scholar] [CrossRef]
  20. Wang, Y.; Li, L.; Kubota, J.; Han, R.; Zhu, X.; Lu, G. Does urbanization lead to more carbon emission? Evidence from a panel of BRICS countries. Appl. Energy 2016, 168, 375–380. [Google Scholar] [CrossRef]
  21. Li, H.; Mu, H.; Zhang, M.; Li, N. Analysis on influence factors of China’s CO2 emissions based on Path–STIRPAT model. Energy Policy 2011, 39, 6906–6911. [Google Scholar] [CrossRef]
  22. Xu, Q.; Dong, Y.; Yang, R. Urbanization impact on carbon emissions in the Pearl River Delta region: Kuznets curve relationships. J. Clean. Prod. 2018, 180, 514–523. [Google Scholar] [CrossRef]
  23. Zhang, N.; Yu, K.; Chen, Z. How does urbanization affect carbon dioxide emissions? A cross-country panel data analysis. Energy Policy 2017, 107, 678–687. [Google Scholar] [CrossRef]
  24. Zhang, H.; Peng, J.; Wang, R.; Zhang, J.; Yu, D. Spatial planning factors that influence CO2 emissions: A systematic literature review. Urban Clim. 2021, 36, 100809. [Google Scholar] [CrossRef]
  25. Wang, S.; Wang, J.; Fang, C.; Li, S. Estimating the impacts of urban form on CO2 emission efficiency in the Pearl River Delta, China. Cities 2019, 85, 117–129. [Google Scholar] [CrossRef]
  26. Gudipudi, R.; Fluschnik, T.; Ros, A.G.C.; Walther, C.; Kropp, J.P. City density and CO2 efficiency. Energy Policy 2016, 91, 352–361. [Google Scholar] [CrossRef]
  27. Wang, S.; Liu, X.; Zhou, C.; Hu, J.; Ou, J. Examining the impacts of socioeconomic factors, urban form, and transportation networks on CO2 emissions in China’s megacities. Appl. Energy 2017, 185, 189–200. [Google Scholar] [CrossRef]
  28. Wang, S.; Shi, C.; Fang, C.; Feng, K. Examining the spatial variations of determinants of energy-related CO2 emissions in China at the city level using Geographically Weighted Regression Model. Appl. Energy 2019, 235, 95–105. [Google Scholar] [CrossRef]
  29. Makido, Y.; Dhakal, S.; Yamagata, Y. Relationship between urban form and CO2 emissions: Evidence from fifty Japanese cities. Urban Clim. 2012, 2, 55–67. [Google Scholar] [CrossRef] [Green Version]
  30. Fang, C.; Wang, Z.; Ma, H. The theoretical cognition of the development law of China’s urban agglomeration and academic contribution. Acta Geogr. Sin. 2018, 73, 651–665. [Google Scholar]
  31. Liu, Y.; Hao, Y. The dynamic links between CO2 emissions, energy consumption and economic development in the countries along “the Belt and Road”. Sci. Total Environ. 2018, 645, 674–683. [Google Scholar] [CrossRef]
  32. Liu, K.; Xue, M.; Peng, M.; Wang, C. Impact of spatial structure of urban agglomeration on carbon emissions: An analysis of the Shandong Peninsula, China. Technol. Forecast. Soc. Chang. 2020, 161, 120313. [Google Scholar] [CrossRef]
  33. Townsend, A.M. The internet and the rise of the new network cities, 1969–1999. Environ. Plan. B Plan. Des. 2001, 28, 39–58. [Google Scholar] [CrossRef] [Green Version]
  34. Pumain, D.; Swerts, E.; Cottineau, C.; Vacchiani-Marcuzzo, C.; Ignazzi, C.A.; Bretagnolle, A.; Delisle, F.; Cura, R.; Lizzi, L.; Baffi, S. Multilevel comparison of large urban systems. Cybergeo 2015. [Google Scholar] [CrossRef]
  35. Geniaux, G.; Martinetti, D. A new method for dealing simultaneously with spatial autocorrelation and spatial heterogeneity in regression models. Reg. Sci. Urban Econ. 2018, 72, 74–85. [Google Scholar] [CrossRef]
  36. Stuhlmacher, M.; Patnaik, S.; Streletskiy, D.; Taylor, K. Cap-and-trade and emissions clustering: A spatial-temporal analysis of the European Union Emissions Trading Scheme. J. Environ. Manag. 2019, 249, 109352. [Google Scholar] [CrossRef] [PubMed]
  37. Zhang, Y.; Zhao, M. Research on the intercity network between china’s northeast region and beijing-tianjin-hebei region: Based on the data analyses of enterprise connectivity. City Plan. Rev. 2018, 42, 41–53. [Google Scholar]
  38. Gan, C.; Voda, M.; Wang, K.; Chen, L.; Ye, J. Spatial network structure of the tourism economy in urban agglomeration: A social network analysis. J. Hosp. Tour. Manag. 2021, 47, 124–133. [Google Scholar] [CrossRef]
  39. Wang, J.; Mo, H.; Wang, F.; Jin, F. Exploring the network structure and nodal centrality of China’s air transport network: A complex network approach. J. Transp. Geogr. 2011, 19, 712–721. [Google Scholar] [CrossRef]
  40. Zhang, F.; Ning, Y.; Lou, X. The evolutionary mechanism of China’s urban network from 1997 to 2015: An analysis of air passenger flows. Cities 2021, 109, 103005. [Google Scholar] [CrossRef]
  41. Lao, X.; Zhang, X.; Shen, T.; Skitmore, M. Comparing China’s city transportation and economic networks. Cities 2016, 53, 43–50. [Google Scholar] [CrossRef] [Green Version]
  42. Xia, C.; Zhang, A.; Wang, H.; Zhang, B.; Zhang, Y. Bidirectional urban flows in rapidly urbanizing metropolitan areas and their macro and micro impacts on urban growth: A case study of the Yangtze River middle reaches megalopolis, China. Land Use Policy 2019, 82, 158–168. [Google Scholar] [CrossRef]
  43. Cheng, Y.; Zhao, M. The correlation of modern manufacturing organization and spatial evolution of “city-region”—A research with perspectives of “network” and “embeddedness”. Urban Plan. Forum 2015, 06, 20–29. [Google Scholar] [CrossRef]
  44. Sichuan Statistics Bureau of China. Sichuan Statistical Yearbook (2011–2020). 2021. Available online: http://tjj.sc.gov.cn/scstjj/c105855/nj.shtml (accessed on 22 June 2021).
  45. National Bureau of Statistics of China. Bulletin of the Seventh National Census (No. 3). 2021. Available online: http://www.stats.gov.cn/tjsj/tjgb/rkpcgb/qgrkpcgb/202106/t20210628_1818822.html (accessed on 1 December 2021).
  46. Qi, H.; Peng, Y.; Cheng, Y.; Mo, Y. Research on the spatial-temporal variation characteristics of the comprehensive carrying capacity of the Yangtze River economic zone and its mechanism. Mod. Urban Res. 2020, 12, 79–88. [Google Scholar]
  47. Shen, C.; Xiao, J. The new situation of international regional economic cooperation and our country “One Belt and One Road” cooperation strategy. Macroeconomics 2014, 11, 30–38. [Google Scholar]
  48. Su, H.; Liang, B. The impact of regional market integration and economic opening up on environmental total factor energy productivity in Chinese provinces. Energy Policy 2021, 148, 111943. [Google Scholar] [CrossRef]
  49. Railway, C. China Railway Time Table 2021. Available online: https://kyfw.12306.cn/otn/queryTrainInfo/init (accessed on 22 June 2021).
  50. Chongqing Statistics Bureau of China. Chongqing Statistical Yearbook (2011–2020). 2021. Available online: http://tjj.cq.gov.cn/zwgk_233/tjnj/ (accessed on 22 June 2021).
  51. Guizhou Statistics Bureau of China. Guizhou Statistical Yearbook (2011–2020). 2021. Available online: https://www.guizhou.gov.cn/zwgk/zfsj/tjnj/ (accessed on 22 June 2021).
  52. Yunnan Statistics Bureau of China. Yunnan Statistical Yearbook (2011–2020). 2021. Available online: http://stats.yn.gov.cn/tjsj/tjnj/ (accessed on 22 June 2021).
  53. Li, X.L.; Feng, J. Empowerment or disempowerment: Exploring stakeholder engagement in nation branding through a mixed method approach to social network analysis. Public Relat. Rev. 2021, 47, 102024. [Google Scholar] [CrossRef]
  54. Yip, W.S.; To, S. Identification of stakeholder related barriers in sustainable manufacturing using Social Network Analysis. Sustain. Prod. Consum. 2021, 27, 1903–1917. [Google Scholar] [CrossRef]
  55. Shen, W.; Liang, H.; Dong, L.; Ren, J.; Wang, G. Synergistic CO2 reduction effects in Chinese urban agglomerations: Perspectives from social network analysis. Sci. Total Environ. 2021, 798, 149352. [Google Scholar] [CrossRef]
  56. Tahmasebi, A.; Askaribezayeh, F. Microfinance and social capital formation—A social network analysis approach. Socio-Econ. Plan. Sci. 2021, 76, 100978. [Google Scholar] [CrossRef]
  57. Zhang, Y.; Zhao, M.; Cheng, Y. Research findings and planning enlightenments of China’s urban system in new era: From the perspective of network connectivity and territorial contiguity. City Plan. Rev. 2021, 45, 9–20. [Google Scholar]
  58. Wen, L.; Chatalova, L.; Gao, X.; Zhang, A. Reduction of carbon emissions through resource-saving and environment-friendly regional economic integration: Evidence from Wuhan metropolitan area, China. Technol. Forecast. Soc. Chang. 2021, 166, 120590. [Google Scholar] [CrossRef]
  59. Zhang, G.; Zhang, N.; Liao, W. How do population and land urbanization affect CO2 emissions under gravity center change? A spatial econometric analysis. J. Clean. Prod. 2018, 202, 510–523. [Google Scholar] [CrossRef]
  60. Khezri, M.; Karimi, M.S.; Khan, Y.A.; Abbas, S.Z. The spillover of financial development on CO2 emission: A spatial econometric analysis of Asia-Pacific countries. Renew. Sustain. Energy Rev. 2021, 145, 111110. [Google Scholar] [CrossRef]
  61. LeSage, J.; Pace, R.K. Introduction to Spatial Econometrics, 1st ed.; Chapman and Hall/CRC: New York, NY, USA, 2009. [Google Scholar]
  62. Zhang, Q.; Zhang, F.; Wu, G.; Mai, Q. Spatial spillover effects of grain production efficiency in China: Measurement and scope. J. Clean. Prod. 2021, 278, 121062. [Google Scholar] [CrossRef]
  63. Zhang, F.; Deng, X.; Phillips, F.; Fang, C.; Wang, C. Impacts of industrial structure and technical progress on carbon emission intensity: Evidence from 281 cities in China. Technol. Forecast. Soc. Chang. 2020, 154, 119949. [Google Scholar] [CrossRef]
  64. Ma, J.; Liu, Z.; Chai, Y. The impact of urban form on CO2 emission from work and non-work trips: The case of Beijing, China. Habitat Int. 2015, 47, 1–10. [Google Scholar] [CrossRef]
  65. Li, Z.; Galeano Galván, M.J.; Ravesteijn, W.; Qi, Z. Towards low carbon based economic development: Shanghai as a C40 city. Sci. Total Environ. 2017, 576, 538–548. [Google Scholar] [CrossRef]
  66. Liu, X.; Wang, M.; Qiang, W.; Wu, K.; Wang, X. Urban form, shrinking cities, and residential carbon emissions: Evidence from Chinese city-regions. Appl. Energy 2020, 261, 114409. [Google Scholar] [CrossRef]
  67. Fang, C.; Wang, S.; Li, G. Changing urban forms and carbon dioxide emissions in China: A case study of 30 provincial capital cities. Appl. Energy 2015, 158, 519–531. [Google Scholar] [CrossRef]
  68. Wang, M.; Madden, M.; Liu, X. Exploring the Relationship between Urban Forms and CO2 Emissions in 104 Chinese Cities. J. Urban Plan. Dev. 2017, 143, 4017014. [Google Scholar] [CrossRef]
  69. Muñiz, I.; Dominguez, A. The Impact of Urban Form and Spatial Structure on per Capita Carbon Footprint in U.S. Larger Metropolitan Areas. Sustainability 2020, 12, 389. [Google Scholar] [CrossRef] [Green Version]
  70. Zhu, K.; Tu, M.; Li, Y. Did polycentric and compact structure reduce carbon emissions? A spatial panel data analysis of 286 Chinese cities from 2002 to 2019. Land 2022, 11, 185. [Google Scholar] [CrossRef]
  71. Lv, K.; Feng, X.; Kelly, S.; Zhu, L.; Deng, M. A study on embodied carbon transfer at the provincial level of China from a social network perspective. J. Clean. Prod. 2019, 225, 1089–1104. [Google Scholar] [CrossRef]
  72. Han, F.; Xie, R.; Lu, Y.; Fang, J.; Liu, Y. The effects of urban agglomeration economies on carbon emissions: Evidence from Chinese cities. J. Clean. Prod. 2018, 172, 1096–1110. [Google Scholar] [CrossRef]
  73. Wang, Y.; Niu, Y.; Li, M.; Yu, Q.; Chen, W. Spatial structure and carbon emission of urban agglomerations: Spatiotemporal characteristics and driving forces. Sustain. Cities Soc. 2022, 78, 103600. [Google Scholar] [CrossRef]
Figure 1. Research area.
Land 11 00458 g001
Figure 2. (a) Urban networks in southwest China in 2010. (b) Carbon emissions in southwest China in 2010.
Land 11 00458 g002
Figure 3. (a) Urban networks in southwest China in 2015. (b) Carbon emissions in southwest China in 2015.
Land 11 00458 g003
Figure 4. (a) Urban networks in southwest China in 2019. (b) Carbon emissions in southwest China in 2019.
Land 11 00458 g004
Figure 5. Evolution of urban centrality in southwest China (2010, 2015, 2019).
Land 11 00458 g005
Figure 6. Carbon emissions from transportation and postal services.
Land 11 00458 g006
Figure 7. Proportion of GDP of the second and tertiary industries in Southwest China.
Land 11 00458 g007
Figure 8. (a) Carbon emission efficiency of cities in southwest China (2010). (b) Carbon emission efficiency of cities in southwest China (2015). (c) Carbon emission efficiency of cities in southwest China (2019).
Land 11 00458 g008
Figure 9. Composition of carbon emissions in southwest China.
Land 11 00458 g009
Figure 10. Diagram of two-sided impact mechanism of urban network.
Land 11 00458 g010
Table 1. Descriptive statistical results of each variable.
VariableObsMeanStd. Dev.MinMax
lnCE47016.570.91114.2119.22
lnDC4703.3522.37607.324
lnCC4702.2920.5491.4482.724
lnNCE470−0.2340.504−2.6810
lnNS470−0.5010.311−0.9160
lnCST470−0.4770.529−1.7370.632
lnES4701.2661.08303.197
Table 2. Change in ND, NC and carbon emissions in southwest China.
Year201020152019
ND0.8471.2022.922
NC29.9%23.20%21.64%
Carbon Emissions (104 tons)103,498114,684127,694
Table 3. Moran’s I Index of carbon emissions in southwest China from 2010 to 2019.
Year2010201120122013201420152016201720182019
I-value0.3110.3040.3010.2920.2860.2730.2510.2390.2200.216
Z-value3.6013.5293.4953.4023.3383.2052.9762.8442.6392.574
P-value0.0000.0000.0000.0010.0010.0010.0030.0040.0080.010
Table 4. Spatial Durbin model test and estimation results.
Main EffectSpillover Effect
lnDC0.0178 *
(1.81)
−0.0612 ***
(−3.35)
lnCC−0.2065 ***
(−3.78)
−0.0460
(−0.44)
lnNCE0.0288 **
(2.23)
−0.1082 ***
(−3.81)
lnNS−0.1853 ***
(−2.56)
−0.4231 ***
(−2.79)
lnCST−0.1979 ***
(−3.77)
0.1394
(1.34)
lnES−0.0302
(−1.11)
0.0822
(1.54)
ρ 0.4108 ***
(7.97)
R20.3983
Log-likelihood533.9948
LM_ spatial error6.296 **
LM_ spatial lag25.361 ***
Hausman test−131.65
Wald_ spatial_error27.16 ***
Wald_ spatial_lag35.34 ***
LR_ spatial_ error28.05 ***
LR_ spatial_lag35.60 ***
Notes: The t-statistic is in parenthesis. *, ** and *** indicate the significance levels at 10%, 5% and 1%, respectively.
Publisher’s Note: MDPI stays neutral with regard to jurisdictional claims in published maps and institutional affiliations.

