
Tree Advisor: A Novel Woody Plant Selection Tool to Support Multifunctional Objectives


Abstract
:1. Introduction
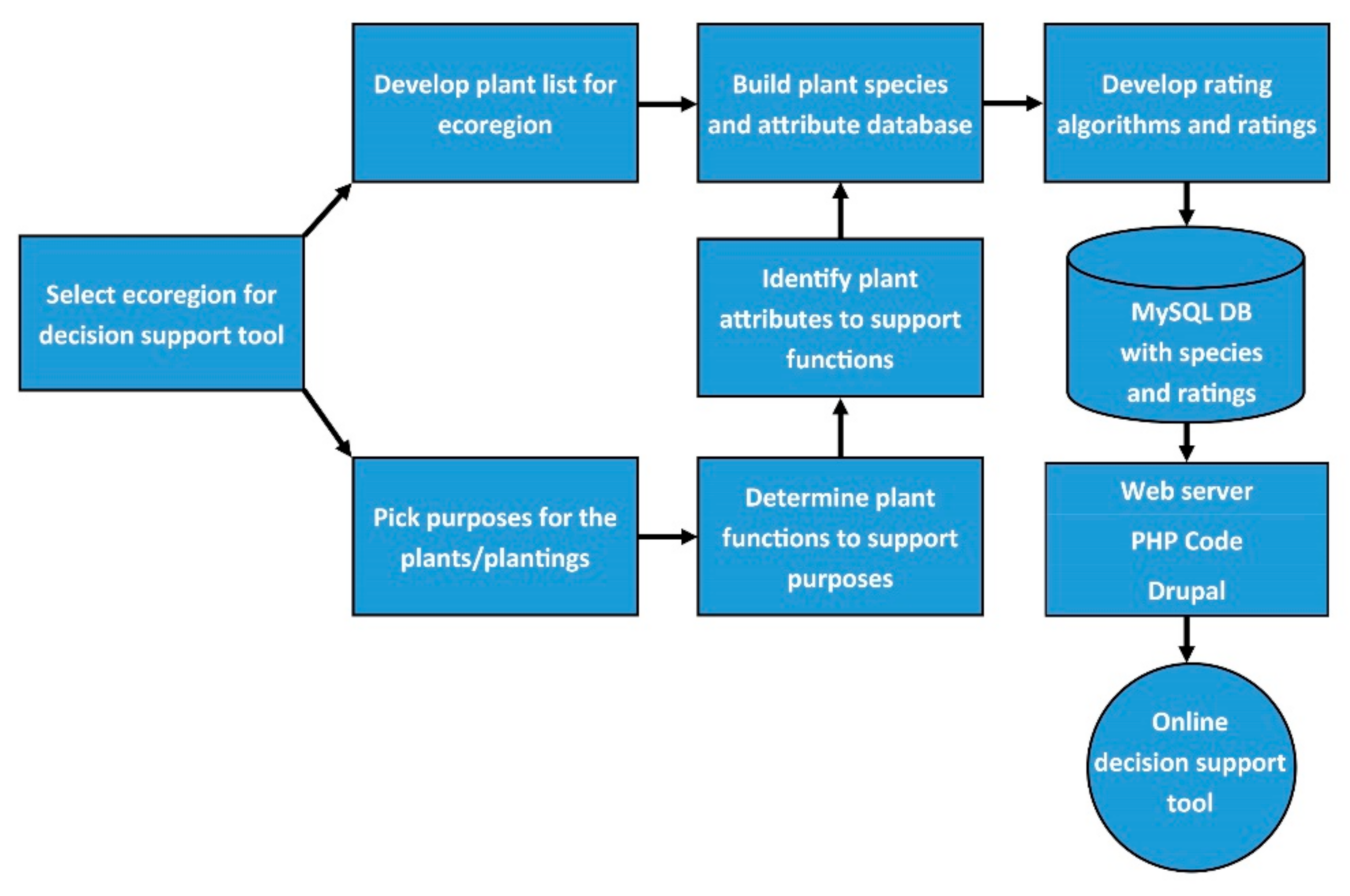
- Include multiple purposes and allow users to select those purposes;
- Develop a transparent, scientific-based rating process for the plant species;
- Use best practices to develop a user-friendly tool and interface;
- Design the tool to allow for easy updating and revisions;
- Incorporate end-user feedback though the development process.
2. Materials and Methods
3. Results
4. Discussion
Author Contributions
Funding
Acknowledgments
Conflicts of Interest
Appendix A

| Scientific Name | Common Name | Scientific Name | Common Name |
|---|---|---|---|
| Acer ginnala Maxim. | Amur maple | Acer grandidentatum Nutt. | bigtooth maple |
| Acer negundo L. | boxelder | Acer rubrum L. | red maple |
| Acer saccharinum L. | silver maple | Acer saccharum Marshall | sugar maple |
| Aesculus glabra Willd. | Ohio buckeye | Alnus incana (L.) Moench | gray alder |
| Amelanchier alnifolia (Nutt.) Nutt. ex M. Roem. | Saskatoon serviceberry | Amelanchier utahensis Koehne | Utah serviceberry |
| Amorpha fruticose L. | false indigo | Aronia melanocarpa (Michx.) Elliott | black chokeberry |
| Asimina triloba (L.) Dunal | pawpaw | Betula nigra L. | river birch |
| Betula papyrifera Mashall | paper birch | Caragana arborescens Lam. | Siberian peashrub |
| Carpinus caroliniana Walter | American hornbeam | Carya illinoinensis (Wangenh.) K. Koch | pecan |
| Catalpa speciosa (Warder) Warder ex Engelm. | northern catalpa | Celtis occidentalis L. | hackberry |
| Celtis laevigata Willd. | sugarberry | Cercis canadensis L. | eastern redbud |
| Chilopsis linearis (Cav.) Sweet | desert willow | Corylus americana Walter | American hazelnut |
| Corylus cornuta Marshall | beaked hazelnut | Cornus racemosa Lam. | gray dogwood |
| Cornus sericea L. | Redosier dogwood | Crataegus crus-galli L. | cockspur hawthorn |
| Crataegus mollis Scheele | downy hawthorn | Diospyros virginiana L. | persimmon |
| Elaeagnus commutata Bernh. ex Rydb. | silverberry | Fallugia paradoxa (D. Don) Endl. ex Torr. | Apache plume |
| Fraxinus americana L. | white ash | Fraxinus pennsylvanica Marshall | green ash |
| Gleditsia triacanthos L. | honeylocust | Gymnocladus dioicus (L.) K. Koch | Kentucky coffeetree |
| Juglans major (Torr.) A. Heller | Arizona walnut | Juglans microcarpa Berl. | little walnut |
| Juglans nigra L. | black walnut | Juniperus scopulorum Sarg. | Rocky Mountain juniper |
| Juniperus virginiana L. | eastern redcedar | Maclura pomifera (Raf.) C.K. Schneid. | Osage-orange |
| Malus baccata (L.) Borkh. | Siberian crab apple | Morus rubra L. | red mulberry |
| Ostrya virginiana (Mill.) K. Koch | hophornbeam | Physocarpus opulifolius (L.) Maxim., orth. | common ninebark |
| Picea pungens Engelm. | blue spruce | Picea abies (L.) Karst. | Norway spruce |
| Picea glauca (Moench) Voss ‘Densata’ | Black Hills spruce | Pinus nigra Arnold | Austrian pine |
| Pinus ponderosa Lawson and C. Lawson | ponderosa pine | Pinus sylvestris L. | Scotch pine |
| Platanus occidentalis L. | American sycamore | Populus angustifolia James | narrowleaf cottonwood |
| Populus balsamifera L. | balsam poplar | Populus deltoides W. Bartram ex Marshall | eastern cottonwood |
| Populus tremuloides Michx. | quaking aspen | Prunus americana Marshall | American plum |
| Prunus angustifolia Marshall | Chickasaw plum | Prunus pumila L. var. besseyi (L.H. Bailey) Gleason | western sandcherry |
| Prunus serotina Ehrh. | black cherry | Prunus tomentosa Thunb. | Nanking cherry |
| Prunus virginiana L. | chokecherry | Pyrus ussuriensis Maxim. | Chinese pear |
| Quercus fusiformis Small | Texas live oak | Quercus macrocarpa Michx. | bur oak |
| Quercus palustris Münchh. | pin oak | Quercus rubra L. | red oak |
| Rhus aromatica Aiton | fragrant sumac | Rhus trilobata Nutt. | skunkbush sumac |
| Ribes aureum Pursh | golden currant | Robinia neomexicana A. Gray | New Mexico locust |
| Robinia pseudoacacia L. | black locust | Rosa woodsii Lindl. | Woods’ rose |
| Salix amygdaloides Andersson | peachleaf willow | Salix bebbiana Sarg. | Bebb willow |
| Salix discolor Muhl. | pussy willow | Salix interior Rowlee | sandbar willow |
| Salix nigra Marshall | black willow | Sambucus nigra L. ssp. canadensis (L.) R. Bolli | American black elderberry |
| Sapindus saponaria L. var. drummondii Hook. and Arn. | western soapberry | Shepherdia argentea (Pursh) Nutt. | silver buffaloberry |
| Symphoricarpos occidentalis Hook | western snowberry | Syringa vulgaris L. | common lilac |
| Taxodium distichum (L.) Rich. | bald cypress | Thuja occidentalis L. | arborvitae |
| Tilia americana L. | American basswood | Ulmus americana L. | American elm |
| Viburnum lentago L. | nannyberry | Viburnum opulus L. var. americanum Aiton | American cranberrybush |
References
- Cohen-Shacham, E.; Walters, G.; Janzen, C.; Maginnis, S. Nature-Based Solutions to Address Global Societal Challenges; IUCN: Gland, Switzerland, 2016. [Google Scholar]
- Fargione, J.E.; Bassett, S.; Boucher, T.; Bridgham, S.D.; Conant, R.T.; Cook-Patton, S.C.; Ellis, P.W.; Falcucci, A.; Fourqurean, J.W.; Gopalakrishna, T.; et al. Natural climate solutions for the United States. Sci. Adv. 2018, 4. [Google Scholar] [CrossRef] [PubMed] [Green Version]
- Trillion Trees. Available online: https://trilliontrees.org/ (accessed on 8 December 2021).
- Nature Conservancy—Plant a Billion Trees. Available online: https://www.nature.org/en-us/get-involved/how-to-help/plant-a-billion/ (accessed on 10 December 2021).
- Grow Ahead. Available online: https://growahead.org/plant-trees/ (accessed on 9 December 2021).
- Chesapeake Bay Program. Forest Buffers. Available online: https://www.chesapeakebay.net/issues/forest_buffers (accessed on 8 December 2021).
- Great Lakes Restoration Initiative. GLRI Projects. Available online: https://www.glri.us/projects (accessed on 9 December 2021).
- Parker, J.; de Baro, M.E.Z. Green infrastructure in the urban environment: A systematic quantitative review. Sustainability 2019, 11, 3182. [Google Scholar] [CrossRef] [Green Version]
- USDA NRCS (U.S Department of Agriculture Natural Resources Conservation Service). Conservation Practices. Available online: https://www.nrcs.usda.gov/wps/portal/nrcs/detailfull/national/technical/cp/ncps/?cid=nrcs143_026849 (accessed on 6 December 2021).
- Bentrup, G.; Emery, M.; D’Adamo-Damery, N.; Flora, C. Distilling research into actionable knowledge: An assessment of a conservation buffer guide. J. Ext. 2014, 52, 18. [Google Scholar]
- Tyndall, J.; Randall, J. VEB-Econ: A vegetative environmental buffer decision-support tool for environmental quality management. J. For. 2018, 116, 573–580. [Google Scholar] [CrossRef]
- Tyndall, J. Prairie and tree planting tool-PT2 (1.0): A conservation decision support tool for Iowa, USA. Agrofor. Syst. 2021. [Google Scholar] [CrossRef]
- Hightshoe, G.L. Native Trees, Shrubs and Vines for Urban and Rural America; Van Nostrand Reinhold: New York, NY, USA, 1988. [Google Scholar]
- Bagley, W.T.; Sutton, R.K. Woody Plants for the Central and Northern Plains; Blackburn Press: Caldwell, NJ, USA, 2002. [Google Scholar]
- Stephens, H.A. Woody Plants of the North Central Plains; University Press of Kansas: Lawrence, KS, USA, 1973. [Google Scholar]
- USDA NRCS (U.S Department of Agriculture Natural Resources Conservation Service). The PLANTS Database. Available online: http://plants.usda.gov (accessed on 7 December 2021).
- Plants For A Future. Available online: https://pfaf.org/user/Default.aspx (accessed on 14 December 2021).
- Naeem, S.; Wright, J.P. Disentangling biodiversity effects on ecosystem functioning: Deriving solutions to a seemingly insurmountable problem. Ecol. Lett. 2003, 6, 567–579. [Google Scholar] [CrossRef] [Green Version]
- Pywell, R.F.; Bullock, J.M.; Roy, D.B.; Warman, L.I.Z.; Walker, K.J.; Rothery, P. Plant traits as predictors of performance in ecological restoration. Appl. Ecol. 2003, 40, 65–77. [Google Scholar] [CrossRef]
- Read, J.; Fletcher, T.D.; Wevill, T.; Deletic, A. Plant traits that enhance pollutant removal from stormwater in biofiltration systems. Int. J. Phytoremediatio 2010, 12, 34–53. [Google Scholar] [CrossRef]
- Hastings, Z.; Ticktin, T.; Botelho, M.; Reppun, N.; Kukea-Shultz, K.; Wong, M.L.; Melone, A.; Bremer, L. Integrating co-production and functional trait approaches for inclusive and scalable restoration solutions. Conserv. Sci. Pract. 2020, 2. [Google Scholar] [CrossRef]
- Ostertag, R.; Warman, L.; Cordell, S.; Vitousek, P.M. Using plant functional traits to restore Hawaiian rainforest. J. Appl. Ecol. 2015, 52, 805–809. [Google Scholar] [CrossRef]
- Burylo, M.; Rey, F.; Bochet, E.; Dutoit, T. Plant functional traits and species ability for sediment retention during concentrated flow erosion. Plant Soil 2012, 353, 135–144. [Google Scholar] [CrossRef] [Green Version]
- Franklin, H.M.; Robinson, B.H.; Dickinson, N.M. Plants for nitrogen management in riparian zones: A proposed trait-based framework to select effective species. Ecol. Manag. Restor. 2019, 20, 202–213. [Google Scholar] [CrossRef]
- Mackay-Smith, T.H.; Burkitt, L.; Reid, J.; López, I.F.; Phillips, C. A framework for reviewing silvopastoralism: A New Zealand hill country case study. Land 2021, 10, 1386. [Google Scholar] [CrossRef]
- Wood, P.J. Principles of species selection for agroforestry. In Agroforestry: Classification and Management; MacDicken, K.G., Vergara, N.T., Eds.; John Wiley: New York, NY, USA, 1990; pp. 290–309. [Google Scholar]
- Werbin, Z.R.; Heidari, L.; Buckley, S.; Brochu, P.; Butler, L.J.; Connolly, C.; Bloemendaal, L.H.; McCabe, T.D.; Miller, T.K.; Hutyra, L.R. A tree-planting decision support tool for urban heat mitigation. PLoS ONE 2020, 15, e0224959. [Google Scholar] [CrossRef]
- Payne, E.G.I.; Pham, T.; Deletic, A.; Hatt, B.E.; Cook, P.L.M.; Fletcher, T.D. Which species? A decision-support tool to guide plant selection in stormwater biofilters. Adv. Water Resour. 2018, 113, 86–99. [Google Scholar] [CrossRef]
- Ellis, E.A.; Bentrup, G.; Schoeneberger, M.M. Computer-based tools for decision support in agroforestry: Current state and future needs. Agrofor. Syst. 2004, 61, 401–421. [Google Scholar] [CrossRef] [Green Version]
- Rose, D.C.; Sutherland, W.J.; Parker, C.; Lobley, M.; Winter, M.; Morris, C.; Twining, S.; Ffoulkes, C.; Amano, T.; Dicks, L.V. Decision support tools for agriculture: Towards effective design and delivery. Agrofor. Syst. 2016, 149, 165–174. [Google Scholar] [CrossRef] [Green Version]
- McCown, R.L. Changing systems for supporting farmers’ decisions: Problems, paradigms, and prospects. Agrofor. Syst. 2002, 74, 179–220. [Google Scholar] [CrossRef]
- Roberts, A.M.; Pannell, D.J. Science tools to inform regional investment decisions—More than ‘toys for the boys’? In Proceedings of the 18th World IMACS Congress and MODSIM09 International Congress on Modelling and Simulation, Carins, QLD, Australia, 13–17 July 2009; pp. 95–101. [Google Scholar]
- McIntosh, B.S.; Ascough, J.C.; Twery, M.; Chew, J.; Elmahdi, A.; Haase, D.; Harou, J.J.; Hepting, D.; Cuddy, S.; Jakeman, A.J.; et al. Environmental decision support systems (EDSS) development—Challenges and best practices. Environ. Model. Softw. 2011, 26, 1389–1402. [Google Scholar] [CrossRef]
- Russo, P.; Lanzilotti, R.; Costabile, M.F.; Pettit, C.J. Towards satisfying practitioners in using Planning Support Systems. Comput. Environ. Urban Syst. 2018, 67, 9–20. [Google Scholar] [CrossRef]
- Hewitt, R.J.; Macleod, C.J.A. What do users really need? Participatory development of decision support tools for environmental management based on outcomes. Environments 2017, 4, 88. [Google Scholar] [CrossRef] [Green Version]
- Shneiderman, B.; Plaisant, C.; Cohen, M.S.; Jacobs, S.; Elmqvist, N.; Diakopoulos, N. Designing the User Interface: Strategies for Effective Human-Computer Interaction; Pearson: London, UK, 2016. [Google Scholar]
- McPherson, E.G. Benefit-based tree valuation. Arboric. Urban For. 2007, 33, 1–11. [Google Scholar] [CrossRef]
- Omernik, J.M.; Griffith, G.E. Ecoregions of the conterminous United States: Evolution of a hierarchical spatial framework. Environ. Manag. 2014, 54, 1249–1266. [Google Scholar] [CrossRef]
- Sauer, T. The Prairie States Forestry Project as a model for an effective global climate change mitigation project. In Handbook on Agroforestry: Management, Practices and Environmental Impact; Kellimore, L.R., Ed.; Agroforestry Nova Publishers: Hauppauge, NY, USA, 2010; pp. 479–482. [Google Scholar]
- Droze, W. Trees, Prairies, and People—Tree Planting in the Plains States; Texas Woman’s University Press: Denton, TX, USA, 1977. [Google Scholar]
- Gaskina, J.F.; Erin Espelanda, E.; Casey, D.; Johnson, C.D.; Larsonc, D.L.; Mangold, J.M.; McGee, R.A.; Milner, C.; Paudel, S.; Pearson, D.E.; et al. Managing invasive plants on Great Plains grasslands: A discussion of current challenges. Rangel. Ecol. Manag. 2021, 78, 235–249. [Google Scholar] [CrossRef]
- Symstad, A.J.; Leis, S.A. Woody encroachment in Northern Great Plains grasslands: Perceptions, actions, and needs. Nat. Areas J. 2017, 37, 118–127. [Google Scholar] [CrossRef] [Green Version]
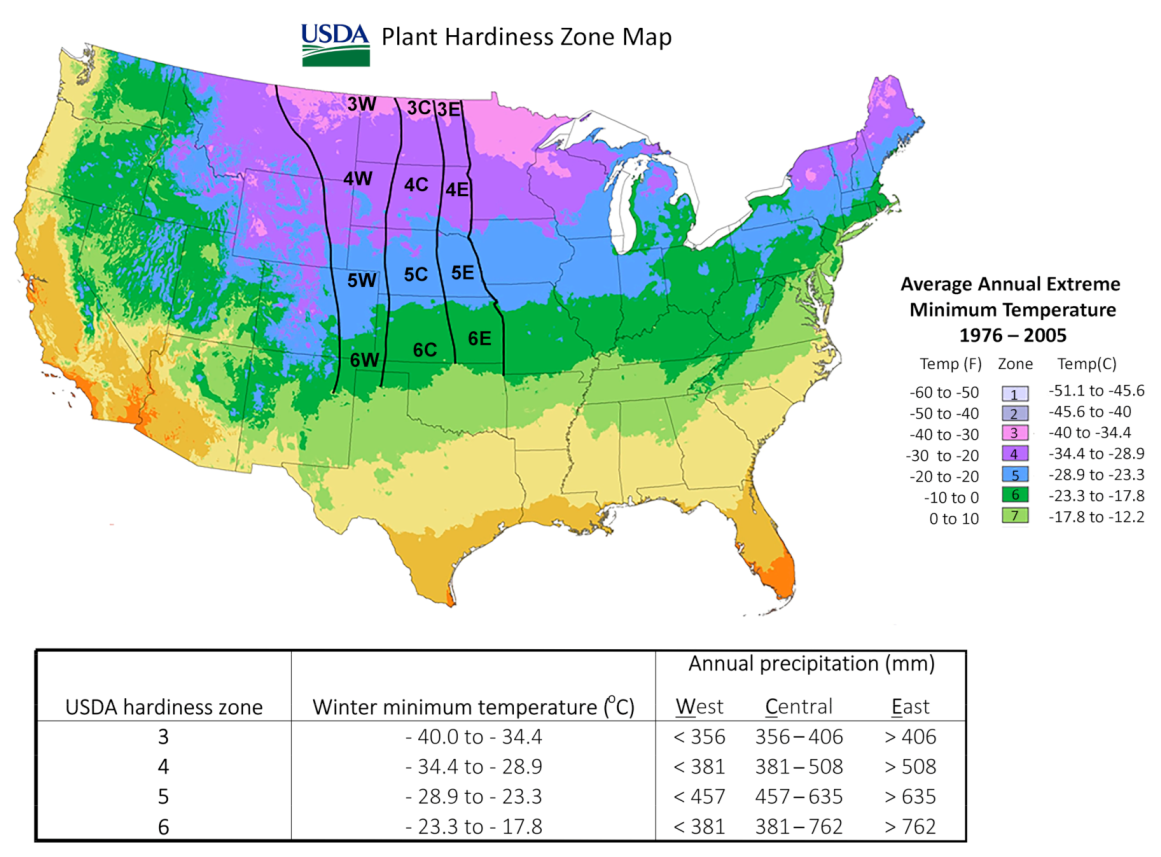
- U.S Department of Agriculture. USDA Plant Hardiness Zone Map. Available online: https://planthardiness.ars.usda.gov/pages/view-maps (accessed on 6 February 2022).
- PRISM Climate Group. 30-yr Normal Precipitation: 1981–2010. Available online: http://prism.oregonstate.edu (accessed on 2 September 2021).
- Bratkovich, S.; Burban, L.; Katovich, S.; Locey, C.; Pokorny, J.; Wiest, R. Flooding and Its Effect on Trees; U.S. Department of Agriculture Forest Service State and Private Forestry Northeastern Area: St. Paul, MN, USA, 1994. [Google Scholar]
- Burns, R.M.; Honkala, B.H. Silvics of North America—Vol. 1: Conifers; U.S. Department of Agriculture Forest Service: Washington, DC, USA, 1990. [Google Scholar]
- Burns, R.M.; Honkala, B.H. Silvics of North America—Vol. 2: Hardwoods; U.S. Department of Agriculture Forest Service: Washington, DC, USA, 1990. [Google Scholar]
- Dirr, M. Manual of Woody Landscape Plants, 4th ed.; Stipes Publishing Company: Champaign, IL, USA, 1990. [Google Scholar]
- Elias, T.S. The Complete Trees of North America; Gramercy Publishing Company: New York, NY, USA, 1987. [Google Scholar]
- Elmore, F.H. Shrubs and Trees of the Southwest Uplands; Southwest Parks and Monuments Association: Tucson, AZ, USA, 1976. [Google Scholar]
- Farrar, J.L. Trees of the Northern United States and Canada; Iowa State University Press: Ames, IA, USA, 1995. [Google Scholar]
- Francis, J.K. Wildland Shrubs of the United States and Its Territories: Thamnic Descriptions; U.S. Department of Agriculture, Forest Service, Rocky Mountain Research Station: Fort Collins, CO, USA, 2004; Volume 1. [Google Scholar]
- Great Plains Flora Association. Atlas of the Flora of the Great Plains; Iowa State University Press: Iowa City, IA, USA, 1977. [Google Scholar]
- Great Plains Flora Association. Flora of the Great Plains; University of Kansas Press: Lawrence, KS, USA, 1986. [Google Scholar]
- Grimm, W.C. The Book of Shrubs; Stackpole Company: Harrisburg, PA, USA, 1957. [Google Scholar]
- Harlow, W.M. Textbook of Dendrology, 8th ed.; McGraw-Hill: New York, NY, USA, 1996. [Google Scholar]
- Herman, D.E.; Stange, C.M.; Quam, V.C. North Dakota Tree Handbook; North Dakota State Soil Conservation Committee: Bismarck, ND, USA, 1996. [Google Scholar]
- Jacobson, A.L. North American Landscape Trees; Ten Speed Press: Berkeley, CA, USA, 1996. [Google Scholar]
- Johnson, J.R.; Nichols, J.T. Plants of South Dakota Grasslands; South Dakota State University, Agricultural Experiment Station: Brookings, SD, USA, 1970. [Google Scholar]
- Kansas Conservation Trees. Available online: http://www.kansasforests.org/conservation_trees/products/index.html (accessed on 6 December 2021).
- Kelly, G.W. A Guide to the Woody Plants of Colorado; Pruett Publishing Company: Boulder, CO, USA, 1970. [Google Scholar]
- Klett, J.; Fahey, B.; Cox, R.; Shonle, I. Native Shrubs for Colorado Landscapes; Colorado State University Extension: Fort Collins, CO, USA, 2018. [Google Scholar]
- Klett, J.; Fahey, B.; Cox, R.; Shonle, I. Native Trees for Colorado Landscapes; Colorado State University Extension: Fort Collins, CO, USA, 2018. [Google Scholar]
- Lady Bird Johnson Wildflower Center Database. Available online: https://www.wildflower.org/plants/ (accessed on 6 December 2021).
- Little, E.L.; Bullaty, S.; Lomeo, A. The Audubon Society Field Guide to North American Trees: Eastern Region; Alfred A. Knopf: New York, NY, USA, 1980. [Google Scholar]
- Nebraska Natural Resource Districts: Conservation Trees for Nebraska. Available online: https://www.nrdnet.org/tree-program (accessed on 6 December 2021).
- Preston, R.J. Rocky Mountain Trees, 2nd ed.; Iowa State College Press: Ames, IA, USA, 1947. [Google Scholar]
- Rose, N.; Selinger, D.; Whitman, J. Growing Shrubs and Small Trees in Cold Climates; Contemporary Books: Lincolnwood, IL, USA, 2001. [Google Scholar]
- South Dakota Tree List for Conservation. Available online: https://www.sdconservation.org/index.asp?SEC=C0CD32CD-6280-47A7-AF4D-DDECA2927FC1&DE=E33D0673-E0FA-4B22-9762-28371ECEEE00&Type=B_BASIC (accessed on 6 February 2022).
- South Dakota State University. Trees for South Dakota; South Dakota State University: Brookings, SD, USA, 1995. [Google Scholar]
- Stubbendieck, J.L.; Hatch, S.L.; Butterfield, C.H.; Jansen, B.P. North American Range Plants, 4th ed.; University of Nebraska Press: Lincoln, NE, USA, 1992. [Google Scholar]
- USDA (U.S Department of Agriculture). Conservation Trees and Shrubs for Montana. Available online: https://www.nrcs.usda.gov/Internet/FSE_DOCUMENTS/nrcs144p2_053519.pdf (accessed on 6 December 2021).
- USDA NRCS (U.S. Department of Agriculture Natural Resources Conservation Service). Engineering Field Handbook, Chapter 16: Streambank and Shoreline Protection; U.S. Department of Agriculture: Washington, DC, USA, 1996. [Google Scholar]
- USDA SCS (U.S. Department of Agriculture Soil Conservation Service). Engineering Field Handbook, Chapter 18: Soil Bioengineering for Upland Slope Protection and Erosion Control; U.S. Department of Agriculture: Washington, DC, USA, 1992. [Google Scholar]
- USDA USFS (U.S. Department of Agriculture Forest Service). Fire Effects Information System. Available online: http://www.fs.fed.us/database/feis (accessed on 6 December 2021).
- USDI FWS (U.S. Department of Interior Fish and Wildlife Service). Impact of Water Level Changes on Woody Riparian and Wetland Communities; U.S. Fish and Wildlife Service: Washington, DC, USA, 1978; Volume 3. [Google Scholar]
- USDI FWS (U.S. Department of Interior Fish and Wildlife Service). Impact of Water Level Changes on Woody Riparian and Wetland Communities; U.S. Fish and Wildlife Service: Washington, DC, USA, 1978; Volume 6. [Google Scholar]
- van der Linden, P.J.; Farrar, D.R. Forest and Shade Trees of Iowa, 2nd ed.; Iowa State University Press: Ames, IA, USA, 1993. [Google Scholar]
- Van Dersal, W.R.; Mulford, F.L.; Thornthwaite, C.W. Native Woody Plants of the United States; U.S. Department of Agriculture: Washington, DC, USA, 1938. [Google Scholar]
- Vines, R.A. Trees of Central Texas, 1st ed.; University of Texas Press: Austin, TX, USA, 1984. [Google Scholar]
- Whitlow, T.W.; Harris, R.W. Environmental and Water Quality Studies: Flood Tolerance in Plants: A State-of-the-Art Review; U.S. Army Corps of Engineers: Washington, DC, USA, 1979. [Google Scholar]
- Wilkinson, K. Trees and Shrubs of Alberta; Lone Pine Publishing: Edmonton, Alberta, Canada, 1990. [Google Scholar]
- Wyoming Tree Owner’s Manual. Available online: http://www.uwyo.edu/barnbackyard/_files/documents/resources/landscaping/wytreeownersmanfinal.pdf (accessed on 6 December 2021).
- Yiesla, S.A.; Gates, F.G. Shade Trees for the Central and Northern United States and Canada; Stipes Publishing Company: Champaign, IL, USA, 1992. [Google Scholar]
- USDA NRCS (U.S. Department of Agriculture Natural Resources Conservation Service). Windbreak-Shelterbelt Establishment and Renovation (380). Available online: https://www.nrcs.usda.gov/wps/PA_NRCSConsumption/download?cid=nrcseprd1822436&ext=pdf (accessed on 7 December 2021).
- Weber, C. Ecosystem services provided by urban vegetation: A literature review. In Urban Environment; Rauch, S.M.G., Norra, S., Schleicher, N., Eds.; Springer: Dordrecht, The Netherlands, 2013. [Google Scholar]
- Smith, J.; Pearce, B.D.; Wolfe, M.S. Reconciling productivity with protection of the environment: Is temperate agroforestry the answer? Renew. Agric. Food Syst. 2013, 28, 80–92. [Google Scholar] [CrossRef]
- Gillespie, A.R.; Jose, S.; Mengel, D.B.; Hoover, W.L.; Pope, P.E.; Seifert, J.R.; Biehle, D.J.; Stall, T.; Benjamin, T.J. Defining competition vectors in a temperate alley cropping system in the midwestern USA—1. Production physiology. Agrofor. Syst. 2000, 48, 25–40. [Google Scholar] [CrossRef]
- Jose, S.; Gillespie, A.R.; Seifert, J.R.; Mengel, D.B.; Pope, P.E. Defining competition vectors in a temperate alley cropping system in the midwestern USA—3. Competition for nitrogen and litter decomposition dynamics. Agrofor. Syst. 2000, 48, 61–77. [Google Scholar] [CrossRef]
- Jose, S.; Gillespie, A.R.; Pallardy, S.G. Interspecific interactions in temperate agroforestry. Agrofor. Syst. 2004, 61, 237–255. [Google Scholar] [CrossRef]
- Wolz, K.J.; DeLucia, E.H. Alley cropping: Global patterns of species composition and function. Agric. Ecosyst. Environ. 2018, 252, 61–68. [Google Scholar] [CrossRef]
- Malezieux, E.; Crozat, Y.; Dupraz, C.; Laurans, M.; Makowski, D.; Ozier-Lafontaine, H.; Rapidel, B.; de Tourdonnet, S.; Valantin-Morison, M. Mixing plant species in cropping systems: Concepts, tools and models. A review. Agron. Sustain. Dev. 2009, 29, 43–62. [Google Scholar] [CrossRef] [Green Version]
- Cole, L.J.; Stockan, J.; Helliwell, R. Managing riparian buffer strips to optimise ecosystem services: A review. Agric. Ecosyst. Environ. 2020, 296. [Google Scholar] [CrossRef]
- Davies-Colley, R.J.; Quinn, J.M. Stream lighting in five regions of North Island, New Zealand: Control by channel size and riparian vegetation. N. Z. J. Mar. Freshw. Res. 1998, 32, 591–605. [Google Scholar] [CrossRef] [Green Version]
- Broadmeadow, S.; Nisbet, T.R. The effects of riparian forest management on the freshwater environment: A literature review of best management practice. Hydrol. Earth Syst. Sci. 2004, 8, 286–305. [Google Scholar] [CrossRef]
- Peichl, M.; Thevathasan, N.; Gordon, A.M.; Huss, J.; Abohassan, R.A. Carbon sequestration potentials in temperate tree-based intercropping systems, southern Ontario, Canada. Agrofor. Syst. 2006, 66, 243–257. [Google Scholar] [CrossRef]
- Wotherspoon, A.; Thevathasan, N.V.; Gordon, A.M.; Voroney, R.P. Carbon sequestration potential of five tree species in a 25-year-old temperate tree-based intercropping system in southern Ontario, Canada. Agrofor. Syst. 2014, 88, 631–643. [Google Scholar] [CrossRef]
- Diehl, R.M.; Merritt, D.M.; Wilcox, A.C.; Scott, M.L. Applying functional traits to ecogeomorphic process in riparian ecosystems. Bioscience 2017, 67, 1067. [Google Scholar] [CrossRef] [Green Version]
- Colmer, T.D.; Voesenek, L.A.C.J. Flooding tolerance: Suites of plant traits in variable environments. Funct. Plant Biol. 2009, 36, 665–681. [Google Scholar] [CrossRef]
- Kervroedan, L.; Armand, R.; Saunier, M.; Ouvry, J.F.; Faucon, M.P. Plant functional trait effects on runoff to design herbaceous hedges for soil erosion control. Ecol. Eng. 2018, 118, 143–151. [Google Scholar] [CrossRef] [Green Version]
- Voesenek, L.A.C.J.; Bailey-Serres, J. Flood adaptive traits and processes: An overview. New Phytol. Found. 2015, 206, 57–73. [Google Scholar] [CrossRef]
- Brown, R.W.; Amacher, M.C. Selecting plant species for ecological restoration: A perspective for land managers. In Proceedings of the Society for Ecological Restoration Annual Meeting, Fort Lauderdale, FL, USA, 12–15 November 1997; pp. 1–16. [Google Scholar]
- Morandin, L.A.; Kremen, C. Bee preference for native versus exotic plants in restored agricultural hedgerows. Restor. Ecol. 2013, 21, 26–32. [Google Scholar] [CrossRef] [Green Version]
- Ucar, T.; Hall, F.R. Windbreaks as a pesticide drift mitigation strategy: A review. Pest Manag. Sci. 2001, 57, 663–675. [Google Scholar] [CrossRef]
- Finch, S.J. Field windbreaks—Design criteria. Agric. Ecosyst. Environ. 1988, 22, 215–228. [Google Scholar] [CrossRef]
- Ticknor, K.A. Design and use of field windbreaks in wind erosion control-systems. Agric. Ecosyst. Environ. 1988, 22, 123–132. [Google Scholar] [CrossRef]
- Scholten, H. Snow distribution on crop fields. Agric. Ecosyst. Environ. 1988, 22, 363–380. [Google Scholar] [CrossRef]
- Wood, T.J.; Kaplan, I.; Szendrei, Z. Wild bee pollen diets reveal patterns of seasonal foraging resources for honey bees. Front. Ecol. Evol. 2018, 6. [Google Scholar] [CrossRef] [Green Version]
- Bentrup, G.; Hopwood, J.; Adamson, N.L.; Vaughan, M. Temperate agroforestry systems and insect pollinators: A review. Forests 2019, 10, 981. [Google Scholar] [CrossRef] [Green Version]
- Donkersley, P. Trees for bees. Agric. Ecosyst. Environ. 2019, 270, 79–83. [Google Scholar] [CrossRef]
- Bharati, L.; Lee, K.H.; Isenhart, T.M.; Schultz, R.C. Soil-water infiltration under crops, pasture, and established riparian buffer in Midwestern USA. Agrofor. Syst. 2002, 56, 249–257. [Google Scholar] [CrossRef]
- Dosskey, M.G.; Vidon, P.; Gurwick, N.P.; Allan, C.J.; Duval, T.P.; Lowrance, R. The role of riparian vegetation in protecting and improving chemical water quality in streams. J. Am. Water Resour. Assoc. 2010, 46, 261–277. [Google Scholar] [CrossRef]
- Lyons, J.; Trimble, S.W.; Paine, L.K. Grass versus trees: Managing riparian areas to benefit streams of central North America. J. Am. Water Resour. Assoc. 2000, 36, 919–930. [Google Scholar] [CrossRef]
- Wynn, T.; Mostaghimi, S. The effects of vegetation and soil type on streambank erosion, southwestern Virginia, USA. J. Am. Water Resour. Assoc. 2006, 42, 69–82. [Google Scholar] [CrossRef]
- USFS (United States Forest Service). Fire Effects Information System Database. Available online: http://www.fs.fed.us/database/feis (accessed on 7 December 2021).
- Lohr, V.I.; Pearson-Mims, C.H. Responses to scenes with spreading, rounded, and conical tree forms. Environ. Behav. 2006, 38, 667–688. [Google Scholar] [CrossRef]
- Smardon, R.C. Perception and aesthetics of the urban-environment—Review of the role of vegetation. Landsc. Urban Plan 1988, 15, 85–106. [Google Scholar] [CrossRef]
- Summit, J.; Sommer, R. Further studies of preferred tree shapes. Environ. Behav. 1999, 31, 550–576. [Google Scholar] [CrossRef]
- Cook, D.I.; Van Haverbeke, D.F. Trees, shrubs, and landforms for noise-control. J. Soil Water Conserv. 1972, 27, 259–261. [Google Scholar]
- Fang, C.F.; Ling, D.L. Guidance for noise reduction provided by tree belts. Landsc. Urban Plan. 2005, 71, 29–34. [Google Scholar] [CrossRef]
- Brush, R.O.; Williamson, D.N.; Fabos, J.G. Visual screening potential of forest vegetation. Urban Ecol. 1979, 4, 207–216. [Google Scholar] [CrossRef]
- Reethof, G.; Heisler, G.M. Trees and forests for noise abatement and visual screening. In USDA Forest Service General Technical Report NE; U.S. Department of Agriculture, Forest Service, Northeastern Forest Experiment Station: Upper Darby, PA, USA, 1976; pp. 39–48. [Google Scholar]
- Peterson, R.A. The Great Plains as a natural region: The basics. Proc. South Dak. Acad. Sci. 2001, 80, 259–266. [Google Scholar]
- Carmean, W.H.; Hahn, J.T.; Jacobs, R.D. Site Index Curves for Forest Tree Species in the Eastern United States; U.S. Development of Agriculture, Forest Service, North Central Forest Experiment Station: St. Paul, MN, USA, 1989. [Google Scholar]
- Widrlechner, M.P.; Thompson, J.R.; Iles, J.K.; Dixon, P.M. Models for predicting the risk of naturalization of nonnative woody plants in Iowa. J. Environ. Hortic. 2004, 22, 23–31. [Google Scholar] [CrossRef]
- Ganguli, A.C.; Engle, D.M.; Mayer, P.M.; Fuhlendorf, S.D. When are native species inappropriate for conservation plantings? Rangelands 2008, 30, 27–32. [Google Scholar] [CrossRef]
- Nassauer, J.I.; Opdam, P. Design in science: Extending the landscape ecology paradigm. Landsc. Ecol. 2008, 23, 633–644. [Google Scholar] [CrossRef]
- Feder, S. The US Is Making Its Biggest Investment in Broadband Internet Ever. Available online: https://www.popsci.com/technology/infrastructure-bill-broadband-access-us/ (accessed on 6 February 2022).
- Iverson, L.R.; Prasad, A.M.; Mathews, S.N.; Peters, M. Estimating the potential habitat for 134 Eastern U.S. tree species under six climate scenarios. For. Ecol. Manag. 2008, 254, 390–406. [Google Scholar] [CrossRef]
- Dosskey, M.; Bell, A.C.; Bentrup, G. Suitable tree species under a changing climate. In Agroforestry: Enhancing Resiliency in U.S. Agricultural Landscapes Under a Changing Climate; Schoeneberger, M., Bentrup, G., Patel-Weynand, T., Eds.; U.S. Department of Agriculture, Forest Service: Washington, DC, USA, 2017; pp. 212–213. [Google Scholar]


| Purpose | Plant Functions | Plant Attributes | Key Literature |
|---|---|---|---|
| Alley cropping | Produce a tree/shrub crop which complements the income generated from a crop grown between rows of the trees. | Weighted: shorter crown to minimize shade over the alley crop (2x). Unweighted: tree produces a high-value product (required). Does not seriously reduce productivity of the alley crop via competition by shallow roots, deep shade, or high soil water use. User will need to determine management compatibility between the tree crop and the alley crop. | [88,89,90,91,92] |
| Aquatic habitat | Aquatic habitat can be improved by reducing summer water temperature and by increasing the supply of plant debris. Water temperatures of smaller streams can be moderated by shade. Fallen leaves provide important fodder for the aquatic food chain. Larger woody debris provides structural diversity that creates cover for a wide variety of aquatic organisms. | Weighted: high flood tolerance (2x); tall height (2x). Unweighted: fast-growing trees that can more quickly produce dense summer shade and debris. | [93,94,95] |
| Carbon sequestration | Carbon from atmospheric CO2 is photosynthesized into biomass and sequestered in the form of wood. | Weighted: fast growth (2x). Unweighted: large, long-lived. | [96,97] |
| Flood protection | Flood damage includes scour erosion of soil from, and deposition of debris in, agricultural fields on low floodplains. Protection is provided by trees and shrubs that slow out-of-bank floodwater flow and that screen and trap debris before it enters agricultural fields. | Weighted: high flood tolerance (2x). Unweighted: dense stems and foliage near the ground (assume floodwaters less than about 5 feet deep) and fast vegetative spread. | [23,98,99,100,101] |
| Native ecosystem restoration | Plants that are native to an area have characteristics that, on the whole, integrate better with the life histories and habitat requirements of other native organisms than non-native plants. | Unweighted: native status in the sub-region. | [102,103] |
| Particle drift reduction | Tree crowns slow wind and intercept airborne particles, thereby reducing the amount and distance of travel of dust, crop pollen, and pesticide-containing spray droplets into adjacent fields and other off-site areas. | Weighted: tall (2x). Unweighted: fast growth, high foliage porosity, and not prone to breakage by ice and wind. | [104,105,106,107] |
| Pollinator habitat | Produces food (pollen and/or nectar) at times of year when most other plants do not (typically winter and early spring) and provides protected winter and reproductive refugia. | Unweighted: provides relatively better pollinator habitat mainly through copious flowering (pollen and nectar food sources) in early spring. | [108,109,110] |
| Polluted runoff treatment | Vegetation provides surface roughness that slows overland flow and promotes infiltration, and thereby promotes deposition of sediment and sediment-bound pollutants, infiltration of dissolved pollutants, uptake and sequestration of nutrients by plants, and transformation of nutrients and degradation of pesticides by soil microorganisms. | Unweighted: develops many plant stems, has low shade density for allowing grass and forb undergrowth, has high water use to dry the soil and promote infiltration, is fast growing for a high debris production and nutrient uptake rate. | [24,93,111,112] |
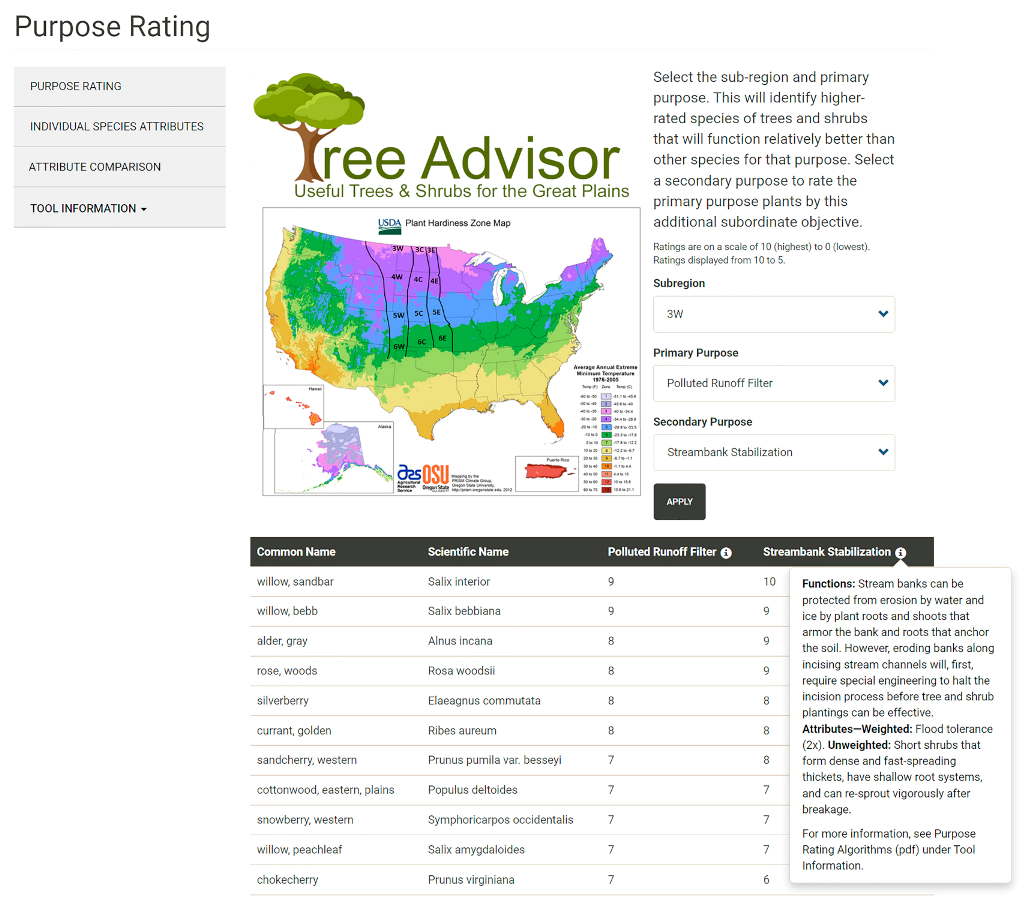
| Streambank stabilization | Streambanks can be protected from erosion by water and ice by plant roots and shoots that armor the bank and roots that anchor the soil. However, eroding banks along incising stream channels will, first, require special engineering to halt the incision process before tree and shrub plantings can be effective. | Weighted: flood tolerance (2x). Unweighted: short shrubs that form dense and fast-spreading thickets, have shallow root systems, and can re-sprout vigorously after breakage. | [93,98,112,113,114] |
| Stormwater treatment | Stormwater is directed to vegetated areas where water infiltrates, particulates deposit on the surface, and dissolved pollutants (including mineral nutrients, and mineral and organic pollutants) are stripped out of the percolating water by interactions with soil minerals, organic matter, microorganisms, and plant roots. Vegetation is critical for maintaining soil infiltration capacity and soil interaction processes. | Unweighted: high water use, fast growth, and large size promote infiltration and soil transformations, including nutrient uptake and sequestration by the plants. | [28,93,111,112] |
| Wetland and restoration | Vegetation promotes wetland processes that improve water quality and wildlife habitat. Trees and shrubs diversify wetland habitat. | Unweighted: high flood tolerance. | [99,101] |
| Wildlife habitat | All tree and shrub plantings provide cover and/or food benefits in otherwise cultivated cropland or heavily grazed pastures. Some species provide particularly valuable cover conditions or food sources for birds and mammals. | Unweighted: bird and mammal habitat. | [16,52,115] |
| Visual aesthetics | Trees and shrubs may have visual qualities that landowners deem particularly desirable in a planting. Larger trees and shrubs are generally more noticeable in an agricultural setting. Some may provide additional visual interest by having bright yellow or red foliage in the fall, showy flowers in the spring, or year-round green foliage. It remains for the user to determine what kind(s) of visual interest (evergreen, fall color, or showy flowers) is (are) desired. | Weighted: particular visual interest (2x). Unweighted: larger size. | [116,117,118] |
| Visual and noise screen | Tree and shrub foliage can block undesirable views and dampen noise. | Weighted: year-round foliage (2x). Unweighted: tall, fast-growing trees with high foliage density. | [119,120,121,122] |
| Attribute Code | Attribute 1 | Attribute Range | Attribute Range Description | Notes |
|---|---|---|---|---|
| Q | Native status | 1 to 3 | 3 = native to the sub-region 2 = not native to the sub-region, but native to elsewhere in North America 1 = not native to North America | |
| C | Crown size/form | 1 to 4 | 4 = large tree (typically single central trunk; mature ht > 9.1 m) 3 = small tree (typically single central trunk; mature ht < 9.1 m) 2 = large shrub (typically smaller than a small tree and multiple stems; mature ht > 2.1 m) 1 = small shrub (typically smaller than a large shrub and multiple stems; mature ht < 2.1 m) | |
| Z | Crown height | 1 to 3 | 3 = tall trees (>9.1 m) 2 = short trees or tall shrubs (2.1–9.1 m) 1 = short shrubs (<2.1 m) | Based on height ranges found in regional plant guides and databases. |
| G | Growth rate | 1 to 3 | 3 = fast 2 = medium 1 = slow | Relative height growth rate under good growing conditions. A 2 rating correlates roughly to a stem growth rate range of 0.3–0.6 m/yr. |
| L | Life span | 1 to 3 | 3 = >100 years 2 = 40–100 years 1 = <40 years | Shrubs were assumed to have a life span < 40 yr for individual stems, whether plants or clonal sprouts, unless otherwise noted in databases. |
| A | Stem form 2 | 1 to 2 | 2 = multiple stems 1 = single stem | This category is intended to characterize the form naturally taken in the absence of trimming. |
| R | Foliage retention | 1 to 2 | 2 = evergreen 1 = deciduous | |
| S | Shade density | 1 to 3 | 3 = casts relatively dense shade under its crown 2 = casts medium shade under its crown 1 = casts light shade under its crown | Based on “Foliage Density” in USDA PLANTS. |
| P | Foliage porosity | 1 to 3 | 3 = porous to wind 2 = moderately porous 1 = low porosity to wind | Porosity to wind during the growing season (i.e., summer). |
| O | Root structure | 1 to 3 | 3 = deep lateral and taproot systems 2 = medium-depth lateral root system 1 = shallow lateral root system | Based on “Root Depth, Minimum” in USDA PLANTS and root structure information in regional plant guides and databases. |
| V | Vegetative spread rate | 0 to 3 | 3 = fast 2 = moderate 1 = slow 0 = none | Propensity to reproduce vegetatively by root suckers or sprouts, rhizomes, stolons, and/or layering (i.e., by adventitious rooting of low branches that touch the ground). |
| J | Seeding spread rate 2 | 1 to 2 | 2 = fast; typically, a prolific seeder 1 = slow | Propensity to reproduce from seed. Seeding spread rate integrates seed production, seed viability, and effectiveness of seed dispersal to describe how effectively a species can regenerate. |
| T | Stand form | 1 to 3 | 3 = dense clonal thickets 2 = loose clonal colonies, clusters, or patches 1 = dispersed individuals | |
| U | Resprout ability | 0 to 2 | 2 = high ability to sprout new shoots after cutting or breakage 1 = low ability 0 = no ability | High ability is assumed if data sources indicate both “Resprout Ability” and “Coppice Potential”. |
| N | Nitrogen fixation 2 | 0 to 1 | 1 = significant; improves growth of the tree and surrounding vegetation 0 = none or not significant | |
| W | Water use | 1 to 3 | 3 = high 2 = medium 1 = low | Based on “Moisture Use” in USDA PLANTS which represents the ability to remove soil water relative to other plants of similar size under similar soil moisture availability. |
| F | Flood tolerance | 1 to 3 | 3 = high; can survive flood lasting for half or more of the growing season 2 = moderate; can survive flood lasting for a couple of weeks to 40% of the growing season 1 = low; can survive only brief periods of flooding | Based on “Anaerobic Tolerance” in USDA PLANTS which is the relative tolerance to anaerobic soil conditions. |
| D | Drought tolerance 2 | 1 to 3 | 3 = high; can survive and grow where drought is frequent and periodically severe 2 = moderate; can grow well where drought is never more than occasional and moderate 1 = low; can grow well only where drought is never more than infrequent and mild | |
| K | Salt tolerance 2 | 1 to 3 | 3 = high; can grow well under relatively high saline soil conditions 2 = moderate; can grow well under no higher than moderate saline soil conditions 1 = low; grows well only under relatively low saline soil conditions | Where not mentioned directly in data sources, it is assumed to be low, or, moderate if its native range typically has alkaline soils. |
| X | Shade tolerance 2 | 1 to 3 | 3 = high; can grow well under deep shade 2 = moderate; can grow well under shade that is not more than partial 1 = low; will not grow well in partial or deep shade | Shade tolerance is assumed to be moderate if not mentioned explicitly in data sources. |
| B | Breakage resistance | 1 to 2 | 2 = not prone to severe limb breakage in ice and windstorms 1 = prone to severe limb breakage in ice and windstorms | A species is assumed to be not prone to breakage if not mentioned explicitly in data sources. |
| M | Bird and mammal habitat | 1 to 2 | 2 = high 1 = average | A high rating identifies a species that has an especially high value compared to others of the same growth form (i.e., tree or shrub). |
| H | Pollinator habitat | 1 to 2 | 2 = high 1 = average | High-value species provide important nectar and pollen sources for bees, esp. late fall and early spring when there are few other sources. |
| E | Product potential | 0 to 2 | 2 = potential for significant commercial product or two or more local market products 1 = potential for a single local market product 0 = negligible or no product potential | Commercial products have significant potential for sale in geographically broad commodity markets. Local market products are most suitable for home use or sale in local farmers markets. |
| I | Visual quality | 0 to 1 | 1 = Exhibits a quality that creates special visual interest in a conservation planting. 0 = No special visual quality | Identifies if a species has special visual qualities that may be desirable in a planting, such as conspicuous foliage or flowers. |
| Plant Attributes | |||||||
|---|---|---|---|---|---|---|---|
| Product Pot. | Root Structure | Shade Density | Water Use | Crown Height | Weighting (n) | ||
| Attribute code | E | O | S | W | Z | ||
| Max value | 2 | 3 | 3 | 3 | 3 | ||
| Min value | 0 | 1 | 1 | 1 | 1 | ||
| Weighting | Required | 1x | 1x | 1x | 2x | 5 | |
| Best rating | Max | Max | Min | Min | Min | ||
| Flood tolerance | Crown height | Growth rate | Shade density | Weighting (n) | |||
| Attribute code | F | Z | G | S | |||
| Max value | 3 | 3 | 3 | 3 | |||
| Min value | 1 | 1 | 1 | 1 | |||
| Weighting | 2x | 2x | 1x | 1x | 6 | ||
| Best rating | Max | Max | Max | Max | |||
| Growth rate | Crown size/form | Life span | Weighting (n) | ||||
| Attribute code | G | C | L | ||||
| Max value | 3 | 4 | 3 | ||||
| Min value | 1 | 1 | 1 | ||||
| Weighting | 2x | 1x | 1x | 4 | |||
| Best rating | Max | Max | Max | ||||
| Flood tolerance | Crown size/form | Stand form | Veg. spread rate | Weighting (n) | |||
| Attribute code | F | C | T | V | |||
| Max value | 3 | 4 | 3 | 3 | |||
| Min value | 1 | 1 | 1 | 0 | |||
| Weighting | 2x | 1x | 1x | 1x | |||
| Best rating | Max | Min | Max | Max | |||
| Native status | Weighting (n) | ||||||
| Attribute code | Q | ||||||
| Max value | 3 | ||||||
| Min value | 1 | ||||||
| Weighting | 1x | 1 | |||||
| Best rating | Max | ||||||
| Crown size/form | Growth rate | Foliage porosity | Breakage resistance | Weighting (n) | |||
| Attribute code | C | G | P | B | |||
| Max value | 4 | 3 | 3 | 2 | |||
| Min value | 1 | 1 | 1 | 1 | |||
| Weighting | 2x | 1x | 1x | 1x | 5 | ||
| Best rating | Max | Max | Max | Max | |||
| Pollinator habitat | Weighting (n) | ||||||
| Attribute code | H | ||||||
| Max value | 2 | ||||||
| Min value | 1 | ||||||
| Weighting | 1x | 1 | |||||
| Best rating | Max | ||||||
| Stand form | Shade density | Water use | Growth rate | Weighting (n) | |||
| Attribute code | T | S | W | G | |||
| Max value | 3 | 3 | 3 | 3 | |||
| Min value | 1 | 1 | 1 | 1 | |||
| Weighting | 1x | 1x | 1x | 1x | 4 | ||
| Best rating | Max | Min | Max | Max | |||
| Flood tolerance | Crown size/form | Veg. spread rate | Root structure | Stand form | Resprout ability | Weighting (n) | |
| Attribute code | F | C | V | O | T | U | |
| Max value | 3 | 4 | 3 | 3 | 3 | 2 | |
| Min value | 1 | 1 | 0 | 1 | 1 | 0 | |
| Weighting | 2x | 1x | 1x | 1x | 1x | 1x | 7 |
| Best rating | Max | Min | Max | Min | Max | Max | |
| Crown size/form | Growth rate | Water use | Weighting (n) | ||||
| Attribute code | C | G | W | ||||
| Max value | 4 | 3 | 3 | ||||
| Min value | 1 | 1 | 1 | ||||
| Weighting | 1x | 1x | 1x | 3 | |||
| Best rating | Max | Max | Max | ||||
| Flood tolerance | Weighting (n) | ||||||
| Attribute code | F | ||||||
| Max value | 3 | ||||||
| Min value | 1 | ||||||
| Weighting | 1x | 1 | |||||
| Best rating | Max | ||||||
| Bird and Mammal Habitat | Weighting (n) | ||||||
| Attribute code | M | ||||||
| Max value | 2 | ||||||
| Min value | 1 | ||||||
| Weighting | 1x | 1 | |||||
| Best rating | Max | ||||||
| Crown height | Visual quality | Weighting (n) | |||||
| Attribute code | Z | I | |||||
| Max value | 3 | 1 | |||||
| Min value | 1 | 0 | |||||
| Weighting | 1x | 2x | 3 | ||||
| Best rating | Max | Max | |||||
| Foliage retention | Crown size/form | Foliage porosity | Growth rate | Weighting (n) | |||
| Attribute code | R | C | P | G | |||
| Max value | 2 | 4 | 3 | 3 | |||
| Min value | 1 | 1 | 1 | 1 | |||
| Weighting | 2x | 1x | 1x | 1x | 5 | ||
| Best rating | Max | Max | Min | Max | |||
Publisher’s Note: MDPI stays neutral with regard to jurisdictional claims in published maps and institutional affiliations. |
© 2022 by the authors. Licensee MDPI, Basel, Switzerland. This article is an open access article distributed under the terms and conditions of the Creative Commons Attribution (CC BY) license (https://creativecommons.org/licenses/by/4.0/).
Share and Cite
Bentrup, G.; Dosskey, M.G. Tree Advisor: A Novel Woody Plant Selection Tool to Support Multifunctional Objectives. Land 2022, 11, 397. https://doi.org/10.3390/land11030397
Bentrup G, Dosskey MG. Tree Advisor: A Novel Woody Plant Selection Tool to Support Multifunctional Objectives. Land. 2022; 11(3):397. https://doi.org/10.3390/land11030397
Chicago/Turabian StyleBentrup, Gary, and Michael G. Dosskey. 2022. "Tree Advisor: A Novel Woody Plant Selection Tool to Support Multifunctional Objectives" Land 11, no. 3: 397. https://doi.org/10.3390/land11030397