1. Introduction
There is a general understanding about the importance of cultural tourism for the economic development of destinations. Nevertheless, one cannot forget that the great success recognized by economic actors resulting from the tourist use of heritage can produce discomfort for the local community [
1]. Thus, tourism planning must be based on policies capable of improving the tourist experience in a responsible manner and safeguarding the residents’ quality of life. Consulting residents in local communities is an important piece for the creation of sustainable destinations in terms of tourism, since they are considered key actors in the development of sustainable tourism strategies [
2,
3].
Among the numerous investigations that address the strategies needed to reduce the negative impacts resulting from tourism revised by the authors in their literature review, several defended tourism taxation [
4,
5,
6,
7,
8,
9,
10]. Nevertheless, although there are numerous studies on residents’ perceptions of tourism [
3,
11,
12,
13,
14,
15,
16,
17], none of them analyzed this variable.
A recent study [
18] about the attitudes towards tourism confirmed a relation between residents’ perceptions and attitudes towards tourism and the impacts associated with this activity. Themes such as perception of the impacts of tourism in improving the quality of life or the role of residents in the image of the destination have been more widely researched than the perception of residents regarding the implementation of a tourist tax. According to an analysis of scientific articles on residents’ attitudes, the largest number of publications was conducted in the USA (
n = 19–21.1%) and only 5 (5.5%) in Spain, but none of them dealt with the residents’ perception of the implementation of a tax [
18].
Therefore, the literature review indicates that even though there are studies that analyze the impacts of implementing a tourist tax in a destination, none of them portrayed the resident’s point of view regarding that implementation. Nonetheless, a study of this type could serve to support political decisions that might be less consensual, and might prevent the increase of conflicts between residents and tourists and improve their relationship. The implementation of a tourist tax can also revert in favor of the preservation of the cultural heritage that has been under stress over the decades and especially in the last few years.
The implementation of a tourist tax is something that has been practiced in several countries for a long time (e.g., France and Italy) to minimize the externalities resulting from tourism. Even so, after numerous studies that discuss the effectiveness and benefits of such a tax [
10,
19,
20] in some consolidated destinations, this topic still raises great discussions, as is the case of Santiago de Compostela (Spain). Santiago de Compostela stands out as an object of research, as analyzes related to UNESCO World Heritage cities are still scarce, and even more so studies about the application of a cluster analysis, i.e., analyzing the perception of residents through segmentation [
17]. Tourist destinations included in the UNESCO’s World Heritage Site list demand special care because they must retain their especial universal value, and integrally meet the criteria outlined in UNESCO’s listings [
21].
Based on these assumptions, the two main objectives of this study are to assess residents’ perceptions of the impacts of implementing a tourist tax in the city of Santiago de Compostela and to segment residents according to their perceptions using a cluster analysis. Once the cluster analysis is carried out, we will be in the position to make more contributions to the design of strategies for sustainable tourism not only in a World Heritage Site, but in other cultural destinations as well. This research aims to offer tourism planners useful information regarding the implementation of a tourist tax in tourist destinations. Segmenting residents into different groups is useful for designing strategies to deal with the different groups in a destination [
22].
2. Research on the Implementation of Fees in Tourism
It is not an easy task to define the tourist product and identify the best way to levy taxes on tourist activities [
23]. The discussion about the adoption of taxes is complex, although taxes are intended to solve problems of public roads, generate funds that aimed to improve the environment and create infrastructure more aligned with the pressure economic activities. Moreover, revenue coming from tourism taxes could be used to carry out interventions in the urban landscape to optimize the destination, increase the resident’s well-being and improve the relationship between visitors and residents, since the local communities are the ones who suffer the most the impacts of tourism activity [
23,
24]. The numerous externalities caused by this activity generate costs that affect the economy and the environment, as well as the social and cultural life of the destination. Therefore, tourism taxation could offer a workable solution to those challenges [
25]. This makes sense, as taxing highly tourism-intensive sectors increases the destination’s revenue [
7]. In this way, tourists would bear the costs of the tax, while the inhabitants of the destination would enjoy the benefits of public spending [
26].
There have been many studies on the taxation of tourism; these studies range from taxation on transport and accommodation services to studies on the effect of the tax on tourist demand and tourism planning [
4,
5,
6,
8,
9,
10]. The movement to tax tourism can be used to amend problems such as the increased traffic congestion on the roads (improving infrastructure) and actions to avoid the deterioration of the environment [
27]. Furthermore, it is possible to accept the imposition of a tax as a reasonable and civilized solution to the problem caused by a large flows of tourists, since it allows for compensating the damage caused [
10].
Many of the largest tourist cities in the world have the Tourist Tax or Tourist Fee collected in hotels and other accommodations (e.g., Lisbon charges between €1 and €2, Barcelona charges up to €4.25, Paris charges up to €4.4, Rome charges between €2 and €3, and New York charges €3.5). It is generally not difficult to collect and manage these taxes, which results in limited compliance costs [
7]. As highlighted [
24], while part of the destinations dedicate the funds collected to the maintenance and conservation of the cultural heritage, other destinations employ these funds in the recovery of the ecological damage derived from anthropic pressure, which results mostly in investments for tourism promotion.
Out of the 45 types of tourist taxes identified [
7,
28], 30 are directly paid by tourists. In this regard, we will discuss taxes that aim to reduce the inconveniences caused by tourism. Some cities charge the fee at the end of tourist stay. In this case, it is a voluntarily contribution paid by the visitors, they are called Room Tax, Stay Tax or Tourist Tax. It is usually applied in destinations that have an organization specialized in capturing events, such as the Convention Bureau. It should be noted that even though the payment may be optional; however, in some European cities or countries, its collection is mandatory. The implementation of such taxes in Europe was based on European Union regulations that recommend the introduction of fees to guarantee greater efficiency in the transport system [
9], proposing to charge a tourist tax on the rental of tourist transport. Thus, it is understood that one should have tax incentives, such as specific taxes for this sector and Value Added Tax (VAT) [
29].
The tax regime can help stimulate the growth of tourism, as it can reduce the investment and maintenance costs of a tourist business. Although, most tour operators consider taxes as barriers to business and investment [
23]. A study on tourist tax elasticity in Florida identified that contrary to what researchers and the tourism industry believe, tourists may not be as sensitive to small changes in tax rates [
30]. Considering all the stress that the tourist activity places on the host communities and over its resources, most importantly over the natural environment, some aspects of taxation are important to reduce or mitigate some of its impacts from the perspective of sustainable management of the local economy [
31]. In theory, the hotel tax might be paid by visitors due to the scrutiny of tourist resources since it is related to the length of the visit in the host community [
23,
31]. Additionally, tourism development has potential risk to result in unplanned growth in destinations, which it can deplete the resources [
31]. Revenue raised from a tourist tax could be an important source of income to reduce or mitigate the impacts of tourism, despite the difficulties to implement it. An appropriate way of taxing tourism is the collection of a fee based on the tourists’ daily spending capacity; but, it is difficult to identify the spending standards of tourists on their performed activities. Therefore, a more realistic approach must be found in each city, region, or country. It is also important to highlight that tourism can be taxed in two ways [
31]: indirectly through the general tax system, particularly on profits and sales taxes, or directly through the introduction of special taxes, attached to tourist activities, especially for arrival, boarding fees, or hotel fees.
In this line, the authors of a study on tourism taxation of in Spain’s focusing Balearic Islands and its “ecotasa” [
8], found that a 10% accommodation tax generates significant public revenues, and increases social welfare. On the other hand, a VAT increase on the tourist products and services can have the same effects on tourist expenses, however it might cause greater impact on the country’s economy. Finally, it is notable that tourist taxes (fees) have become a simple alternative for the public administration to obtain extra income to finance investments, infrastructure, and social services. Since tourism represents a primary source of wealth and employment for many destinations, it is important not to impose excessive taxes on the sector [
20]. Thus, verifying the Italian model [
32], the authors confirmed that the tourist tax respects the principle of progressivity in relation to the classification of accommodation and the nights spent up to a maximum number of nights. In some cases, the fee is higher in the first few days, decreasing in the remaining days. There are some types of exemptions linked to minors, people with functional diversity and their companions, public transport drivers and tourist guides.
3. Methodology
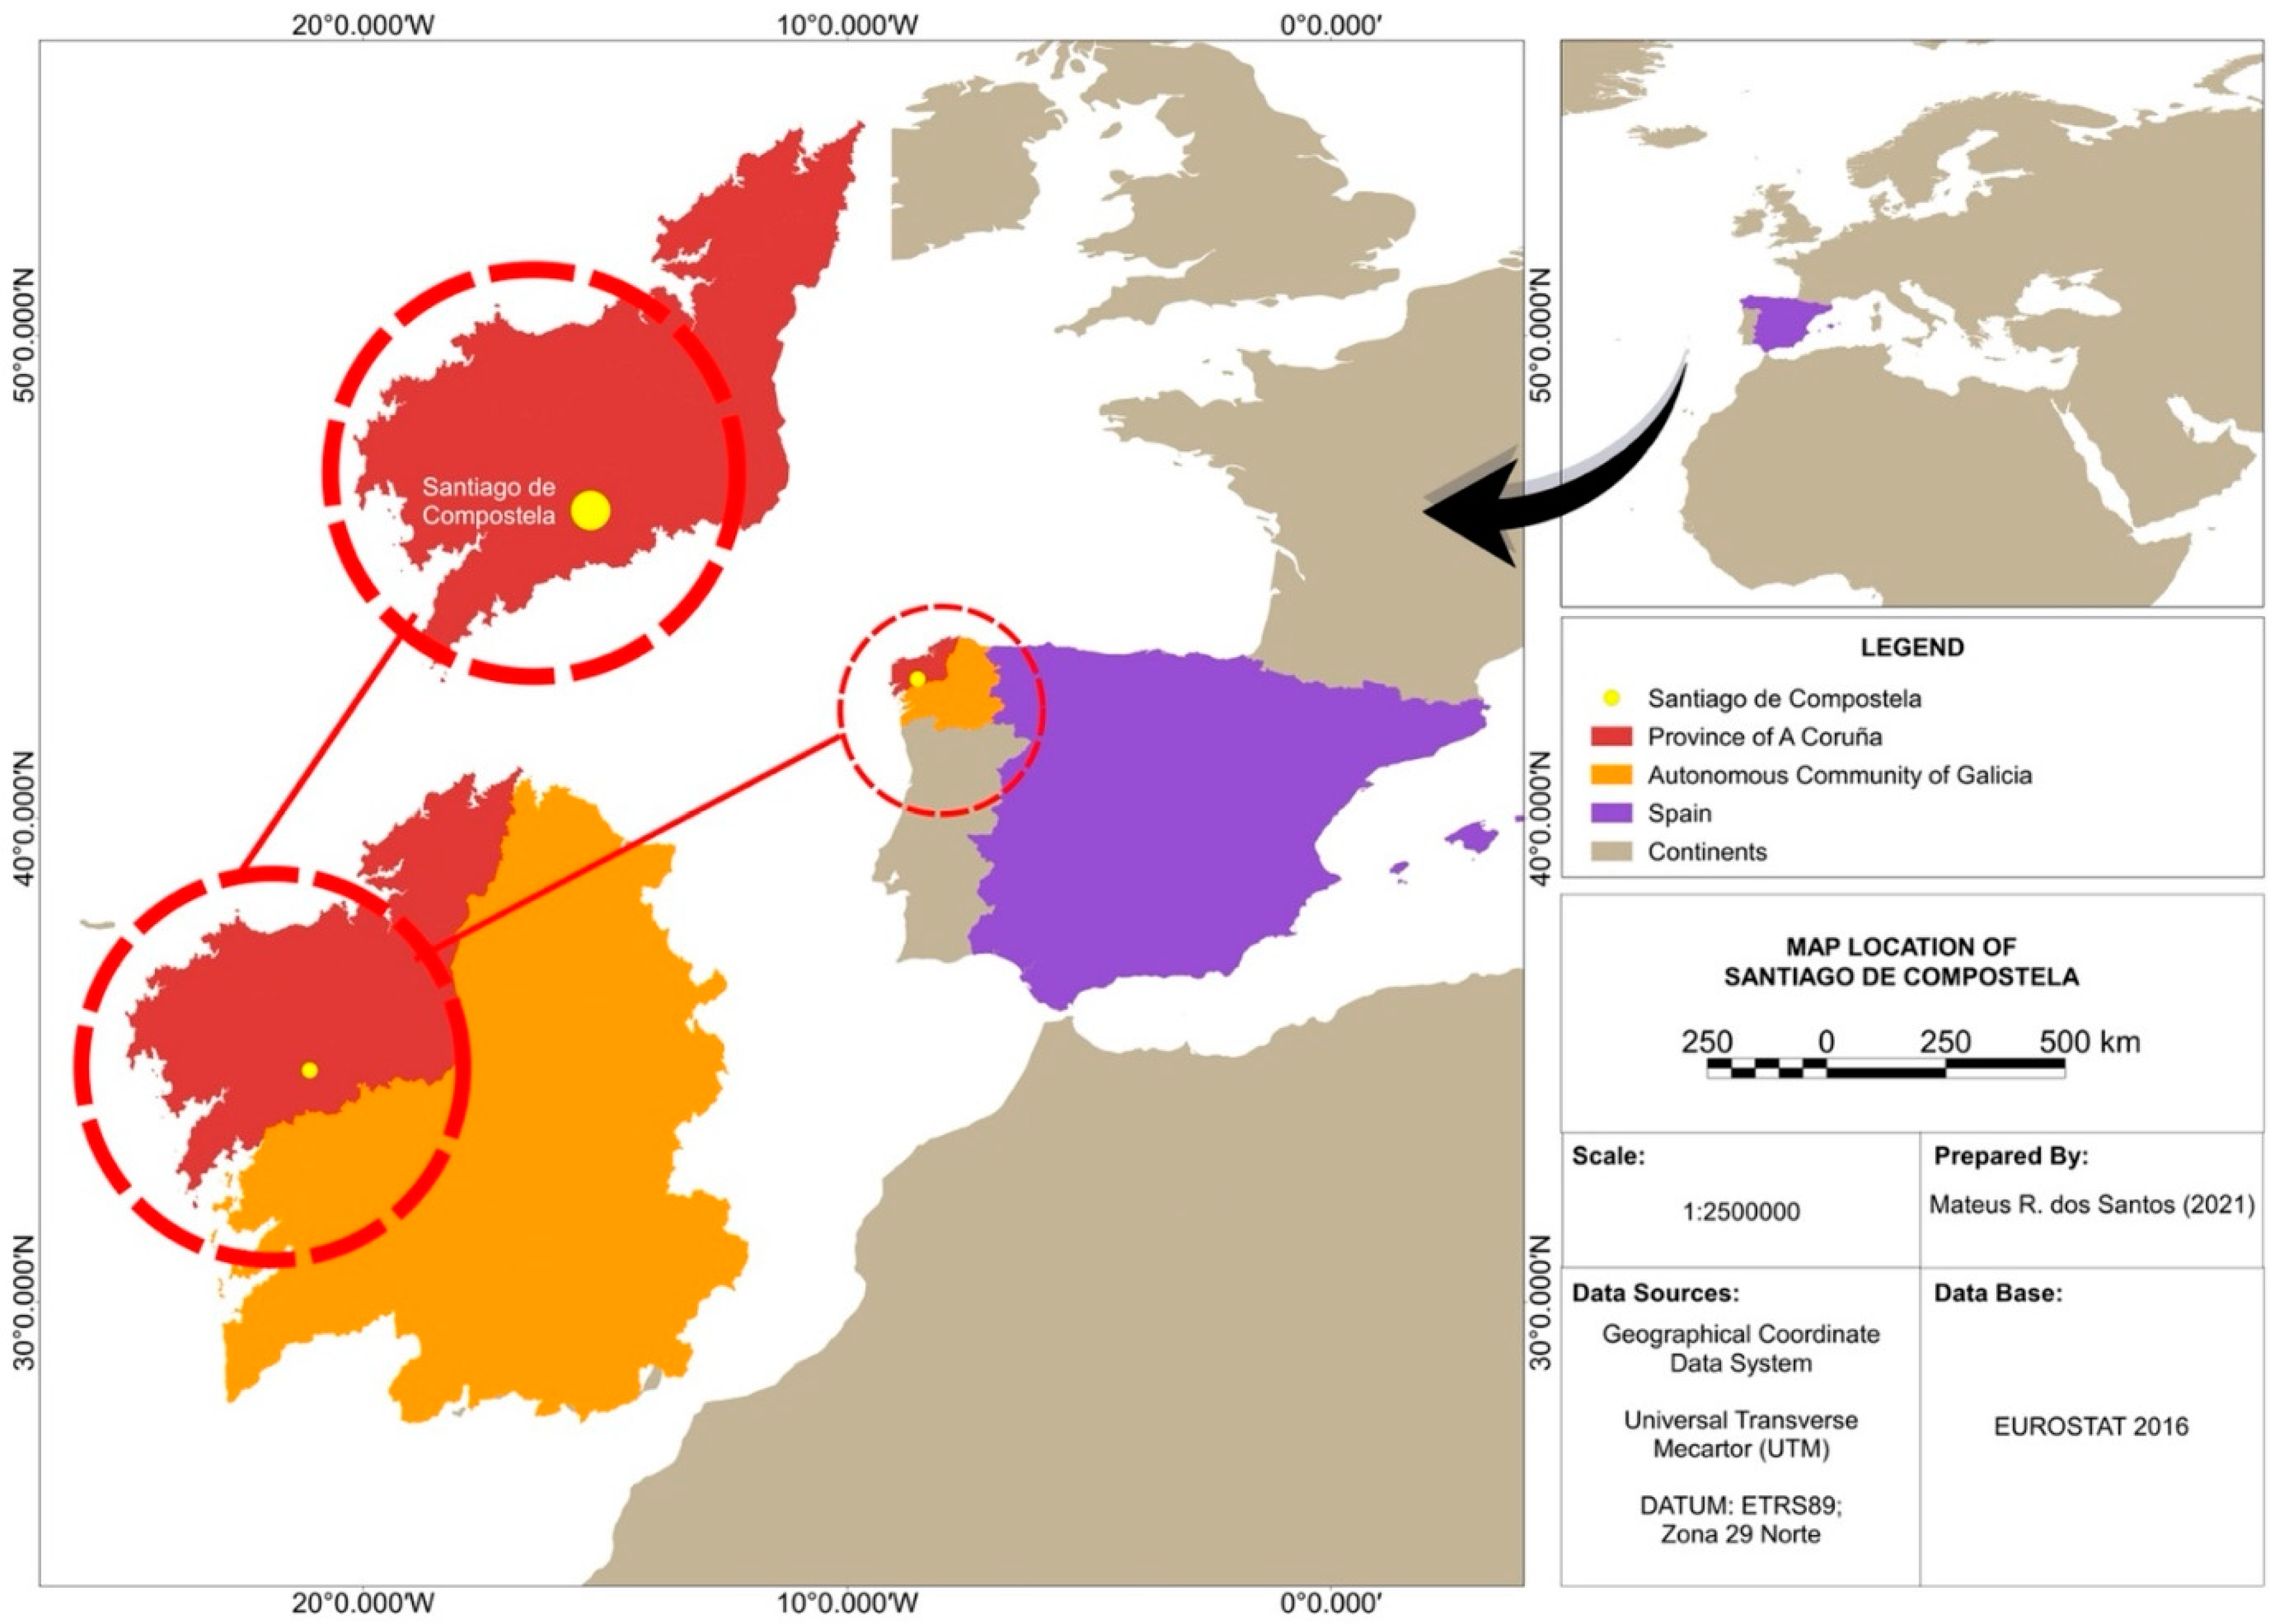
Before moving on to the technical aspects that defined the methodology of this research, it is important to briefly present the tourist situation of the destination object of this study, which is Santiago de Compostela (
Figure 1), one of the cities where the debate on the implementation of a tourist tax has recently resurfaced. In 2017, the local government of Santiago de Compostela raised the discussion about this implementation, but the Xunta de Galicia (Autonomous Government), did not accept this possibility, opposing the implementation of a tourist tax in the Galician capital. Santiago has a population of approximately 100 thousand stable inhabitants plus 23 thousand students who are not registered in the territory, but live there during the academic course [
33]. The city of Santiago de Compostela is a very special city in Spain, because of the considerable number of paths in the St. James’ Way that end in the city, Santiago is more exposed to overtourism than any other Spanish UNESCO World Heritage Sites, and, for that reason, it is necessary to assess the local community’s view about specific strategies to counter this scenario.
The city was declared a World Heritage Site by UNESCO in 1985, due to its urban complex, monumental integrity and because it is the destination of an ancient pilgrimage route. From the 9th century on, the Camino de Santiago became a meeting place for the faith and thought of the Western world. It has 16 museums and surprising contemporary architecture [
33]. Santiago is also the protagonist of the Xacobeo events, which take place at a regular rate of 6-5-6-11 years. In addition, the destination is the stage for several cultural events, such as popular festivals and annual festivals of music, cinema, theater, and art exhibitions. It is also important to highlight the apostle’s festivals held in July, declared of International Tourist Interest [
33].
The place attracts millions of visitors throughout the year. Some of them motivated by devotion and others by their monumental beauty. There are also those who choose Santiago de Compostela as the location for their professional events. The destination offers a network of accommodation of more than 10,700 beds, specific infrastructure for meetings and conferences, and a substantial gastronomic offer. All this in a region in which tourism accounted for 10.4% of the economy’s GDP in 2018 and 11% of employments (123.772 people are employed in tourism) [
34]. In addition, it received more than 5.1 million tourists in 2019, making Santiago the destination with the largest number of overnight stays in the region, reaching the mark of 1.4 million in 2019 [
34]. According to data offered by Turismo de Santiago, the Camino also achieved in 2019 a new historical peak, with almost 350,000 pilgrims (whose final destination was the city of Santiago de Compostela) and a growth of 6% over 2018 [
35].
Most of the local stakeholders in Santiago de Compostela are aware of the threat of overtourism [
36]. The perception of overtourism seems to be conditioned by people’s personal circumstances, by their economic and professional interests and, mainly, by the space-time variable. Tourist congestion with the ensuing overtourism issues intensify in the of the Old City of Santiago, a small must-see tourist attraction which, experiences a strong concentration of tourists. As a result of these figures, Santiago, the final destination in the Way of St.-James (the “Camino”, as it is popularly known), has become a massive destination. In recent years, alarms have been triggered, especially as a result of the discontent of the local population. The World Heritage Cities group aims to defend common interests, study solutions to similar problems, as well as promote quality tourism. For this reason, such a study can be of great help for future action.
This study was designed on the characteristics of the territory and the tourist situation. It is a quantitative study, based on primary and secondary sources. Regarding primary sources, a survey by questionnaire was conducted amongst residents and non-residents of the city of Santiago de Compostela (capital of Galicia—Spain). In total, 614 questionnaires were collected from February to June 2018 using a convenience sample. As it was important for respondents to have a citizen relationship with the city (either live or work there), an initial question was asked to ensure that those who did not have this relationship could not answer the questionnaire. Based on this premise, 588 questionnaires were considered with complete data (margin of error 5% and confidence level 95%).
A pre-test was carried out with 11 people from different levels of education, social classes, age groups and gender. During the pre-test, it turned out that an average of 9 min were necessary to fill the questionnaire out. For the final version, some adjustments were made to make some questions clearer and more objective and, as the survey was online, it was mandatory to answer the entire questionnaire in order to finalize and send it. It must be noted that after a questionnaire in paper was used in the first phase of the survey, which proved to be very hard, the authors decided to use the online version of the questionnaire to continue with the survey. As 85.6% of the population residing in Santiago de Compostela has access to the Internet [
37], we considered that this methodology was the most appropriate. In addition to a more effective and safer procedure, the online survey ensured that all the questions were answered and, therefore, valid for our analysis.
Previous studies on the residents’ perceptions about the impacts of tourism were the base for the questionnaire [
2,
12,
14,
16,
17,
38,
39,
40]. Although some studies have sample numbers below 300 while others exceed 1000 responses [
3], most studies consider samples between 350 and 450 questionnaires [
17,
38,
41,
42].
Nevertheless, this is the first questionnaire to be designed and used to collect the residents’ perceptions about tourist tax. As Cronbach’s alpha of the scale resulted in 0.879 (greater than the minimum acceptable 0.8), the instrument passes the test of reliability [
43,
44,
45]. This indicates your ability to measure that construct. Thus, the result was a questionnaire with 26 questions, most of which were categorized and structured according to a five-level Likert scale, ranging from the “strongly disagree” option to the “strongly agree” option. At the end, the respondent’s sociodemographic information (age, gender, education level, family income, occupation) was included. Some geographical variables, such as being born in the municipality, the time the person lived in Santiago de Compostela and the parish where they lived were also provided. In this article, only the question related to the tourist tax was considered for analysis (Indicate your opinion regarding the introduction of a tourist tax in Santiago, with 1 not in agreement with the measure and 5 in complete agreement). In case of no having no opinion, respondents were asked to check the box “without opinion”. Four statements that covered various arguments for the implementation of the tourist tax were then offered: (a) It would improve the economic impact of tourism in the city; (b) it would help reduce tourism seasonality in the city; (c) it would be positive for the city; and (d) it would be positive for me.
Taking as a starting point the study performed by Vareiro, Remoaldo and Cadima [
17], the statistical procedures were performed, the SPSS software (version 24) was used in the following research steps. The first step, the “univariate” statistical data calculation, was performed for all items on the survey. In the second step, a unidirectional ANOVA analysis was performed, and
t-tests were used to identify differences between six sociodemographic variables in relation to the 4 items that measure the perception regarding the tourist tax included in question 11. When the independent variable was divided in two groups (gender, link with the tourism industry),
t-tests were applied. ANOVA tests were applied when the independent variable was divided into three or more subgroups (neighborhood, level of education, family income, exposure to tourism). In the third step, a non-hierarchical cluster analysis was performed. It used the k means cluster algorithm for each of the 4 items, and they measure residents’ perceptions regarding the implementation of a tourist tax. Therefore, those residents could be grouped only by their perceptions, as the sociodemographic variables were not accounted for.
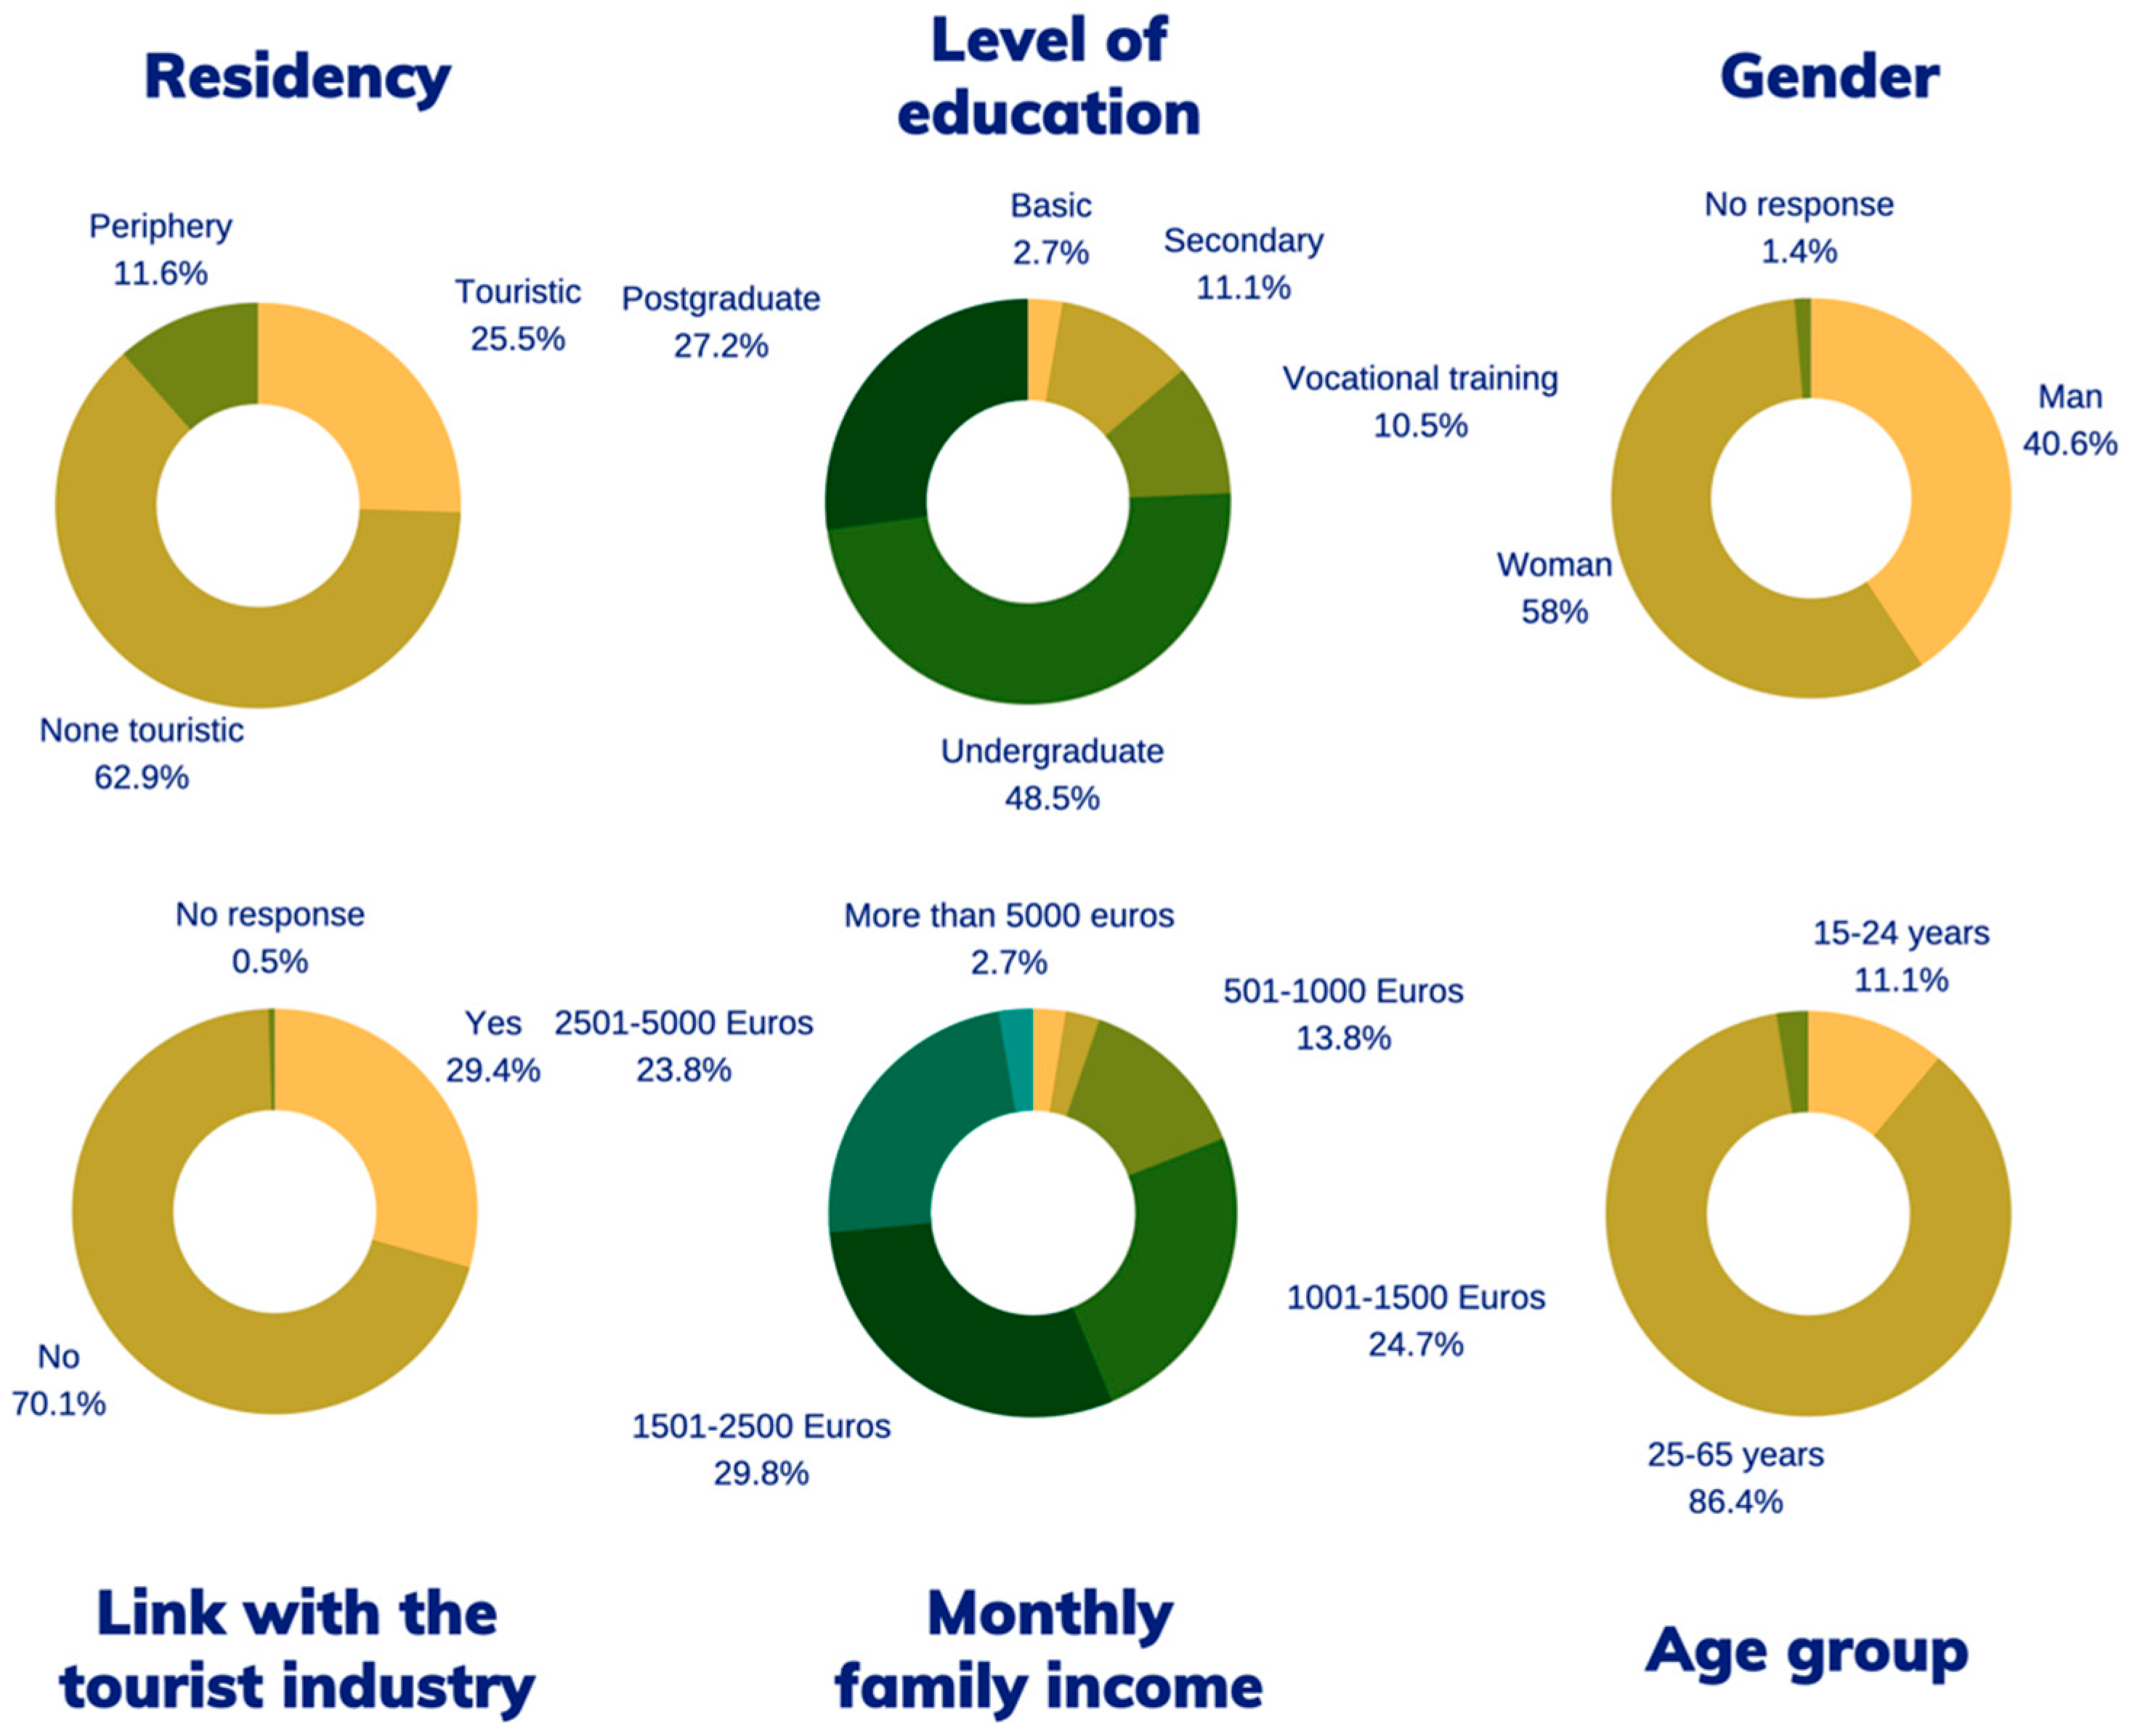
Regarding the sociodemographic profile of the subjects of the survey sample, 58% of respondents were female, very similar to the 54% that were registered in 2018 [
46]. About the age group, most respondents were between 25 and 65 years old (86.4%—
Table 1), corresponding to an underrepresentation of this age group, since in the municipality the percentage is 65% of the population [
46]. Only 30% worked in the tourism industry. As for the variable level of education, 48.5% had university studies and 27.2% achieved a master’s degree or a Ph.D. The second most representative level was that of people with secondary education (11.5%). Finally, we found 10.5% of the population with professional training and only 2.7% with primary education. This section may be divided by subheadings. It should provide a concise and precise description of the experimental results, their interpretation, as well as the experimental conclusions that can be drawn.
Most respondents (74.5%) live in non-tourist neighborhoods, with 62.9% living in the urban area. The remaining 25.5% live in in the Old City (Zona Vella) or in the neighborhood of São Pedro, tourist neighborhoods within the city. In addition, 11.6% of the respondents live in the outskirts of the city, away from the urban area but maintaining some daily relationship (work or study) with Santiago de Compostela. The remaining sociodemographic characteristics of the respondents lead us to consider that we are dealing with a sample that corresponds to a middle/lower-middle class (
Figure 2).
4. Results
It is important to point out some general data about the sample.
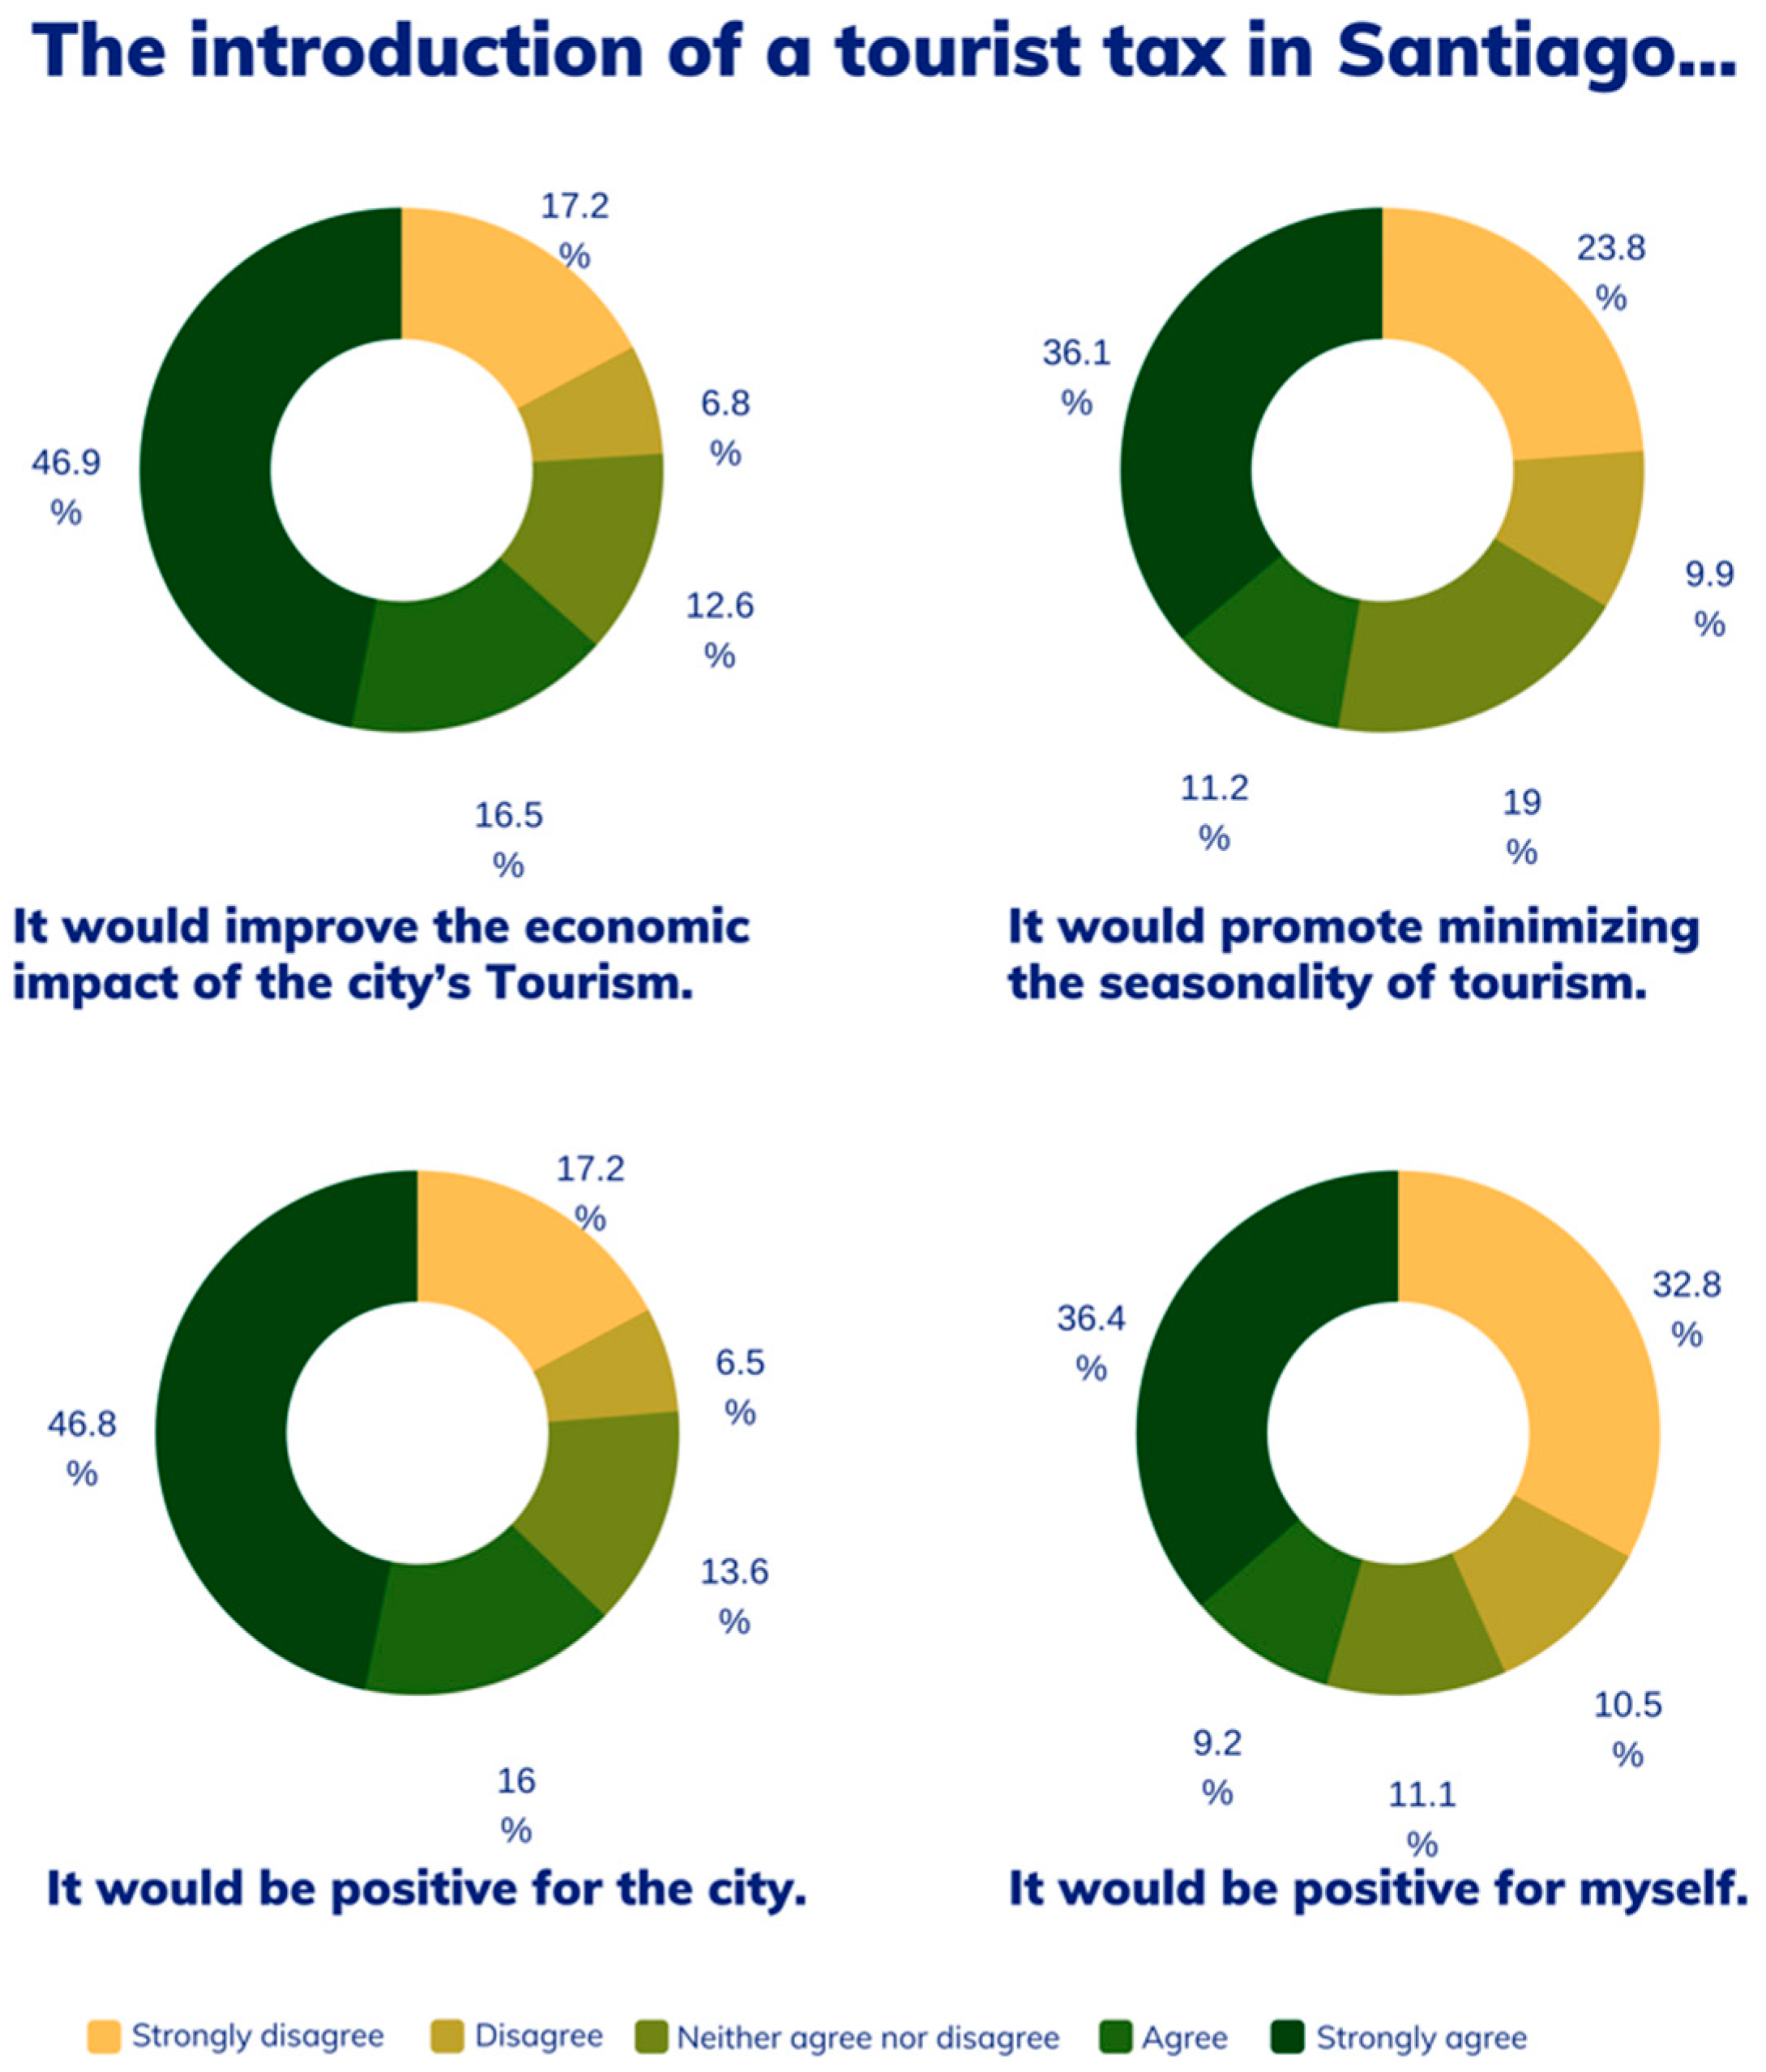
Table 2 presents the results for the four statements and the answers to the items related to the implementation of the tourist tax. For all items, the Likert scale ranged from 1 “strongly disagree” to 5 “strongly agree”. An examination of the available data reveals that, in general, respondents agreed to the implementation of a tourist tax in Santiago de Compostela.
Using the statement “The introduction of a tourist tax in Santiago would improve the economic impact of tourist in the city”, we can conclude that 63.4% of respondents expressed a positive opinion about the tourist tax, they are agreeing that it was good for the city. In the same line, when asked if it would be positive for the city, 62.8% said yes. This result leads us to conclude that the desire to implement a tourist tax should be discussed with representatives of residents’ associations and with other stakeholders, since there is still a considerable percentage of respondents who do not consider the tourist tax positively (
Figure 3).
Almost half of the respondents (47.3%) expressed a less positive perception regarding the statement “The introduction of a tourist tax in Santiago would promote minimizing the seasonality of tourism in the city”. Even so, it is questionable that if we consider only the respondents who chose to agree/disagree completely with these statements, a total number of 32.8% expressed total disagreement with the statement that “The introduction of a tourist tax in Santiago would be positive for me”. This is probably because the residents of Santiago de Compostela think more about the collective good and the city than about themselves.
4.1. Anova and Testes t
Some statistical differences were found when the ANOVA analysis and
t-tests were performed, and the results are detailed in the sequence. While analyzing the variable “Do you usually have contact with tourists (at work or during leisure time)?”, it was found that, although there were no significant differences between the level of contact, those who have more contact with tourism are more in agreement with the benefits of a tourist tax. This means that, except for the indicator “The introduction of a tourist tax in Santiago would promote minimizing the seasonality of tourism in the city”, the people who are most in contact with visitors (often or very often) are those who present higher averages regarding the positive effects of a tourist tax. Therefore, the results of the ANOVA tests (
Table 3) indicated that residents who have frequent contact with tourists at work understand that tourism would benefit from the implementation of a tourist tax. When analyzing contact with tourists during leisure time (there are also no significant differences for the factors considered), a strand was identified that leads us to confirm that the respondent is in agreement with the proposal regarding the introduction of a tourist tax in Santiago de Compostela, thus being a generalized perception. Focusing on averages, those who never have contact with tourists during leisure time, and those who have contact very often have a very positive perception of the use of taxes.
The level of education was discriminatory in only one of the statements (“The introduction of a tourist tax in Santiago would be positive for the city”).
Table 4 indicates that the higher the education level of residents, the better expectations about the implementation of a tourist tax in the city.
NOVA test (
Table 5) represents the differences for the respondents’ net monthly family income variable. Respondents with less income are those who have a more positive perception for the statement that the tourist tax “would promote minimizing the seasonality of tourism in the city”.
In relation to the neighborhood of residence (tourist, non-tourist and outskirts of the city of Santiago de Compostela), we can highlight that people who live in a tourist district of the city see the effects of a tourist tax more positively. On the contrary, people who live outside the city, on the outskirts, are those who least agree with these effects. However, according to the results presented in
Table 6, it is true that we found no significant differences for the statements considered. Thus, examining the data, we found that residents, regardless of the neighborhood where they live, agreed to the implementation of a tourist tax in Santiago de Compostela.
The last ANOVA test carried out relates the perception regarding the implementation of a tourist tax in the city of Compostela with the respondents’ age group. Considering the four statements, there was a significant difference only for the statement “The introduction of a tourist tax in Santiago would be positive for the city”. In
Table 7, we can see that respondents under 24 are the residents who least agree with this statement.
For the two remaining independent variables (gender and link with the tourism industry),
t-tests were performed, and many significant differences were found in relation to the implementation of a tourist tax in the city (
Table 8). Specifically, female respondents perceive a less positive impact on the implementation of a tourist tax. It is true that the averages demonstrate that they are in accordance with the statements; however, the averages are lower than the ones in male respondents. This leads us to believe that the latter are more cautious when giving their opinion on this matter. Even if they agree, they may not want to be blunt in their responses. In relation to gender, the only indicator where there are no significant differences is that which relates the implementation of a tourist tax with effects on the seasonality of tourism.
4.2. Cluster Analysis
Considering that in the cluster analysis there is no single correct solution, a sample of individuals can be grouped into two, three, four or more conglomerates, depending on the solution chosen by the researcher. Therefore, we consider the following as the most important aspects.
- (1)
It was taken into consideration that the number of conglomerates be interpretable.
- (2)
It was taken into consideration that the conglomerates were statistically different.
This second factor is very important, since the cluster analysis offers a solution to group individuals in the sample. However, it does not mean that the groups found are sufficiently homogeneous internally, and heterogeneous between them. Therefore, to test that the groups were different and with statistical significance, after the hierarchical analysis was performed, the MANOVA analysis was also performed. Thus, the result is significant, since for the MANOVA test to be successful, there must be significance (
p < 0.05) for the following three indicators: Hotelling Moth (0.000), Willks Lambda (0.000) and Pillai (0.000). In addition, for all four indicators “
p” was equal to 0.000 (
Table 9), showing that the groups are statistically different.
The non-hierarchical grouping technique is designed to group cases, and not variables and it can be applied more efficiently in sets with a high number of observations (588 in this study). This way, we tried not to influence the development of the number of groups. In this sense, following the steps [
22,
40,
47], the groups were formed, based on the average scores of the four statements of perceptions regarding the implementation of the tourist tax. As can be seen in
Table 9, the selected groups account for more than 5% of the sample. In fact, there is a good distribution of the sample since everyone is around 1/3 of the total respondents.
An analysis of the different clusters was carried out examining the averages for the four statements (
Table 9), thus revealing the agreement/disagreement of the respondents in relation to these statements for each cluster. In addition, it is indicated that the contribution of all perceptions was significant for the definition of clusters. We found three statistically different clusters and identified the following profiles related to the respondents’ opinion in relation to the implementation of a tourist tax at the destination in question:
- (1)
Skeptics—the individuals in this cluster show a moderate position on the positive impacts of implementing the tourist tax and disagree that this tax will be beneficial for themselves. For these people, the individual good prevails over the common good.
- (2)
Enthusiasts—they are the most firmly convinced, these are individuals with optimistic opinions about the positive impacts of implementing a tourist tax.
- (3)
Reactionaries—they are the individuals most firmly convinced of the lack of benefits gained from implementing a tax on city tourism. Looking at the perceived benefits of implementing a tourist tax in Santiago de Compostela, the statement that illustrates a greater degree of differentiation between groups is that the tax “would be positive for me”.
According to the results, the following clusters were found (
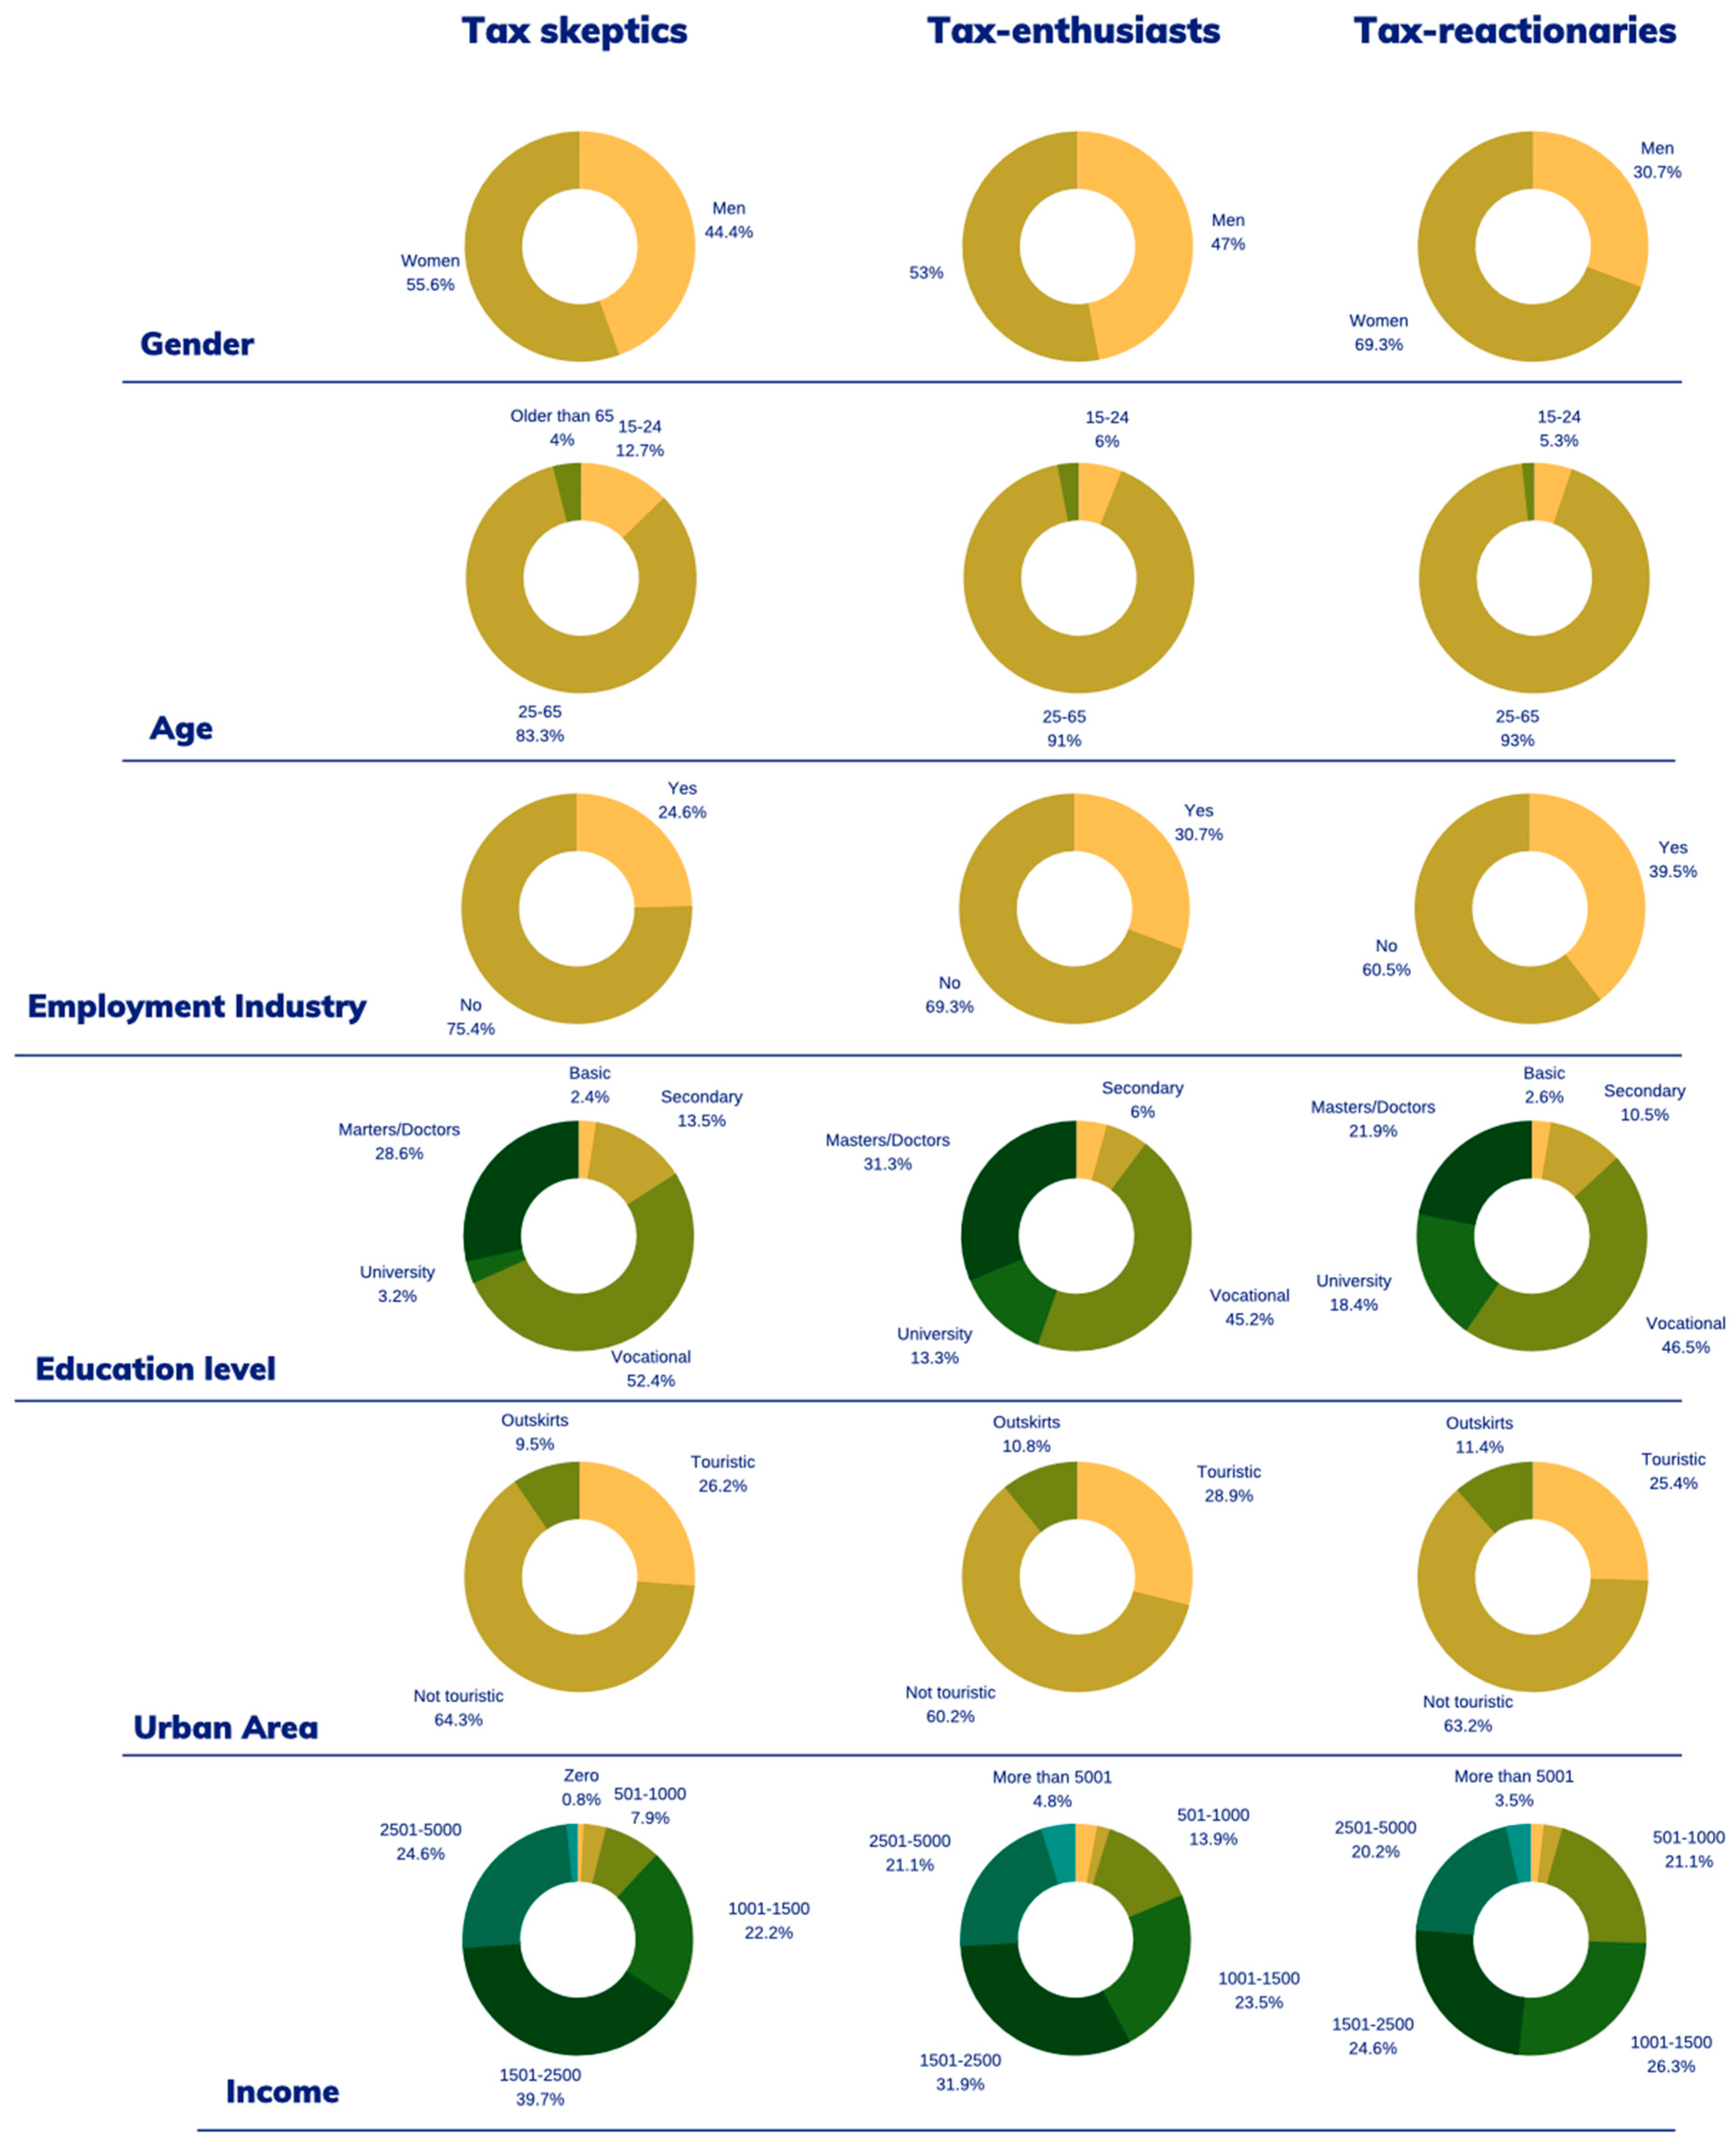
Figure 4).
Cluster 1—Tax-skeptics. They are people who believe in the effect of the common good of the tourist tax (positive for the city, positive for the city’s economy, and positive to reduce tourism seasonality), but who believe that the tax will not be positive for themselves. They constitute 31% of the sample. This cluster shows a moderate position for the positive effects of the implementation of the tax and a low position regarding the reduction of tourism seasonality. Finally, regarding the effect of this tourist tax on themselves, these individuals are emphatic that the effect would not be positive. This answer is not surprising, since approximately 75% of its members live outside the tourist area of the city. In general terms, comparing with the other clusters, this segment has intermediate values for the four analyzed statements. This cluster is where gender is best distributed, it did not present greater representation of men or women. Apart from the three segments, this cluster is where there is the presence of youngsters under the ages of 25 and over 65 years, and in which we also perceive that there is a greater number of people with income starting at 1500 euros per month (65.9%). It is also the cluster with the highest percentage of people (over 80%) with undergraduate or postgraduate university level.
Cluster 2—Tax-enthusiasts. It is the largest of the three groups, making up 40% of the sample. It is the only segment that considers that the implementation of the tourist tax is good for themselves (it is highest average accounting for 4.27, with 77% agreement). While the subjects in the other clusters do not agree that the implementation of a tourist tax is positive for themselves, the enthusiasts are the only ones who completely agree with it. They have extremely positive opinions about the benefits of the implementation, fully agreeing with its implementation. This cluster is the only one that assumes that the tax may help to reduce tourism seasonality. Furthermore, it is the one that best recognizes the advantages of implementing the tax. Compared to the others, it is the cluster with the highest percentage of males. However, what is most remarkable to differentiate this cluster from others is the fact that in this group is found the greatest presence of people who live within Santiago de Compostela’s tourist districts, 30% of the respondents live in the most visited area. We can infer their inclination for the implementation of the tax, since those who live in a tourist region are the people who suffer the greatest effects of this socio-economic activity (positive and negative). This result matches the results of the studies carried out in Santiago de Compostela by Gabriel et al. [
1], where the authors concluded that people who reside in tourist regions have a more critical view on the use of their historical heritage for tourism purposes.
Cluster 3—Tax-reactionaries. This cluster consists of 28% of the sample respondents. They are convinced that the implementation of a tourist tax in the city will not have positive impacts. This marks a clear difference from the previous two clusters, where more positive responses regarding the benefits of the implementation of a tourist tax were found. It is interesting to observe the comparison between the averages to realize that the opposing subjects agree that the rate would have a negative impact on tourism. In short, they do not perceive benefits for the implementation of a tourist tax in Santiago de Compostela, neither for the city nor for themselves. Comparing the three segments, this cluster has the highest participation of females (69%) and has the highest percentage of people working in tourism (40% of respondents). This result leads us to think that this segment is reluctant to implement the tax out of fear that tourism will suffer, and with it, the respondents’ sources of income, since they work in the sector.
5. Discussion and Conclusions
Even though many empirical studies have been produced at the international level on residents’ perceptions and attitudes towards tourism and the impacts associated with this activity, the authors have not identified in their review of the literature any scientific articles dedicated to the perceptions of the implementation of tourist tax neither in cultural and historical tourism destinations, nor in UNESCO’s World Heritage Sites.
The research produced has not focused on residents’ perceptions regarding the tourist tax, a topic which is insufficiently studied despite its relevance. Among other reasons, this gap was one of the main motivations for conducting this research. Other of the reasons that account for our choice is the fact that a heated discussion on the convenience of implementing a tourist tax has arisen recently within Galician society. Moreover, even though many studies that evaluate and forecast the economic effects of the implementation of a tourist tax in different destinations, no study has evaluated and compared residents’ perceptions from a social perspective.
The results obtained are in line with those of other studies referenced in this article. This allows us to suggest that tourism planners must establish strategies capable of generating further positive impacts, minimizing the externalities of this economic activity. Although there is no homogeneous perception on the use of such a tax, we can conclude that Santiago de Compostela’s residents strongly support the use of taxes to improve the quality of tourism in their city. This optimism can be justified owing to the fact that Santiago de Compostela is a mature destination that experiences a lower tourist pressure than Valencia or Barcelona, which are high tourist destinations [
48]. Thus, tourist pressure influences the perception of residents regarding the impacts of this activity [
41].
Another important contribution of this study is the cluster analysis, which can prove helpful for policy makers and tourism planners when taking strategic decisions as it segments residents into groups according to their common perceptions about the effects of the implementation of a tourist tax. As widely known, before certain political decisions are made, their electoral repercussions are assessed. By utilizing the cluster analysis technique, we were able to identify three groups: tax skeptics, tax enthusiasts and tax reactionaries.
From the results presented in this article, we can conclude that Santiago de Compostela’s population perceives positively the implementation of a tourist tax in the city. Thus, we believe that the local authorities, with the help of other stakeholders, should design future tourism strategies in this regard to mitigate the negative effects of tourism, improving the relationship between visitors and residents, and increasing the perception of the positive impacts of this activity. As this study only focuses on the perception of the residents, local authorities must assess other stakeholders’ perceptions on the implementation of a tourist tax (e.g., tourism business managers, directors of public institutions), contributing other solutions to meet the demands of residents.
It is the first time that a cluster analysis of this type has been used to analyze the perception of the implementation of a tourist tax. Therefore, other researchers are encouraged to use similar studies to compare and validate this nomenclature. Regarding the clusters found, we highlight the so-called “tax skeptics”; they are labeled this way because they believe in the positive effect of implementing a tourist tax for tourism in the city, but not for them. Approximately 75% of those who belong to this group live outside the tourist area of the city and their demographic profile is not distinguished according to gender, but it is marked by including mainly younger and more educated residents.
“Tax-enthusiasts” make up the largest group comprising 40% of the sample. In addition to being a group that has extremely positive opinions on the benefits of implementing a tax, they are the only ones who consider that the implementation of the tourist tax is good for themselves. We can conclude that the extremely positive perception of these subjects may be in close relationship with the nature of the city as a mature tourist destination. Even so, what is most notable for differentiating the residents who belong to this cluster is the greater presence of people who live in the tourist districts of the city of Santiago de Compostela, that is, the individuals most affected by this activity. This result matches the results of the studies by Gabriel et al. [
1], who concluded that people who reside in tourist regions have a more critical view on the use of their cultural heritage for tourism purposes. Finally, from the analysis of the group of “tax reactionaries”, the people who are completely opposed to the implementation of a tourist tax, we conclude that this segment is reluctant to the implementation of the tax because, as they work in the tourism sector, they fear that the tax will affect tourism in the city, and with it, their source of income. This cluster has the largest share of people working in tourism (40% of respondents).
Due to the conclusions, this study also envisaged contributing to the advancement of strategies in understanding the implementation of a tourist tax in Santiago de Compostela. However, we firmly believe that it will be of great importance that political decisions, with their respective tourism planning in Santiago de Compostela, maintain an attitude closer to the perceptions of the local population in relation to the sector. Local strategies must therefore incorporate residents’ concerns based on the argument [
4] that a tax on tourism could resolve tourism externalities.
Finally, public tourist policymakers should not be afraid to move towards improving the quality of tourism. This is because, on one side of it, the results of this investigation demonstrate that although Santiago de Compostela’s residents are critical of tourism, they do not demonstrate to be against this activity. Likewise, at least tax-skeptics and tax-enthusiasts (more than 70% of the population) agree that a tourist tax helps to improve the quality of tourism; therefore, they endorse the decisions of the planners of this very important activity that affects both the lives of the residents. Furthermore, it is worth noting that, contrary to what researchers and the tourism sector think, tourists are not sensitive to small changes in tax rates [
30].
This study was the first approach to investigate the perceptions of Santiago de Compostela’s residents about the implementation of a tourist tax. It followed the approaches of several other authors; we recommend that future research focus on evaluating other destinations in different life cycles (emerging or consolidated) to validate the instrument. It is important to remember that, although we managed to obtain a good sample volume it was difficult to obtain the perception of elderly residents. The absenteeism of elderly’s position is one of the limitations of the study carried out, it is proposed for future works to invest in more qualitative manner studies, it might venture on several focus groups, cultural and recreational institutions representing residents.
Finally, we remind you that the data from this survey were collected in 2018. Additionally, in the last two years, the world tourism sector was subject to the effects of a pandemic. Therefore, we see, as future lines of research, the carrying out of comparative studies to continue investigating the implementation of a tourist tax in destinations such as Santiago de Compostela.


 ,
, 


