
Monitoring the Permafrost Conditions along Pipeline Routes in Central Yakutia, Russia

Abstract
:1. Introduction
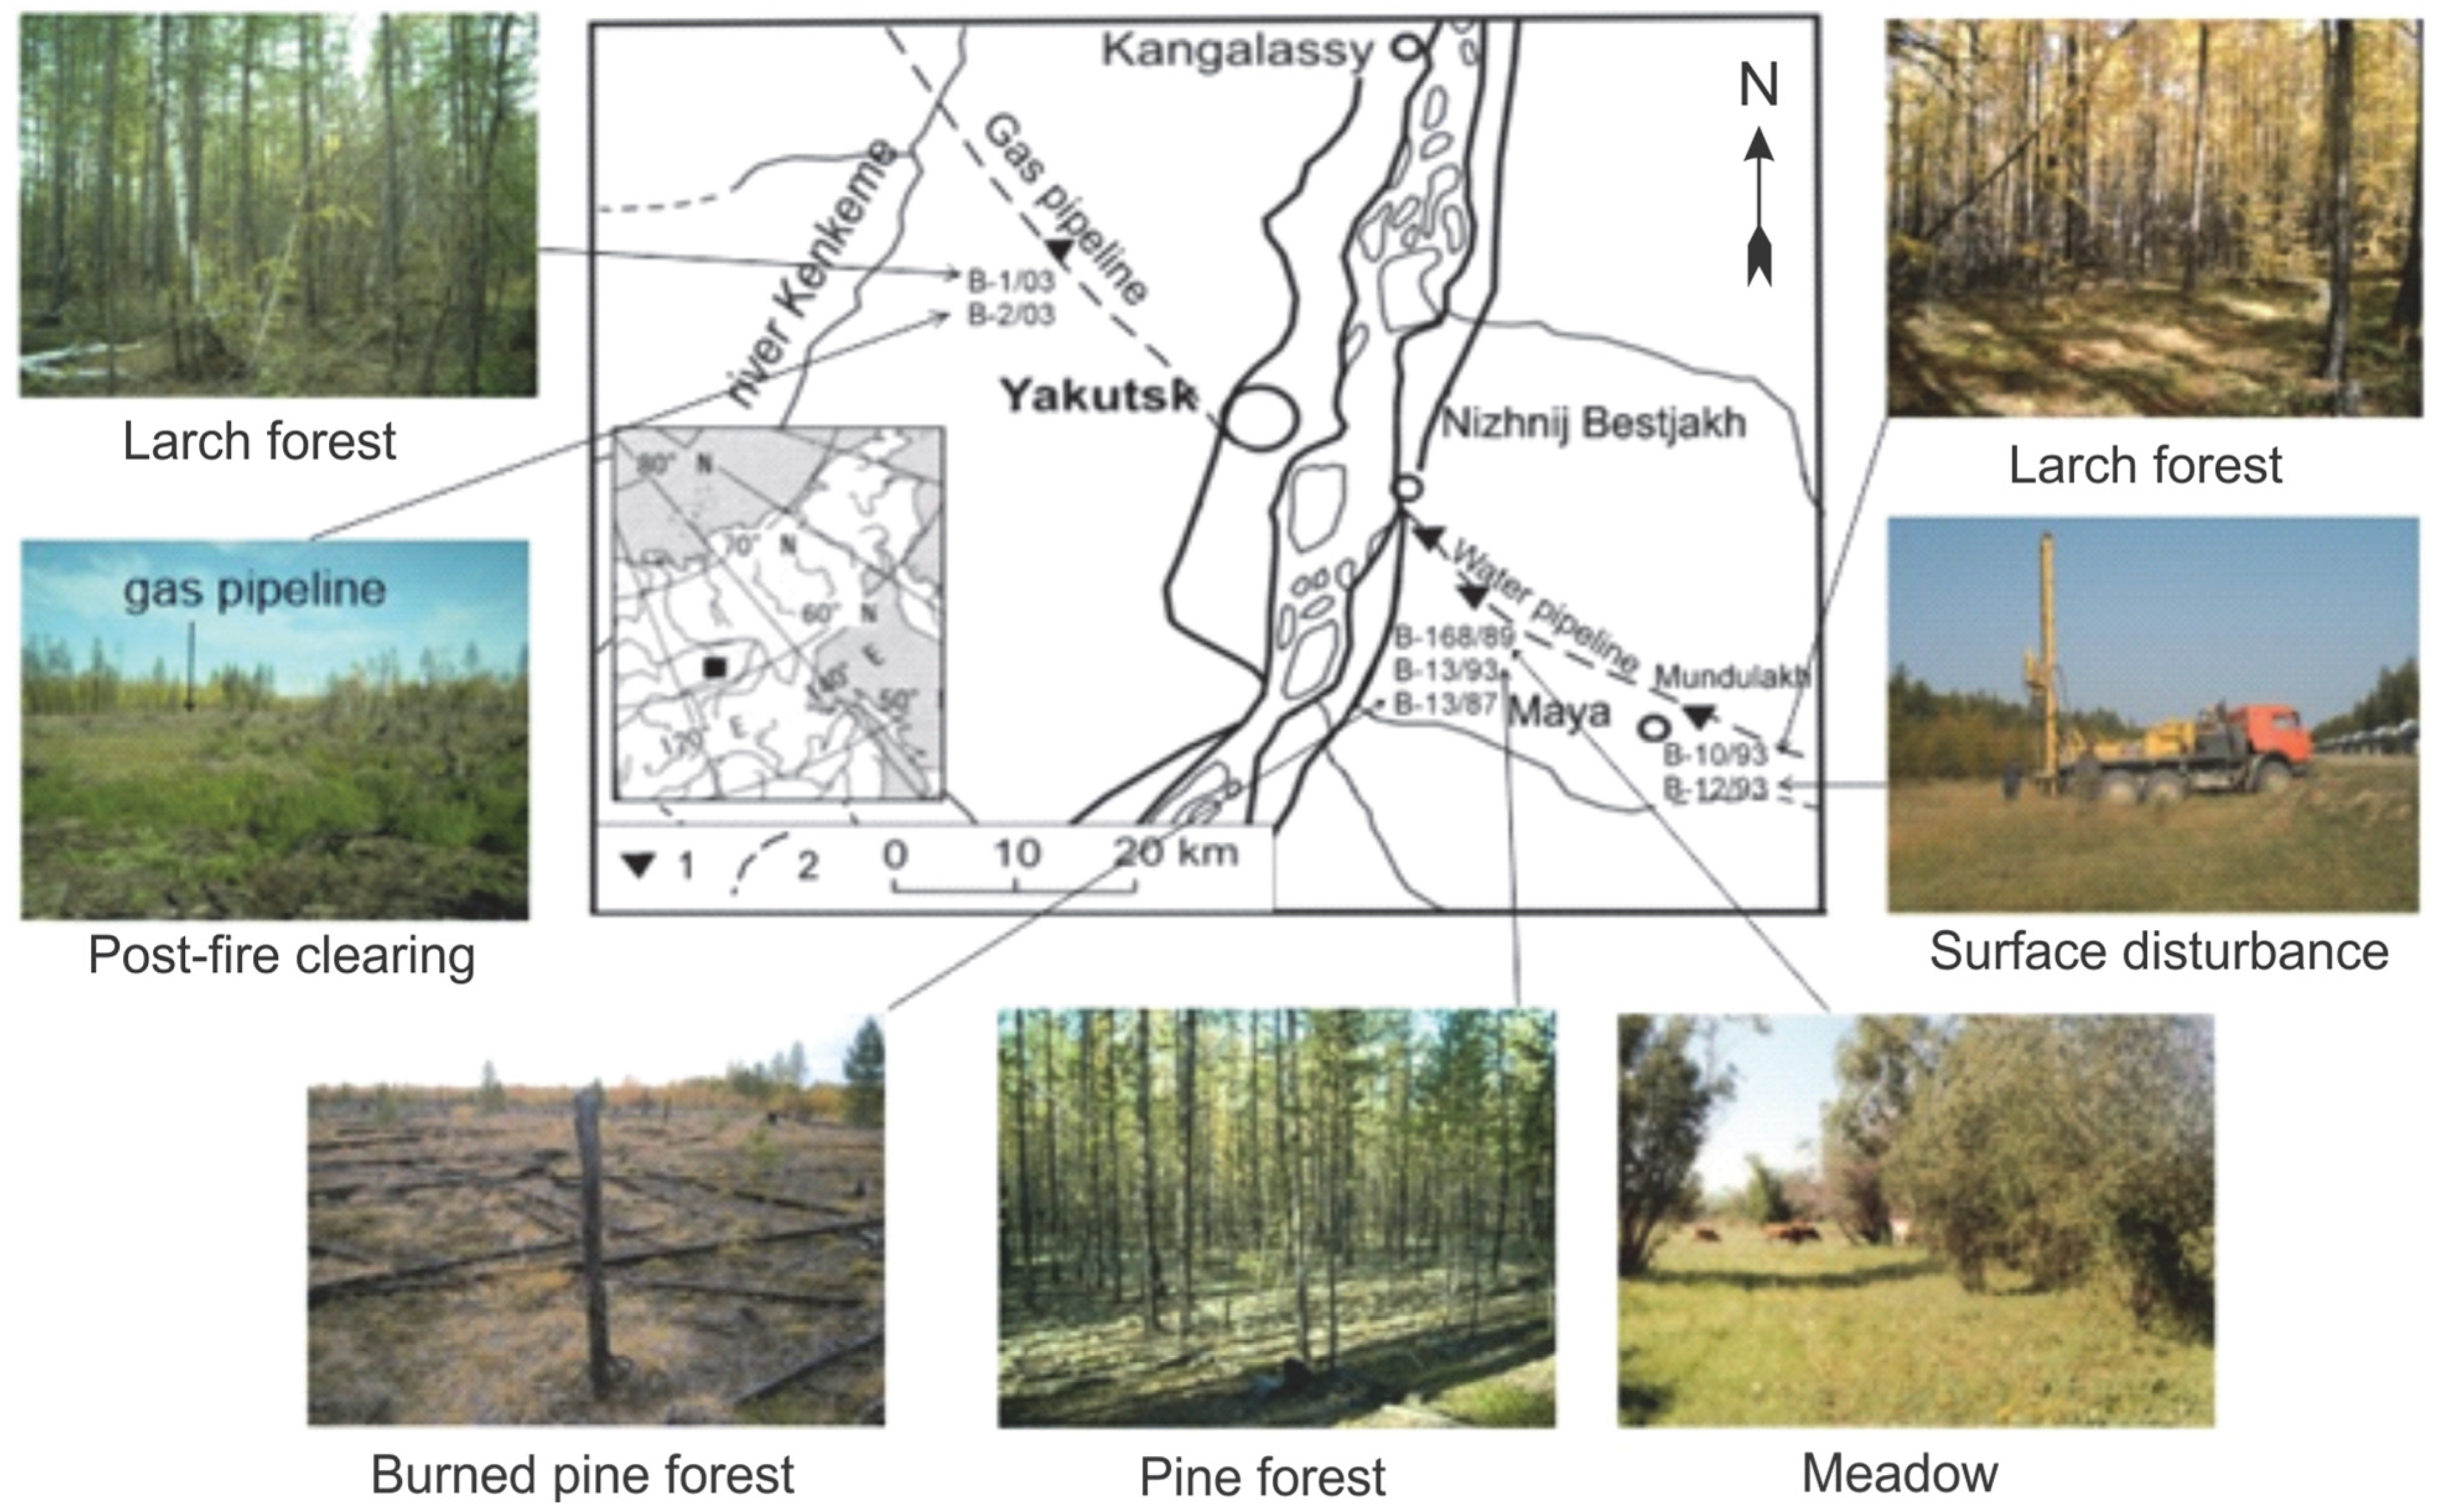
2. Study Area and Methods
3. Results and Discussion
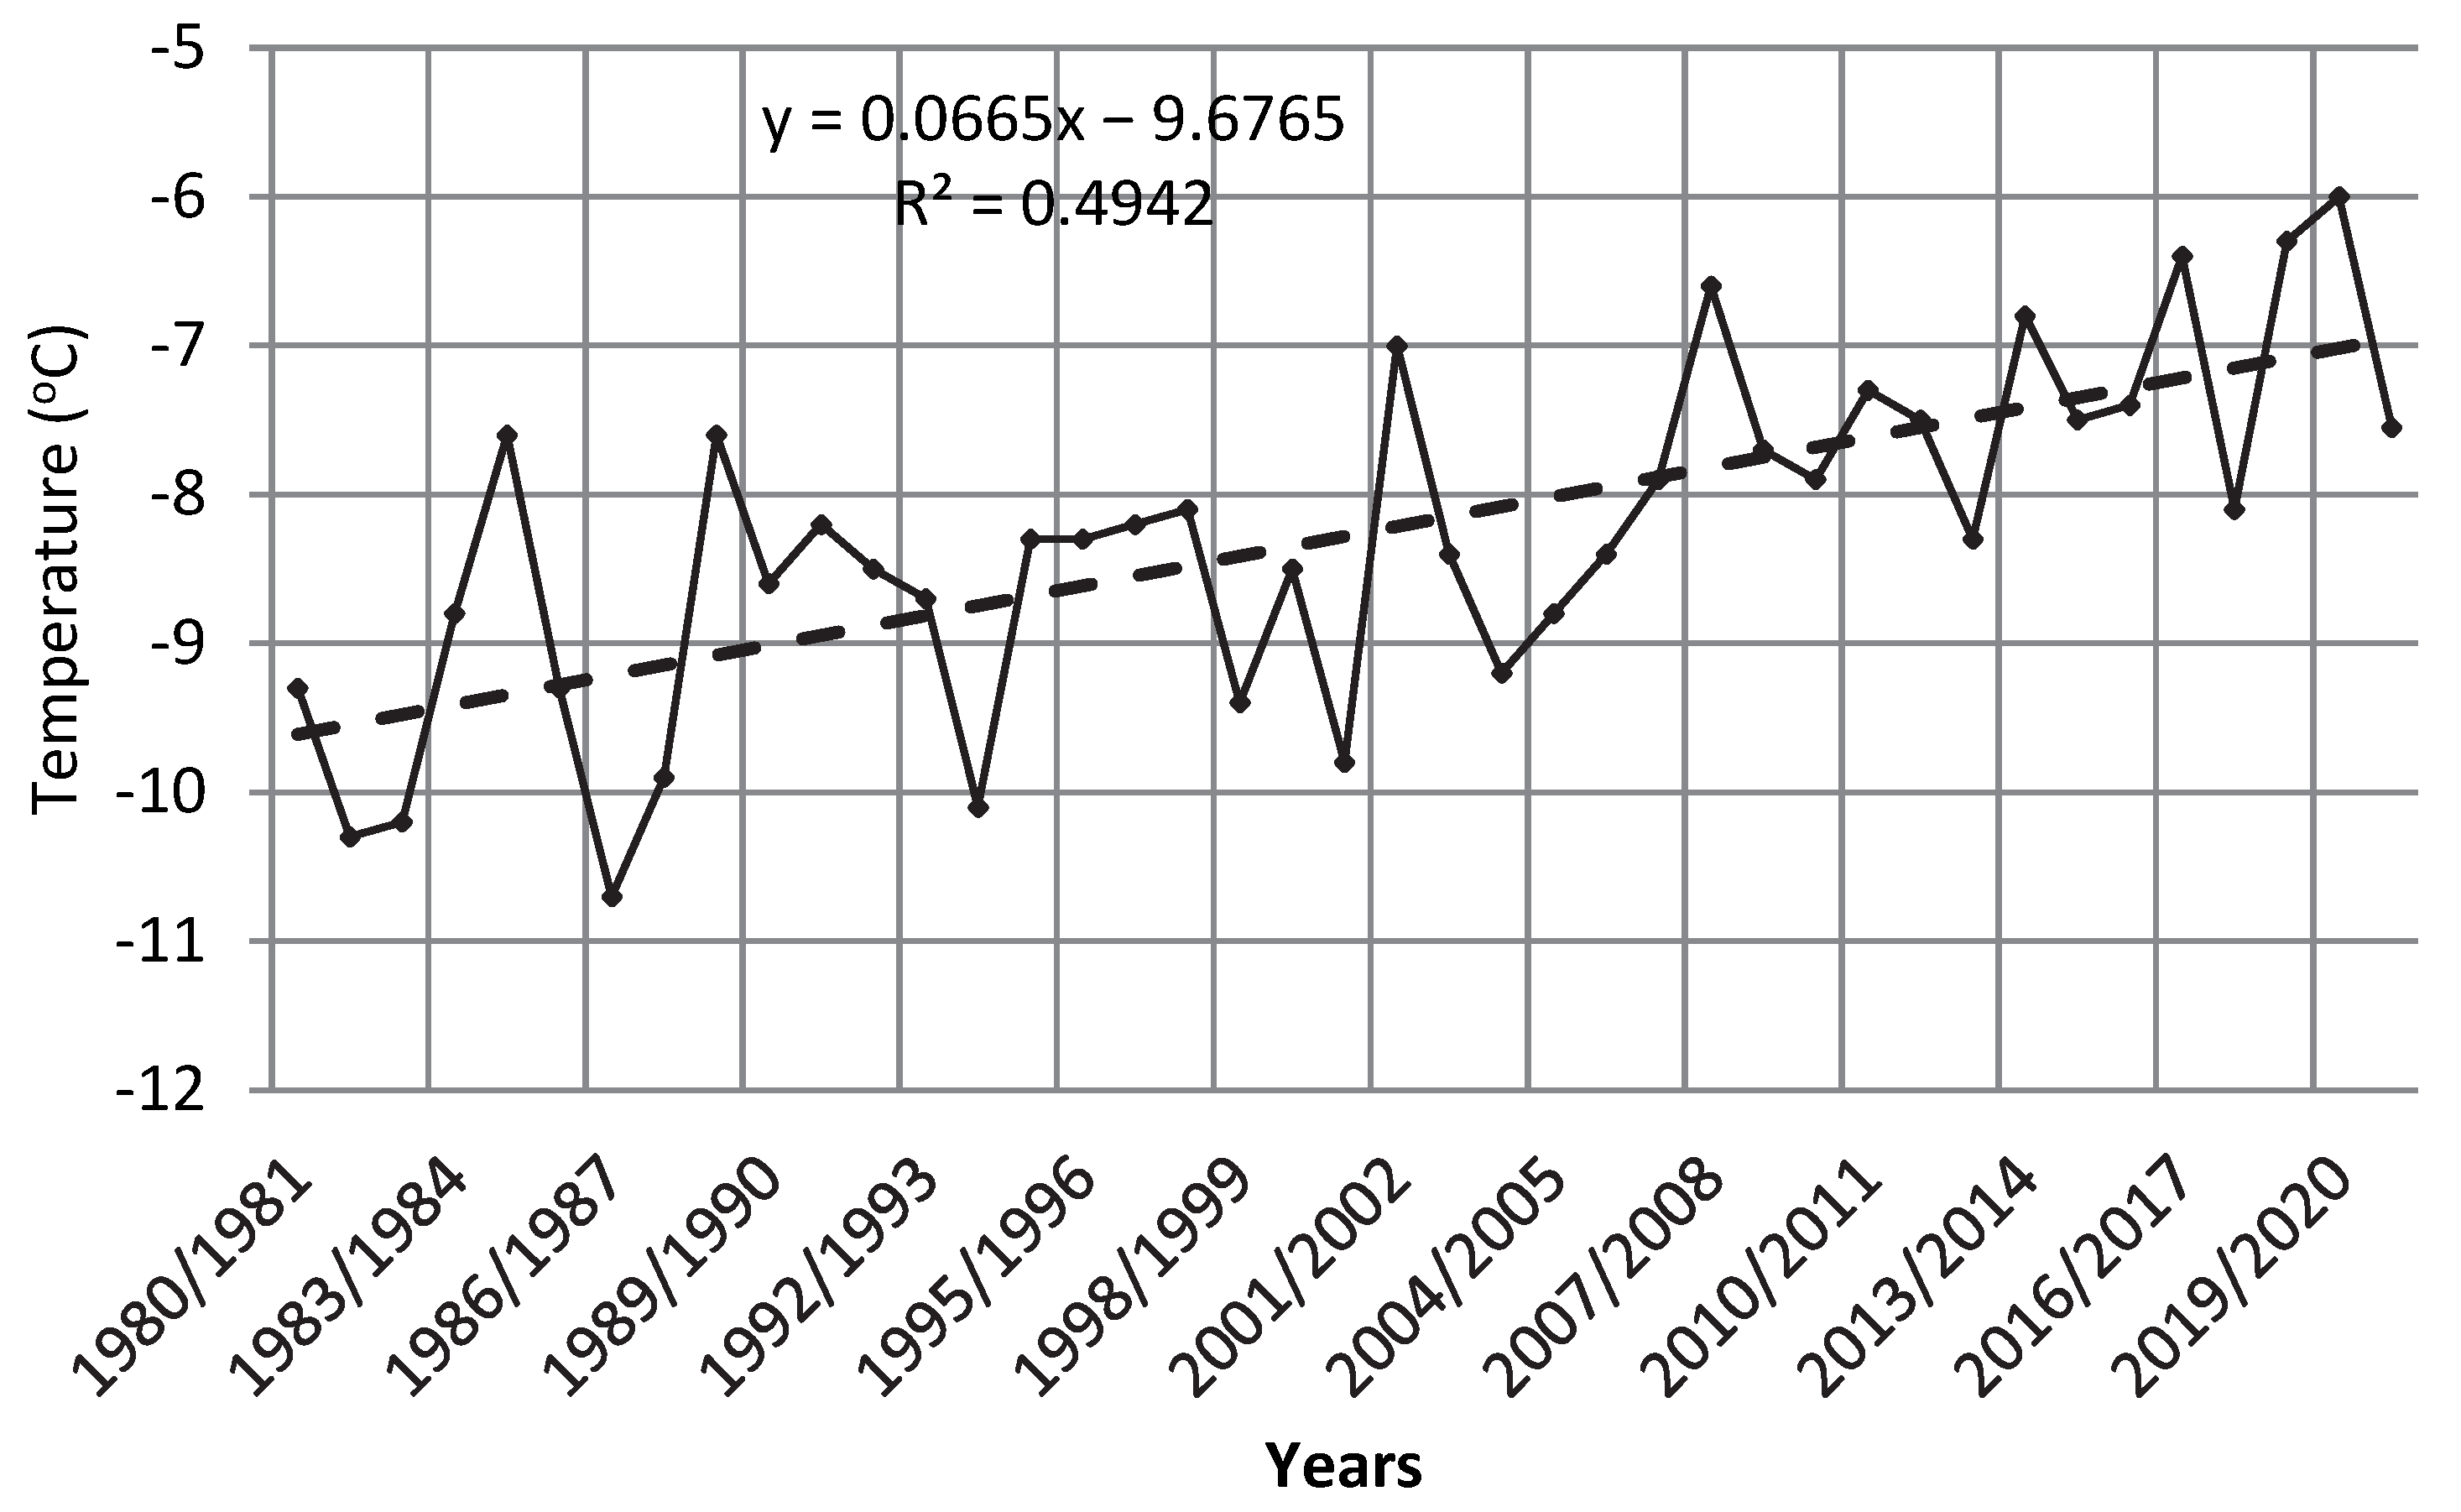
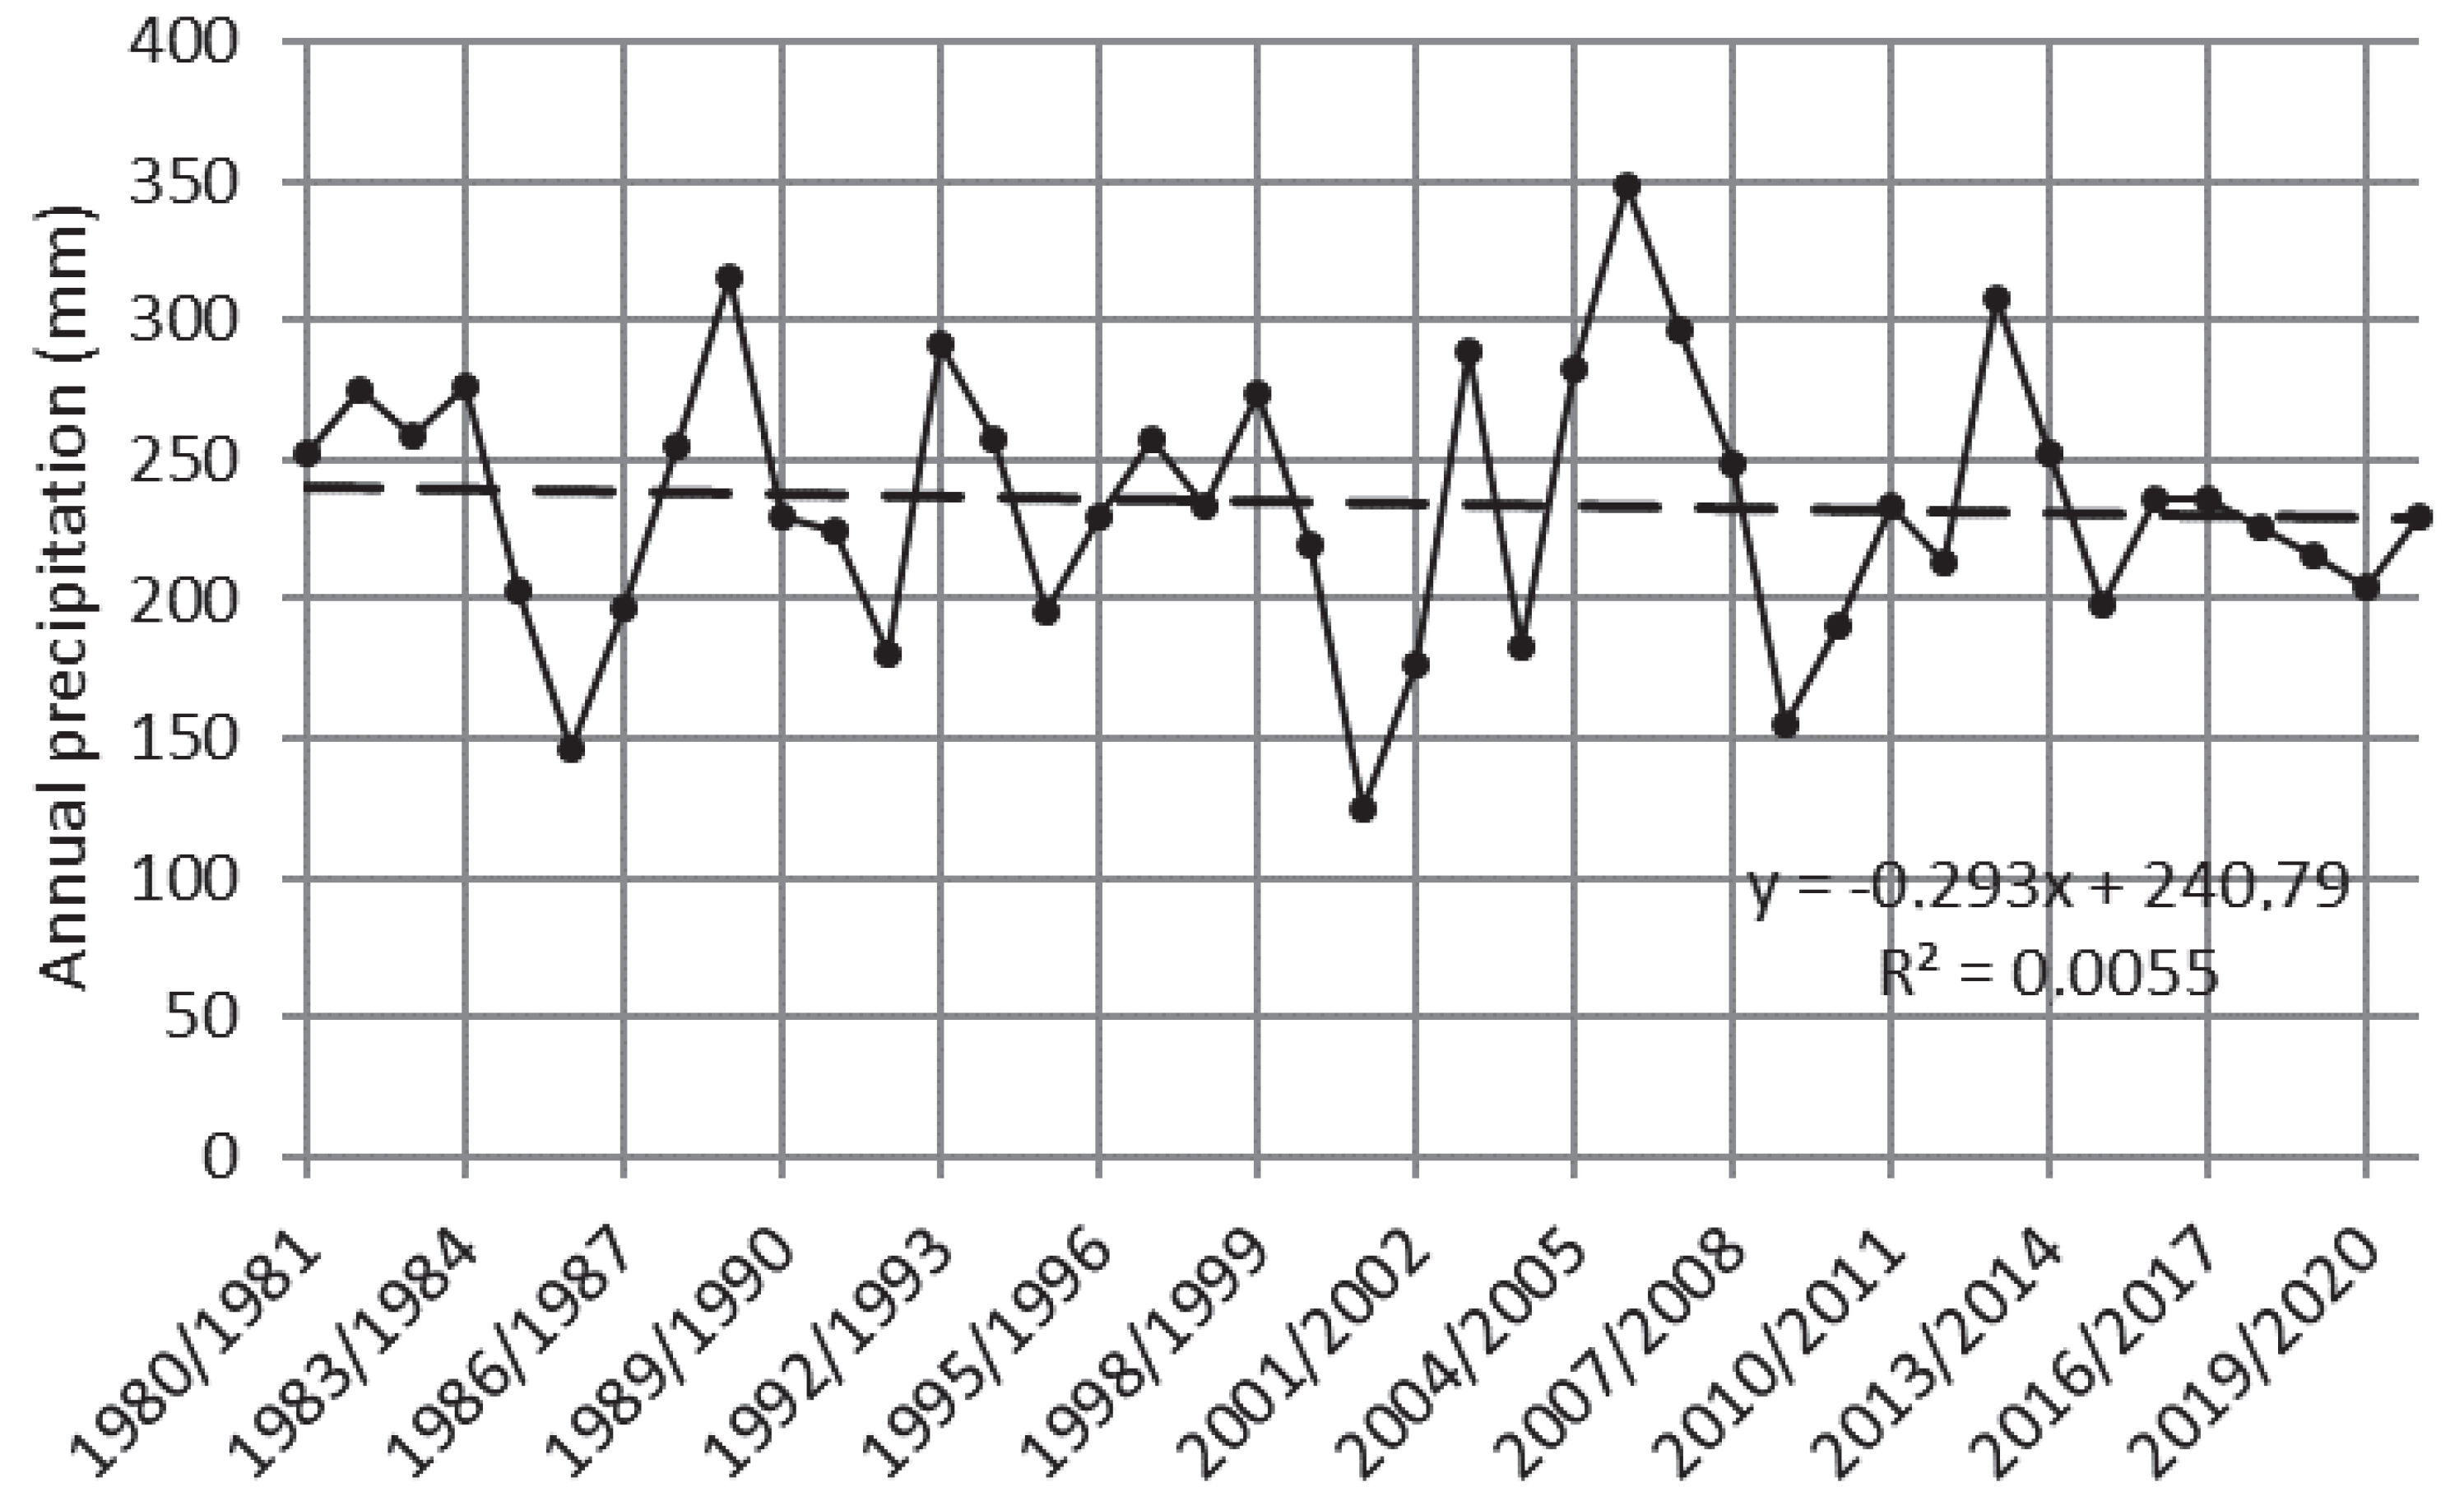
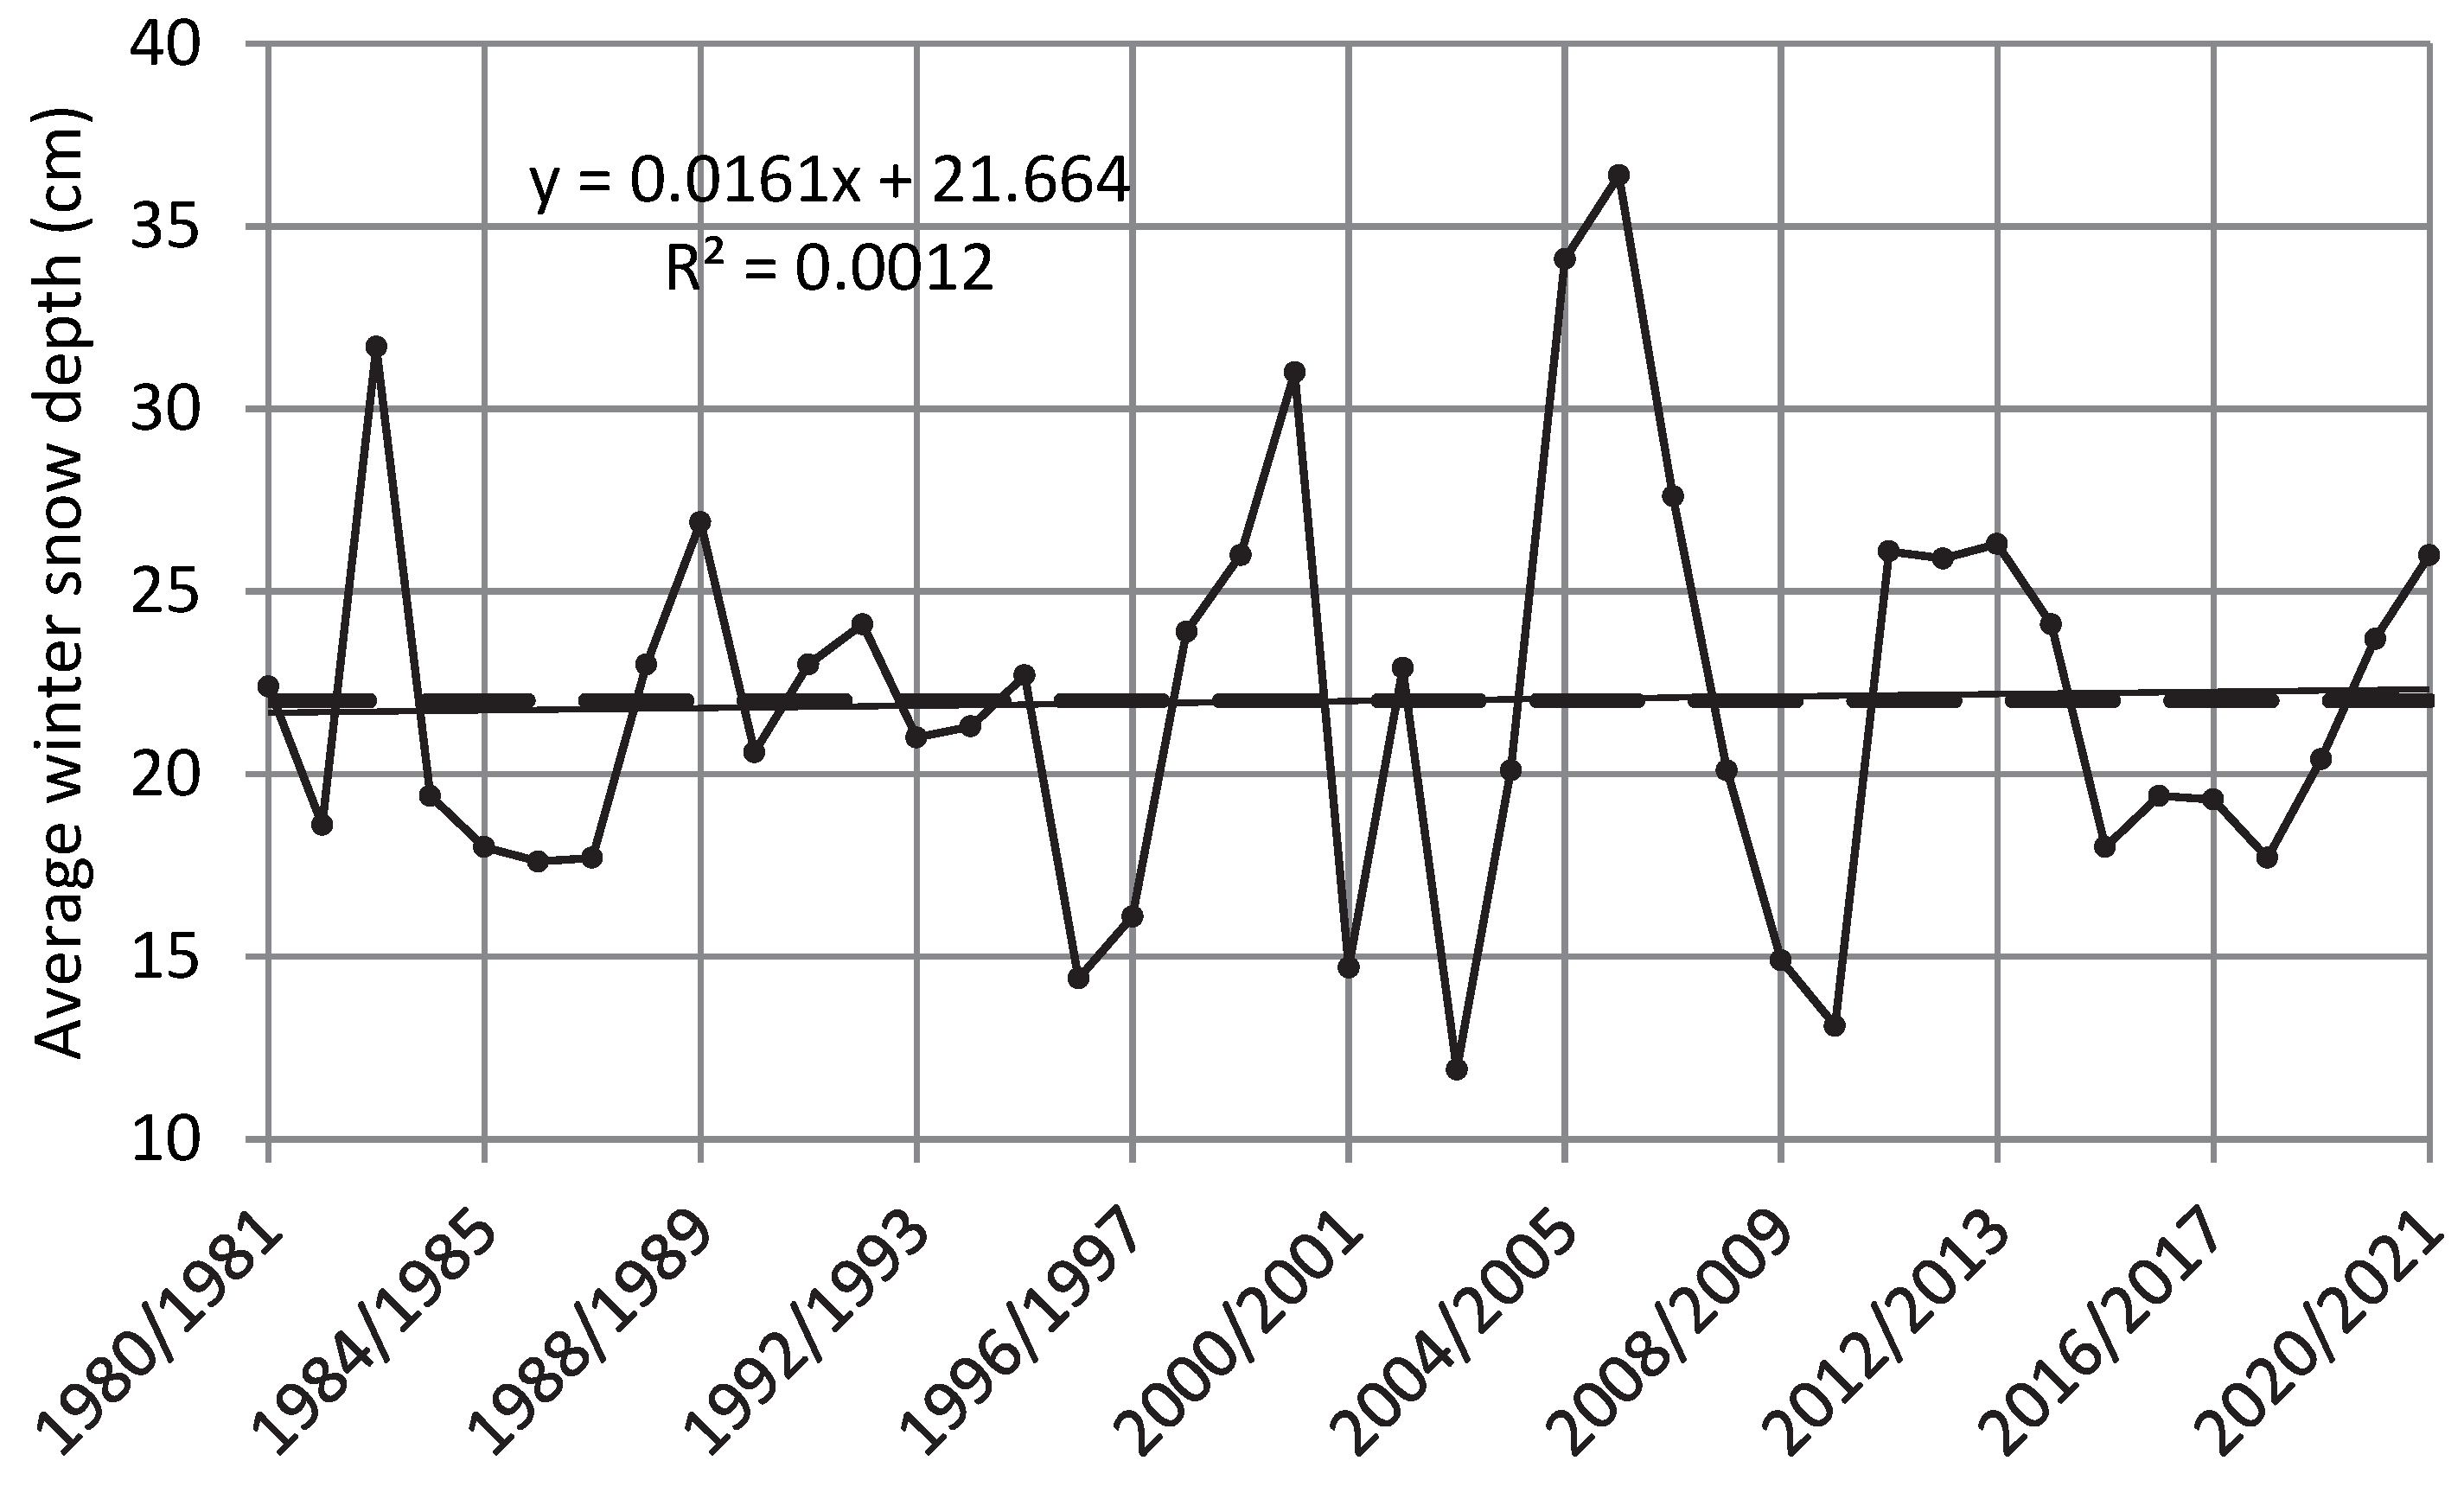
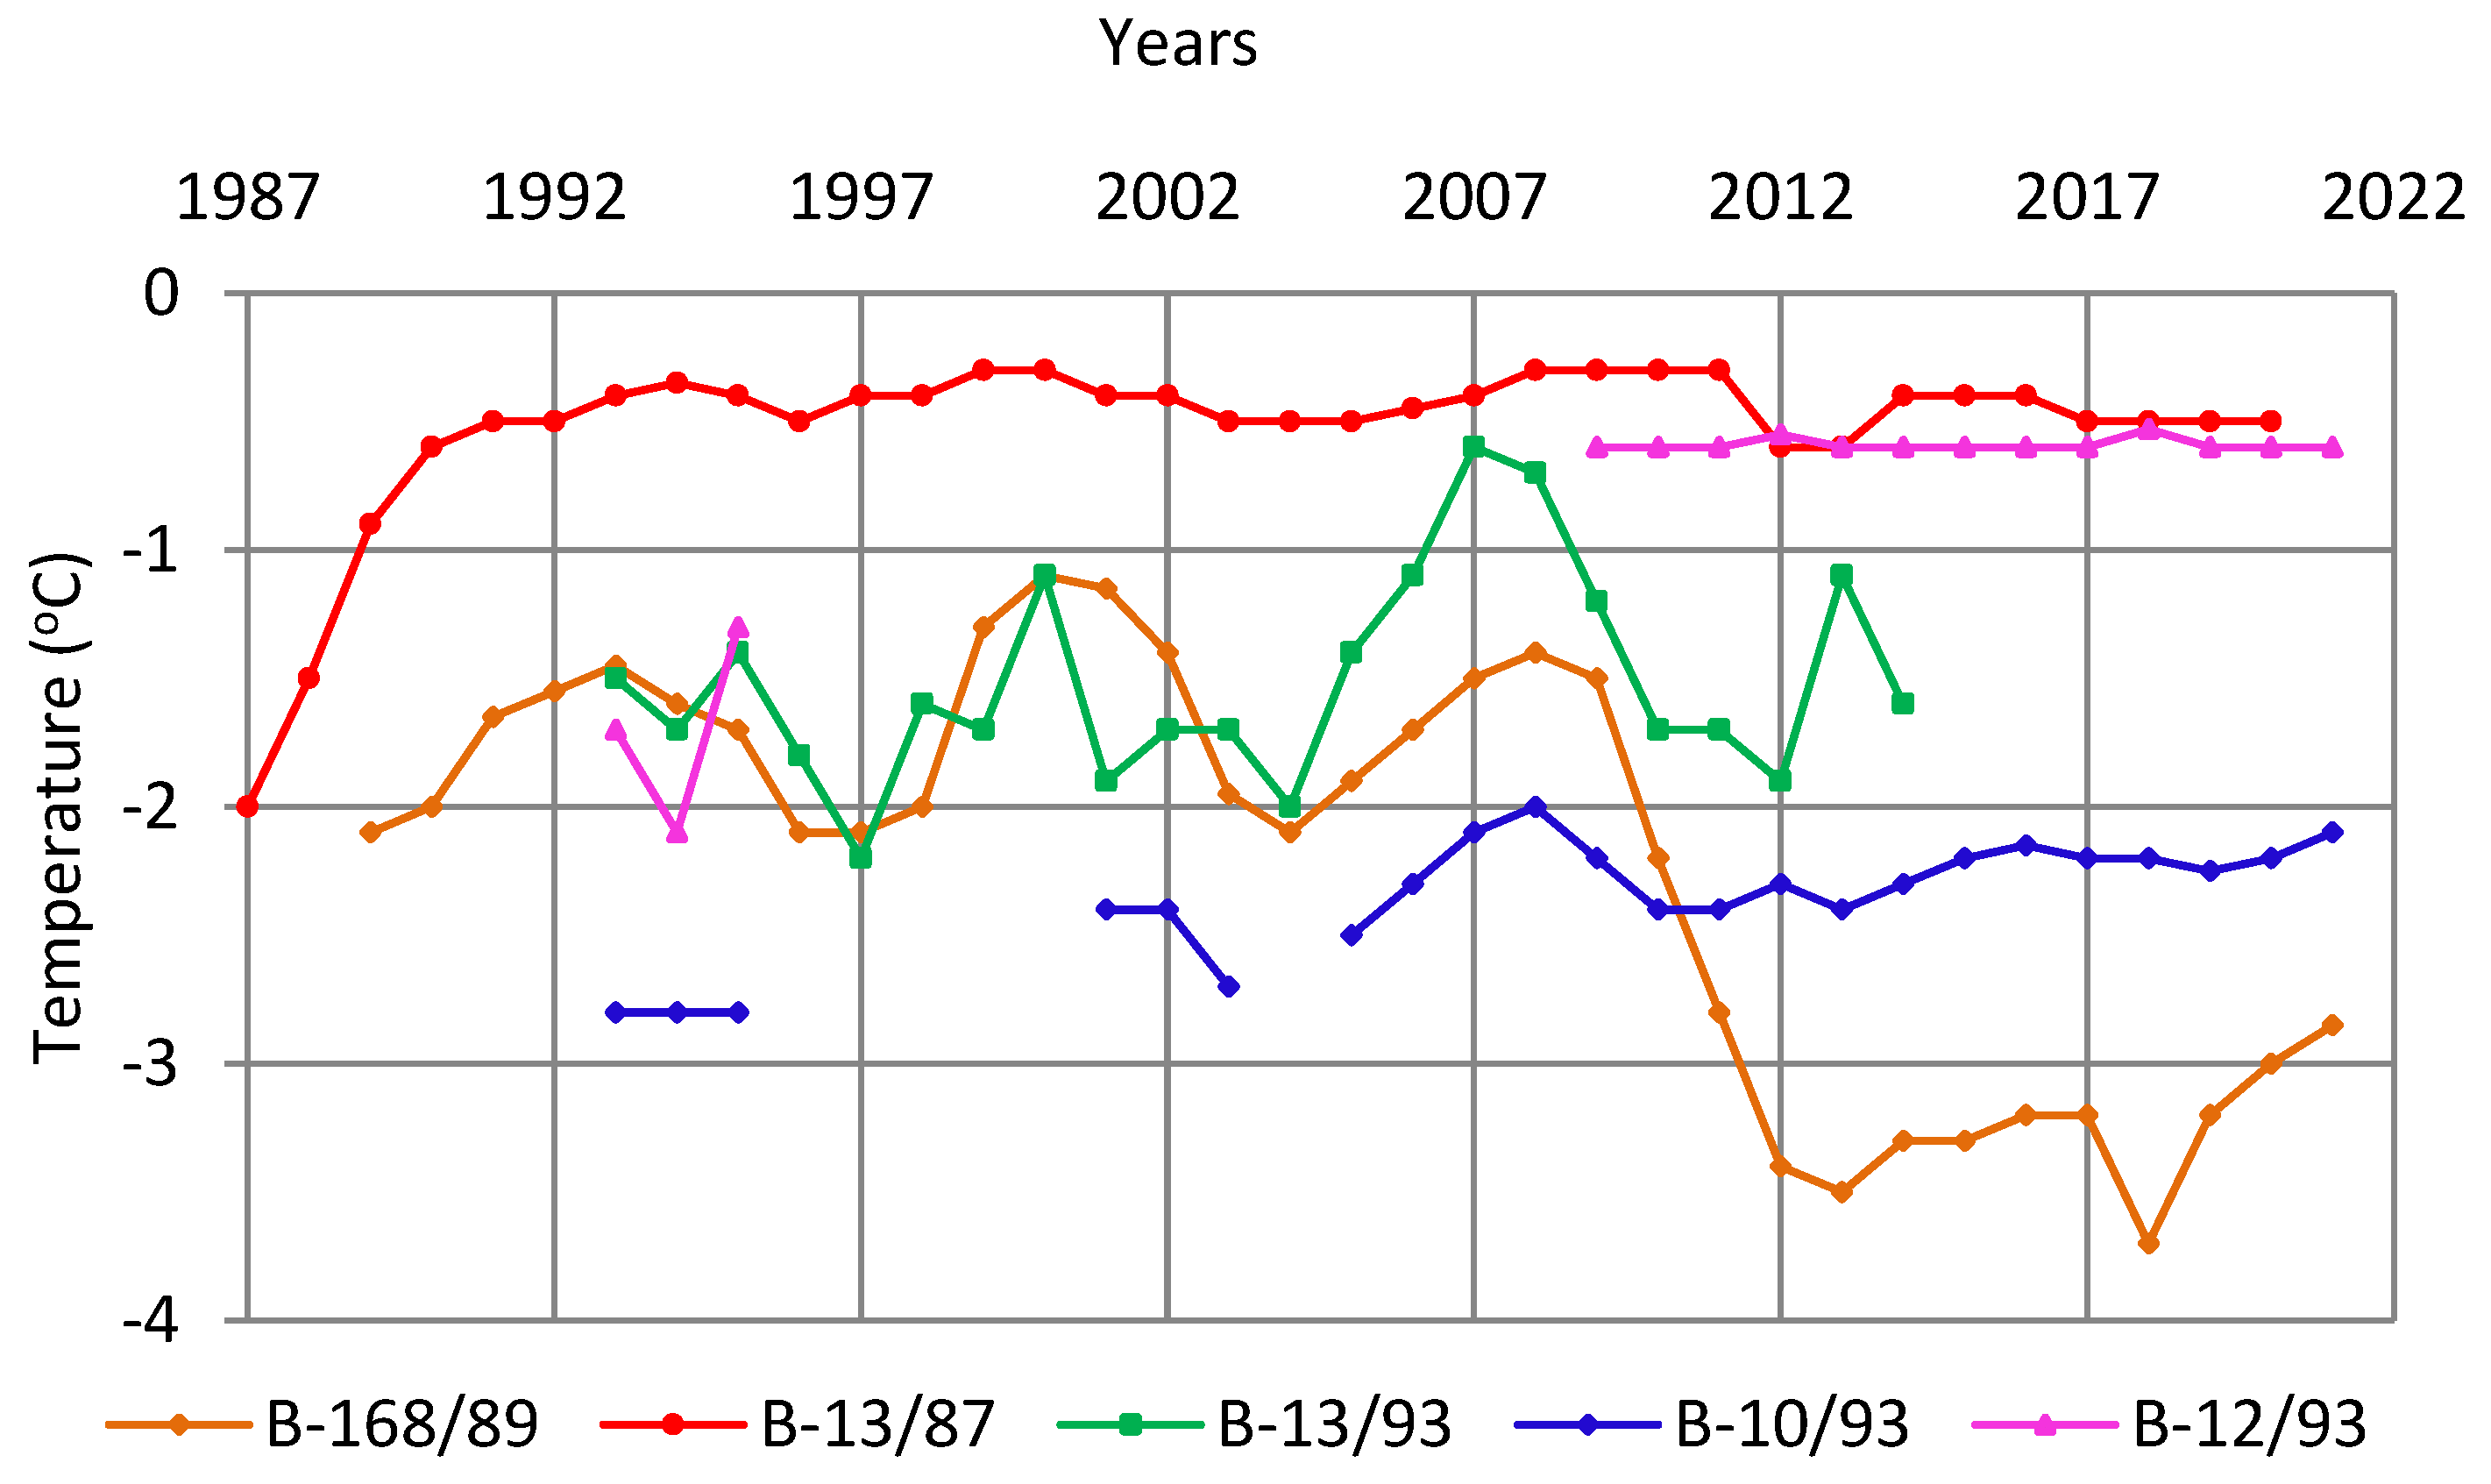
Recent Climatic Changes

| Air Temperature | Precipitation | Snow Cover | ||||||||
|---|---|---|---|---|---|---|---|---|---|---|
| Type | Annual | Winter | Summer | Type | Annual | Summer | Type | Snow Cover Onset | Type | Snow Depth |
| Anomalously cold | 0/0 | 1/0 | 1/0 | Anomalously dry | 0/1 | 0/0 | Anomalously late | 0/0 | Anomalously low | 0/0 |
| Cold | 6/1 | 5/1 | 5/1 | Dry | 2/3 | 3/4 | Late | 5/2 | Low | 2/4 |
| Normal | 14/13 | 13/12 | 12/13 | Normal | 16/11 | 14/14 | Normal | 11/16 | Normal | 16/13 |
| Warm | 0/6 | 1/7 | 2/6 | Wet | 2/4 | 3/2 | Early | 4/1 | Deep | 2/1 |
| Anomalously warm | 0/0 | 0/0 | 0/0 | Anomalously wet | 0/1 | 0/0 | Anomalously early | 0/1 | Anomalously deep | 0/ 2 |
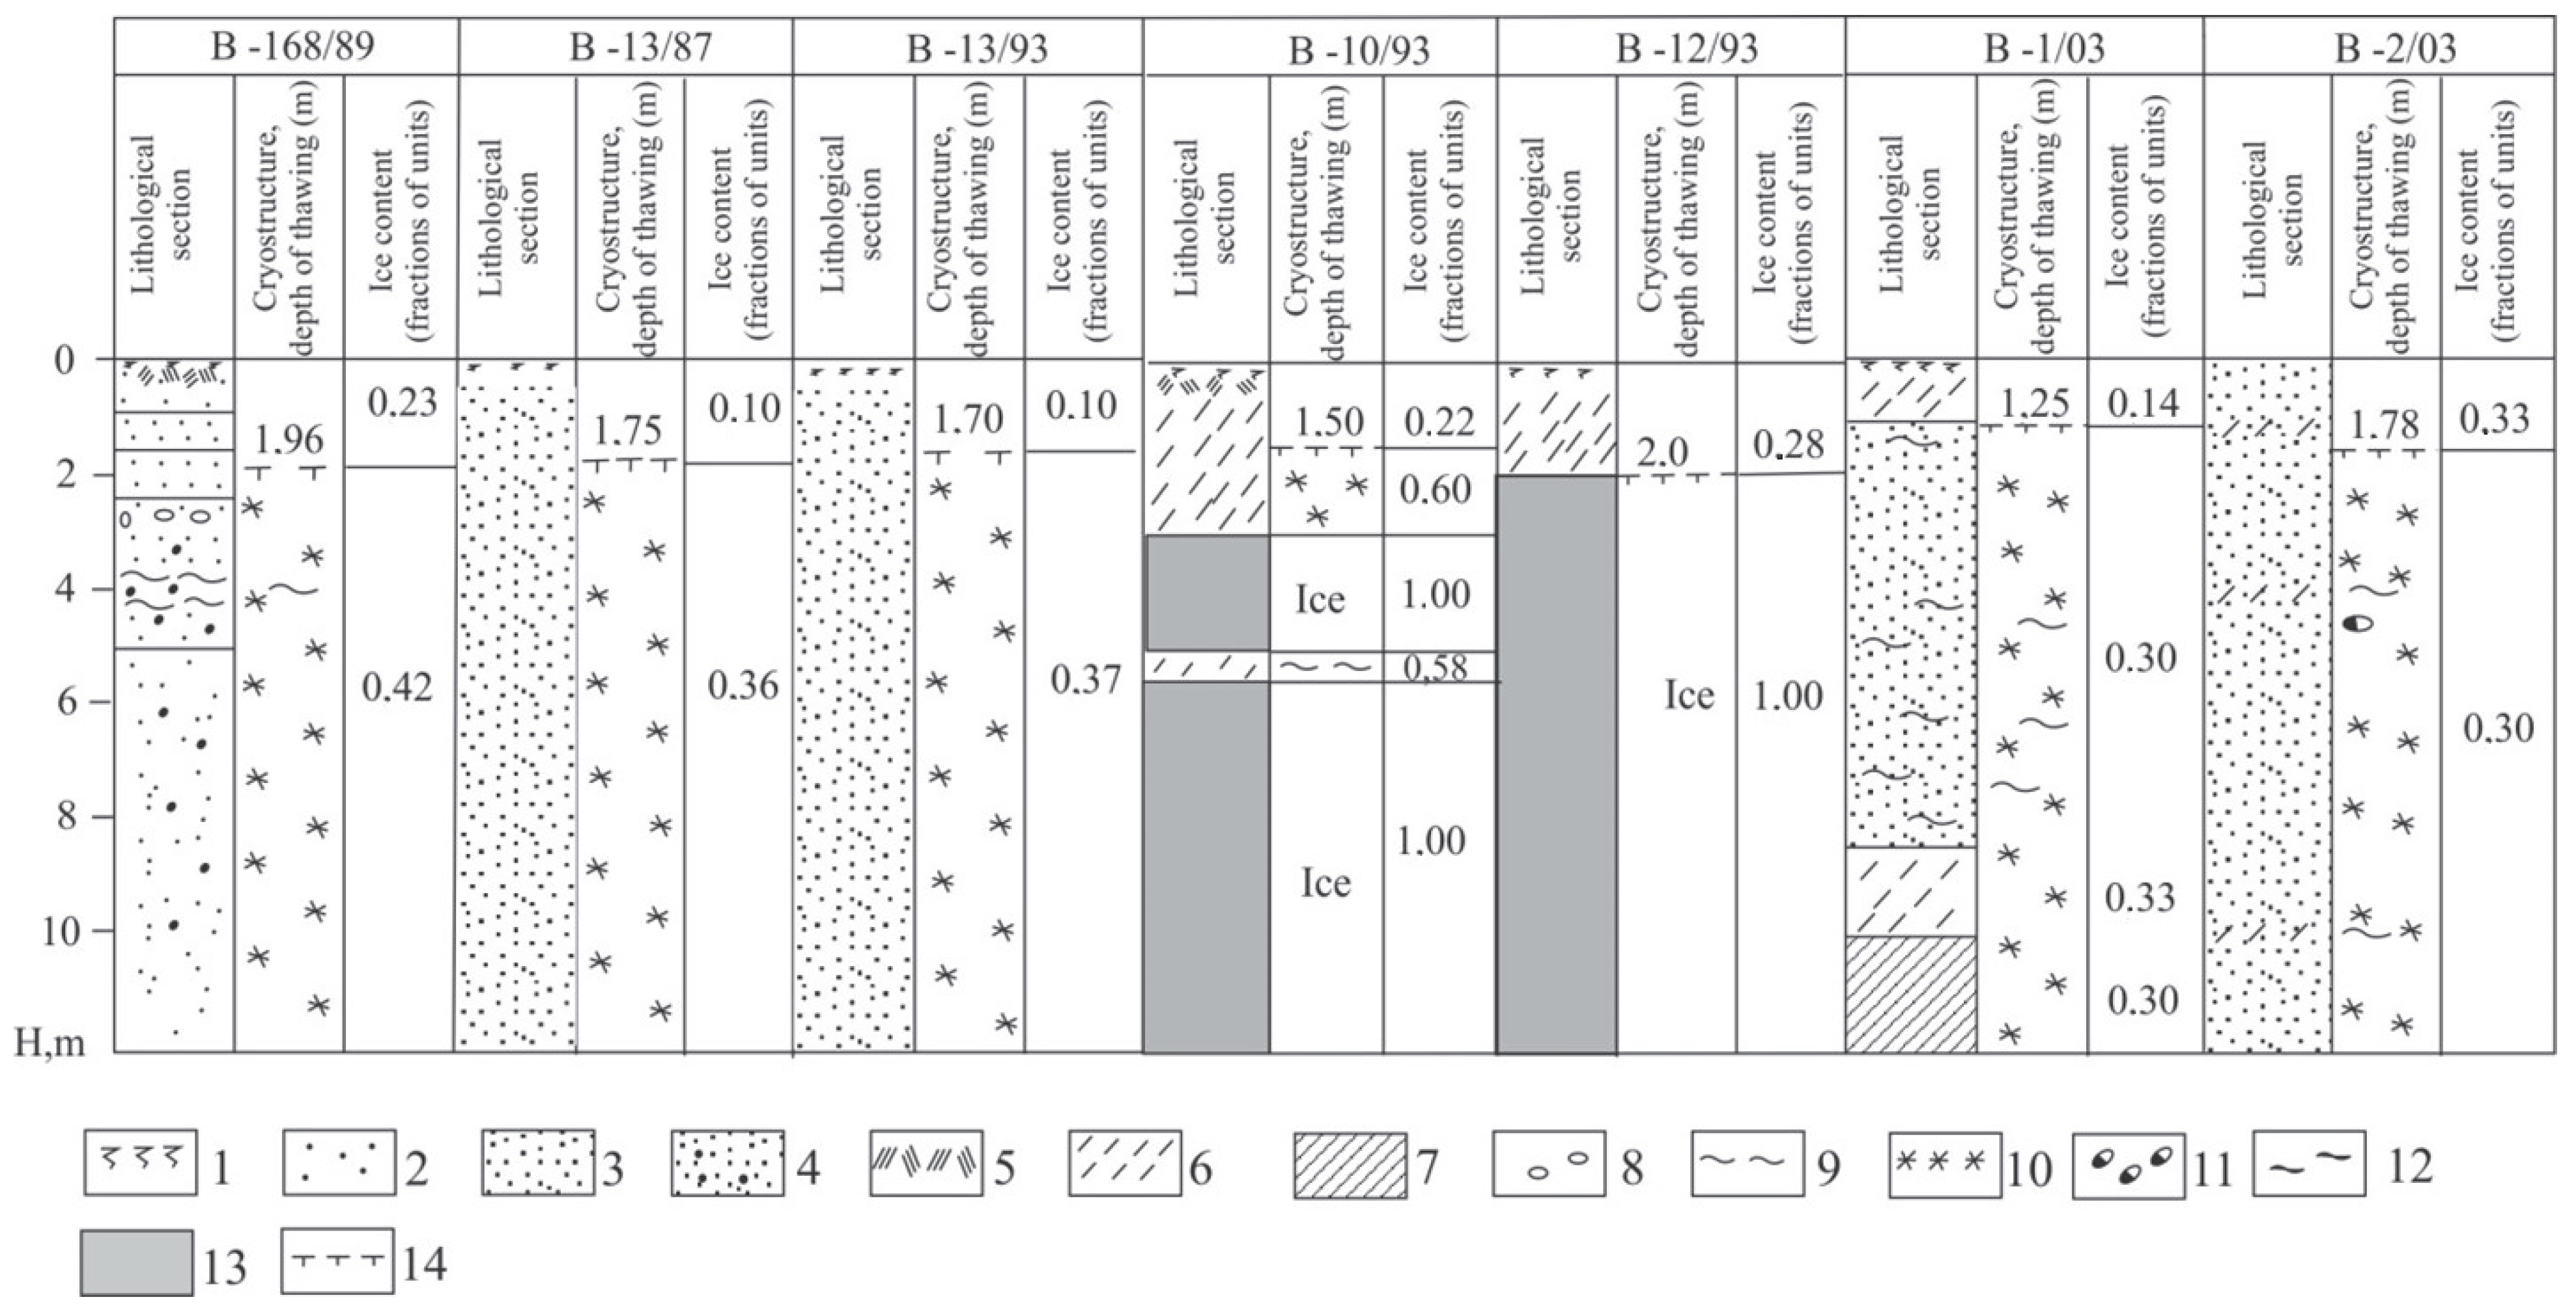
4. Ground Thermal Conditions along Pipeline Routes
4.1. Water Pipeline
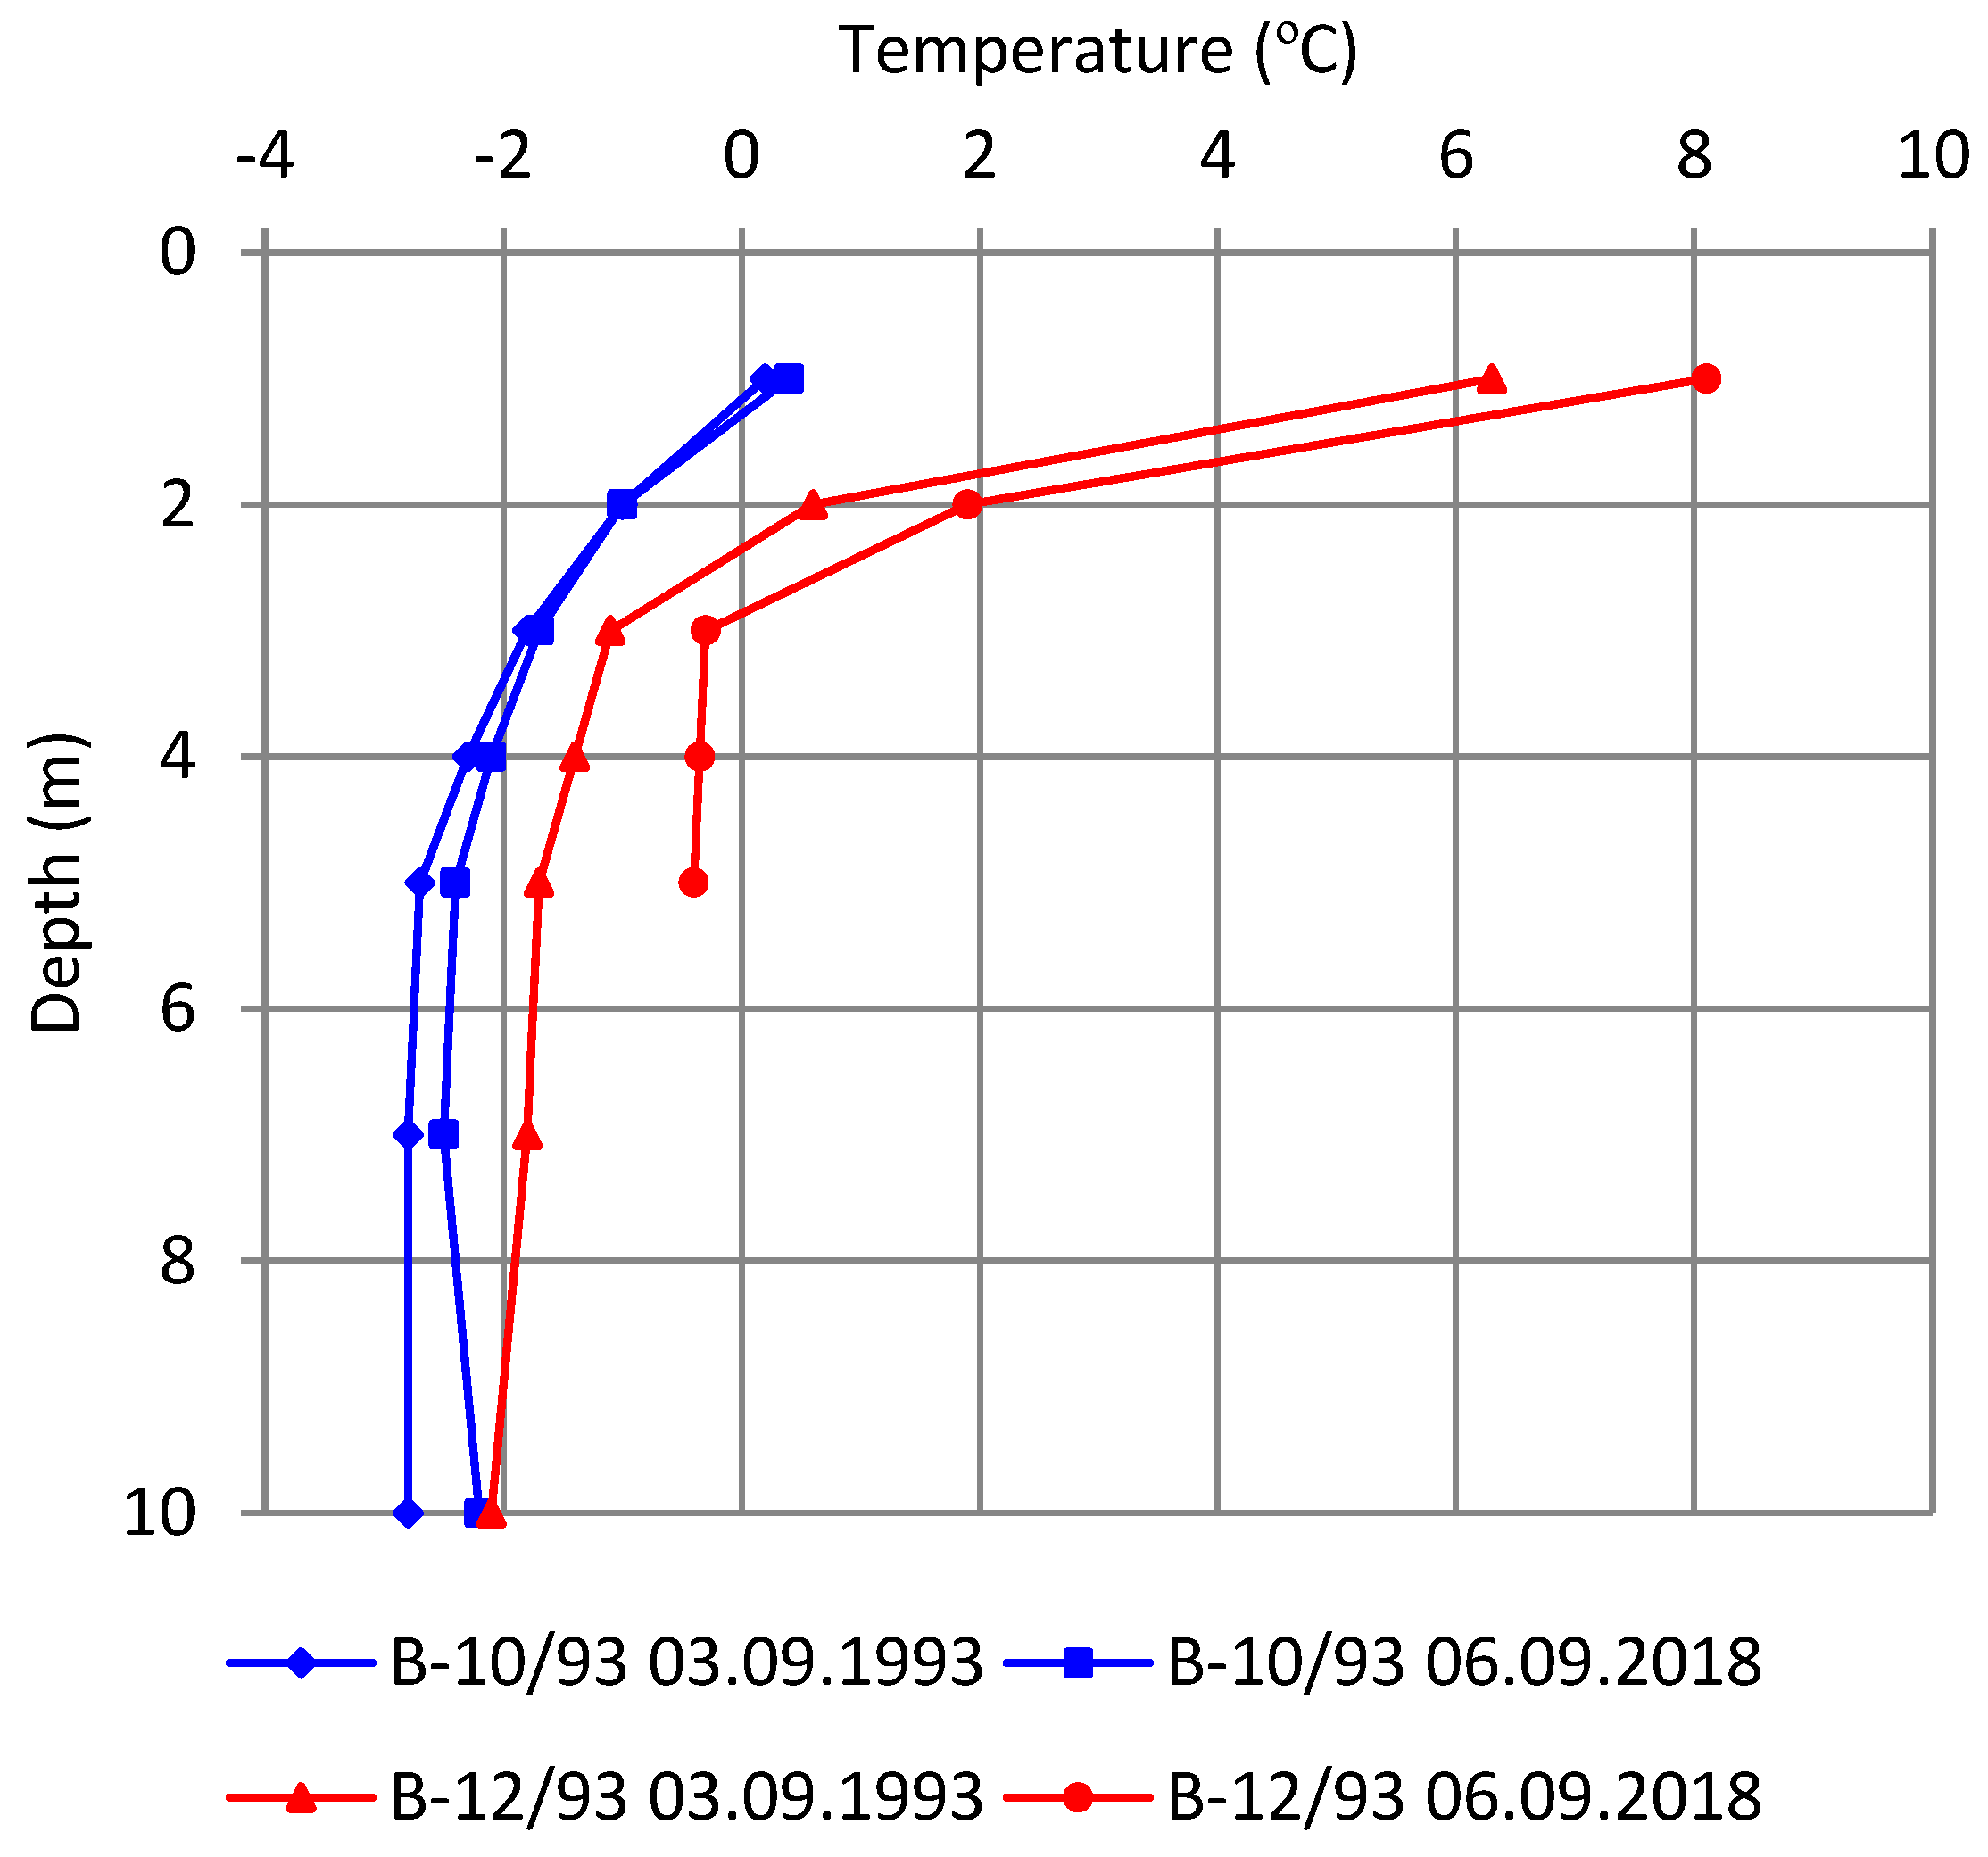
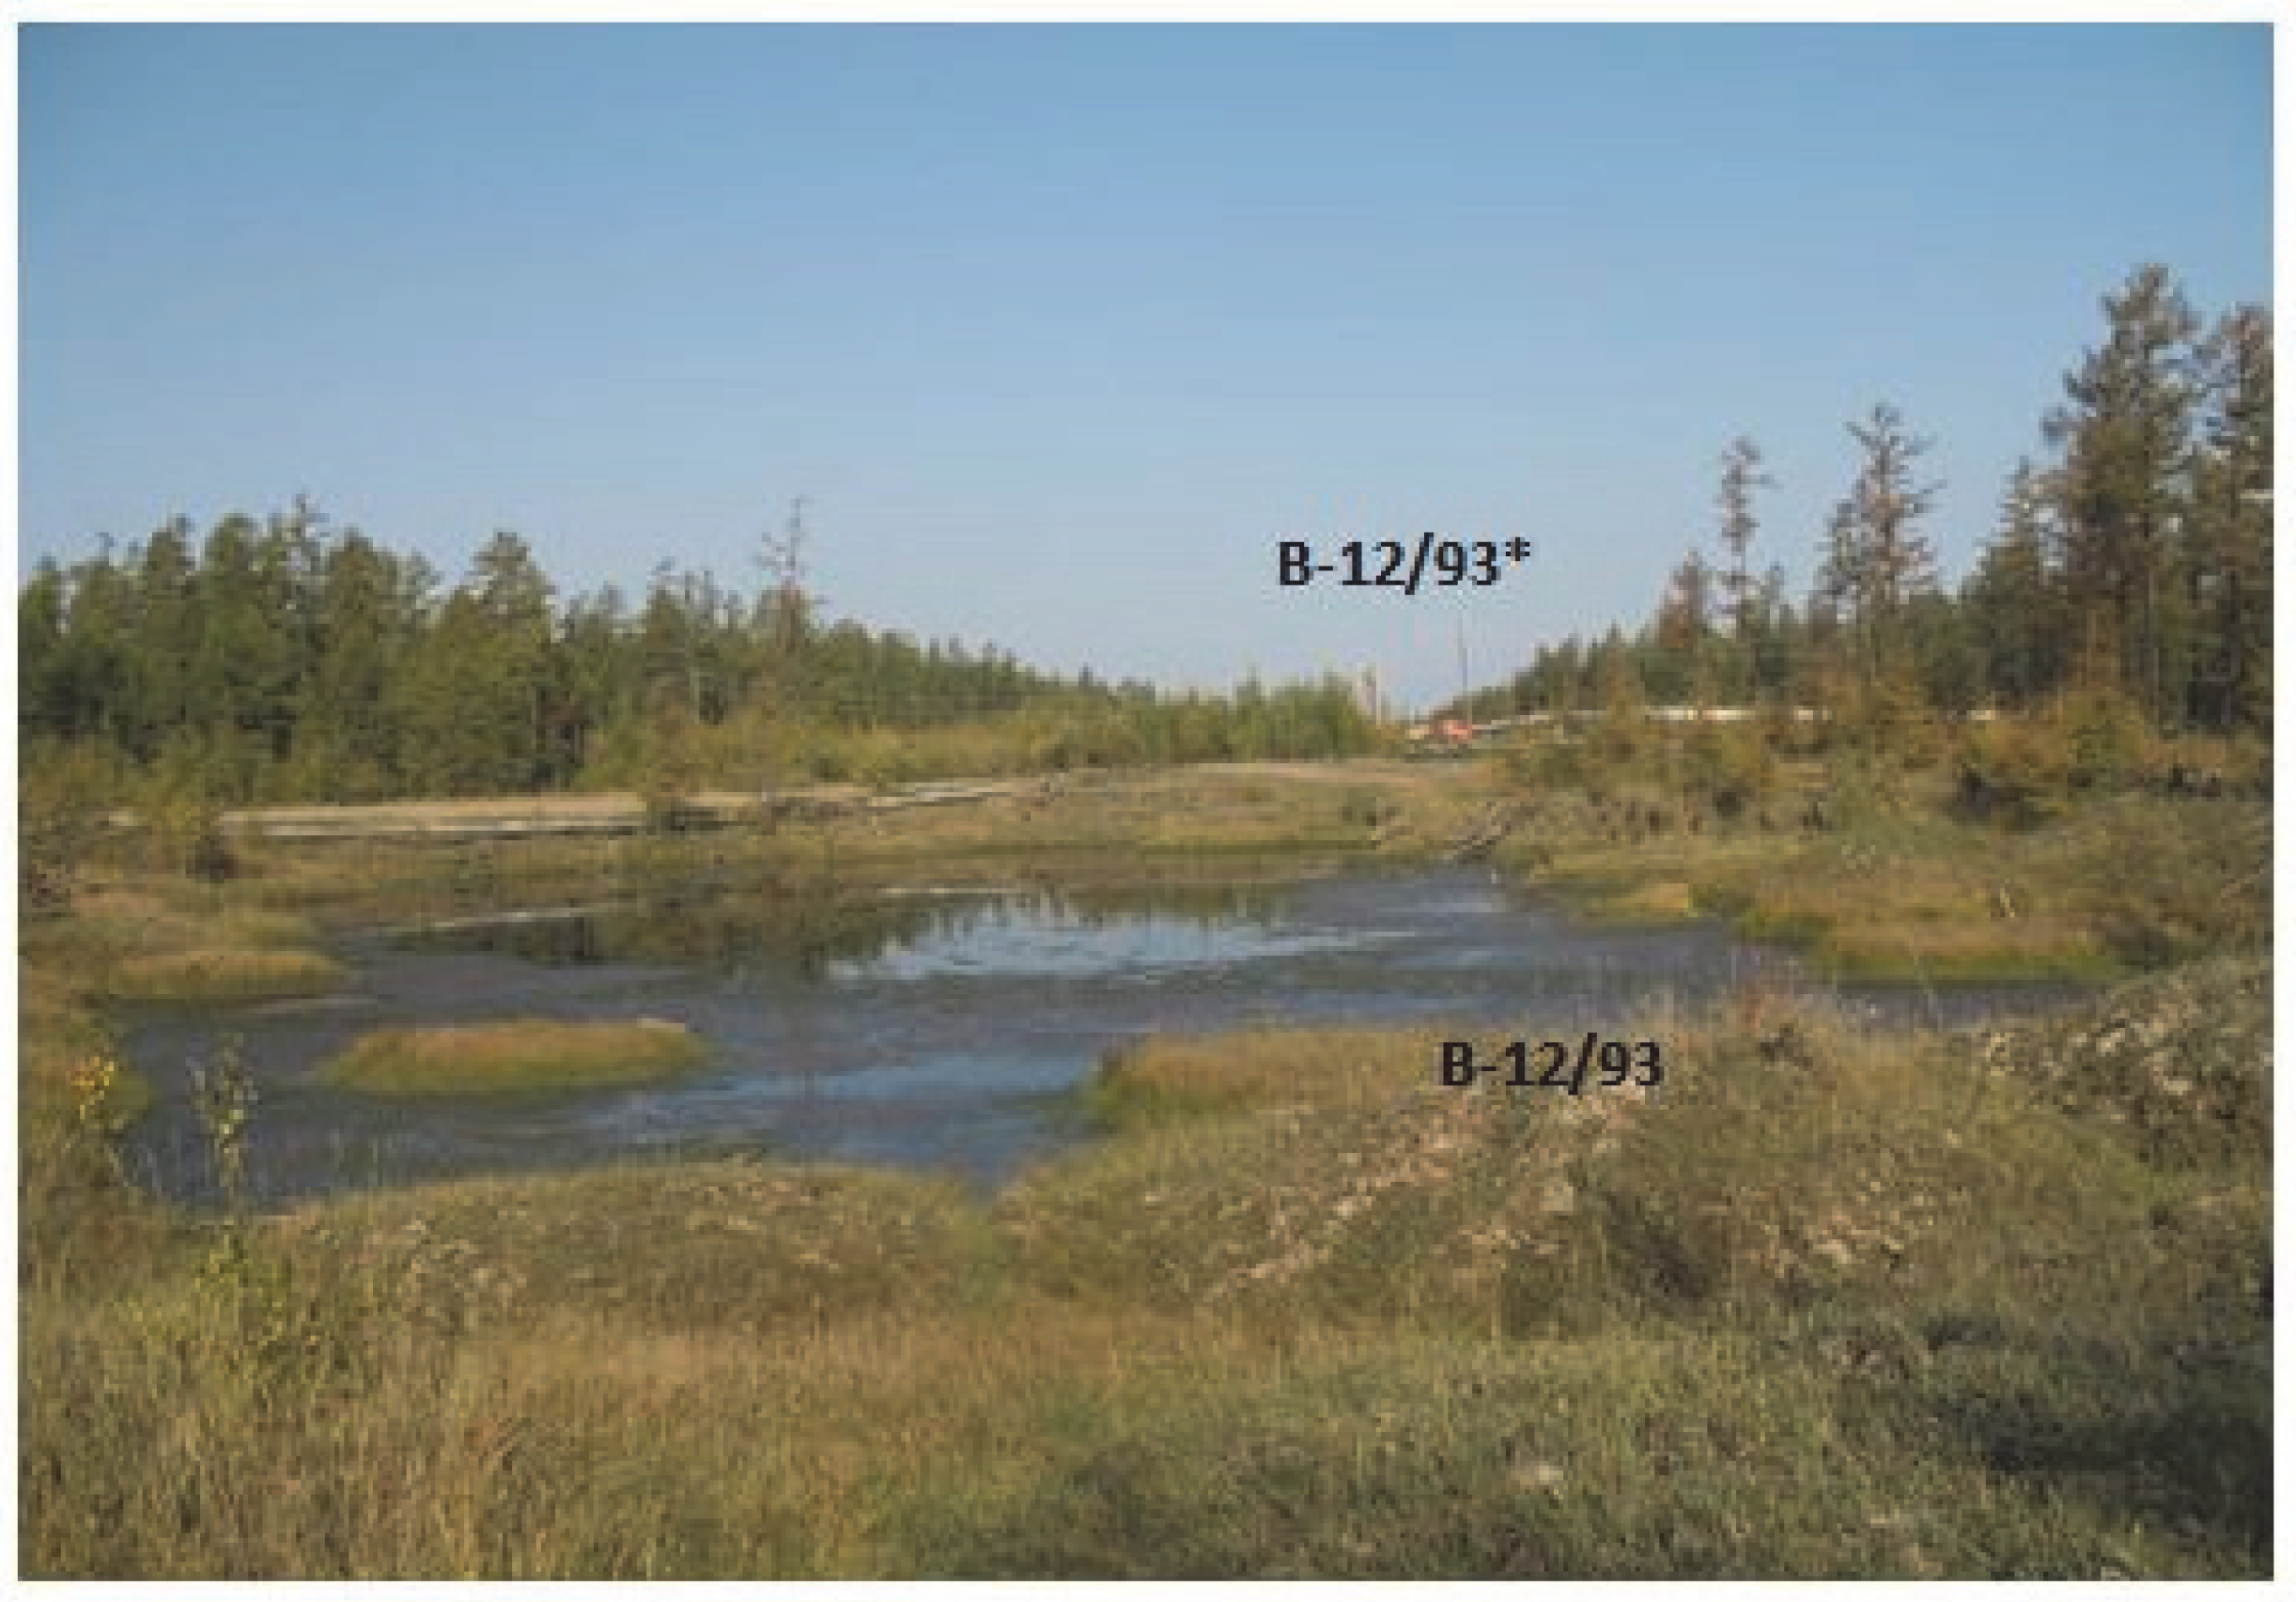
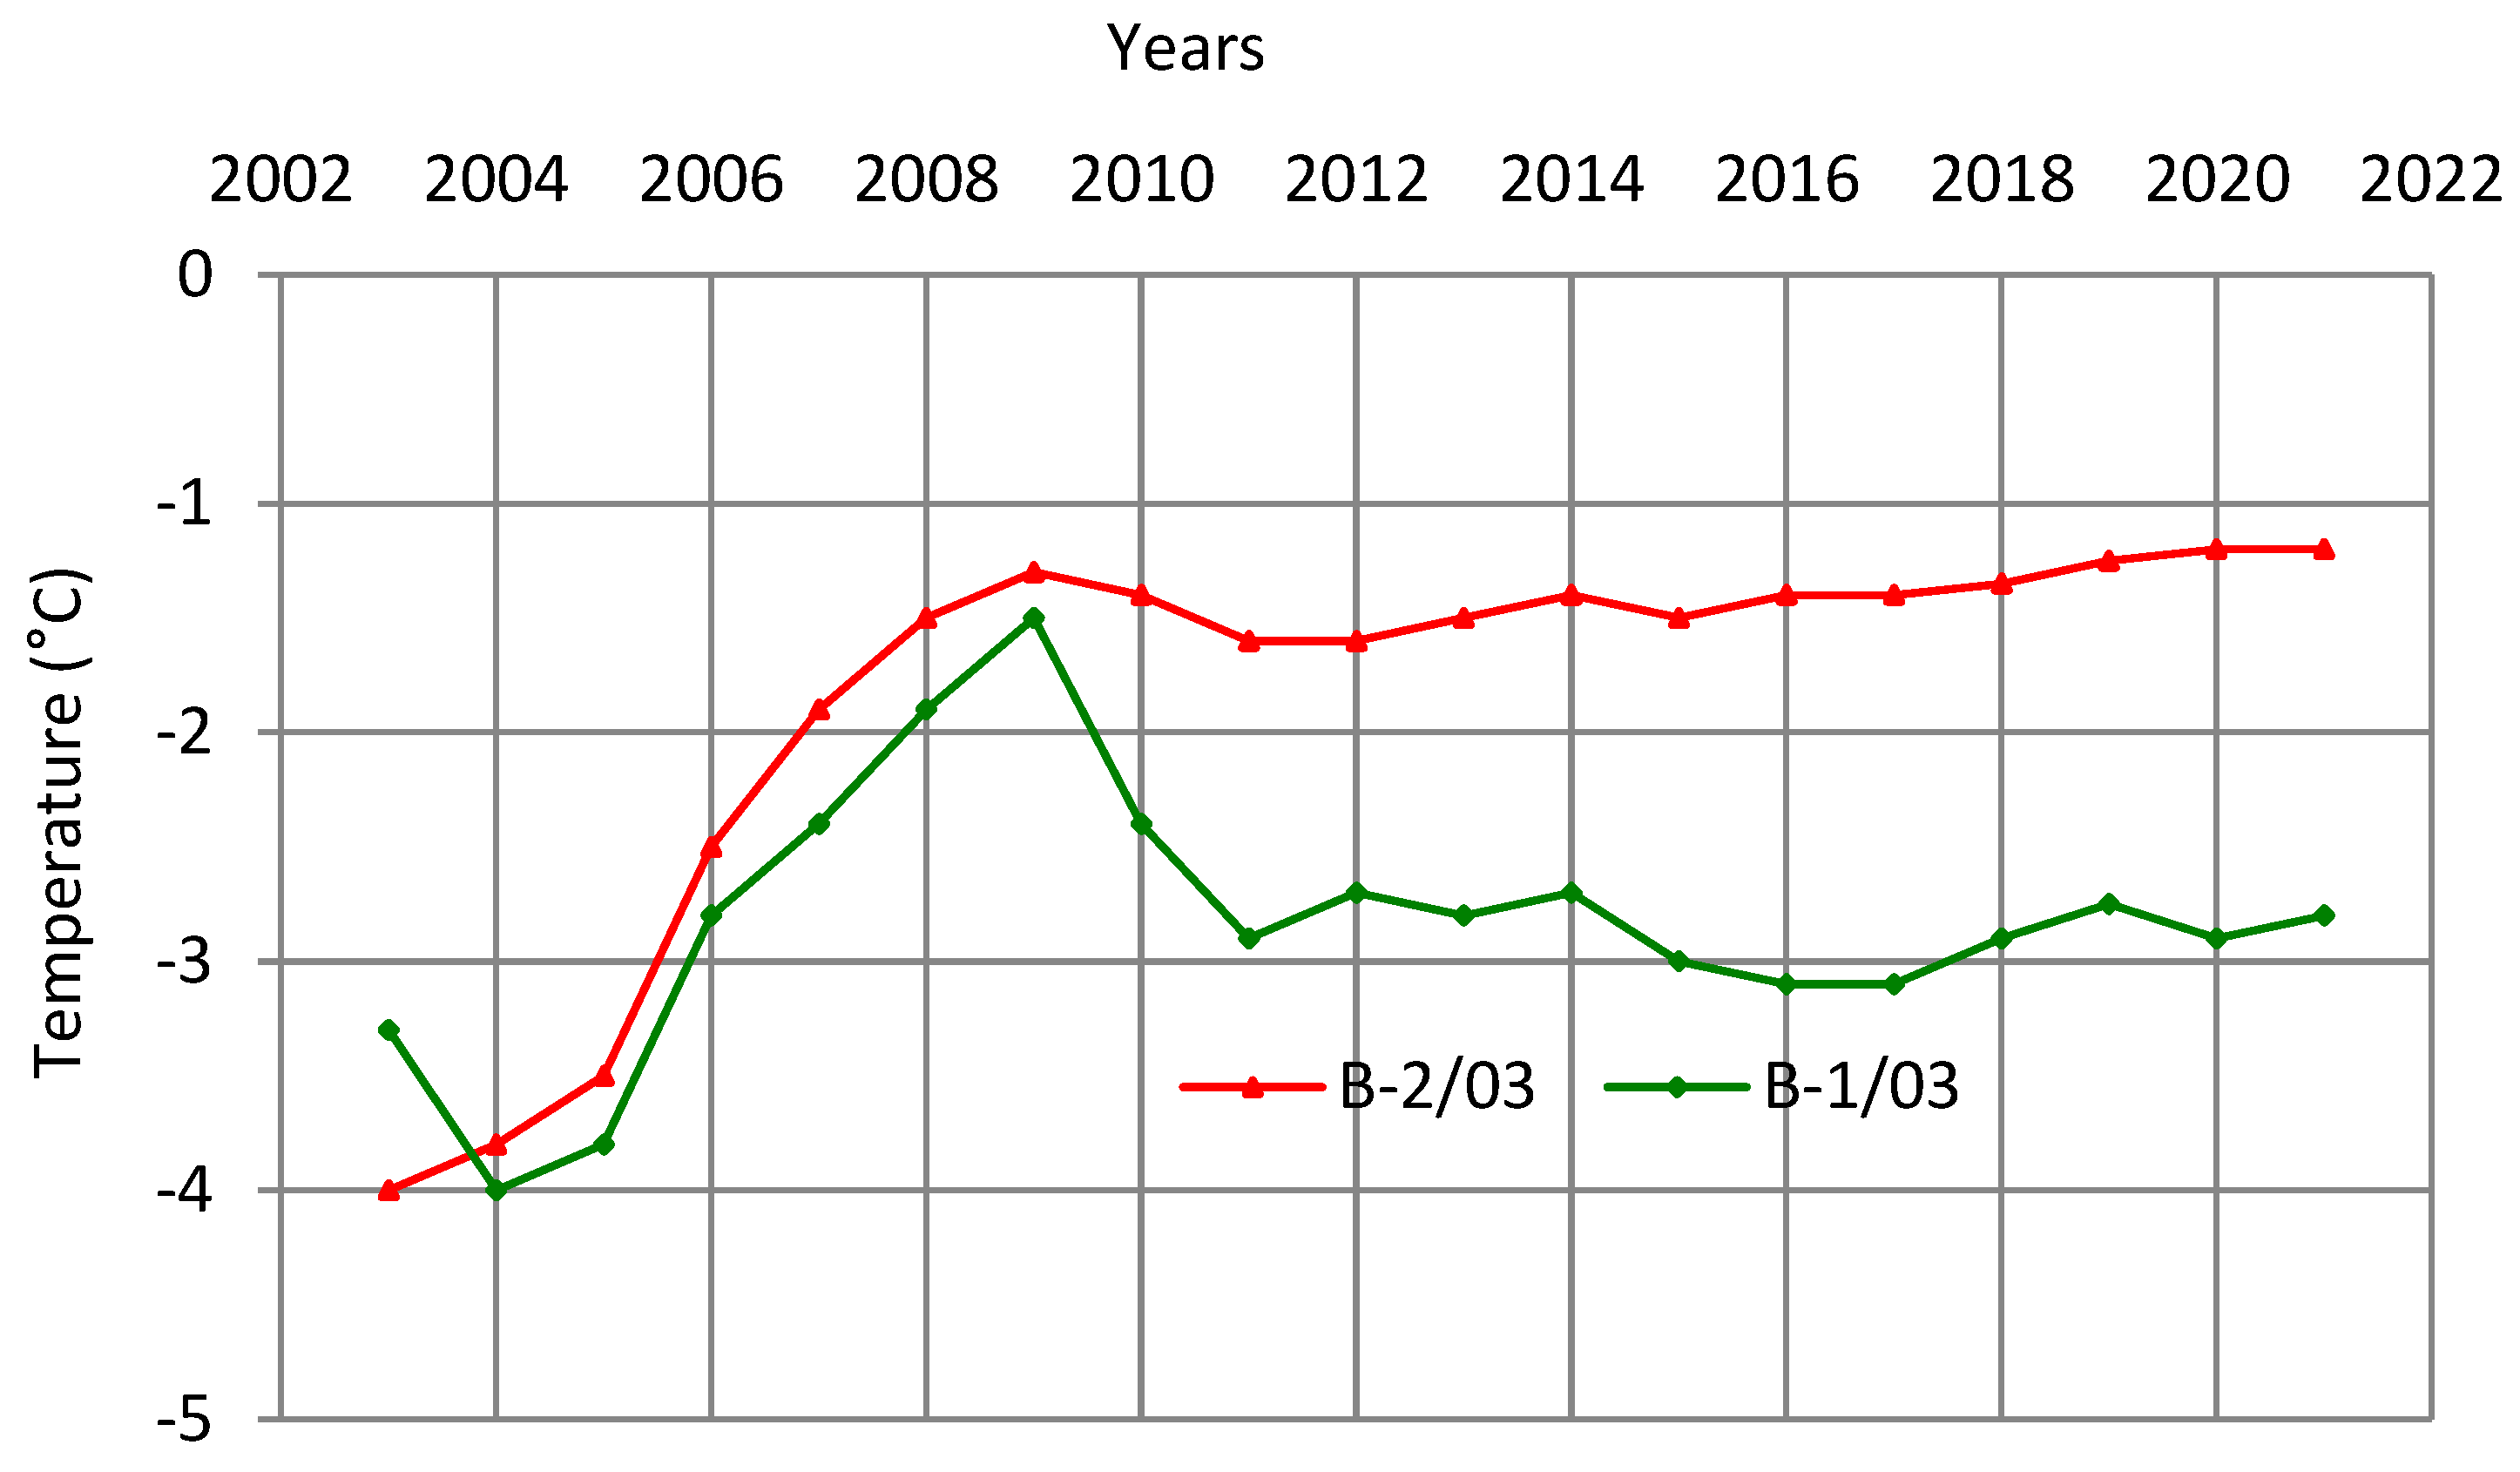
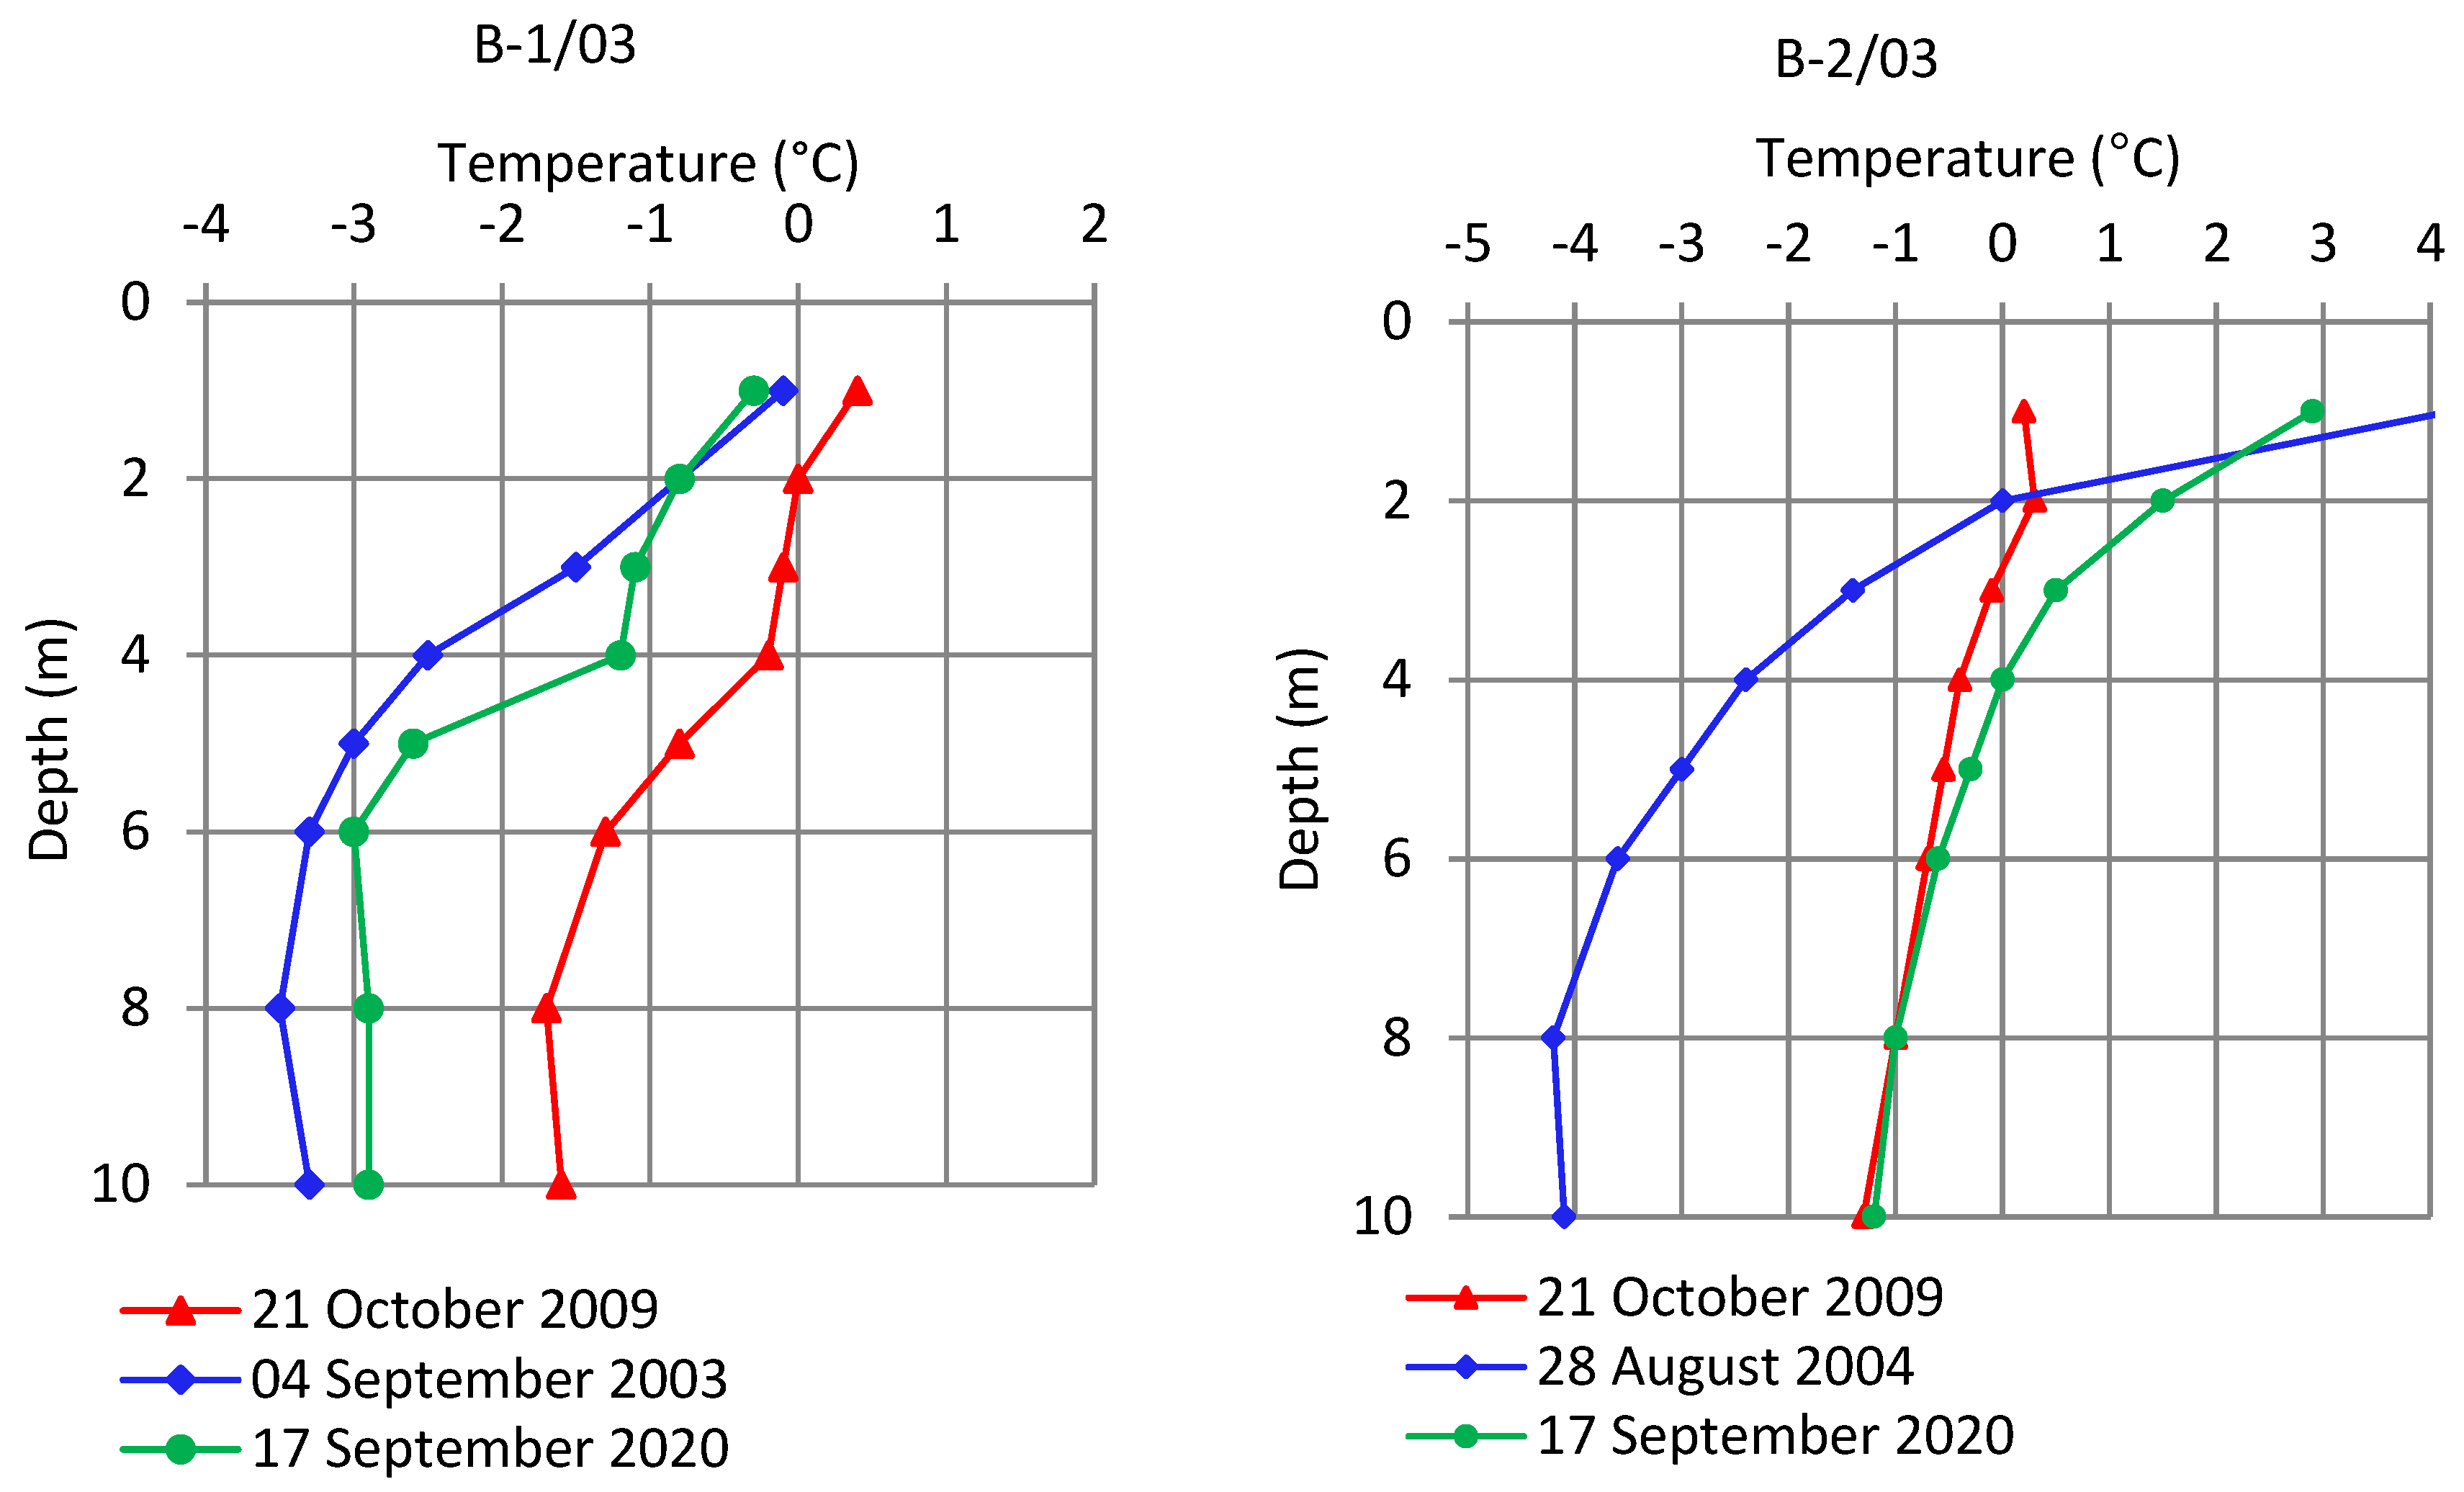
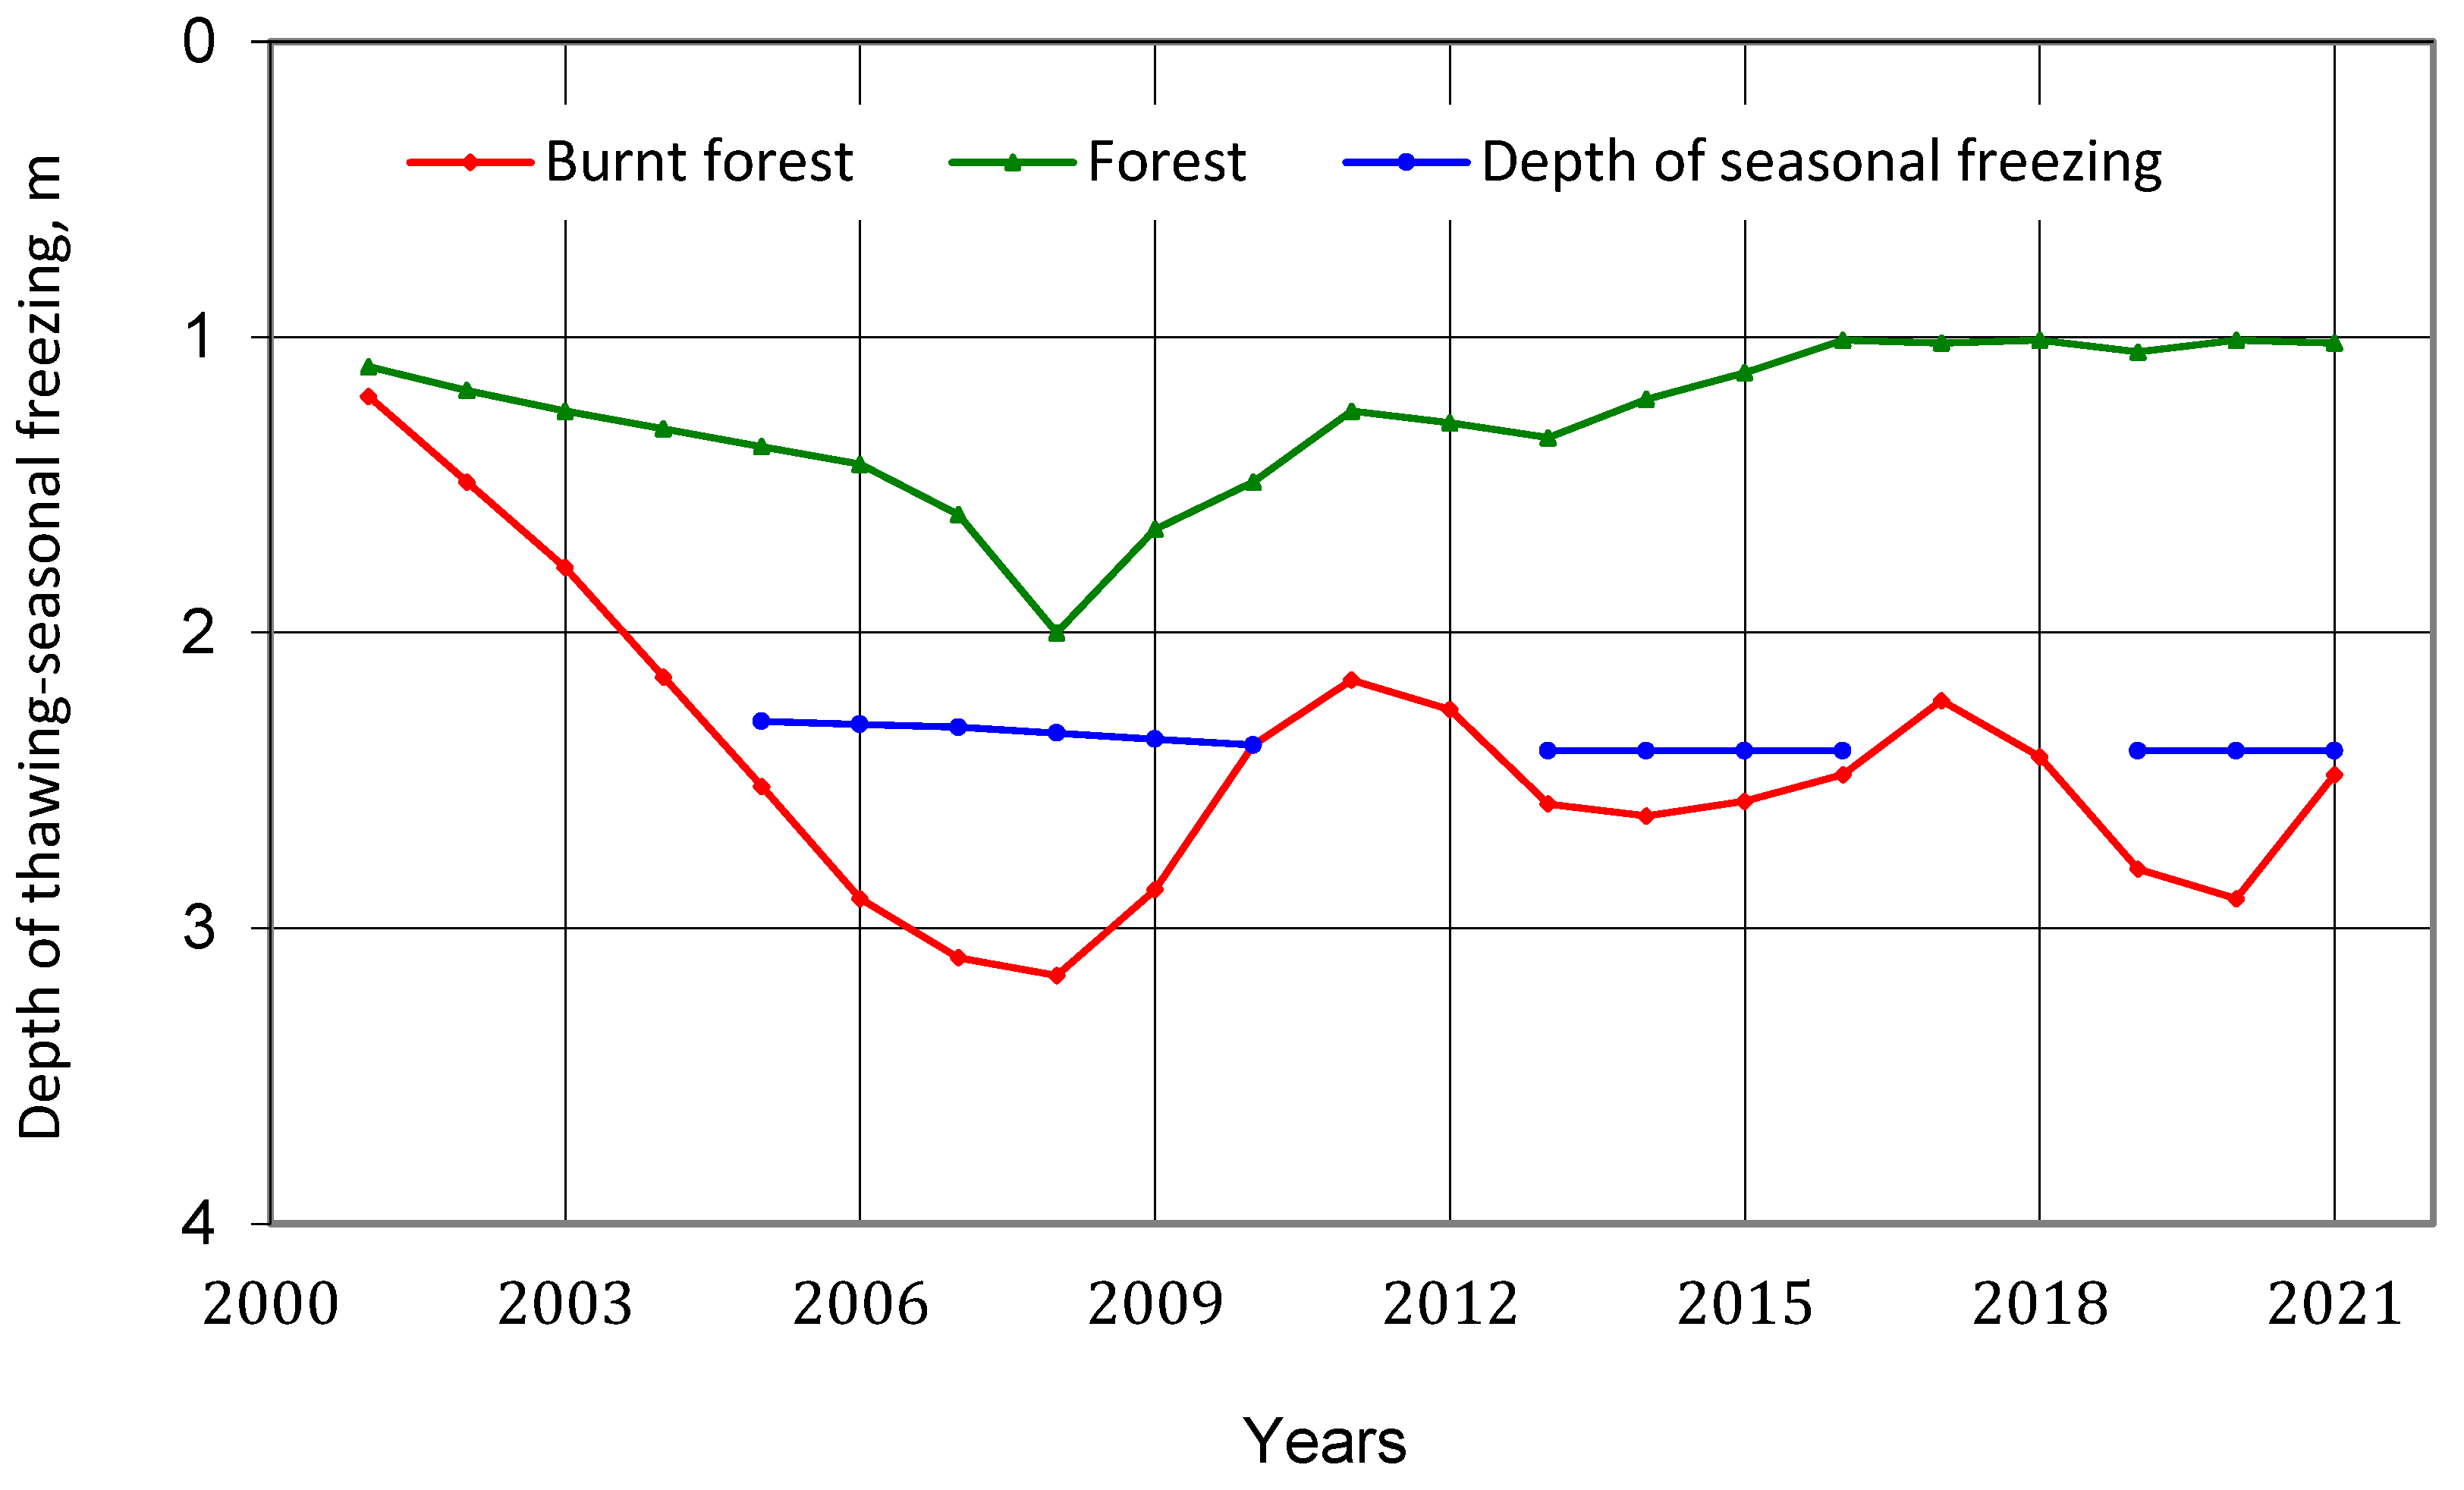
4.2. Gas Pipeline
5. Conclusions
- Quantitative estimates were obtained for the thermal dynamics of the upper permafrost in natural and disturbed terrain along the pipelines.
- Analysis of the data from the Yakutsk meteorological station and the experimental monitoring sites indicated that the characteristics of meteorological conditions were some of the main factors that determined the multidirectional influence on the ground thermal regime. Climatic records for the period 1980–2020 showed a consistently increasing trend of 0.066 °C/year for air temperature and a substantial interannual variability of precipitation and snow cover parameters.
- Removing the forest and surface cover along the elevated water pipeline increased the mean annual ground temperature at a 5 m depth by 1.5 °C and deepened the active layer by 1.1 m after 25 years. Changes in the ground thermal conditions resulted in surface subsidence by 0.5–1.0 m and thermokarst initiation, posing a threat to the stability of the supporting ground.
- Forest removal at the fire site near the buried gas pipeline increased the mean annual ground temperature at a 10 m depth by 2.7 °C after 18 years. The surface disturbance created an unfrozen talik layer to a depth of 3.2 m beneath the active layer of 2.3–2.4 m. Surface subsidence was observed at the site, which suggested the initiation of polygonal terrain development.
- The research results can be extrapolated to similar anthropogenic landscapes and can be used to model the thermal regime of the soil under anthropogenic impacts and develop environmental protection measures.
Author Contributions
Funding
Data Availability Statement
Conflicts of Interest
References
- He, R.X.; Jin, H.J. Permafrost and Cold-Region Environmental Problems of the Oil Product Pipeline from Golmud to Lhasa on the Qinghai-Tibet Plateau and Their Mitigation. Cold Reg. Sci. Technol. 2010, 64, 279–288. [Google Scholar] [CrossRef]
- Hu, Z.L.; Wu, M.; Chen, Y. The Present Situation and Trend of Pipeline Safety Study of Frost Heave. Oil Gas Storage Transp. 2011, 30, 881–882. [Google Scholar]
- Huang, L.; Sheng, Y. Experimental Study on the Interaction between Pipe and Soil under Frost Heave Condition. In Proceedings of the China-Europe Conference on Geotechnical Engineering, Vienna, Austria, 13–16 August 2018; pp. 1372–1375. [Google Scholar] [CrossRef]
- Khrenov, N.N. Problems of Reliability Control of Gas Pipelines in Cryolithozone of West Siberia. Earth Cryosphere 2005, IX, 81–88. [Google Scholar]
- Lawrence, D.E.; Smith, S.L.; Burgess, M.M. Frost Heave and Northern Pipelines: State of the Art and Status of Research—Three Contributing Studies. Geol. Surv. Can. Ott. Ont. Open File 5004 2005. [Google Scholar] [CrossRef]
- Nixon, J.; Burgess, M. Norman Wells Pipeline Settlement and Uplift Movements. Can. Geotech. J. 1999, 36, 119–135. [Google Scholar] [CrossRef]
- Seligman, B. Long-Term Variability of Pipeline-Permafrost Interactions in North-West Siberia. Permafr. Periglac. Process. 2000, 11, 5–22. [Google Scholar] [CrossRef]
- Wang, Y.-P.; Li, G.-Y.; Jin, H.-J.; Lu, L.-Z.; He, R.-X.; Zhang, P. Thermal state of soils in the active layer and underlain permafrost at the kilometer post 304 site along the China-Russia Crude Oil Pipeline. J. Mt. Sci. 2016, 13, 1984–1994. [Google Scholar] [CrossRef]
- Wang, F.; Li, G.; Ma, W.; Wu, Q.; Serban, M.; Samsonova, V.; Fedorov, A.; Jiang, N.; Wang, B. Pipeline–permafrost interaction monitoring system along the China–Russia crude oil pipeline. Eng. Geol. 2019, 254, 113–125. [Google Scholar] [CrossRef]
- Li, Y.; Jin, H.; Wen, Z.; Li, X.; Zhang, Q. Stability of the Foundation of Buried Energy Pipeline in Permafrost Region. Geofluids 2021, 2021, 3066553. [Google Scholar] [CrossRef]
- Oswell, J.M. Pipelines in permafrost: Geotechnical issues and lessons. 1 2010 R.M. Hardy Address, 63rd Canadian Geotechnical Conference. Can. Geotech. J. 2011, 48, 1412–1431. [Google Scholar] [CrossRef]
- Johnson, E.; Hegdal, L. Permafrost-Related Performance of the Trans-Alaska Oil Pipeline. In Proceedings of the 9th International Conference on Permafrost, Fairbanks, AK, USA, 28 June–2 July 2008; pp. 857–864. [Google Scholar]
- Burgess, M.M.; Oswell, J.; Smith, S.L. Government-Industry Collaborative Monitoring of a Pipeline in Permafrost—The Norman Wells Pipeline Experience, Canada. In Proceedings of the GEO2010: 63rd Canadian Geotechnical Conference & 6th Canadian Permafrost Conference, Calgary, AB, Canada, 12–16 September 2010; Canadian Geotechnical Society: Richmond, BC, Canada, 2010; pp. 579–586. Available online: http://pubs.aina.ucalgary.ca/cpc/CPC6-579.pdf (accessed on 26 February 2020).
- Smith, S.; Burgess, M.; Riseborough, D. Ground Temperature and Thaw Settlement in Frozen Peatlands Along the Norman Wells Pipeline Corridor, NWT Canada: 22 Years Of Monitoring. In Proceedings of the 9th International Conference on Permafrost, Fairbanks, AK, USA, 29 June–3 July 2008; pp. 1665–1670. [Google Scholar]
- Wu, Q.; Shi, B.; Fang, H. Engineering Geological Characteristics and Processes of Permafrost Along the Qinghai—Xizang (Tibet) Highway. Eng. Geol. 2003, 68, 387–396. [Google Scholar] [CrossRef]
- Osterkamp, T.E. Establishing long-term permafrost observatories for active-layer and permafrost investigations in Alaska: 1977-2002. Permafr. Periglac. Process. 2003, 14, 331–342. [Google Scholar] [CrossRef]
- Smith, S.; Burgess, M.; Riseborough, D.; Nixon, F. Recent Trends from Canadian Permafrost Thermal Monitoring Network Sites. Permafr. Periglac. Process. 2005, 16, 19–30. [Google Scholar] [CrossRef]
- Hu, X.; Tan, F.; Tang, H.; Zhang, G.; Su, A.; Xu, C.; Zhang, Y.; Xiong, C. In-situ monitoring platform and preliminary analysis of monitoring data of Majiagou landslide with stabilizing piles. Eng. Geol. 2017, 228, 323–336. [Google Scholar] [CrossRef]
- Ustinova, E.V. Cartographical Method of Research of the Nadym-Punga Gas Pipeline Route Area. Earth Cryosphere 2007, XI, 27–31. [Google Scholar]
- Belova, N.; Abramova, A.; Novikova, A.; Shilova, O.; Baranskaya, A. Erosion of Permafrost Coasts Under Local Human Impact, Western Yamal Peninsula, Kara Sea, Russia. Int. Multidiscip. Sci. GeoConference Surv. Geol. Min. Ecol. Manag. SGEM 2018, 18, 379–386. [Google Scholar]
- Woo, M.-K.; Mollinga, M.; Smith, S.L. Simulating Active Layer Thaw in a Boreal Environment. Geogr. Phys. Quat. 2007, 60, 9–17. [Google Scholar] [CrossRef] [Green Version]
- Pazinyak, V.V.; Kutvitskaya, N.B.; Minkin, M.A. The Experimental Researches on Pipeline Stability for Large-Scale Soil Model. Earth Cryosphere 2006, X, 51–55. [Google Scholar]
- Pazdernik, D.S. The Impact of Global Warming on the Thermal Stabilization of Soil Base of the Buried Pipeline in the Conditions of Permafrost Soils. Neft. Khozyaystvo-Oil Ind. 2016, 7, 106–108. [Google Scholar]
- Skachkov, Y.B. Recent Variations in Main Climatic Elements at Yakutsk. In Proceedings of the Eighth Siberian Workshop on Climate and Ecological Monitoring, Tomsk, Russia, 8–10 October 2009; Agraf-Press: Tomsk, Russia, 2009; pp. 83–84. (In Russian). [Google Scholar]
- Varlamov, S.P.; Skachkov, Y.B.; Skryabin, P.N. Results of 35 Years of Permafrost Monitoring at the Chabyda Station, Central Yakutia. Arctic Subarct. Nat. Resour. 2017, 2, 34–40. (In Russian) [Google Scholar]
- Batir, J.F.; Hornbach, M.J.; Blackwell, D.D. Ten years of measurements and modeling of soil temperature changes and their effects on permafrost in Northwestern Alaska. Glob. Planet. Chang. 2017, 148, 55–71. [Google Scholar] [CrossRef] [Green Version]
- Biskaborn, B.K.; Smith, S.L.; Noetzli, J.; Matthes, H.; Vieira, G.; Streletskiy, D.A.; Schoeneich, P.; Romanovsky, V.E.; Lewkowicz, A.G.; Abramov, A.; et al. Permafrost is Warming at a Global Scale. Nat. Commun. 2019, 10, 264. [Google Scholar] [CrossRef] [PubMed] [Green Version]
- Zhelezniak, M.; Konstantinov, P. Permafrost—Circumpolar Status Report. Russia. Circle 2015, 4, 9–10. [Google Scholar]
- Pavlov, A.V. Permafrost Monitoring; Publishing House “Geo”: Novosibirsk, Russia, 2008; p. 230. (In Russian) [Google Scholar]
- Romanovsky, V.; Sazonova, T.; Balobaev, V.; Shender, N.; Sergueev, D. Past and recent changes in air and permafrost temperatures in eastern Siberia. Glob. Planet. Chang. 2007, 56, 399–413. [Google Scholar] [CrossRef]
- Romanovsky, V.E.; Drozdov, D.S.; Oberman, N.G.; Malkova, G.V.; Kholodov, A.L.; Marchenko, S.; Moskalenko, N.G.; Sergeev, D.O.; Ukraintseva, N.G.; Abramov, A.; et al. Thermal state of permafrost in Russia. Permafr. Periglac. Process. 2010, 21, 136–155. [Google Scholar] [CrossRef] [Green Version]
- Varlamov, S.; Skachkov, Y.; Skryabin, P. Current Climate Change Effects on the Ground Thermal Regime in Central Yakutia. Sci. Cold Arid. Reg. 2014, 6, 282–292. [Google Scholar] [CrossRef]
- Varlamov, S.P.; Skachkov, Y.B.; Skryabin, P.N. Evolution of the thermal state of permafrost under climate warming in Central Yakutia. Holocene 2019, 29, 1401–1410. [Google Scholar] [CrossRef]
- Skachkov, Y.B.; Skryabin, P.N.; Varlamov, S.P. Near-Surface Ground Temperature Variations at the Yakutsk Permafrost Thermal Monitoring Site during the Last 40 Years. Permafrost Engineering. In Proceedings of the IX International Symposium, Mirny, Russia, 3–7 September 2011; Melnikov Permafrost Institute SB RAS: Yakutsk, Russia, 2011; pp. 444–449. [Google Scholar]
- Varlamov, S.P.; Skryabin, P.N. Anthropogenic Impact on the Thermal Regime of Soils in Central Yakutia; LAP LAMBERT Academic Publishing: Saarbrucken, Germany, 2013; p. 80. [Google Scholar]
- Varlamov, S.P.; Skachkov, Y.B.; Skryabin, P.N. Ground Temperature Regime in Permafrost Landscapes of Central Yakutia; Permafrost Institute: Yakutsk, Russia, 2002; p. 218. (In Russian) [Google Scholar]
- Skryabin, P.N.; Varlamov, S.P. Ground Thermal Regime in Disturbed Landscapes of Central Yakutia. Earth Cryosphere 2013, XVII, 44–49. (In Russian) [Google Scholar]
- Gavrilova, M.K. Climate of Central Yakutia, 2nd ed.; Yakutsk Publishing House: Yakutsk, Russia, 1973; p. 120. (In Russian) [Google Scholar]
- Skryabin, P.N.; Varlamov, S.P.; Skachkov, Y.B. Interannual Variability of the Ground Thermal Regime in the Yakutsk Area; SB RAS Press: Novosibirsk, USSR, 1998; p. 144. (In Russian) [Google Scholar]
- Federal Service for Hydrometeorology and Environmental Monitoring of Russia. Strategic Forecast of Climate Changes in the Russian Federation for the Period 2010–2015 and Their Influence on Branches of Russia’s Economy; Roshydromet Press: Moscow, Russia, 2005; p. 28. (In Russian)
- Neradovskii, L.G.; Skachkov, Y.B. Prediction of Air Temperatures in Yakutia Up to 2050. In Proceedings of the IX International Symposium on Permafrost Engineering, Mirny, Russia, 3–7 September 2011; Melnikov Permafrost Institute Press: Yakutsk, Russia, 2011; pp. 389–393. [Google Scholar]


| Terrain Type | Borehole ID | Monitoring Start Year | Observational Program |
|---|---|---|---|
| Floodplain | B-168/89 | 1989 | Terrain survey, cryolithology, geocryological processes, meteorological conditions (based on weather station data), snow depth and density, thermophysical properties of surface covers and soils, and geothermal monitoring (permafrost temperature and seasonal thaw depth) |
| Sand ridge | B-13/87, B-13/93 | 1987, 1993 | |
| Inter-alas | B-10/93, B-12/93 | 1993 | |
| B-1/03, B-2/03 | 2003 |
| Parameter. | Mean | Min. | Max. | δ |
|---|---|---|---|---|
| Air Temperature | ||||
| Annual, °C | −8.4 | −10.7 | 6.0 | 1.18 |
| Sum for the cold season, month degrees | −166.0 | −193.8 | −144.7 | 12.17 |
| Sum for the warm season, month degrees | 65.8 | 55.9 | 72.5 | 4.24 |
| Precipitation | ||||
| Annual, mm | 235 | 125 | 348 | 47.89 |
| Warm season, mm | 158 | 82 | 255 | 44.14 |
| Snow Cover | ||||
| Snow depth, cm | 21.9 | 11.9 | 36.4 | 5.50 |
| Snow-cover onset (δ, days) | Oct 13 | Sep 29 | Oct 24 | 7 days |
| Snow-cover end (δ, days) | Apr 26 | Apr 18 | May 6 | 5 days |
Publisher’s Note: MDPI stays neutral with regard to jurisdictional claims in published maps and institutional affiliations. |
© 2022 by the authors. Licensee MDPI, Basel, Switzerland. This article is an open access article distributed under the terms and conditions of the Creative Commons Attribution (CC BY) license (https://creativecommons.org/licenses/by/4.0/).
Share and Cite
Varlamov, S.; Skryabin, P.; Zhirkov, A.; Wen, Z. Monitoring the Permafrost Conditions along Pipeline Routes in Central Yakutia, Russia. Land 2022, 11, 2331. https://doi.org/10.3390/land11122331
Varlamov S, Skryabin P, Zhirkov A, Wen Z. Monitoring the Permafrost Conditions along Pipeline Routes in Central Yakutia, Russia. Land. 2022; 11(12):2331. https://doi.org/10.3390/land11122331
Chicago/Turabian StyleVarlamov, Stepan, Pavel Skryabin, Aleksandr Zhirkov, and Zhi Wen. 2022. "Monitoring the Permafrost Conditions along Pipeline Routes in Central Yakutia, Russia" Land 11, no. 12: 2331. https://doi.org/10.3390/land11122331