Article

Coordinated Development of Farmland Transfer and Labor Migration in China: Spatio-Temporal Evolution and Driving Factors

1
School of Economics and Management, Xinjiang Agricultural University, Urumqi 830052, China
2
School of Economics and Management, Northwest A&F University, Xianyang 712100, China
3
School of Public Administration, Xinjiang Agricultural University, Urumqi 830052, China
*
Authors to whom correspondence should be addressed.
Land 2022, 11(12), 2327; https://doi.org/10.3390/land11122327
Submission received: 24 November 2022 / Revised: 15 December 2022 / Accepted: 16 December 2022 / Published: 19 December 2022
(This article belongs to the Special Issue Rural Land Use in China)

Abstract

:
The coordinated development of farmland transfer (FT) and labor migration (LM) is of great efficiency significance to facilitate the development of rural economy and implement the rural revitalization strategy. The study used socioeconomic data from 30 provinces/autonomous regions/municipalities (hereafter referred to as provinces) in China to measure the coupling coordination degree (CCD) of FT and LM. It adopted the coupling coordination degree model (CCDM), exploratory spatial data analysis method (ESDA), and gray relational analysis model (GARM) to investigate the spatial differences in the CCD and its influencing factors. The results indicate the following: (1) Regional differences are evident despite the fact that the comprehensive evaluation level of FT and LM in the various provinces is relatively low and displaying a rising trend. (2) The CCD of FT and LM exhibits a fluctuating upward trend and is at the primary coupling coordination stage, with a significant difference in coupling coordination levels between regions, and a spatial distribution pattern of central region > eastern region > northeast region > western region. (3) The CCD shows a strong global spatial positive correlation with clear fluctuations, demonstrating the agglomeration dispersion development tendency over time; the local spatial agglomeration state emerges and stabilizes. According to the distribution pattern, the Western region exhibits weak agglomeration type, whereas the eastern and central regions exhibit strong agglomeration type. (4) There are significant variations between provinces in terms of the intensity of the CCD of FT and LM, as well as the level of concurrent employment business, the level of non-agricultural industry development, the level of urbanization, the level of agricultural equipment, and the land approval.

1. Introduction

As the key elements of agricultural production, the movement and reorganization of labor and land are not only significance to address problems affecting farmers, rural areas, and agriculture in China, but also beneficial for consolidate progress toward poverty alleviation and achieve common prosperity. However, in light of fundamental national conditions in China, which include a large population and limited land, as well as the institutional arrangement of a household contract responsibility system with output-linked compensation, the problems of the small scale of agricultural operations, the relatively low agricultural labor productivity, and the continuous increase of agricultural surplus labor become extremely prominent. In order to solve the above problems, farmers select different forms of farmland transfer (FT) and labor migration (LM) to optimize the allocation of land and labor factors from production sectors with relatively low marginal productivity to production sectors with relatively higher marginal productivity, so as to continuously improve the income of farmers and achieve the goal of rational allocation of land resources and labor resources [1,2,3]. In fact, influenced by resource endowment [4,5], welfare guarantee function of rural land [6], farmers’ risk awareness [7], land transfer cost [8], family labor allocation [9], the high level of labor migration, and a high level of farmland transfer has not occurred concurrently, and the farmland transfer has a deviation from labor migration in the development process. Such incoordination directly affects the orderly economic and social development, as well as agricultural and rural modernization construction. The issue of coupling and coordinated development of FT and LM has become one of the key concerns of rural economic research in the context of rural revitalization strategy. Therefore, this study intended to focus on the above questions and provide a reference for decision making to advance the mutual promotion of FT and LM in China and establish a positive interaction with organic coupling and coordination between them.
At present, the academic community has accumulated abundant research results related to FT and LM; there are two general categories of existing literature. On the one hand, it explored the mutual influence of FT and LM. The majority of the literature held the view that FT and LM had an inverted “U” relationship [10,11,12]. Concerning the effect that the FT has on LM, the current fragmentation of land prevents the rural labor migration and is not good for agricultural mechanization [13], while farmland transfer and land consolidation may solve this problem by reducing agricultural labor intensity, realizing labor resource reallocation, improving the use efficiency of rural labor force [14,15,16], improving the level of labor migration [17], increasing the income of farmers [18,19], and reducing the urban–rural disparity [20]. The decision-making behavior of farm households to transfer in or out farmland is correlated to the number of non-agricultural labor forces and agricultural labor productivity [21], whereas changes in land use are brought about by large-scale land transactions, while large-scale land transactions lead to changes in land use, both of which have a direct effect on household labor distribution and gender division of labor [22]. In addition, the absence of farmland transfer right [23], household income increases after labor migration [24], a well-functioning land market [25], and the instability of the duration of farmland contractual rights [26] can also significantly affect the level of LM. Due to the fixed time and maturity of crops, labor demand is mainly distributed throughout the growing season [27]; this means that the rural labor force has the possibility of moving out for employment. In terms of the impact of LM on FT, current studies concluded that LM could influence FT [28,29,30,31], specifically, the level of non-agricultural income and the proportion of non-agricultural employment positively affect the farmland transfer [32]: the larger the household labor force, the greatest probability that the peasant household is to transfer to the farmland, and the larger the proportion of non-agricultural labor force in the household labor force, the greater the possibility to transfer out of the farmland [33]; most current literature emphasizes that LM was beneficial to promoting land reallocation and reuse [34] with a phased impact [35]. Meanwhile, the expansion of urban non-agricultural population size has also become the main driving force of FT as the rural labor forces move to cities and towns [36,37].
On the other hand, the relationship between LM and the FT has been the subject of discussion. Existing studies have found an interaction relationship between LM and the FT; with the continuous rise of non-agricultural wages and a large number of rural labor force transferred to cities, the phenomenon of farmland abandonment is increasingly serious [38,39,40,41]; to solve this problem and improve the allocation efficiency of land resources, farmland should be transferred from farmers not willing to manage agriculture or with relatively lower agricultural productivity to those willing to manage agriculture or with higher agricultural productivity [42]. However, for some parts of the transferred labor force, the social pension function of farmland increases the opportunity cost of labor force transfer, thus hindering the transfer of farmland [43]. Some studies suggest that the development of LM and the FT are affected by the same factors, such as farmland certification [44,45,46,47]. In addition, a few existing studies have revealed the coupling and coordinated relation between FT and LM from the theoretical and practical levels. In the coupling theory analysis study, research scholars studied the internal mechanism of FT and LM based on different theoretical perspectives. For example, Wang et al. measured the CCD of FT and LM in Xinjiang, the study found that the CCD of FT and LM in Xinjiang was at the stage of high coupling and primary coordination, and there were large differences between regions [48].
To sum up, the existing literature is not comprehensive in the explanation of the relation between farmland and labor force. In reality, most existing studies have focused on the interaction between FT and LM and lack research on the spatial distribution characteristics and driving factors of the coupling coordination degree (CCD) between the farmland transfer and labor migration. The research units placed emphasis on a province in China, lacking meso-scale provincial comparative analysis. Therefore, it is necessary to conduct detailed and in-depth research on the CCD of FT and LM in China to obtain reliable conclusions, and the research conclusions of this study offer an effective supplement to the current research on resource allocation and the agricultural economy.
The questions that this paper hopes to answer are as follows: What is the coupling coordination degree between the two systems of FT and LM in provinces of China? What are the changes of the coupling and coordination relations between them in different space and time? What are the driving factors affecting the changes in the level of coupling and coordination between them? This study had three main research objectives: (1) Using the data of the panel statistics from 2015 to 2019, applying the linear weighting method to measured farmland transfer and labor migration evaluation index and comprehensive evaluation index in China, and constructing a coupling coordination degree model (CCDM) to measure the CCD of FT and LM in 30 provinces/autonomous regions/municipalities (hereafter referred to as provinces) in China. (2) Applying the exploratory spatial data analysis method (ESDA) investigate the spatial differences in the CCD. (3) Using gray relational analysis model (GARM) to determine the driving factors behind CCD of FT and LM.
This study contribution of this paper is as follows: Reliable evidence regarding the coordinated development of farmland transfer and labor migration was obtained by constructing CCDM. This study also adds evidence to the research framework on the coordinated development of farmland transfer and labor migration and provides guidance to implement the rural revitalization strategy for other regions and provinces.
The rest part of this paper is structured as follows: The second part introduces the data sources, study area and research methods, and the third part presents the econometric analysis results of the coupling coordination, spatio-temporal evolution, and driving factors of FT and LM. The fourth part analyzes and discusses the empirical results, and the fifth part draws the conclusions of this paper.

2. Materials and Methods

2.1. Data Sources

The data of FT and LM used in this paper came from China Rural Management Statistical Annual Report. The social and economic statistics data were taken from the China Statistical Yearbook and the China Rural Statistical Yearbook. The relative indexes are calculated according to the corresponding original data, and the individual data with missing or abnormal data are corrected by the mean replacement method. Moreover, due to the lack of some statistical data in Hong Kong, Macao, Taiwan, and Tibet, this study identified 30 provinces in China as the research units.

2.2. Study Area

Since the reform and opening up, the industrialization and urbanization level has continued to improve in 30 provinces in China, and rural areas have undergone many changes in the rural land system and household registration management system, which have significantly promoted the farmland transfer and labor migration. As recorded by China Rural Management Statistical Annual Report, there is a total of area of 3.70 million hectares of farmland transfer, with a total of 254 million people of labor migration in 2019 in China, and the level of farmland transfer or labor migration had a large increase compared with 2018. However, the improvement of farmland transfer level and labor migration level brings about changes in the extent of farmland use, and problems such as the contradiction between rural labor and farmland are gradually highlighted. At the same time, as China’s farmland transfer and labor migration expand, the level of them varies significantly between provinces. Specifically, only a few provinces such as Inner Mongolia and Liaoning in China have reached the equilibrium state of farmland transfer level and labor migration level. Other provinces have failed to achieve the trend of balanced development, which means that the two have not reached coupled and coordinated development. For details, see Figure 1. Therefore, the evaluation of the CCD of FT and LM is not only significant to improve of the use efficiency of land resource elements and labor resource elements, but also beneficial for the development of agriculture, rural areas, and farmers in China.

2.3. Methods

2.3.1. The Evaluation Index System

The study referred to previous studies [48] and the index system was built according to scientificalness, integrity, and operability to measure the development levels of FT and LM. In this study, we selected 14 indexes from three aspects to represent the degree of FT development, and 13 indexes from three aspects to represent the degree of LM development (Table 1).
Before calculating the CCD of FT and LM, the study determined each index’s weight used the mean variance decision method. The specific steps are as follows: Firstly, to find a solution to the issue of significant differences in evaluation indicators, the extreme method is used to standardize the original indexes in the evaluation index system of FT and LM. The formula can be described by Equations (1) and (2):
Benefit   Indicator : X i j = X i j X min X max X min
Coat   Indicator : X i j = X max X i j X max X min
The X i j , X i j represent the original and standardized values of the index, and the j index’s maximum and minimum values are respectively represented by Xmax and Xmin.
The determination of the index weight has an important influence on the accuracy and objectivity of the evaluation results. We select the mean variance decision method in the objective empowerment method to determine the index weight and obtain the weight of each criterion layer and each index. The formula can be described by Equations (3)–(6):
E ( s ) = 1 n i = 1 n Z i j
σ ( S i ) = i = 1 n Z i j E ( S i 2 )
w i = σ ( S i ) / j = 1 m σ ( S j )
D i ( w ) = j = 1 m Z i j w i
In the formula, E(s) is the mean of a random variable, σ(Si) is the mean variance of Si, wi is the weight factor of Si, and Di (w) is the multi-indicator decision and ranking.

2.3.2. Linear Weighting Method

Based on the standardized weight and value of each index, drawing on the relevant research results [49], the evaluation index of FT and LM is calculated by linear weighting method. The formula can be described by Equations (7) and (8):
f ( x ) = i = 1 m w i x i j
g ( x ) = j = 1 n w j x i j
The f(x) and g(x) indicate the evaluation index of FT and LM, wi and wj represent the index weights of FT and LM, respectively, and the index value following standardization is xij.

2.3.3. CCDM

In order to study the level of CCD between FT and LM, the study referred to relevant research [50], and constructed the coupling coordination degree model (CCDM). The formula can be described by Equations (9)–(11):
C = { f ( x ) × g ( x ) [ f ( x ) + g ( x ) 2 ] 2 } 1 2
D = C × T
T = α f ( x ) + β g ( x )
where C is the coupling degree (CD) of FT and LM, D is the CCD of FT and LM, and T is the comprehensive evaluation index of them. α and β are the pending coefficients of FT and LM, respectively. The study accepts that the two subsystems of FT and LM are similarly significant, so the pending coefficient is α = β = 0.5.
Referring to the correlation study [51], the CCD between FT and LM was divided into 10 grades by using the uniform function distribution method (Table 2).

2.3.4. ESDA Method

When carrying out the overall research on the provinces in China, we ought to follow a mix of overall and local development, propose a top-level design based on the strategic height, and formulate the coordinated development strategy of spatial linkage. Therefore, spatial analysis should also be introduced when analyzing the relevant problems of the provinces in China. According to the relevant literature [52,53], the study used the ESDA method to analyze the CCD, and studied the spatial agglomeration, dispersion, and interaction mechanism by describing and visualizing their spatial layout, which is typically divided into global and local spatial autocorrelations. A global Moran’s I was used to calculate global spatial autocorrelation in order to show how the CCD of FT and LM were distributed across the entire space. The formula is as follows:
I   = M S 0 × i = 1 M j = 1 M w i j ( X i X ¯ ) ( X j X ¯ ) j = 1 M ( X i X ¯ ) 2
where M is the number of the study regions, and Xi and X ¯ represent the observed value and average value, respectively. The study regions i and j are weighted spatially as wij, and the space adjacent is 1 and space non-adjacent is 0. the range of the Moran’s I values is [−1,1], where a value larger than 0 indicates a positive correlation and a value lower than 0 indicates a negative correlation.
To determine the degree of spatial correlation and difference between the CCD of FT and LM in neighboring provinces, the local spatial autocorrelation test was calculated using local Moran’s I. The formula is as follows:
I i = Z i i = 1 M W i j Z j
where Wij are the spatial weights, while Zi and Zj are the normalized values of the observed values in the study regions i and j, respectively.

2.3.5. GRA Model

The driving factors of CCD of FT and LM were examined using the GRA model in 30 provinces in China [54]. The following is the workflow: Find out the feature sequence and the factor sequence. The characteristic sequence, which is denoted by Y0(m,t), is the CCD of FT and LM. Each driver was selected as the factor sequence and represented by Xi(m,t). Next, the grey correlation coefficients were determined. The formula can be described by Equation (14):
r i ( m , t ) = min i , m , t | Y 0 ( m , t ) X i ( m , t ) | + ρ × max i , m , t | Y 0 ( m , t ) X i ( m , t ) | | Y 0 ( m , t ) X i ( m , t ) | + ρ × max i , m , t | Y 0 ( m , t ) X i ( m , t ) |
Among them, Y0(m,t) and Xi(m,t) represent the feature and factor sequences after standardized treatment, respectively, and the coefficient of resolution is ρ (ρ = 0.5).
Finally, we calculated the grey correlation degree of the panel data by Equation (15):
r i = 1 M × T m = 1 M t = 1 N r i ( m , t )
In the formula, ri represents the gray correlation degree, where the larger the ri value, the stronger the correlation between the feature sequence and the factor sequence and the weaker the correlation.

3. Results

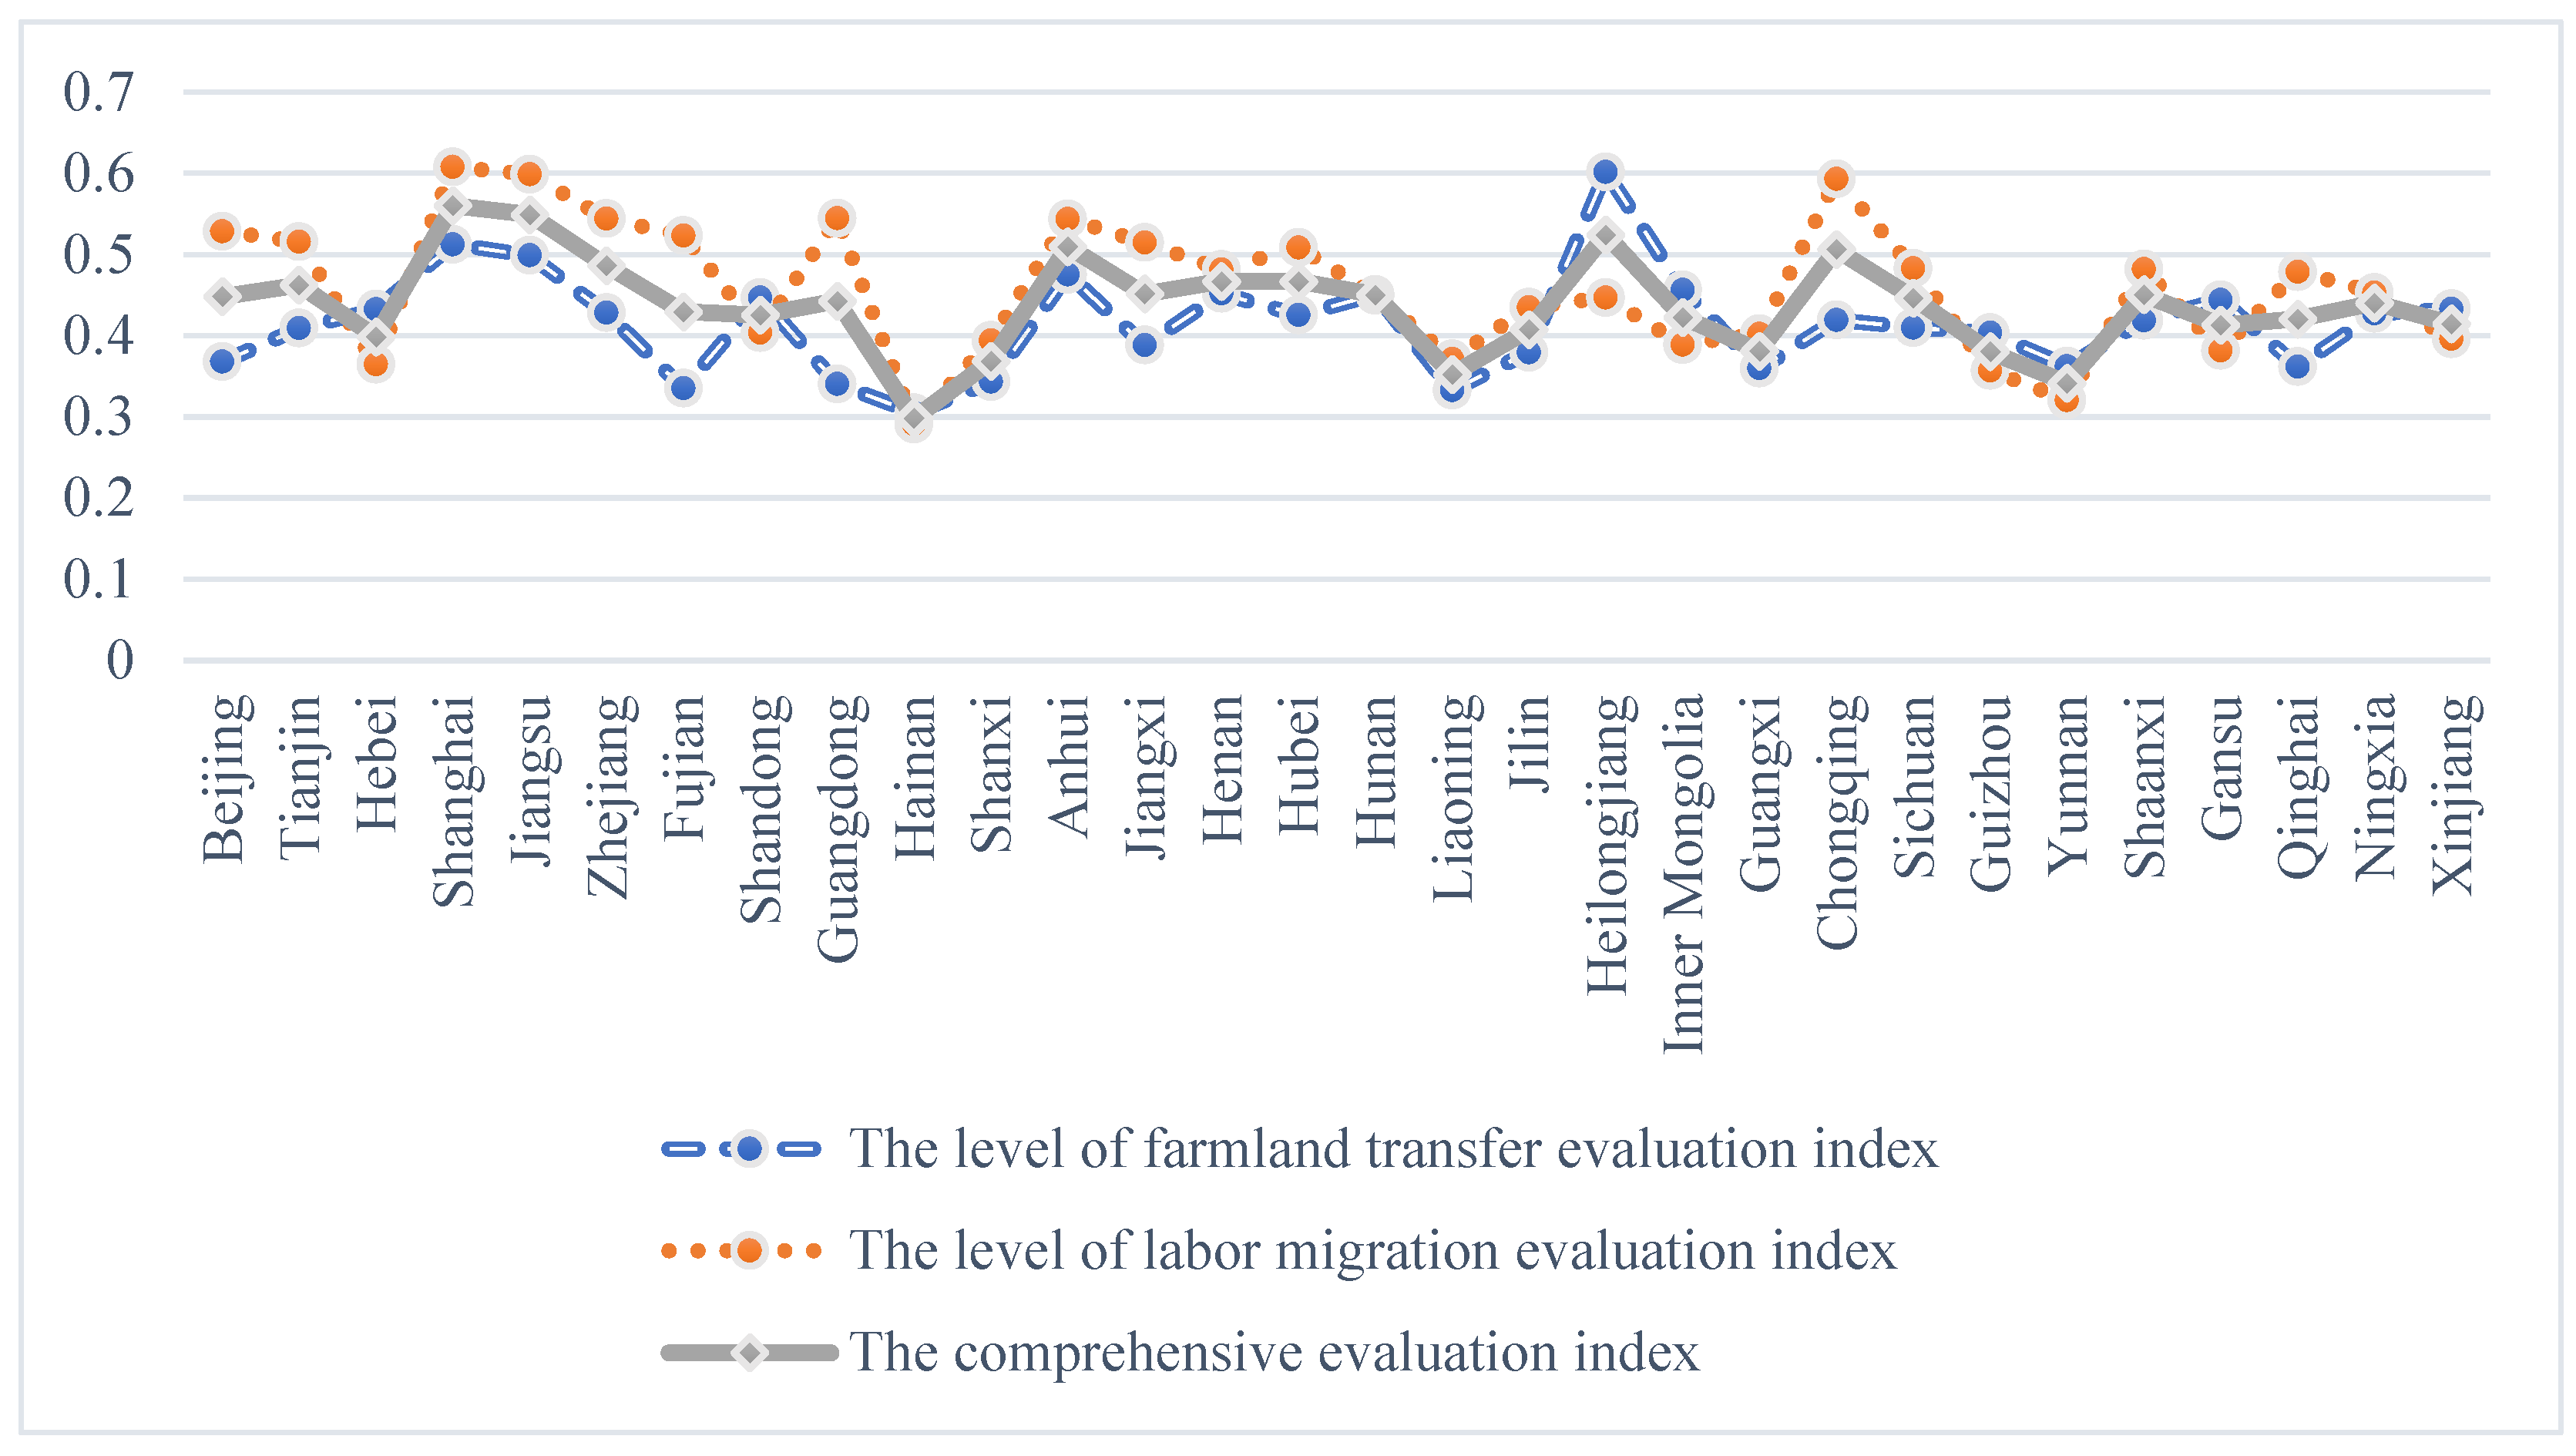
3.1. The Integrated Level of FT and LM Has Changed over Time in a Time Series

The level of China’s LM evaluation index was relatively high from 2015 to 2019, with an overall slight upward trend but obvious fluctuations, soaring to 0.5082 in 2019, up from 0.4958 in 2015, representing an average annual growth rate of 0.50%. While the index level showed a small decline from 2016 to 2017 and started to rise after reaching a minimum value in 2017. The evaluation index of FT fluctuated from 0.3798 in 2015 to 0.4009 in 2019, with an annual growth rate of 1.11% on average, and showed a good upward trend in all years except for a short decline in 2016. It benefited from the improvement of the level of FT and LM, the comprehensive evaluation index of them in China increased from 0.4378 in 2015 to 0.4546 in 2019, with an annual growth rate of 0.76% on average, and the comprehensive evaluation index during the study period showed a stable upward trend without obvious differences in the rate of change. For details, see Figure 2.
There are great differences in provincial FT, LM, and comprehensive evaluation index levels in China. The national average values of FT and LM evaluation indexes were only 0.3750 and 0.4882, respectively, from 2015 to 2019, whereas the comprehensive evaluation index only had an average value of 0.4316 (Figure 3). Among them, 21 provinces had the evaluation indexes of FT higher than the national average value, showing the spatial distribution characteristics of northeast region > central region > eastern region > western region. In total, 11 provinces had the evaluation indexes of LM higher than the national average value, showing the spatial distribution characteristics of central region > eastern region > western region > northeast region. Under the interaction of FT index and LM index in 30 provinces, there were 16 provinces with comprehensive evaluation index higher than the national average value, forming the spatial distribution characteristics of central region > eastern region > northeast region > western region.

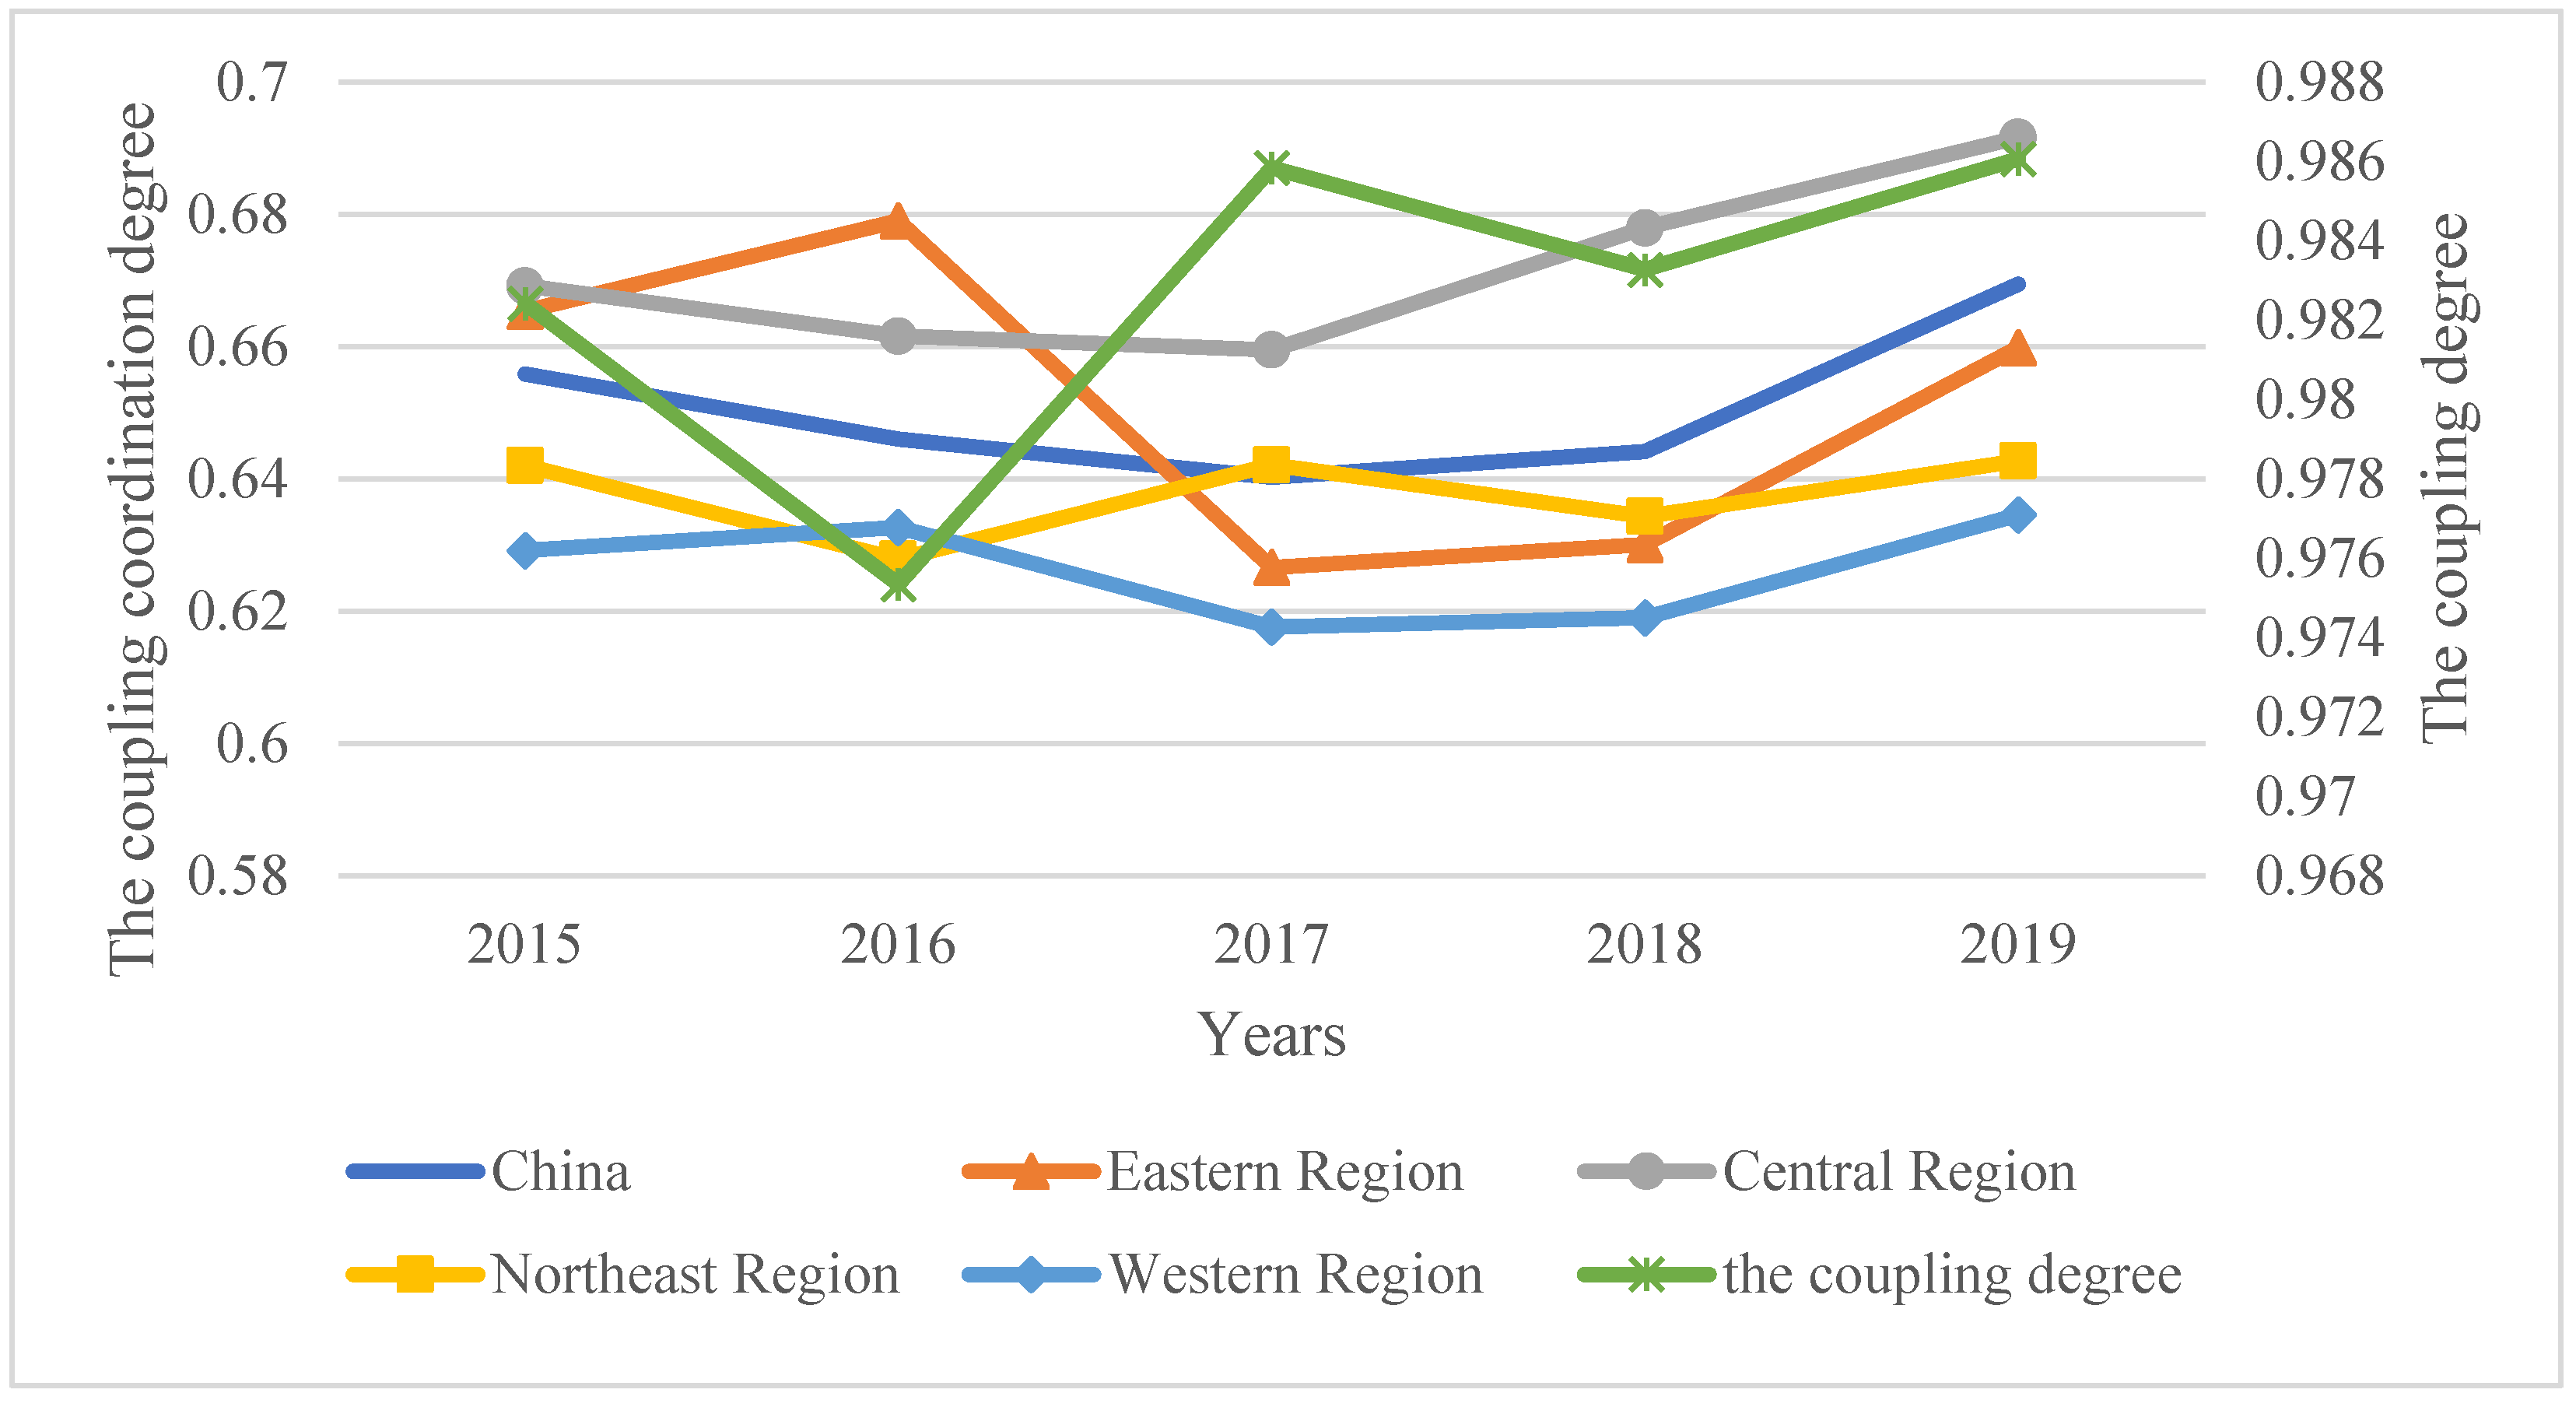
3.2. Spatio-Temporal Evolution of the CCD between FT and LM

The CDs of FT and LM in China from 2015 to 2019 were all higher than 0.970, indicating that the CD of FT and LM reached a high level of coupling and tends to be stable. While the CCD between FT and LM in China showed a tendency of upward and fluctuate, from 2015 to 2019, the CCD increased from 0.6558 to 0.6695, reaching the overall primary coupling coordination; however, the average annual growth rate was only 0.42%, which was relatively slow. The CCD of FT and LM had a large difference among regions, showing a distribution pattern of central region > eastern region > northeast region > western region. Among them, the central region had the highest level of coupling coordination between FT and LM, with an excellent upward trend, and the CCD fluctuated between 0.6692 and 0.6917, with an annual growth rate of 0.67% on average, which was at the middle and late stage of primary coupling coordination. Followed by the eastern region, the CCD decreased from 0.6654 to 0.6599, with an annual growth rate of −0.17% on average, and the CCD showed a slight downward trend. The northeast region ranked the third, with the CCD rising from 0.6420 to 0.6427, with an average annual growth rate of 0.02% and a relatively slow upward trend. The western region had the lowest coupling coordination level, rising from 0.6292 to 0.6346, with an annual growth rate of only 0.17% on average. For details, see Figure 4.
The CD of FT and LM of provinces in China from 2015 to 2019 was consistent with the overall national coupling degree and reached a high level of coupling. Except for Guangdong (0.942), the coupling degrees of FT and LM in all other provinces were above 0.950. In contrast, the CCDs of FT and LM in provinces of China were not high. The national average value was 0.6542, while most provinces had CCDs between 0.60 and 0.70, which was at a primary coupling coordination level (Table 3). Particularly, there were 15 provinces with CCD of FT and LM higher than the national average value, accounting for 50.00%, among which five provinces, including Shanghai (0.7450), Jiangsu (0.7361), Heilongjiang (0.7155), Anhui (0.7107), and Chongqing (0.7003) had the highest level of coupling coordination, with the average value higher than 0.70, which was at the early stage of the middle coupling coordination, accounting for 16.67% over the country. The CCDs of 10 provinces, including Zhejiang, Henan, and Hubei, were between 0.6578 and 0.6916, which were at the middle and late stage of primary coupling coordination, accounting for 33.33% of the country. There were 15 provinces with the CCD of FT and LM lower than the national average, accounting for 50.00% nationwide, among which 12 provinces, including Shandong, Inner Mongolia, and Guangdong, had the CCD between 0.6047 and 0.6502, and were at the middle and early stage of primary coupling coordination, accounting for 40.00% nationwide. Three provinces including Liaoning, Yunnan, and Hainan, had the CCD between 0.5411 and 0.5913 and were at the level of barely coupling coordination, accounting for 10.00% nationwide. Therefore, at this stage, there are still obvious regional differences in the CCD between FT and LM in 30 provinces in China. Although all of them have reached the coupling coordination, the coordination levels of most provinces are relatively low, and there is still large room for growth.

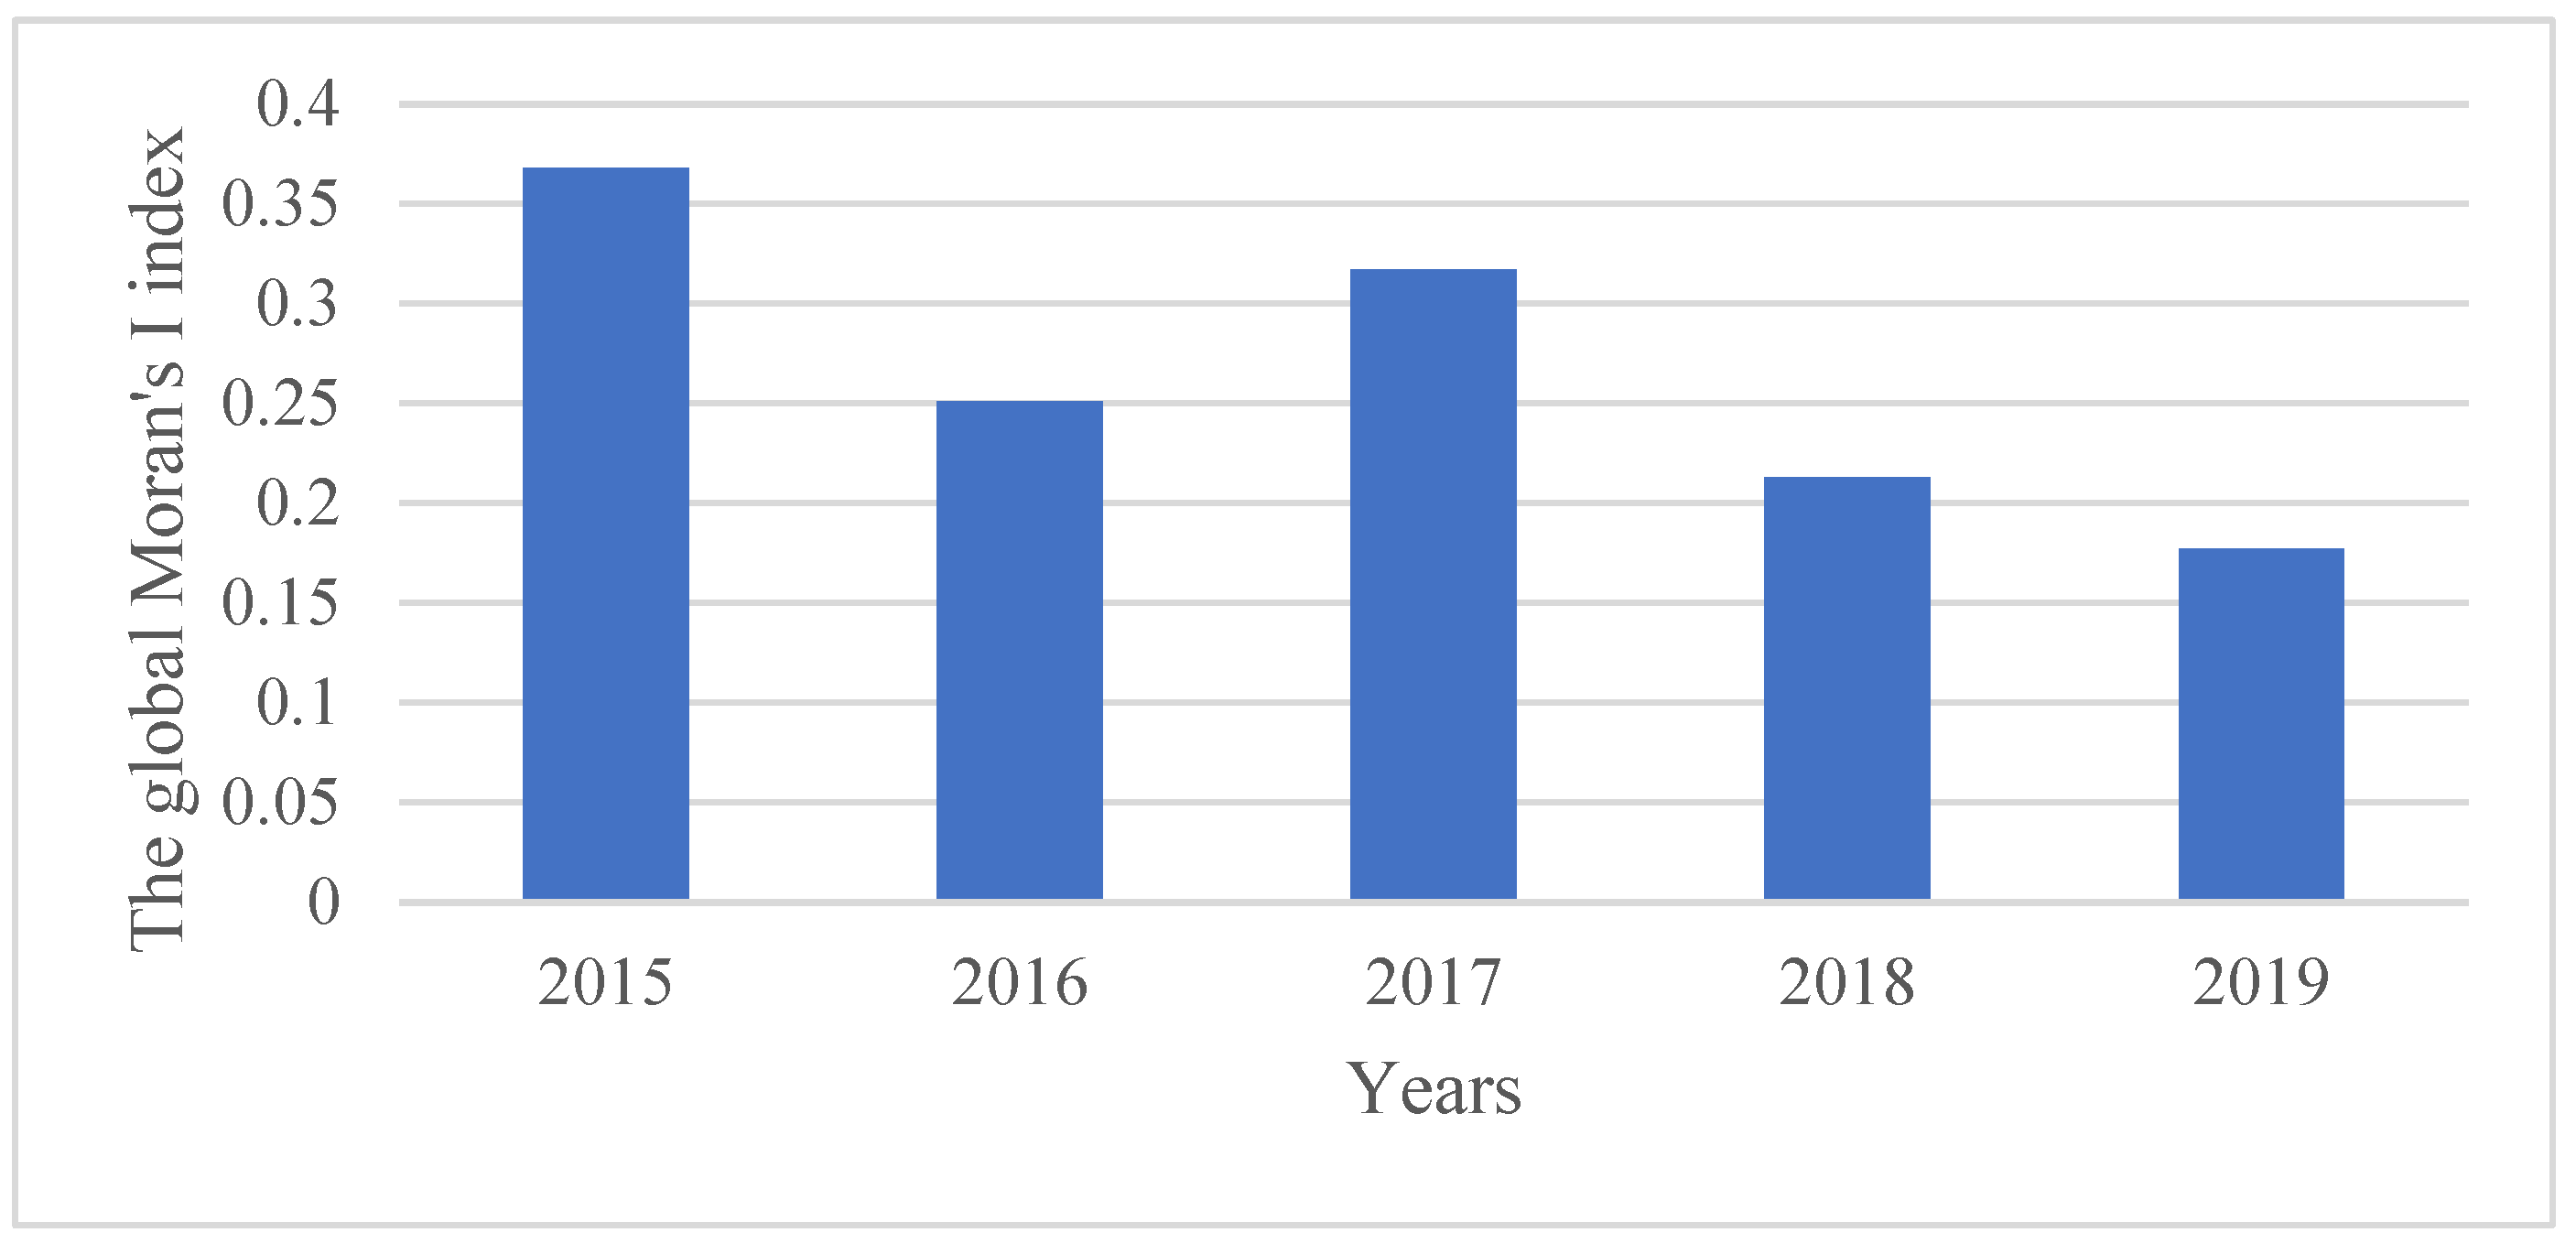
3.3. Spatial Autocorrelation of the CCD between FT and LM

The global Moran’s I index estimates of the CCD of FT and LM in China from 2015 to 2019 were all positive, demonstrating an overall positive spatial correlation. The significance test was passed by all Moran’s I indexes during the study period, and a highly significant correlation was observed between 2015 and 2019 in Moran’s I indexes. Some years’ low global Moran’s I indexes suggested that there was little clustering and no obvious spatial autocorrelation feature. Among them, the maximum value of 0.3678 was reached in 2015, followed by a cyclic development trend of decreasing firstly and then increasing and decreasing, which reached the minimum value of 0.1773 in 2019. Therefore, the CCD of FT and LM in China shows a development trend of agglomeration–dispersion over time (Figure 5).
Most provinces are located in H-H and L-L agglomeration areas, indicating that both provinces with higher coupling coordination of FT and LM and those with lower coupling coordination have emerged as agglomeration effects and showed a tablet distribution in space. Specifically, from 2015 to 2019, the number of H-H agglomeration areas increased from 8 to 11, and the proportion increased from 26.67% to 36.67%, with this type of area with the greatest proportion. The increase in the number of H-H agglomeration areas indicates that the development level of both FT and LM in China has entered a high level, and it has basically formed a benign coordination situation with mutual promotion (Table 4). In terms of spatial distribution, it gradually expands in scope, with the development trend from relatively scattered to concentrated, and the distribution range is concentrated in the central-eastern region. In general, the strong–strong clustering type is primarily distributed in the east-central region, and the weak–weak clustering type is primarily distributed in the western region. The spatial coordination of FT and LM in China has significant clustering characteristics and tends to be stable. The distribution and number of clustering types change slightly with time, but generally remain stable.

3.4. Driving Factors of CCD between FT and LM

FT and LM have formed a complex coupled resource–population–economy system through interaction, and the coupled and coordinated development between them is the result of multiple factors. This study identified the factors of land approval (X1), the level of agricultural equipment (X2), the level of concurrent employment business(X3), the level of non-agricultural industry development (X4), and the level of urbanization (X5) as the main driving factors and carried out research. As shown in Table 5, the drivers that significantly affect FT and LM are, in descending order, the level of concurrent employment business (0.6979) > the level of non-agricultural industry development (0.6501) > the level of urbanization (0.6312) > the level of agricultural equipment (0.6207) > the land approval (0.6187).

4. Discussion

4.1. Temporal Evolution Analysis of Integrated Level

From a temporal perspective, the evolution trend of FT and LM in China from 2015 to 2019 is not obvious due to the influence of agricultural production conditions, the development of non-agricultural industries, and new urbanization, and its evolution trend is relatively stable. From the spatial perspective, in order to clarify rural land contracting relationships, clarify rural land property rights, solve the problems of inaccurate arable land area and the unclear four boundaries operated by peasant households under contract, guide the orderly transfer of rights to manage rural land, and realize large-scale agricultural operations, China has carried out the registration and certification of land contracting rights and the rural land system reform of “separating rural land ownership rights, contract rights, and management rights”, which has increased the enthusiasm of rural labor forces to participate in the transfer of farmland, guided them to complete the transfer of farmland in an orderly manner, concentrated the land in individuals or organizations such as large planters and new agricultural business entities, promoted the moderate scale operation of agriculture and the rational allocation of land resources, and significantly improved the level of FT. The provinces with relatively high LM evaluation index are concentrated in the eastern region, which is due to the higher level of new urbanization and development of non-agricultural industries in the eastern region, which has a certain radiation and driving effect, and is conducive to improving the absorption capacity of cities and towns for rural labor forces and providing sufficient jobs for them. At the same time, the transfer of farmland can promote occupational differentiation within society and division of labor within families, promote the transfer of rural labor forces to cities and non-agricultural industries, realize the flow and reorganization of labor factors, and improve the level of LM. The difference between the overall evaluation levels of FT and LM in provinces is significant, which is due to the unbalanced development levels of the two subsystems in most provinces, and the lower level of FT in areas with a higher level of LM and vice versa, which directly affects the overall evaluation index level of the whole system.

4.2. Spatio-Temporal Evolution Analysis of Coupling Coordination

At the regional level, as a region with a higher economic levels and social development and better agricultural production conditions in China, the eastern region ought to have a higher CCD of FT and LM than other regions; however, it has a lower coupling coordination level that in the central region, which is due to the expansion of demand for land from new urbanization and non-agricultural industry development, so that it has caused some farmland in the eastern region to be converted to non-agricultural use, which directly affects farmland transfer and leads to a small decline in its coupling coordination level. The rate of LM in the central region has increased significantly, and the conditions of agricultural production and operation have improved. The geographical environment conditions are better, which makes the level of FT and LM increase significantly, thus making its coupling coordination level higher than other regions. As the main grain producing area in China, the northeast region has superior land resource endowment conditions, high level of agricultural mechanization and large-scale operation, and should have a higher level of FT, but the level of FT varies significantly within the region. Agriculture still occupies an important position in the region, and the level of LM is relatively lagging behind, so that the CCD of FT and LM in the northeast region is lower than that in the central and eastern regions. Compared with other regions, the western region has relatively backward agricultural production conditions, urbanization level, and non-agricultural industry development level, and the level of FT and LM are not dominant, so its coupling coordination level is lower than other regions. From the perspective of provinces, the provinces with relatively high level of coupling coordination between FT and LM are mainly located in the east and central regions. The reason is that the level of FT and LM in these provinces is at a higher level, which directly affects the other subsystem and enables it to enjoy certain advantages in the coupling coordination development of FT and LM, so it shows a higher degree of coupling coordination. For Shanghai and Jiangsu, the rapid development of economy and society, new urbanization, and non-agricultural industries can provide a large number of employment opportunities, absorb a large number of migrated labor forces, and fully meet the requirements of rural labor force for concurrent employment or non-agricultural employment. While Heilongjiang has comparative advantages in land resource endowment, excellent level of agricultural equipment, high efficiency of agricultural labor production, and better development of farmland transfer market. The level of FT is higher than that of other regions. The provinces with relatively low level of coupling coordination are mainly located in the western region, while the other three regions also involve a few provinces. This is due to the low development level of both subsystems in Hainan, Yunnan, and Liaoning provinces, which directly reduces the level of coupling coordination. The agricultural farming conditions in these provinces are relatively backward, and the rural labor force is more dependent on the land. The degree of fragmentation of farmland is high, such as the “land belonging to one production unit but enclosed in that of another” in Hainan Province. The imperfect development of the transfer market makes the level of FT relatively low. The large population and poor comprehensive quality of the rural labor force in the western region, the outstanding structural contradictions in transferring employment, and the level of development of local non-agricultural industries cannot meet the willingness to transfer locally, which seriously hinders the development of LM.

4.3. Spatial Autocorrelation Analysis

The CCD of FT and LM in China shows agglomeration effects with high and low values, respectively. On the one hand, because the level of urbanization and non-agricultural industry development in the eastern region is better than other regions, which can provide sufficient employment opportunities for LM, the higher level of LM will directly affect the development of FT, which is manifested by the higher CCD of these provinces; thus, the phenomenon of agglomeration in high-value areas has emerged. On the other hand, the agricultural production conditions, urbanization level, and development level of non-agricultural industries in western provinces are relatively backward, so the development level of FT and LM are both low and have not yet achieved coordinated development, resulting in a low degree of coupling coordination between them, thus showing a significant low-value area agglomeration phenomenon.

4.4. Analysis of Driving Factors

(1) The level of concurrent employment business has the greatest influence on the CCD of FT and LM, primarily because of the rise in agricultural production efficiency and the level of agricultural mechanization and because the demand for labor factors in agricultural production and operation activities continues to decrease, from which a significant amount of unneeded labor is released. Under the combined influence of various aspects, such as the heterogeneity of resource endowment of farm households, the comparative income gap between agriculture and non-farm industries, the nature of agricultural production’s seasonality, and the traditional concept of farm households, a large number of concurrent employment farm households have emerged and gradually become the common production status of farm households. However, concurrent employment farmers still have a certain degree of attachment to the land, and the transfer of farmland does not always occur in this production state, which makes the efficiency of farmland transfer not optimal, and the LM under the concurrent employment operation has obvious “migratory bird” characteristics, which directly affects the coupling coordination development of FT and LM.
(2) The level of non-agricultural industry development has the second highest impact on coordination degree of FT and LM. This is due to the significant pull effect of non-agricultural industries on LM; the higher level may help the economic growth of the province and create more jobs for rural surplus labor. The more non-agricultural employment opportunities, the more likely rural laborers will break away from agricultural production to engage in non-agricultural employment. Meanwhile, as rational economic people, income level is the key factor for rural laborers to measure whether to transfer employment. When the level of non-farm income is higher than the income from agricultural operation, laborers will choose to shift to non-farm industries and generate the willingness to shift to self-contracted land management.
(3) The impact of the level of urbanization on coordination degree is in the third place. For rural laborers, the expansion of new urbanization offers numerous employment opportunities, which is conducive to increasing the transfer income of laborers, ensuring their long-term and stable transfer, and increasing the rate of transfer of rural laborers. Meanwhile, in order to meet the increasingly diversified demands of urban residents for agricultural products, the state has introduced corresponding “strong and favorable agricultural” policies to encourage the development of new agricultural business entities and orderly guide capital to the countryside, which has gradually strengthened the demand for land in order to realize large-scale, specialized, and scientific agricultural production and operation, and stimulated the farmland transfer market. It has accelerated the orderly transfer of farmland.
(4) The level of agricultural equipment affects the development of coupling coordination in fourth place. Agricultural machinery can replace some labor factors, reduce labor factor inputs in agricultural production and operation activities, improve agricultural production efficiency, release more surplus agricultural labor, promote occupational differentiation within rural society and division of labor within households, improve the transfer market’s supply–demand relationship, realize stable and efficient farmland transfer, increase the willingness of rural labor to transfer employment, and improve the level of FT and LM.
(5) The influence of the land approval on coupling coordination development is in the fifth position. On the one hand, it is conducive to solving the problem of ambiguous property rights of farmland, urging farmers to participate actively in FT, improving the probability and level of FT, and releasing the bundle of fragmented farmland operation and inefficient agricultural production labor. On the other hand, land approval can enhance the strength of farmland property rights, enhance land rights and interest protection during LM, reduce the cost of LM, make the migrated labor not worry about the risk of land loss, encourage the employment of LM, and improve the long-term and stability of transfer employment.

4.5. Limitations and Future Work

This paper investigated the coordination, spatio-temporal evolution, and driving factors of the coupling between FT and LM in China’s provinces. The results of this study are significant for implementing the rural revitalization strategy, realizing the modernization of agriculture and rural areas, and promoting the development of urban–rural integration, but there is room for further in-depth research. On the one hand, this study took China’s provinces as the geographical unit and conducted in-depth analysis on the coordination, spatio-temporal evolution characteristics and driving factors of the coordination degree of FT and LM. It will be of great practical guidance if long-term provincial panel data or county-level data are used to conduct the study. On the other hand, as farmers are the main decision makers of FT and LM, it is necessary to analyze the coordination degree of FT and LM by using the data of farmers’ survey in the future to further clarify the influence of farmers’ behavior and willingness on the coupling coordination between them.

5. Conclusions

This study measured the coordinated development between FT and LM in 30 provinces in China from 2015 to 2020 and used the ESDA method and GRA model to study the spatial difference characteristics of coordination degree and analyze the driving factors of coupling coordination development. The following are the main findings of the study: (1) From 2015 to 2019, the level of the evaluation index of LM in China was relatively high. The rising trend of the level of FT was more obvious, and their level of comprehensive evaluation continued to rise. The regional differences were obvious, with the central region being higher than the eastern and northeastern regions and the western region being the lowest. (2) From 2015 to 2019, the coordination degree of FT and LM in China showed a fluctuating upward trend and was at the primary coupling coordination stage, among which the difference in the coordination degree of FT and LM between regions was large, showing a distribution pattern of central region > eastern region > northeast region > western region. (3) The coordination degree of FT and LM in China has a significant global positive spatial correlation and exhibits a clear development trend of agglomeration dispersion over time with obvious fluctuations. Local spatial agglomeration appears and tends to be stable, and strong agglomeration types are concentrated in the eastern and central regions, while weak agglomeration types are concentrated in the western region. (4) The driving factors of the CCD of FT and LM are, in descending order, the level of concurrent employment business, the level of non-agricultural industry development, the level of urbanization, the level of agricultural equipment, and the land approval. There are significant differences in the main driving factors in different provinces.

Author Contributions

Conceptualization, Y.W., G.L., B.Z., X.L., and Z.L.; methodology, Y.W., software, Y.W.; formal analysis, Y.W. and X.L.; investigation, Y.W.; data curation, Y.W. and Z.L.; writing—original draft preparation, Y.W., G.L., and B.Z.; writing—review and editing, Y.W., G.L., and B.Z.; visualization, Y.W. All authors have read and agreed to the published version of the manuscript.

Funding

This research was funded by the National Natural Science Foundation of China (grant number 71764029), the Social Science Foundation Project of Xinjiang Uygur Autonomous Region in China (grant number 21BGL099), Decision-making research and consulting project of the expert advisory group of Xinjiang Uygur Autonomous Region in China (grant number Jz202120).

Data Availability Statement

The data used to support the findings of this study are available from the first author upon request.

Conflicts of Interest

The authors declare no conflict of interest.

References

  1. Benjamin, D. Household Composition, Labor Markets, and Labor Demand: Testing for Separation in Agricultural Household Models. Econometrica 1992, 60, 287. [Google Scholar] [CrossRef]
  2. Scoones, I. Sustainable Rural Livelihoods: A Framework for Analysis; IDS Working Paper 72; IDS: Brighton, UK, 1998. [Google Scholar]
  3. Carter, M.R.; Yao, Y. Local versus Global Separability in Agricultural Household Models: The Factor Price Equalization Effect of Land Transfer Rights. Am. J. Agric. Econ. 2002, 84, 702–715. [Google Scholar] [CrossRef]
  4. Yao, Y. The Development of the Land Lease Market in Rural China. Land Econ. 2000, 76, 252–266. [Google Scholar] [CrossRef]
  5. Liu, G.; Wang, H.; Cheng, Y.; Zheng, B.; Lu, Z. The impact of rural out-migration on arable land use intensity: Evidence from mountain areas in Guangdong, China. Land Use Policy 2016, 59, 569–579. [Google Scholar] [CrossRef]
  6. Cai, M. Land for welfare in China. Land Use Policy 2016, 55, 1–12. [Google Scholar] [CrossRef] [Green Version]
  7. Kawasaki, K. The cost of and benefits of land fragmentation of rice farms in Japan. Aust. J. Agric. Resour. Econ. 2010, 54, 509–526. [Google Scholar] [CrossRef] [Green Version]
  8. Liu, Y.; Yan, B.J.; Wang, Y.; Zhou, Y.H. Will land transfer always increase technical efficiency in China?—A land cost perspective. Land Use Policy 2019, 82, 414–421. [Google Scholar] [CrossRef]
  9. Xie, Y.; Jiang, Q.B. Land arrangements for rural-urban migrant workers in China: Findings from Jiangsu Province. Land Use Policy 2016, 50, 262–267. [Google Scholar] [CrossRef]
  10. Bhandari, P. Relative Deprivation and Migration in an Agricultural Setting of Nepal. Popul. Environ. 2003, 25, 475–499. [Google Scholar] [CrossRef]
  11. VanWey, L.K. Land Ownership as a Determinant of International and Internal Migration in Mexico and Internal Migration in Thailand. Int. Migr. Rev. 2006, 39, 141–172. [Google Scholar] [CrossRef]
  12. Mendola, M. Migration and technological change in rural households: Complements or substitutes? J. Dev. Econ. 2008, 85, 150–175. [Google Scholar] [CrossRef] [Green Version]
  13. Manjunatha, A.V.; Anik, A.R.; Speelman, S.; Nuppenau, E.A. Impact of land fragmentation, farm size, land ownership and crop diversity on profit and efficiency of irrigated farms in India. Land Use Policy 2013, 31, 397–405. [Google Scholar] [CrossRef]
  14. Ortiz-Becerra, K. Land Consolidation and Rural Labor Markets: Theory and Evidence from Colombia. Ph.D. Thesis, University of California Davis, Davis, CA, USA, 2021. [Google Scholar]
  15. Jin, S.; Jayne, T.S. Land Rental Markets in Kenya: Implications for Efficiency, Equity, Household Income and Poverty. Land Econ. 2013, 89, 246–271. [Google Scholar] [CrossRef]
  16. Chamberlin, J.; Ricker-Gilbert, J. Participation in Rural Land Rental Markets in Sub-Saharan Africa: Who Benefits and by How Much? Evidence from Malawi and Zambia. Am. J. Agric. Econ. 2016, 98, 1507–1528. [Google Scholar] [CrossRef] [Green Version]
  17. Bardhan, P.; Luca, M.; Mookherjee, D.; Pino, F. Evolution of land distribution in West Bergal 1967–2004: Role of land reform and demographic changes. J. Dev. Econ. 2014, 110, 171–190. [Google Scholar] [CrossRef]
  18. Peng, K.; Yang, C.; Chen, Y. Land transfer in rural China: Incentives, influencing factors and income effects. Appl. Econ. 2020, 52, 5477–5490. [Google Scholar] [CrossRef]
  19. Wang, Z.; Yang, M.; Zhang, Z.; Li, Y.; Wen, C. The Impact of Land Transfer on Vulnerability as Expected Poverty in the Perspective of Farm Household Heterogeneity: An Empirical Study Based on 4608 Farm Households in China. Land 2022, 11, 1995. [Google Scholar] [CrossRef]
  20. Xie, D.; Bai, C.; Yan, H.; Song, W. Legal land transfer rights, labor migration and urban–rural income disparity: Evidence from the implementation of China’s Rural Land Contracting Law in 2003. Growth Chang. 2022, 53, 1457–1482. [Google Scholar] [CrossRef]
  21. Teklu, T.; Lemi, A. Factors affecting entry and intensity in informal rental land markets in Southern Ethiopian highlands. Agric. Econ. 2004, 30, 117–128. [Google Scholar] [CrossRef]
  22. Hajjar, R.; Ayana, A.N.; Rutt, R.; Hinde, O.; Liao, C.; Keene, S.; Bandiaky-Badji, S. Capital, labor, and gender: The consequences of large-scale land transactions on household labor allocation. J. Peasant Stud. 2019, 47, 566–588. [Google Scholar] [CrossRef]
  23. De Brauw, A.; Mueller, V. Do Limitations in Land Rights Transferability Influence Mobility Rates in Ethiopia? J. Afr. Econ. 2012, 21, 548–579. [Google Scholar] [CrossRef]
  24. Lu, C.; Wu, A. The impact of migration characteristics on rural migrant households’ farmland use arrangements in China. PLoS ONE 2022, 17, e0273624. [Google Scholar] [CrossRef]
  25. Wineman, A.; Liverpool-Tasie, L.S. Land markets and migration trends in Tanzania: A qualitative-quantitative analysis. Dev. Policy Rev. 2018, 36, O831–O856. [Google Scholar] [CrossRef]
  26. Mullan, K.; Grosjean, P.; Kontoleon, A. Land Tenure Arrangements and Rural–Urban Migration in China. World Dev. 2011, 39, 123–133. [Google Scholar] [CrossRef]
  27. Ntihinyurwa, P.D.; de Vries, W.T. Farmland fragmentation and defragmentation nexus: Scoping the causes, impacts, and the conditions determining its management decisions. Ecol. Indic. 2020, 119, 106828. [Google Scholar] [CrossRef]
  28. Jin, S.; Deininger, K. Land rental markets in the process of rural structural transformation: Productivity and equity impacts from China. J. Comp. Econ. 2009, 37, 629–646. [Google Scholar] [CrossRef] [Green Version]
  29. Brandt, L.; Huang, J.; Li, G.; Rozelle, S. Land Rights in Rural China: Facts, Fictions and Issues. China J. 2002, 47, 67–97. [Google Scholar] [CrossRef]
  30. Kung, J.K. Off-Farm Labor Markets and the Emergence of Land Rental Market in Rural China. J. Comp. Econ. 2002, 30, 395–414. [Google Scholar] [CrossRef]
  31. Xu, C.; Wang, Q.; Fahad, S.; Kagatsume, M.; Yu, J. Impact of Off-Farm Employment on Farmland Transfer: Insight on the Mediating Role of Agricultural Production Service Outsourcing. Agriculture 2022, 12, 1617. [Google Scholar] [CrossRef]
  32. Zhao, G.; Chen, Z.; Wang, F. Influence factors of farmland scale management in CHINA from the perspective of land circulation. Transform. Bus. Econ. 2021, 20, 151–176. [Google Scholar]
  33. Xu, D.D.; Cao, S.; Wang, X.X.; Liu, S.Q. Influences of labor migration on rural household land transfer: A case study of Sichuan Province, China. J. Mt. Sci. 2018, 15, 2055–2067. [Google Scholar] [CrossRef]
  34. Gartaula, H.N.; Chaudhary, P.; Khadka, K. Land Redistribution and Reutilization in the Context of Migration in Rural Nepal. Land 2014, 3, 541–556. [Google Scholar] [CrossRef] [Green Version]
  35. Gao, J.; Song, G.; Sun, X.Q. Does labor migration affect rural land transfer? Evidence from China. Land Use Policy 2020, 99, 105096. [Google Scholar] [CrossRef]
  36. Azadi, H.; Hasfiati, H.L. Agricultural Land Conversion Drivers: A Comparison Between Less Developed, Developing and Developed Countries. Land Degrad. Dev. 2011, 22, 596–604. [Google Scholar] [CrossRef]
  37. Zhang, M.; Tan, S.; Zhang, X. How do varying socio-economic factors affect the scale of land transfer? Evidence from 287 cities in China. Environ. Sci. Pollut. Res. 2022, 29, 40865–40877. [Google Scholar] [CrossRef] [PubMed]
  38. Zhang, Y.; Li, X.B.; Song, W. Determinants of cropland abandonment at the parcel, household and village levels in mountain areas of china: A multi-level analysis. Land Use Policy 2014, 41, 186–192. [Google Scholar] [CrossRef]
  39. Shao, J.; Zhang, S.; Li, X. Effectiveness of farmland transfer in alleviating farmland abandonment in mountain regions. J. Geogr. Sci. 2016, 26, 203–218. [Google Scholar] [CrossRef]
  40. Lu, H.; Xie, H.; Yao, G. Impact of land fragmentation on marginal productivity of agricultural labor and non-agricultural labor supply: A case study of Jiangsu, China. Habitat Int. 2019, 83, 65–72. [Google Scholar] [CrossRef]
  41. Li, S.; Li, X.; Sun, L.; Cao, G.; Fischer, G.; Tramberend, S. An estimation of the extent of cropland abandonment in mountainous regions of China. Land Degrad. Dev. 2018, 29, 1327–1342. [Google Scholar] [CrossRef]
  42. Huy, H.T.; Lyne, M.; Ratna, N.; Nuthall, P. Drivers of transaction costs affecting participation in the rental market for cropland in Vietnam. Aust. J. Agric. Resour. Econ. 2016, 60, 476–492. [Google Scholar] [CrossRef]
  43. Wang, Y.; Yang, Q.; Xin, L.; Zhang, J. Does the New Rural Pension System promote farmland transfer in the context of aging in rural China: Evidence from the CHARLS. Int. J. Environ. Res. Public Health 2019, 16, 3592. [Google Scholar] [CrossRef] [PubMed]
  44. Meeks, R. Property rights and water access: Evidence from land titling in rural Peru. World Dev. 2018, 102, 345–357. [Google Scholar] [CrossRef]
  45. Luo, B.L. 40-year reform of farmland institution in China: Target, effort and the future. China Agric. Econ. Rev. 2018, 10, 16–35. [Google Scholar] [CrossRef]
  46. Chernina, E.; Dower, P.C.; Markevich, A. Property rights, land liquidity, and internal migration. J. Dev. Econ. 2014, 110, 191–215. [Google Scholar] [CrossRef]
  47. De Janvry, A.; Emerick, K.; Gonzalez-Navarro, M.; Sadoulet, E. Delinking land rights from land use: Certification and migration in Mexico. Am. Econ. Rev. 2015, 105, 3125–3149. [Google Scholar] [CrossRef] [Green Version]
  48. Wang, Y.J.; Liu, G.Y.; Liu, X.H. Spatiotemporal Coupling and Driving Factors of Farmland Transfer and Labor Transfer Based on Big Data: The Case of Xinjiang, China. Wireless Commun. Mob. Comput. 2022, 2022, 7604448. [Google Scholar] [CrossRef]
  49. Li, W.W.; Yi, P.T. Assessment of city sustainability—Coupling coordinated development among economy, society and environment. J. Clean. Prod. 2020, 256, 120453. [Google Scholar] [CrossRef]
  50. Hu, B.; Xu, A.; Dong, X. Evaluating the Comprehensive Development Level and Coordinated Relationships of Urban Multimodal Transportation: A Case Study of China’s Major Cities. Land 2022, 11, 1949. [Google Scholar] [CrossRef]
  51. Xiao, R.; Yu, X.Y.; Xiang, T.; Zhang, Z.H.; Wang, X.; Wu, J.G. Exploring the coordination between physical space expansion and social space growth of China’s urban agglomerations based on hierarchical analysis. Land Use Policy 2021, 109, 105700. [Google Scholar] [CrossRef]
  52. Anselin, L. Local Indicators of Spatial Association—LISA. Geogr. Anal. 2010, 27, 93–115. [Google Scholar] [CrossRef]
  53. Duan, Y.; Gao, Y.G.; Zhang, Y.; Li, H.; Li, Z.; Zhou, Z.; Tian, G.; Lei, Y. “The 20 July 2021 Major Flood Event” in Greater Zhengzhou, China: A Case Study of Flooding Severity and Landscape Characteristics. Land 2022, 11, 1921. [Google Scholar] [CrossRef]
  54. Zhang, B.; Zhai, B.; Gao, J.; Lian, X. Characteristics and Driving Forces of Symbiosis between Production Land and Living Land in Rural Settlement: Evidence from Shanxi Province, China. Land 2022, 11, 1973. [Google Scholar] [CrossRef]
Figure 1. The rate of farmland transfer (FT) and labor migration (LM) in 2019 in China.
Land 11 02327 g001
Figure 2. Farmland transfer (FT) and labor migration (LM) evaluation index and comprehensive evaluation index in China (2015–2019).
Land 11 02327 g002
Figure 3. Average evaluation index of farmland transfer (FT) and labor migration (LM) and comprehensive evaluation index in China (2015–2019).
Land 11 02327 g003
Figure 4. The development trend of coupling and coordination of farmland transfer (FT) and labor migration (LM) in China (2015–2019).
Land 11 02327 g004
Figure 5. The Global Moran’s I of the coupling and coordination degree (CCD) of farmland transfer (FT) and labor migration (LM) in China.
Land 11 02327 g005
Table 1. Evaluation index system and weight of farmland transfer (FT) and labor migration (LM) in China.
Target layerStandard LayerIndex LayerDescriptionWeight
Farmland Transfer (FT)Farmland conditions and business conditionsFarmers engaged in agricultural operation situationThe annual rate of increase in the number of farmers working in agriculture0.0572
Agricultural planting structure situationThe percentage of food crops planted0.0952
The average arable land areaThe ratio of the total area of household contracted arable land to the total number of rural households0.0946
The level of agricultural scale managementThe percentage of total households comprised of large-scale peasant households0.0988
The level of land approvalThe percentage of all granted land management rights0.0727
The intensity of farmland transferThe rate of FTThe proportion of the area of farmland transfer in the area of farmland contracted by households0.0553
The development level of farmland transferFT area’s annual growth rate0.0523
The participation degree of new business entitiesThe percentage of the area transferred by the new business entities in the total circulation area0.0434
The participation degree of farmersThe percentage of households that have been relocated compared to the total number of households0.0732
External conditionsThe development level of new business entitiesThe rate of increase in the number of brand-new agricultural business entities over time0.0635
The level of agricultural equipmentNumber of mechanical power forces per mu of land0.0830
Rural labor productivityThe ratio of agricultural output value and rural labor force0.0743
Growth in farmers’ disposable incomeThe rate of increase in farmers’ disposable income over time0.0672
The development level of planting industryThe output value of planting industry accounts for the output value of agriculture, forestry, animal husbandry and fishery0.0693
Labor Migration (LM)Rural labor force conditionsThe percentage of agricultural labor forceAgricultural labor force accounts for the percentage of rural labor force0.0942
Average number of labor force per householdThe ratio of the total number of rural labor force to the total number of rural households0.0775
The intensity of labor migrationThe rate of LMThe proportion of labor migration in the rural labor force0.0833
The development level of labor migrationThe annual rate of labor migration growth0.0553
The level of
seasonal labor force transfer
The percentage of seasonal migration in the rural labor force0.0566
The level of
perennial labor force transfer
The percentage of perennial migration in the rural labor force0.0895
The level of
part-time job
The percentage of part-time farmers in the total number of rural households0.0698
The labor migration breadthThe number of migrations from outside the county accounted for the percentage of the rural labor force0.0938
External conditionsIncome ratio between residents of urban and ruralThe ratio of the disposable income of urban residents to that of rural residents0.0821
The ratio of family burdenThe ratio of non-working-age population to working-age population0.0801
Growth in wage incomeWage income growth rate over time0.0521
The development level of non-agricultural industryNon-agricultural industries’ added value made up a portion of the regional GDP0.0812
The rate of urbanizationThe proportion of the urban population in the total population0.0845
Table 2. Classification standards for coupling and coordination degree.
CCDTypeCCDType
0.00–0.09Extreme coupling disorders0.50–0.59Barely coupling coordination
0.10–0.19Severe coupling disorders0.60–0.69Primary coupling coordination
0.20–0.29Moderate coupling disorders0.70–0.79Middle coupling coordination
0.30–0.39Mild coupling disorders0.80–0.89Good coupling coordination
0.40–0.49Near coupling disorders0.90–1.00Quality coupling coordination
Table 3. The mean degree of the coupling and coupled coordination of farmland transfer (FT) and labor migration (LM) in China (2015–2019).
ProvinceCDCCDTypeProvinceCDCCDCD
Beijing0.96640.6578Primary coupling coordinationLiaoning0.99450.5913Barely coupling coordination
Tianjin0.98140.6738Primary coupling coordinationJilin0.99220.6357Primary coupling coordination
Hebei0.98800.6271Primary coupling coordinationHeilongjiang0.97780.7155Middle coupling coordination
Shanghai0.99140.7450Middle coupling coordinationInner Mongolia0.99200.6473Primary coupling coordination
Jiangsu0.98760.7361Middle coupling coordinationGuangxi0.98570.6124Primary coupling coordination
Zhejiang0.98440.6916Primary coupling coordinationChongqing0.96930.7003Middle coupling coordination
Fujian0.95100.6389Primary coupling coordinationSichuan0.98900.6644Primary coupling coordination
Shandong0.99420.6502Primary coupling coordinationGuizhou0.98400.6112Primary coupling coordination
Guangdong0.94200.6455Primary coupling coordinationYunnan0.98320.5793Barely coupling coordination
Hainan0.98390.5411Barely coupling coordinationShaanxi0.99100.6680Primary coupling coordination
Shanxi0.99440.6047Primary coupling coordinationGansu0.99080.6391Primary coupling coordination
Anhui0.99130.7107Middle coupling coordinationQinghai0.97840.6413Primary coupling coordination
Jiangxi0.97530.6633Primary coupling coordinationNingxia0.99670.6623Primary coupling coordination
Henan0.99740.6819Primary coupling coordinationXinjiang0.99480.6419Primary coupling coordination
Hubei0.98940.6795Primary coupling coordinationMean0.98440.6542Primary coupling coordination
Hunan0.99560.6693Primary coupling coordination
Table 4. Spatial correlation changes of the coupling and coordination degree (CCD) of farmland transfer (FT) and labor migration (LM) in China from 2015 to 2019.
YearsH-HL-HL-LH-L
Province%Province%Province%Province%
2015Shanghai, Jiangsu, Zhejiang, Anhui, Henan, Hubei, Gansu, Ningxia (8)26.67Beijing, Fujian, Shandong, Jilin, Shanxi, Jiangxi, Inner Mongolia, Shaanxi, Qinghai (9)30.00Guangdong, Hainan, Liaoning, Guangxi, Sichuan, Guizhou, Yunnan (7)23.33Tianjin, Hebei, Heilongjiang, Hunan, Chongqing, Xinjiang (6)20.00
2016Shanghai, Jiangsu, Zhejiang, Anhui, Hubei, Beijing, Chongqing, Qinghai (8)26.67Gansu, Fujian, Jiangxi, Shandong (4)13.33Guangdong, Hainan, Guangxi, Guizhou, Yunnan, Hebei, Shanxi, Inner Mongolia, Liaoning (9)30.00Tianjin, Jilin, Heilongjiang, Henan, Hunan, Sichuan, Shaanxi, Ningxia, Xinjiang (9)30.00
2017Shanghai, Jiangsu, Zhejiang, Anhui, Jiangxi, Henan, Hubei, Hunan, Chongqing, Shaanxi (10)33.33Fujian, Shandong (2)6.67Hebei, Shanxi, Hainan, Inner Mongolia, Liaoning, Jilin, Guangxi, Guizhou, Yunnan, Gansu, Qinghai, Xinjiang (12)40.00Beijing, Tianjin, Heilongjiang, Guangdong, Sichuan, Ningxia (6)20.00
2018Shanghai, Jiangsu, Zhejiang, Anhui, Jiangxi, Shandong, Henan, Hubei, Hunan, Chongqing, Shaanxi (11)36.67Tianjin, Shanxi, Fujian, Guangdong, Ningxia (5)16.66Hebei, Inner Mongolia, Liaoning, Jilin, Guangxi, Hainan, Guizhou, Yunnan, Gansu, Qinghai, Xinjiang (11)36.67Beijing, Heilongjiang, Sichuan (3)10.00
2019Shanghai, Jiangsu, Zhejiang, Anhui, Jiangxi, Henan, Hubei, Hunan, Chongqing, Shaanxi, Ningxia (11)36.67Shanxi, Jilin, Fujian, Shandong (4)13.33Beijing, Hebei, Liaoning, Guangxi, Sichuan, Guizhou, Hainan, Yunnan, Gansu, Qinghai, Xinjiang (11)36.67Tianjin, Inner Mongolia, Heilongjiang, Guangdong (4)13.33
Table 5. Correlation degree between coupled and coordinated driving factors of farmland transfer (FT) and labor migration (LM) in China.
RegionX1X2X3X4X5
Eastern RegionBeijing0.51440.61700.65380.60730.5907
Tianjin0.60130.67840.57960.56730.5135
Hebei0.59680.69670.65010.62180.6206
Shanghai0.61180.60570.85500.70670.6402
Jiangsu0.67130.74150.76860.58900.7343
Zhejiang0.62500.68260.75050.68980.6026
Fujian0.56770.59680.58270.76720.7442
Shandong0.60850.65900.87350.61720.6458
Guangdong0.67520.69330.35350.50030.5618
Hainan0.77690.65530.63070.52640.5659
Central RegionShanxi0.74560.63100.75950.58140.5668
Anhui0.57610.51280.63390.66740.6446
Jiangxi0.57780.51650.69350.71080.6567
Henan0.78030.70080.66210.74070.6542
Hubei0.57290.61760.78950.62850.5943
Hunan0.73970.59040.79590.73470.7498
Northeast RegionLiaoning0.54100.50970.84500.66970.6295
Jilin0.57850.60470.74190.74860.6563
Heilongjiang0.76140.47890.81380.72900.6821
Western RegionInner Mongolia0.62710.54360.51510.66200.8374
Guangxi0.71800.72480.71150.55120.4367
Chongqing0.41360.64140.79150.78240.6212
Sichuan0.38360.61160.70000.58620.5901
Guizhou0.57610.54060.64780.70280.6149
Yunnan0.64860.48860.72780.66360.6905
Shaanxi0.76150.53180.77590.81550.6522
Gansu0.62090.72690.70720.58980.5965
Qinghai0.57150.66530.59390.67130.6428
Ningxia0.56510.75010.65080.50700.5835
Xinjiang0.55210.60910.68340.56770.6163
Mean0.61870.62070.69790.65010.6312
Publisher’s Note: MDPI stays neutral with regard to jurisdictional claims in published maps and institutional affiliations.

