Article

The Relationship between Habitat Diversity and Tourists’ Visual Preference in Urban Wetland Park

1
School of Architecture, Harbin Institute of Technology, Harbin 150006, China
2
Key Laboratory of Cold Region Urban and Rural Human Settlement Environment Science and Technology, Ministry of Industry and Information Technology, Harbin 150006, China
*
Author to whom correspondence should be addressed.
Land 2022, 11(12), 2284; https://doi.org/10.3390/land11122284
Submission received: 21 November 2022 / Accepted: 8 December 2022 / Published: 13 December 2022
(This article belongs to the Special Issue Landscape Governance in the Age of Social Media)

Abstract

:
The increasing number of visitors to wetland parks has caused varying degrees of impact on wetland life. How to reduce the damage to wetland biodiversity caused by recreational activities in parks, improve tourists’ recreational experience, and balance the relationship between the two are urgent problems that need to be solved. Therefore, four urban wetland parks were selected as subjects for this study. The present study utilized social media data to study the diversity of urban wetland habitats and tourists’ wetland landscape preferences from the spatial dimension and explore the relationship between the two. This is a practice different from the traditional ecological research (survey, measurement, monitoring, questionnaire survey) of wetland habitat diversity assessment. The research revealed the following findings: (1) There was a significant positive correlation between habitat saturation and positive artificial elements, such as landscape structures and aerial walkways; (2) Landscape complexity is negatively correlated with landscape instantaneity and wilderness degree; (3) Habitat diversity was negatively correlated with landscape instantaneity but positively correlated with naturalness and positive artificial elements. This study proposes wetland habitat construction as a strategy to optimize the management of habitat diversity in urban wetland parks and enhance its ecological education function.

1. Introduction

Urban wetland is a valuable natural resource in the city. However, the rapidly expanding city has produced a lot of human interference and pressure. In order to solve the problem of urban development and environmental destruction, people built urban wetland parks [1]. Its construction goal is not always to provide ecological services but also to undertake cultural and recreational functions. It is an integrated constructed wetland (ICW) combined with human activities [2]. Nowadays, urban wetland degrades rapidly, which is mainly caused by various human activities, such as recreational construction, urban noise, and uncivilized behavior of tourists [3]. When the loss of urban wetlands reaches a certain level, the watershed cannot provide effective water quality protection, flood retention and storage, and wildlife habitat [4]. However, with the improvement of people’s leisure awareness and the diversification of leisure needs, the frequency of urban wetland park visits has been greatly increased. Running, fishing, taking a walk, and viewing wetland scenery are the daily activities of residents here. Therefore, urban wetland parks, as a part of the overall urban planning, have the most acute contradiction between the protection of wetland resources and the construction of the park [5]. How to balance the habitat diversity protection and recreation construction of wetland parks and combine the functions of wetland ecosystems with landscape recreation activities are important issues to improve the natural eco-efficiency of wetlands and the value of urban social functions.
Recreation development and natural resources protection have always been the focus of attention in related disciplines, and the theoretical applications of this research are ROS [6], LAC [7], VERP [8], and other recreation development theories. Most of the application fields are forest parks [9] and nature reserves [10], but there are few applications in the research of urban wetland parks. Human beings are born with the desire to be close to nature, a large number of studies in environmental psychology have proved that the environment with natural elements has a positive effect on the recovery of human health [11,12,13].
In the early stage, wetland research was focused on its biodiversity and ecological service functions. Biological data and abiotic data of wetland parks are widely used as two kinds of index systems to assess the level of biodiversity. In the study of biological data indicators, the community structure of macroinvertebrates [14], birds and amphibians [15], microbial flora [16], vascular plant community [17], and vole [18] can be used as the indicator species of biodiversity in the selected habitat unit of this organism. However, it is not clear whether it can represent the level of the whole wetland park, because the interpretation percentage is about 20%, which has a certain bias [19]. The assessment of abiotic data is mainly conducted through the sampling of environmental factors, such as hydrology [20] and soil [21], in the wetland park. However, the sampling is complicated and requires professional operation and evaluation. Then, some ecologists turned their attention to the study of habitats. A habitat is the sum of ecological factors that act on organisms in a particular area, and it is one or more spatial units of different scales and sizes. Compared with the singleness of the former research index, all biological and abiotic factors within the habitat diversity assessment are included for comprehensive consideration. In this way, the results obtained have higher explanatory power and are more suitable to be used as a substitute index to measure wetland biodiversity [22,23]. The establishment of a landscape structure index system, such as area, perimeter, edge complexity, and connectivity of habitat units, makes up for the deficiency of habitat space [24,25,26]. In recent years, the visualization of habitat units has been achieved with the aid of computer software [27,28,29]. Spatial data that can be easily measured and recorded enhances the operability of wetland habitat diversity assessment. However, the research focus is still on the ecological attributes of wetland parks, ignoring that it is also disturbed by human recreation as a park. Conservation is not isolation. Now humans are gradually becoming participants in the wetland ecological process. If the protection strategy of a wetland park is proposed simply from the perspective of ecology while its recreational function as a park is ignored, this is the result of a serious disconnection between experimental design, management, and evaluation.
Tourists’ landscape preference was found to be closely related to nature at the early stage of the study [30]. Human beings perceive the natural environment through their brain consciousness, thus generating landscape “element” preference and “spatial structure” preference [31]. People prefer quantitative and measurable physical elements, such as water [32] and plants [33], etc., while in their preferred spatial environment, they prefer different habitats, such as wetlands with water surface [34], open lawns [35], and wetland tree communities [36]. In addition, human beings can perceive biodiversity, which has nothing to do with tourists’ personal attributes, such as age, occupation, and gender, but has something to do with perception intensity and preference [37,38,39,40]. The wetland park is favored by tourists because of its unique biodiversity, complexity, and naturalness [35]. Based on the close connection between green space and human preference cognition, as well as the increasingly fierce conflict between “recreation construction” and “resource conservation”, relevant scholars try to study biodiversity and tourists’ landscape preference from the following three aspects: (1) Biodiversity can promote the ecological health of green space around cities [41,42]. (2) The level of biodiversity will also affect human aesthetic preferences. For example, Matthies studied people’s perception of species diversity through experiments combined with practical studies [43,44]. (3) The relationship between species richness and happiness. Jung et al. found through experiments that people have a positive evaluation of plant planting with rich species [45,46]. However, other studies have shown that the relationship between biodiversity and recreation services is not always positive. For visitors, aesthetics and naturalness are the most important attributes of urban parks, while the attraction of plants and animals is secondary [47,48].
The rise of social media data provides a more comprehensive approach combining subjective and objective factors to the uncertainty of the relationship between the two and brings new ideas to solve the contradiction between biodiversity conservation and recreation construction. Big data, such as comments [49] and geographical location information [50] released by a large number of tourists on social media platforms, are increasingly widely used as the scientific basis for in-depth research on landscape preferences. Compared with traditional data, in the era occupied by social networks, big data is more representative and spontaneous. In particular, the framing form and shooting content of tourists’ photos can reflect the interaction between humans and nature in the dimensions of time and space [51]. As the research basis of landscape preference research, photographs are now widely used in the research of the “Objective-element” paradigm and “subject-perception” paradigm [52]. In the study of objective paradigm, comments on social media are quantified, reflecting that the biophysical features of the landscape are transformed into quantifiable parameters, such as type, diversity, line of elements, area proportion, etc., which constitute the parameter indicators for landscape preference evaluation [53,54,55]. The subjective paradigm takes the traditional Kaplan preference matrix as the core theory [56] and reflects the human perception of landscape in combination with comments and questionnaires on social media, such as naturalness, complexity, and coherence [57,58]. The preference research based on photo analysis combines the practice of environmental psychology and green space, which provides a certain reference value for enriching the human space experience and developing the potential of natural recreation space. Therefore, using social media data to study the public’s preference for wetland landscapes can promote the development of a good “biodiversity perception” experience, thereby better predicting the acceptance of biodiversity management measures, and realize the construction of a “conservation-development-education” urban wetland park. Visitors’ awareness of wetland biodiversity will enhance their awareness and behavior of nature conservation. However, there is a certain disconnection between habitat protection and recreation space organization in wetland parks, which requires landscape architects to make full use of environmental factors, such as water, sunlight, and heat, that affect the growth of plants when designing recreation space in wetland, so as to create a spatial organization that shows the inner organisms.
Based on the literature review, we found that the quantitative research scale of habitat diversity was mainly concentrated in cities, nature reserves, and so on. Habitat studies on park site scale tend to focus on ecological matrix and plant species but lack overall research on green space design scale related to the ecological environment. Research on the relationship between landscape preference and habitat diversity currently focuses on the correlation of single factors, such as trees and water bodies in wetlands, while other factors affecting wetland biodiversity, such as roads and structures in parks, have not been systematically considered. Research on the relationship between landscape preference and habitat diversity currently focuses on the correlation of single factors, such as trees and water, in wetlands, while other factors affecting wetland biodiversity, such as roads and structures in parks, have not been systematically taken into account. Under the social background of big data, scholars have explored related aspects, such as recreation and tourism, from different dimensions. However, in terms of biodiversity, the involvement of pictures and location information data of social media big data has broadened the research on the spatial coupling relationship between landscape construction and resource conservation. Therefore, this study takes the urban wetland parks as the research object and studies the following objectives based on practical cases:
(1)
Explore the real landscape preferences of tourists in urban wetland parks and enrich the research content related to biodiversity and tourists’ preferences in urban wetland parks.
(2)
Through the calculation and drawing of spatial data of an urban wetland park habitat diversity map, combined with the geographical information location of photos, explore the tourists’ preferred habitat spatial pattern to provide park managers and designers with scientific and effective management and design suggestions.
(3)
Deeply explore the influence mechanism of landscape preference and wetland habitat diversity, try to change relevant biological factors, intervene in the biodiversity protection of urban wetland parks, and achieve the unity of conservation and development objectives so that urban wetland parks can play an important ecological role while performing recreational sightseeing and science popularization and education functions. We also seek to provide a reasonable reference for the later management of wetland park habitat protection. This is extremely important for landscape architects and urban park managers. A convenient and quick assessment method can provide developers with scientific and effective site information, allow landscape architects to participate in the protection of urban biodiversity, enhance the cultural and entertainment value of wetland parks, and achieve a relative balance between the protection and development of urban natural resources.

2. Materials and Methods
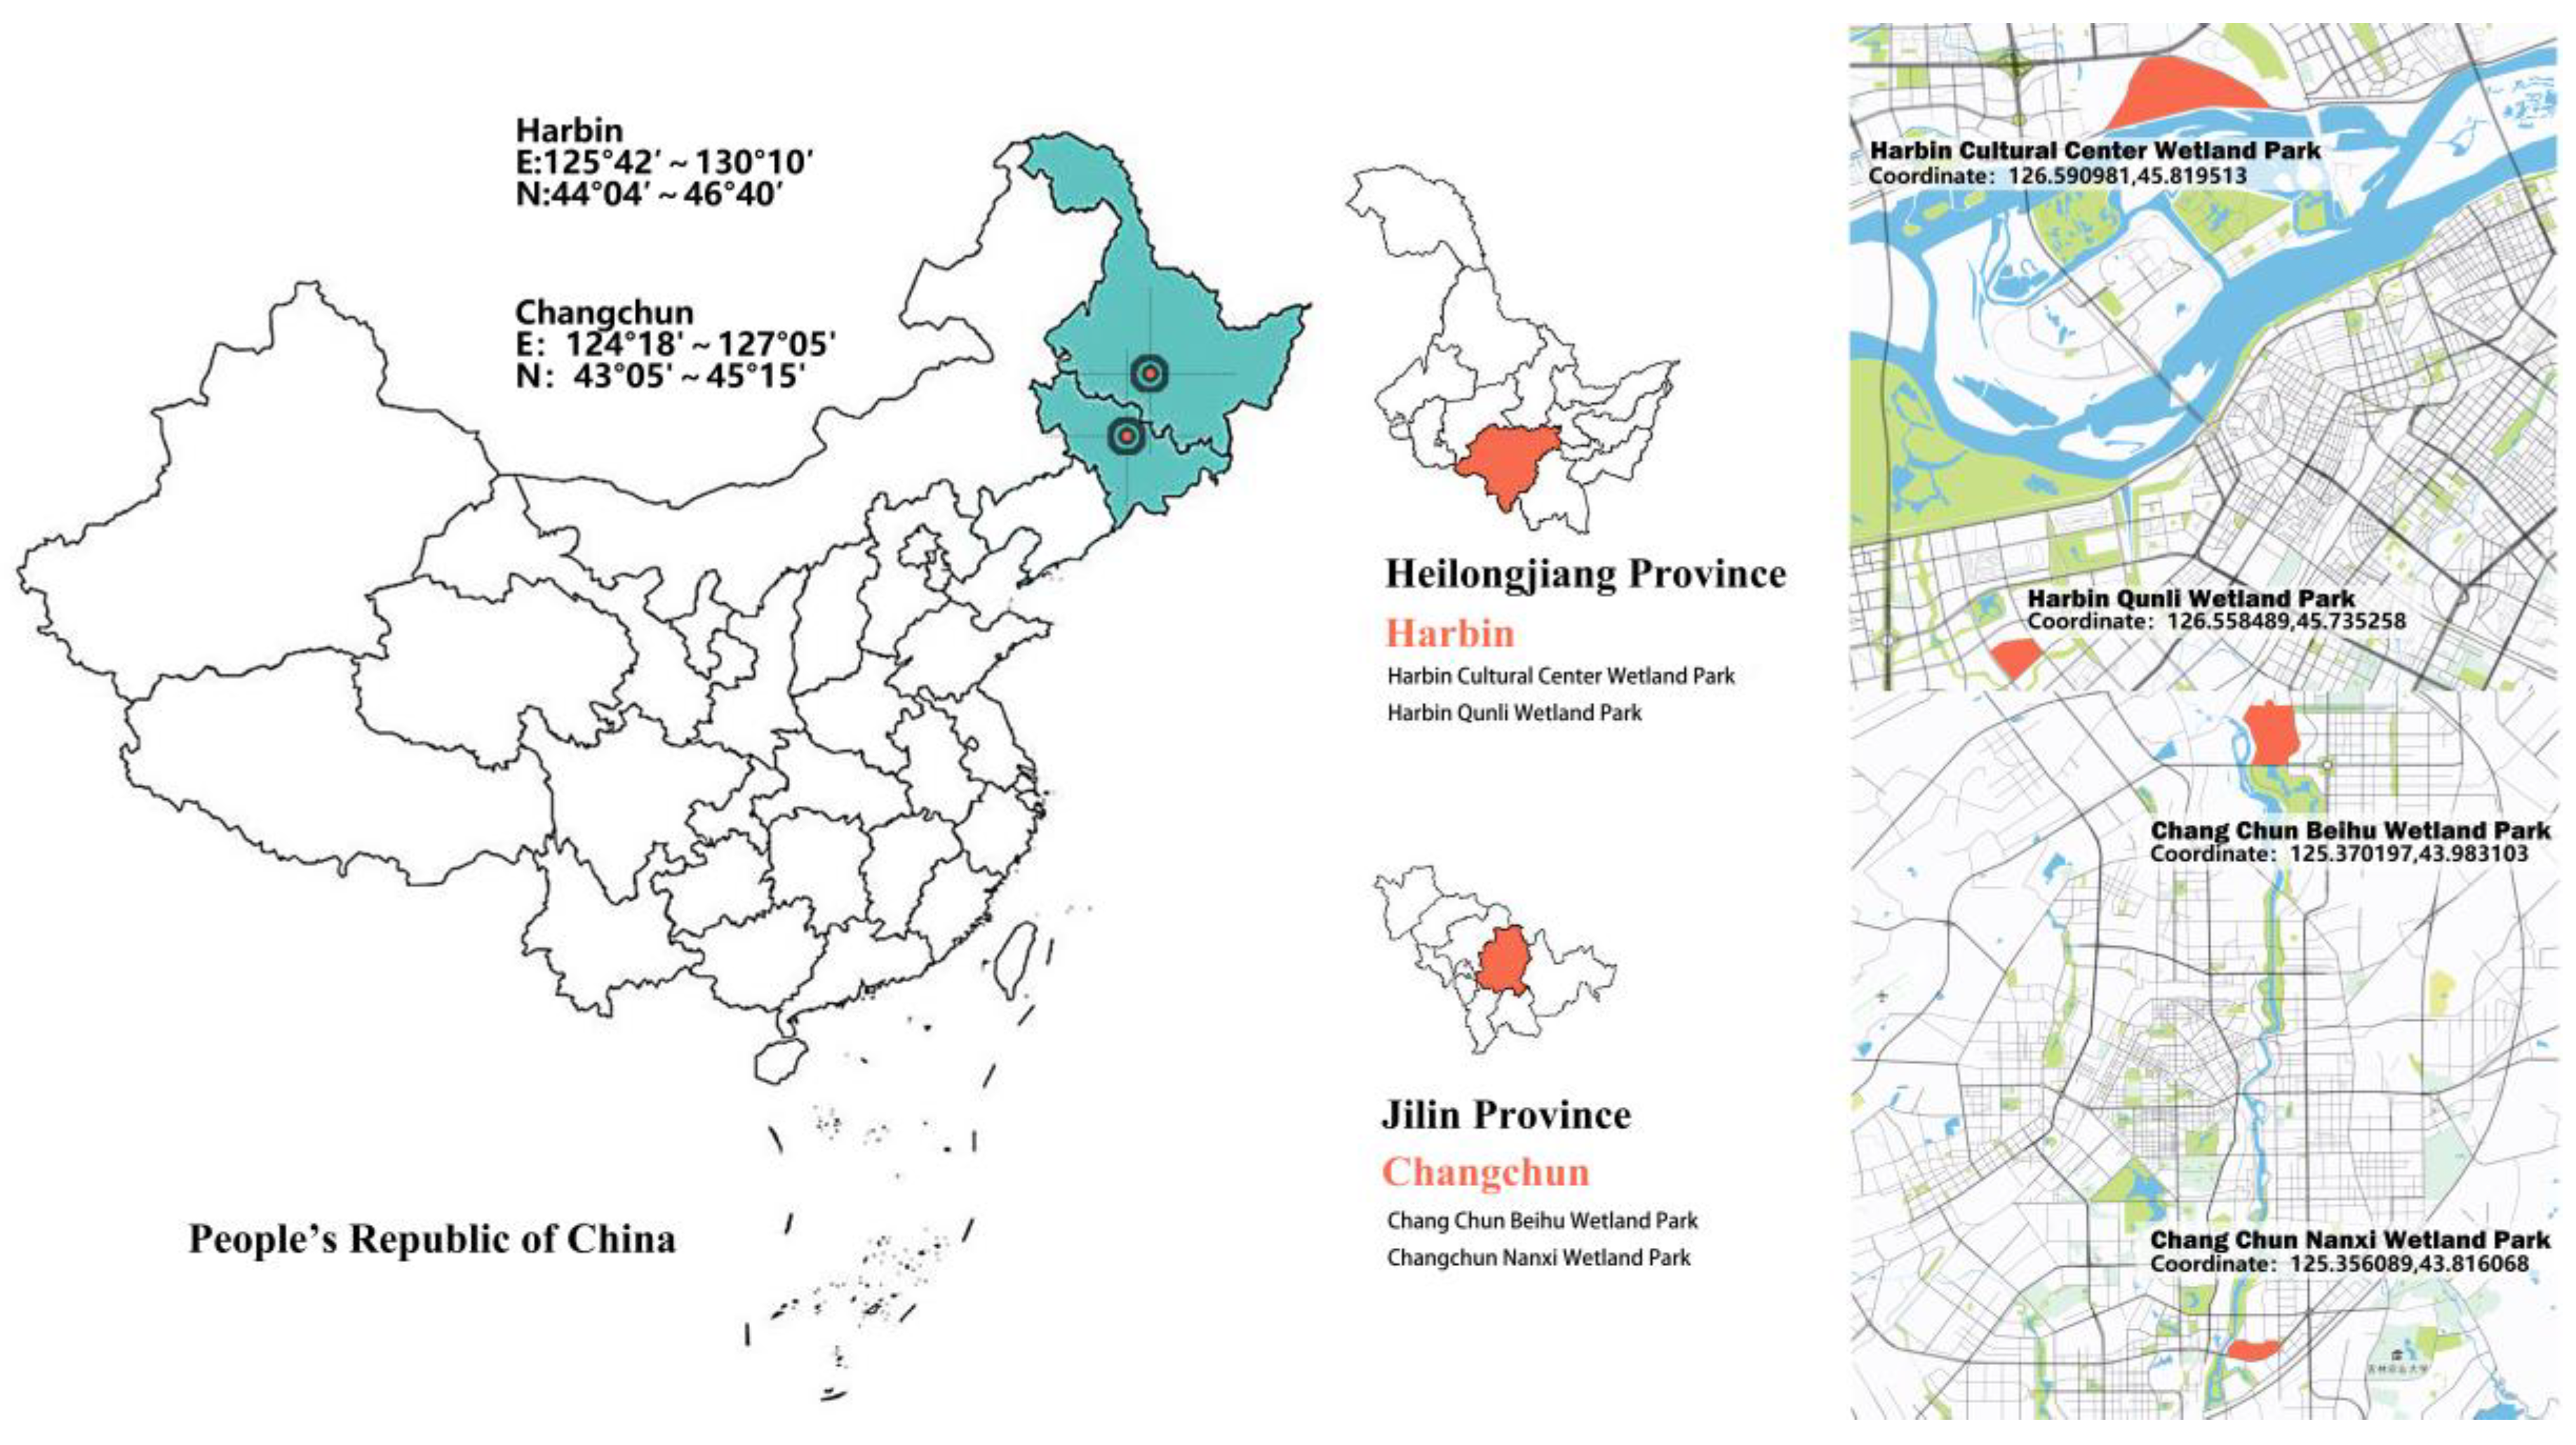
2.1. Study Area

Harbin and Changchun were selected as the research areas in this study. These two cities are located in northeast China and are important central cities in this region, as shown in Figure 1. With rivers passing through the cities, abundant tidal plain wetlands are formed, which have a good natural foundation of ecological wetlands. By screening 15 urban wetland parks in Harbin and Changchun and considering the frequency of people’s recreational trips and the number of comments on public media platforms, we selected 4 urban wetland parks that are free to the public in urban core areas, namely, Harbin Qunli Wetland Park, Harbin Cultural Center Wetland Park, Changchun North Lake Wetland Park, and Changchun Nanxi Wetland Park, see Table 1 for details.

2.2. Data Acquisition

Basic quantitative data, such as the area and types of urban wetland parks, can be obtained from the official website of the National Forestry and Grassland Administration of China [59]. At the same time, Landsat 8 OLI_TIRS satellite data of four urban wetland parks were downloaded from the Geospatial Data Cloud [60], corrected in combination with the actual research, and the plan of the four urban wetland parks was drawn using Auto CAD 2016 in order to calculate the area, perimeter vegetation area, and quantity of wetland park [24]. Then, based on the shadow phase and multi-source remote sensing data of Landsat 8 OLI, the four wetlands were classified into multi-feature vegetation [61,62]. Then, combined with the preliminary classification results, field research, and related data records, the classification results were corrected and modified to prepare for the subsequent statistics of habitat elements.
As for the acquisition of tourists’ visual preference data, the comment data of China’s popular open social media platforms, such as Weibo [63], Ctrip [64], Two-step Road [65], and Qunar [66], were captured and screened. These data included the text and image content released by users during their visit to the wetland park and the gender of evaluators. The time period used was from January 2017 to May 2022, so as to avoid the problem of incorrect results due to the time difference in comment information. After screening and deleting comments unrelated to wetlands, 2880 photos with geographic information markers were obtained. According to the names of the corresponding parks, they were coded as H—Qunli Wetland Park, W—Cultural Center Wetland Park, B—North Lake Wetland Park, and N—Nanxi Wetland Park; the photo database of tourists’ preferences was constructed.

2.3. Data Preprocessing

In terms of data processing, both “subjective data- visitor preference” and “objective data-habitat diversity of wetland park” were carried out at the same time, and a research framework was built to achieve the final goal, as shown in Figure 2.
In the processing of tourists’ visual preference data, the photos were firstly segmented semantically [67,68] to identify the natural and artificial elements in the photos. The landscape elements identified include blue sky, water, trees, lawns, flowers, roads, people, buildings, landscape structures, facilities (garbage cans, lights, seats, publicity boards, etc.), wooden piles, cement roads, wooden walkways, etc. [69]. Then, the segmentation results of the establishment of the Java image processing library imageIO, and the use of computer programming language to obtain the photo content proportion data, the segmentation of natural elements, and artificial elements of the data for statistics and calculation, provided the visual area ratio of each element in the photo. The habitat diversity data of wetland park was calculated by the formula. We evaluated the habitat diversity of wetland parks through statistics and calculation of objective data, such as wetland area, perimeter, and number of habitat elements, and visualized the results. Finally, through correlation analysis, cluster analysis, spatial coupling, and other methods, the characteristics of wetland habitat units preferred by tourists were summarized and analyzed, and corresponding habitat protection-development strategies were proposed.

2.4. Visual Preference Indicator

According to the component proxy model [70], six indicators were selected as the visual preference measurement of tourists, including perceived naturalness, diversity, wildness, timeliness, and positive artificial elements. A measurement was calculated for each sample, see in Table 2 for details.

2.5. Habitat Diversity Indicators

2.5.1. Division of Habitat Units

Habitat unit refers to the environment related to organisms, which can be divided into spatial units in the ecosystem. Some abiotic factors together constitute the living environment [75]. Its concept is constantly updated and developed with the passage of time, and its essence reflects the characteristics of spatial or environmental patterns. In terms of cities, it is formed by urban buildings, structures, vegetation, human activities, and other factors [76]. Based on the urban park habitat classification system proposed by Belgian scholar Hermy [25], this paper divided the habitats of four wetland parks into units, see Table 3 for details. Habitat diversity was related to the area, and species richness was related to habitat diversity while the area remains unchanged [24]. Therefore, we divided the four wetland parks into 52 habitat units with an area of 50 m × 50 m, so as to facilitate the study and exploration of other variables.

2.5.2. Habitat Diversity Calculation

Firstly, according to the classification criteria, the sample units were divided into plane, linear, and point habitat elements. Then, the area, length, and number of each cell are counted. Finally, the Shannon–Weill index and fractal index of each sample were calculated, and habitat diversity (H), habitat saturation (H′), and landscape complexity (P) were used as indicators to measure the level of habitat diversity in each sample [69]. Then, the results were analyzed visually using GIS, and a map of habitat diversity was obtained for further analysis.
(4)
Diversity of habitat
The habitat diversity index can reflect the difference between the actual biodiversity level and the ideal biodiversity level in the study area, so the managers can intervene and manage the landscape types in the site according to the index. Shannonville Diversity Index was used to calculate the specific index. This index was constructed by Merglef and Shannonville’s information measurement formula in 1958. It is one of the most widely used indicators, and relevant scholars have used it to measure diversity at the species level. The specific calculation formula is as follows:
H = i = 1 s ( n i / N ) ln ( n i / N )
  • H —diversity index of habitat unit;
  • i —i-th habitat unit;
  • S—total number of habitat units;
  • n i —area, length, or number of habitat unit i;
  • N—total area, total length, or the total number of habitat units in the park.
(5)
Habitat saturation index
The habitat saturation index is the ratio (%) between the actually measured diversity index and the maximum possible diversity index H m a x , which can be calculated, according to Formula (3), and then the habitat saturation is calculated. For the specific formula, see (2):
S = H H m a x × 100 %
  • S m a x —total number of habitat units.
H m a x = ln 1 S m a x
(6)
Complexity of landscape
The complexity of the shape of landscape elements is both an ecological function and a dimension of visual characteristics. Landscape complexity is one of the intersecting indicators of ecology and environmental aesthetics, which can not only reflect the landscape complexity of objective wetland habitats but also serve as a reference index for preference prediction. In this study, the most representative morphological index calculation model established by Krummel et al., the “girth–area” measurement index, is adopted:
S = 0.25P/√A
  • P—The sum of the edge perimeters possessed by individual patches in the object area (m);
  • A—Total area of object area (m2);

2.5.3. Data Validation

Since the area proportion of various habitat elements in the photos can reflect the preference characteristics of tourists for habitat units, this study takes the preference database obtained after semantic analysis of photos obtained from the internet as the research variable and conducts a difference test to verify the degree of “affinity and disaffinity” between elements. Since the sample data does not obey the normal distribution, non-parametric test is chosen. In other words, SPSS 26.0 (Statistical Product Service Solutions, IBM) was used to conduct K independent sample tests on sample data. It can be seen from Table 4 that p < 0.05, there are significant differences among various element variables, and the data are reliable.

3. Visual Preferences and Habitat Diversity

3.1. Analysis of Tourists’ Landscape Preference Elements

According to the semantic segmentation of 2880 photos and the element proportion, it is found that the landscape elements chosen by tourists are blue sky, trees, lawn, water, men, cement road, shrubs, buildings, hydrophyte, structures, wooden walkway, flowers, other plants, aerial boardwalk, facilities, steps, wooden walkway, and structure. Blue sky accounted for 33.21%, followed by tall trees accounting for 12.40%; herbs and trees were close to each other, accounting for 10.20%. Water area, as a popular area of wetland park, accounted for 9.00%; Cement road represents artificial traffic, including hard paved square, accounting for 6.10% of the total. Bush group and stairs are similar, accounting for 4.20% and 4.10% of the total. As one of the representatives of seasonal landscape, aquatic plants accounted for 3.00%; structures and wooden boardwalks are also popular in wetlands, accounting for 2.80% and 2.50%, respectively. Other ground cover flowers and plants as summer and autumn close-up elements accounted for 1.40%; artificial facilities, such as garbage bins and transformer boxes (0.70%), are not preferred (see Figure 3 for detail).
Then, the study produced statistics on the seasons of the photos, and it was found that spring and summer were the peak seasons for tourists to visit the wetland park, while winter had the least number of visitors. In this study, landscape elements preferred by tourists in the four seasons are divided into natural elements (animals, plants, water surface, natural revetment, snow and ice, sky, and sunset) and artificial elements (park facilities, artificial landscape, road traffic) and are identified and counted according to the elements in the photos and their proportions [69]. The statistical table is as follows (see Figure 4 for detail): In terms of plant preference, in spring people prefer trees in wetland parks more. New buds and flowers, such as forsythia and elm blossom, in early spring become the preferred ornamental characteristics of trees in spring, and the preference degree of wetland landscape remains the highest among all elements. Birch, as a unique wetland tree species in northeast China, has become the plant landscape with the highest tourist preference. The preference degree of reed community landscape was the highest in summer and autumn.
In wetland parks, people prefer natural elements to artificial ones, and this preference is not affected by seasons, as shown in Figure 5. Plants were chosen as a preference by visitors in summer, followed by winter, autumn and spring; The season with the highest focus on artificial elements is summer, followed by winter, spring, and fall. This shows that people pay more attention to the construction of plants and artificial landscape when visiting wetland park in winter, although the types of plants are relatively monotonous. In terms of preference for natural elements, plants still pay the most attention to natural elements in spring and summer, followed by water, sky, and animals. Insects and water birds in summer are second only to water. In autumn, the natural elements of focus are color-changing plants and reed swamps, while winter is snow, plants, ice, sky, sunset, animals.

3.2. Correlation Analysis between Visual Preference and Habitat Diversity

Based on the correlation analysis between the habitat diversity index and preference measure (Table 5), it is found that there is a significant positive correlation between habitat saturation and active artificial elements, and a significant negative correlation between landscape complexity and landscape wilderness and instantaneity. The naturalness, instantaneity of landscape, and positive artificial elements play a positive role in promoting habitat diversity. There was no correlation between habitat saturation and tourists’ perception of naturalness, richness, wilderness, landscape instantaneity, and negative artificial elements. There is no correlation between landscape complexity and naturalness, richness, or negative or positive artificial elements. There was no correlation between habitat diversity and perceived richness, wilderness, or negative artificial elements.
(1)
Correlation analysis between saturation and active artificial elements
The aerial walkway in the positive artificial element is proportional to the habitat saturation of the wetland park. The higher the habitat saturation in the area with an aerial walkway, the closer the actual biodiversity level is to the ideal biodiversity level. The air corridor is the secondary spatial structure of the wetland park and the participation of human beings in the vertical ecological process of the wetland park. This participation method has been proven to be positive and effective in this study.
(2)
Correlation analysis of landscape complexity, temporality, and wilderness degree
There is a significant negative correlation between landscape complexity and temporality, which includes the seasonal changes of autumn and winter plants and the meteorological landscape, such as snow and ice. High temporality means that there are snow and ice and other meteorological landscapes in the field of view, so winter hampers visitors’ perception of wetland habitat diversity. The seasonal changes of plants can help tourists perceive the diversity of habitats, and the landscape richness presented by autumn-colored plants is more easily perceived by tourists. Summer visitors’ perception of landscape complexity is at a moderate level.
There is a negative correlation between landscape complexity and wilderness degree. The higher the landscape complexity, the better the ecology in the region. The lower the wilderness, the more man-made buildings, roads, and other artificial elements are within view and the less vegetation there is in the wilderness. This also confirms the conclusion that the aerial walkway, a positive artificial element, is positively correlated with habitat saturation. It shows that the ecology of the natural environment with artificial elements is not necessarily bad, and moderate artificial construction is beneficial to tourists’ perception of landscape complexity and regional biodiversity.
(3)
Habitat diversity and temporality, naturalness, and positive artificial elements
The correlation analysis between habitat diversity and visual preference shows that there is a close correlation between habitat diversity and the naturalness of view. The area of natural vegetation in the view of high naturalness is larger, and the higher the habitat diversity index in the area is, the better the ecology is. The habitat diversity index was negatively correlated with flowers and plants but positively correlated with trees and aquatic plants. Here, we can understand that, to some extent, tourists prefer landscapes with high vegetation naturalness, and the habitat diversity index in this region is also at a high level.
There was a significant positive correlation between habitat diversity and temporality within the horizon. The more temporality the landscape had within the horizon, the lower the habitat diversity index, that is, the lower the habitat diversity in the landscape covered by snow and ice in winter, which confirms the negative correlation between the landscape complexity and the temporality and indicates the commonality of the visual aesthetic and ecological characteristic indicators [54].
There was a positive correlation between habitat diversity and positive artificial elements. Corridors, pavilions, and other landscape constructions in the park are the most preferred landscape elements for tourists in spring, and the space carrying them is also a concentrated area for tourists. Although the plant configuration in this area is rich in levels, diverse in species, and high in habitat diversity, the spring season is monotonous, which reduces tourists’ cognition of plant diversity.

3.3. Coupling Results of Visual Preference and Habitat Diversity

According to the location and content of tourists’ photos, we formed the tourists’ view analysis diagram in the sample space. Then, we superimposed the tourist horizon analysis map and wetland habitat diversity map, analyzing and summarizing the coupling results (Figure 6). According to the visual preference of tourists, it is divided into three levels: high, medium, and low, and the habitat diversity level is described as high, medium, and low. Based on the coupling results, tourists’ visual preferences for typical wetland landscapes can be divided into the following four modes: high preference–high habitat, high preference–low habitat, low preference–high habitat, and low preference–low habitat.
The high habitat–high preference pattern consisted of a diverse wetland bubble, arbor, and waterfront square habitat. The existence of this model proves that the maintenance of good wetland habitats and tourists’ leisure activities can achieve a relative balance. Most of the tourist activities in this habitat space are picnics and kite flying. The habitat in the activity area is dominated by tall tree communities, so for this kind of habitat space, the original supervision of plants and organisms in the habitat area should be maintained, and corresponding supporting facilities should be added in the activity area to reduce the impact of tourists on the environment.
The types of habitat combinations with higher habitat levels but lower preference included linear traffic space, arbor habitat, wetland bubble habitat, aquatic plant habitat, and point-like structure combination. Within wetland parks, the linear upper air corridor is the main space for visitors to view and participate in the wetland habitat. This area is a space where visitors often move. Visitors can enjoy the cool, take photos, get close to the plants, and partake in other activities. Therefore, for this low-preference habitat space, we should start from two aspects. On the one hand, the connection and protection between artificial structures and the original wetland habitat should be strengthened, and multi-level plant landscape design should be carried out near the linear space to form a certain buffer protection area and reduce the damage to the internal wetland. To meet the needs of tourists, it is important to improve their natural interaction experience. On the other hand, proper ground space is added along the walkway for visitors to rest and stay, increasing the length of the natural experience.
The entrance habitat combination of the park is the most popular type for visitors to focus on, but its habitat level is not high. This type of space is dominated by the square space, which is responsible for the function of the whole evacuation park and some activity places. The functional-oriented habitat space does not affect its habitat diversity on the premise of not changing its spatial function.
Undesirable habitats and low-elevation habitats are combined into waterfront roads with no shoreline plants and swamps with single plant types. The existence of such habitats confirms that tourists prefer man-made vegetation spaces. In view of such habitat space problems, we should improve the vegetation design along the waterfront road according to the park space tour route. After determining the dominant plant species, artificial construction is carried out to construct the water–land ecotone formed from the water area to the waterfront, further improving the habitat diversity of the wetland on the basis of the original ecology and forming a stable ecological environment and ecological community structure.

4. Discussion

Studies have shown that tourists do not blindly pay attention to natural elements in wetland parks, instead having some unnatural elements as their first-choice recreational element in the wetland. Moreover, in areas with obvious seasonal climate changes, the season is the key to influencing tourists’ preferences. There is a significant correlation between wetland habitat diversity and tourists’ landscape preferences. Because of the spontaneity and statistics of social media data, it is confirmed that people are born with the perception of biodiversity [32]. Finally, cluster analysis and spatial coupling methods were used to summarize four preferred habitat types of typical urban wetland parks, and reasonable human intervention was carried out for different habitat types to improve biodiversity to a certain extent [29,77]. At the same time, with the promotion of social media, the computational dimension of the biodiversity experience is enriched, the ecological education function of urban wetland parks is strengthened, and the dynamic balance between recreation and conservation is expected to be achieved.
In the study of tourists’ preference for wetland landscapes, tourists pay much more attention to the tree communities in a wetland than the characteristic aquatic plant communities in a wetland park, which is unexpected. This also proves that tourists can better capture rare values of the wetland by freely choosing the location of photos [78]. The season is an important factor affecting preferences and tourists’ selection of wetland parks. People prefer plants, water surfaces, and landscapes with pruning and artificial construction, for example, people like tree-lined walking paths, rich artificial planting areas, lawns with planted trees, swamps with water surfaces, and wide water surfaces [31,32,79,80]. So we wondered what the purpose is of visiting wetland parks. Is it to experience the unique landscape of the wetland, or to use it as a traditional park green space for participation and activities? If tourists’ comments on the park are combined, we can try to obtain the purpose of tourists’ visit to understand the image of the wetland park in the minds of tourists, guiding people to participate more in the perception of wetland biodiversity and helping the management department to manage the core image of the wetland park [81].
Based on the mapping of habitat diversity and the location information data of tourist photos, the coupling of habitat diversity space and tourist recreation space was realized, and four typical types of habitat space were summarized. In practice, it has been proven that it is convenient and effective to take habitat diversity as the primary indicator to measure biodiversity, incorporate man-made landscape elements, such as squares and roads, into habitats, and use spatial data, such as wetland area and perimeter, to assess the biodiversity of urban wetland parks. It can help managers assess the status quo of biodiversity in target areas under limited conditions [25,78]. The diversity of urban wetland habitats is significantly related to the landscape preference of tourists. The aerial boardwalk, as a way of human participation in the vertical ecological process of a wetland park, has been proven to be positive for the protection of wetland park habitat diversity. Therefore, active artificial construction is conducive to tourists’ perception of habitat diversity in wetland parks. Based on the commonality of ecological indicators and human visual indicators [54,82], more visual and ecological indicators and objective adjustable indicators can be systematically studied in future studies to determine whether there is a certain mediating effect between the three, so as to further explore the relationship between tourists’ visual preference and wetland biodiversity, thereby effectively intervening in the wetland more successfully. The restoration of wetland ecological function is discussed in [83].
There is a clear lack of research on social media data in wetland parks. Although tourists’ photo data are the result of tourists’ freely photographing and uploading to the social media platform, the path where the photo was taken is the result of the designer’s work, and the attention to the landscape is guided by the path to a certain extent. There are some undeveloped areas of wetland parks, where the tourists cannot enter. It is impossible to determine whether the undeveloped habitat types of different levels are preferred by tourists. Therefore, it is necessary to use drones and other equipment in future experiments to sample and shoot all the existing habitat types in the wetland park, enrich the experimental data, set up corresponding questionnaires, and interview a certain number of tourists. Regarding whether the social background of tourists will affect their preference for wetland parks, relevant studies have proved that professional knowledge or special hobbies will affect the preference of tourists [84]. However, since the data collection did not include the social background of the photographer, it is uncertain whether the tourists’ preference for wetlands is related to a specific occupation, but it is clear that women are more enthusiastic than men when it comes to sharing landscape photos. In subsequent studies, corresponding questionnaires or survey interviews can be added to obtain tourists’ attitudes towards wetland habitat through a comprehensive survey of wetland parks, which can provide certain landscape design suggestions for the planning and designers of wetland parks, so as to maintain the original landscape characteristics of wetland and enrich tourists’ landscape experience.
In terms of theory, this study can be used as a basis for future research on the deep mechanism of habitat diversity and tourists’ landscape preferences by using social media data at the scale of a park habitat. In the application, it provides an effective and scientific prediction method for the recreation path and space construction of the wetland park to be constructed, provides specific design strategies for the management of the existing urban wetland park in the cold region, and provides scientific construction and management basis for both the protection of urban natural resources and the recreation development.

5. Conclusions

This study found that habitat diversity was positively correlated with positive artificial elements, such as aerial boardwalk, pavilions, etc. The commonality of visual aesthetic preference and ecological characteristic index is verified, that is, there is a certain correlation between the habitat diversity of a wetland park and the preference of tourists, and tourists have a strong perception of biodiversity and preference choice. We have the opportunity to achieve a dynamic balance between habitat protection and recreation construction of wetland parks by increasing or reducing artificial elements. (1) Set the activity space of aggregation degree to improve the complex function of the entrance space; (2) increase the aerial walkway to improve wetland saturation; (3) protect the winding shoreline of the natural pond surface and improve the stability of the shoreline plant buffer zone; (4) divide “whole” into “scattered” to improve the perception of wetland complexity in winter; (5) rebuild the stagnation space of the community transition zone to avoid the disturbance of stampede activity; (6) increase positive artificial elements to reduce tourists’ wilderness experience.
In future studies, the number of samples, habitat types, and coverage areas can be further expanded to supplement and improve the feedback information of tourists’ preferences, such as obtaining basic information, including tourists’ education background and occupation, and exploring the influencing factors of tourists’ wetland preference characteristics in multiple dimensions. This study can be used as the basis of the deep mechanism between biodiversity and tourists’ landscape preference at the site scale and provide a scientific basis for the construction and management of both urban natural resource protection and recreational development.

Author Contributions

Conceptualization, J.Z. and X.Z.; Methodology, J.Z.; Software, J.Z.; Validation, J.Z., M.G. and X.Z.; Formal Analysis, J.Z.; Investigation, J.Z.; Resources, J.Z.; Data Management, J.Z. and M.G.; Writing—Manuscript Preparation, J.Z.; Writing—Review and Editing, J.Z., M.G. and X.Z.; Visualization, J.Z.; Supervision, M.G.; Project Management, X.Z. All authors have read and agreed to the published version of the manuscript.

Funding

This research was funded by the National Natural Science Foundation of China—study on the global tourism space model of the Middle East Railway Heritage Corridor, grant number 51908170.Heilongjiang Forestry and Grassland Administration—study on contribution of forest and grass industry to the carbon neutrality goal of Heilongjiang Province, grant number 22252.

Data Availability Statement

Data are available on request due to privacy and ethical restrictions. The data presented in this study are available on request from the corresponding author.

Conflicts of Interest

The article is the product of the author’s work during his master’s degree studies. Additionally, there is no conflict of interest.

References

  1. Elizabeth, B. The Ecotourism Boom: Planning for Development and Management; WWF: Washington, DC, USA, 1992; pp. 3–10. [Google Scholar]
  2. Spieles, D.J. Wetland Construction, Restoration, and Integration: A Comparative Review. Land 2022, 11, 554. [Google Scholar] [CrossRef]
  3. Saha, U.D.; Mitra, S.; Mondal, M.; Biswas, N. Assessment of the impact of anthropogenic stress on wetlands of the upper Ganga Delta, India: A multi criteria decision making approach. Geocarto Int. 2022, 38, 1–22. [Google Scholar]
  4. Holland, C.C.; Honea, J.; Gwin, S.E.; Kentula, M.E. Wetland degradation and loss in the rapidly urbanizing area of Portland, Oregon. Wetlands 1995, 15, 336–345. [Google Scholar] [CrossRef]
  5. Zhang, K.-L.; Zhou, X.; Gao, J.-H. Some Thoughts about Wetland, National Wetland Park and Urban Wetland Park. Landsc. Archit. 2012, 6, 108–110. [Google Scholar] [CrossRef]
  6. Butler, R.W.; Waldbrook, L.A. A new planning tool: The tourism opportunity spectrum. J. Tour. Stud. 1991, 2, 2–14. [Google Scholar]
  7. Stankey, G.H. The Limits of Acceptable Change (LAC) System for Wilderness Planning; National Agricultural Library: Beltsville, MD, USA, 1985.
  8. Manning, R. Visitor experience and resource protection: A framework for managing the carrying capacity of National Parks. J. Park Recreat. Adm. 2001, 19, 1. [Google Scholar]
  9. Yonghui, L.; Dan, Z. Urban Forest Park and the Reconstruction and Protection of Wildlife Habitat. Xiandai Hortic. 2020, 4, 159–160. [Google Scholar]
  10. Theobald, D.M.; Hobbs, N.T.; Bearly, T.; Zack, J.A.; Shenk, T.; Riebsame, W.E. Incorporating biological information in local land-use decision making: Designing a system for conservation planning. Landsc. Ecol. 2000, 15, 35–45. [Google Scholar] [CrossRef]
  11. Kaplan, S. The restorative benefits of nature: Toward an integrative framework. J. Environ. Psychol. 1995, 15, 169–182. [Google Scholar] [CrossRef]
  12. Mayer, F.S.; Frantz, C.M.; Bruehlman-Senecal, E.; Dolliver, K. Why is nature beneficial? The role of connectedness to nature. Environ. Behav. 2009, 41, 607–643. [Google Scholar] [CrossRef]
  13. Macaulay, R.; Lee, K.; Johnson, K.; Williams, K. Mindful engagement, psychological restoration, and connection with nature in constrained nature experiences. Landsc. Urban Plan. 2022, 217, 104263. [Google Scholar] [CrossRef]
  14. Spieles, D.J.; Mitsch, W.J. Macroinvertebrate community structure in high-and low-nutrient constructed wetlands. Wetlands 2000, 20, 716–729. [Google Scholar] [CrossRef]
  15. Levandowski, M.L.; Litt, A.R.; McKenna, M.F.; Burson, S.; Legg, K.L. Multi-method biodiversity assessments from wetlands in Grand Teton National Park. Ecol. Indic. 2021, 131, 108205. [Google Scholar] [CrossRef]
  16. Wang, B.; Zheng, X.; Zhang, H.; Xiao, F.; Gu, H.; Zhang, K.; He, Z.; Liu, X.; Yan, Q. Bacterial community responses to tourism development in the Xixi National Wetland Park, China. Sci. Total. Environ. 2020, 720, 137570. [Google Scholar] [CrossRef] [PubMed]
  17. Wang, X.; Yu, J.; Zhou, D.; Dong, H.; Li, Y.; Lin, Q.; Guan, B.; Wang, Y. Vegetative Ecological Characteristics of Restored Reed (Phragmites australis) Wetlands in the Yellow River Delta, China. Environ. Manag. 2012, 49, 325–333. [Google Scholar] [CrossRef] [PubMed] [Green Version]
  18. Falkowska, E.; Jancewicz, E. Landscape diversity vs. population resilience of a wetland species near the limits of its range (the root vole Microtus oeconomus in Poland)—Implications for species conservation. CATENA 2021, 211, 105947. [Google Scholar] [CrossRef]
  19. Bräuniger, C.; Knapp, S.; Kühn, I.; Klotz, S.; Bräuniger, C.; Knapp, S.; Kühn, I.; Klotz, S. Testing taxonomic and landscape surrogates for biodiversity in an urban setting. Landsc. Urban Plan. 2010, 97, 283–295. [Google Scholar] [CrossRef]
  20. Singh, M.; Rajiv, S. Evaluating dynamic hydrological connectivity of a floodplain wetland in North Bihar, India using geostatistical methods. Sci. Total Environ. 2019, 651, 2473–2488. [Google Scholar] [CrossRef]
  21. Deutschewitz, K.; Lausch, A.; Kühn, I.; Klotz, S. Native and alien plant species richness in relation to spatial hetero-geneity on a regional scale in Germany. Glob. Ecol. Biogeogr. 2003, 12, 299–311. [Google Scholar] [CrossRef] [Green Version]
  22. Tansley A, G. The Use and Abuse of Vegetation Concepts and Terms. Ecology 1935, 16, 284–307. [Google Scholar] [CrossRef]
  23. Triantis, K.A.; Mylonas, M.; Lika, K.; Vardinoyannis, K. A model for the species–area–habitat relationship. J. Biogeogr. 2003, 30, 19–27. [Google Scholar] [CrossRef]
  24. Kallimanis, A.S.; Mazaris, A.D.; Tzanopoulos, J.; Halley, J.M.; Pantis, J.D.; Sgardelis, S.P. How does habitat diversity affect the species–area relationship? Glob. Ecol. Biogeogr. 2008, 17, 532–538. [Google Scholar] [CrossRef]
  25. Hermy, M.; Cornelis, J. Towards a monitoring method and a number of multifaceted and hierarchical biodiversity indicators for urban and suburban parks. Landsc. Urban Plan. 2000, 49, 149–162. [Google Scholar] [CrossRef]
  26. Hao, S.; Wang, C.; Lin, H. Design and assessment of biodiversity in urban wetland parks: Take Liupanshui Minghu National Wetland Park as an example. Acta Ecol. Sin. 2019, 39, 5967–5977. [Google Scholar]
  27. Qiu, L.; Gao, T.; Gunnarsson, A.; Hammer, M.; von Bothmer, R. A methodological study of biotope mapping in nature conservation. Urban For. Urban Green. 2010, 9, 161–166. [Google Scholar] [CrossRef]
  28. Ekici, B.; Korkut, A.; Özyavuz, M. Biotopes in the Ganos (Işıklar) Mountain and Near Surrounding Areas. Int. J. Sci. Basic Appl. Res. 2018, 40, 264–274. [Google Scholar]
  29. Ekici, B. Kumul biyotoplarının haritalanması, Kurucaşile (Bartın) örneği. Turk. J. For. 2020, 21, 188–194. [Google Scholar] [CrossRef]
  30. Kaplan, S.; Kaplan, R. The Experience of Nature: A Psychological Perspective; Cambridge University Press: Cambridge, UK, 1989. [Google Scholar]
  31. Kaplan, S.; Kaplan, R. Humanscape: Environments for People; Duxbury Press: Belmont, CA, USA, 1978. [Google Scholar]
  32. Wilson, E.O. Biophilia; Harvard University Press: Cambridge, UK, 1984. [Google Scholar]
  33. Duan, Y.; Shuhua, L. Study of Different Vegetation Types in Green Space Landscape Preference: Compari-son of Environmental Perception in Winter and Summer. Sustainability 2022, 14, 3906. [Google Scholar] [CrossRef]
  34. Dobbie, M.; Green, R. Public perceptions of freshwater wetlands in Victoria, Australia. Landsc. Urban Plan. 2012, 110, 143–154. [Google Scholar] [CrossRef]
  35. Smardon, R.C. The Future of Wetlands: Assessing Visual-Cultural Values; Rowman & Littlefield Publishers: Lanham, MD, USA, 1983. [Google Scholar]
  36. Dobbie, M.F. Public aesthetic preferences to inform sustainable wetland management in Victoria, Australia. Landsc. Urban Plan. 2013, 120, 178–189. [Google Scholar] [CrossRef]
  37. Qiu, L.; Nielsen, A.B. Are Perceived Sensory Dimensions a Reliable Tool for Urban Green Space Assessment and Planning? Landsc. Res. 2015, 40, 834–854. [Google Scholar] [CrossRef]
  38. Van Hecke, L.; Ghekiere, A.; Van Cauwenberg, J.; Veitch, J.; De Bourdeaudhuij, I.; Van Dyck, D.; Clarys, P.; Van De Weghe, N.; Deforche, B. Park characteristics preferred for adolescent park visitation and physical activity: A choice-based conjoint analysis using manipulated photographs. Landsc. Urban Plan. 2018, 178, 144–155. [Google Scholar] [CrossRef]
  39. Wang, R.; Zhao, J.; Meitner, M.J.; Hu, Y.; Xu, X. Characteristics of urban green spaces in relation to aesthetic preference and stress recovery. Urban For. Urban Green. 2019, 41, 6–13. [Google Scholar] [CrossRef]
  40. Zhang, H.; Chen, B.; Sun, Z.; Bao, Z. Landscape perception and recreation needs in urban green space in Fuyang, Hangzhou, China. Urban For. Urban Green. 2013, 12, 44–52. [Google Scholar] [CrossRef]
  41. Carrus, G.; Scopelliti, M.; Lafortezza, R.; Colangelo, G.; Ferrini, F.; Salbitano, F.; Agrimi, M.; Portoghesi, L.; Semenzato, P.; Sanesi, G. Go greener, feel better? The positive effects of biodiversity on the well-being of individuals visiting urban and peri-urban green areas. Landsc. Urban Plan. 2015, 134, 221–228. [Google Scholar] [CrossRef]
  42. Holy-Hasted, W.; Brendan, B. Does public space have to be green to improve well-being? An analysis of public space across Greater London and its association to subjective well-being. Cities 2022, 125, 103569. [Google Scholar] [CrossRef]
  43. Lindemann-Matthies, P.; Briegel, R.; Schüpbach, B.; Junge, X. Aesthetic preference for a Swiss alpine landscape: The impact of different agricultural land-use with different biodiversity. Landsc. Urban Plan. 2010, 98, 99–109. [Google Scholar] [CrossRef]
  44. Qureshi, S.; Tarashkar, M.; Matloobi, M.; Wang, Z.; Rahimi, A. Understanding the dynamics of urban horticulture by socially-oriented practices and popu-lace per-ception: Seeking future outlook through a comprehensive review. Land Use Policy 2022, 122, 106398. [Google Scholar] [CrossRef]
  45. Junge, X.; Jacot, K.A.; Bosshard, A.; Lindemann-Matthies, P. Swiss people’s attitudes towards field margins for biodiversity conservation. J. Nat. Conserv. 2009, 17, 150–159. [Google Scholar] [CrossRef] [Green Version]
  46. Lindemann-Matthies, P.; Xenia, J.; Diethart, M. The influence of plant diversity on people’s per-ception and aesthetic appreciation of grassland vegetation. Biol. Conserv. 2010, 143, 195–202. [Google Scholar] [CrossRef] [Green Version]
  47. Voigt, A.; Kabisch, N.; Wurster, D.; Haase, D.; Breuste, J. Structural Diversity: A Multi-dimensional Approach to Assess Recreational Services in Urban Parks. AMBIO 2014, 43, 480–491. [Google Scholar] [CrossRef] [Green Version]
  48. Macháč, J.; Brabec, J.; Arnberger, A. Exploring public preferences and preference heterogeneity for green and blue infrastructure in urban green spaces. Urban For. Urban Green. 2022, 75, 127695. [Google Scholar] [CrossRef]
  49. Zhang, X.; Xu, D.; Zhang, N. Research on Landscape Perception and Visual Attributes Based on Social Media Data—A Case Study on Wuhan University. Appl. Sci. 2022, 12, 8346. [Google Scholar] [CrossRef]
  50. Marine, N.; Arnaiz-Schmitz, C.; Santos-Cid, L.; Schmitz, M.F. Can We Foresee Landscape Interest? Maximum Entropy Applied to Social Media Photographs: A Case Study in Madrid. Land 2022, 11, 715. [Google Scholar] [CrossRef]
  51. Toivonen, T.; Heikinheimo, V.; Fink, C.; Hausmann, A.; Hiippala, T.; Järv, O.; Tenkanen, H.; Di Minin, E. Social media data for conservation science: A methodological overview. Biol. Conserv. 2019, 233, 298–315. [Google Scholar] [CrossRef]
  52. Daniel, T.C. Whither scenic beauty? Visual landscape quality assessment in the 21st century. Landsc. Urban Plan. 2001, 54, 267–281. [Google Scholar] [CrossRef]
  53. Dronova, I. Environmental heterogeneity as a bridge between ecosystem service and visual quality objectives in man-agement, planning and design. Landsc. Urban Plan. 2017, 163, 90–106. [Google Scholar] [CrossRef]
  54. Fry, G.; Tveit, M.S.; Ode, Å.; Velarde, M.D. The ecology of visual landscapes: Exploring the conceptual common ground of visual and ecologi-cal land-scape indicators. Ecol. Indic. 2009, 9, 933–947. [Google Scholar] [CrossRef]
  55. Huai, S.; Chen, F.; Liu, S.; Canters, F.; Van de Voorde, T. Using social media photos and computer vision to assess cultural ecosystem services and land-scape features in urban parks. Ecosyst. Serv. 2022, 57, 101475. [Google Scholar] [CrossRef]
  56. Kaplan, S.; Kaplan, R. Cognition and Enviroment: Functioning in an Uncertain World; Preager Press: Westport, CT, USA, 1982. [Google Scholar]
  57. Tveit, M.; Ode, Å.; Fry, G. Key concepts in a framework for analysing visual landscape character. Landsc. Res. 2006, 31, 229–255. [Google Scholar] [CrossRef]
  58. Zhu, X.; Chiou, S.-C. A Study on the Sustainable Development of Historic District Landscapes Based on Place Attachment among Tourists: A Case Study of Taiping Old Street, Taiwan. Sustainability 2022, 14, 11755. [Google Scholar] [CrossRef]
  59. National Forestry and Grassland Administration. Available online: http://www.forestry.gov.cn/ (accessed on 10 September 2020).
  60. Geospatial Data Cloud Official Website. Available online: http://www.gscloud.cn/ (accessed on 10 September 2020).
  61. Laba, M.; Downs, R.; Smith, S.; Welsh, S.; Neider, C.; White, S.; Richmond, M.; Philpot, W.; Baveye, P. Mapping invasive wetland plants in the Hudson River National Estuarine Research Reserve using quickbird satellite imagery. Remote Sens. Environ. 2008, 112, 286–300. [Google Scholar] [CrossRef]
  62. Zhang, C.; Chen, S.; Li, P.; Liu, Q. Spatiotemporal dynamic remote sensing monitoring of typical wetland vegetation in the Current Huanghe River Estuary Reserve. Haiyang Xuebao 2022, 44, 125–136. [Google Scholar]
  63. Weibo Official Website. Available online: https://weibo.cn/ (accessed on 2 May 2022).
  64. Ctrip Official Website. Available online: https://www.ctrip.com/ (accessed on 2 May 2022).
  65. Liangbulu Official Website. Available online: https://www.2bulu.com/ (accessed on 2 May 2022).
  66. Qunar Office Website. Available online: https://www.qunar.com (accessed on 2 May 2022).
  67. Zhang, K.; Ye, C.; Chunlin, L. Discovering the tourists’ behaviors and perceptions in a tourism destination by ana-lyzing photos’ visual content with a computer deep learning model: The case of Beijing. Tour. Manag. 2019, 75, 595–608. [Google Scholar] [CrossRef]
  68. Badrinarayanan, V.; Ankur, H.; Roberto, C. Segnet: A deep convolutional encoder-decoder archi-tecture for robust semantic pixel-wise labelling. arXiv 2015, arXiv:1505.07293. [Google Scholar]
  69. Jiani, Z. Study on Habitat Diversity of Wetland Park in Winter City Based on Tourists’ Visual Preference. Master’s Thesis, Harbin Institute of Technology, Harbin, China, 2020. [Google Scholar]
  70. Dearden, P. Public participation and scenic quality analysis. Landsc. Plan. 1981, 8, 3–19. [Google Scholar] [CrossRef]
  71. Ulrich, R.S. View through a window may influence recovery from surgery. Science 1984, 224, 420–421. [Google Scholar] [CrossRef] [Green Version]
  72. Stephen R., K.; Wilson, E.O. The Biophilia Hypothesis; Island Press: Washington, DC, USA, 1993. [Google Scholar]
  73. Clay, G.R.; Smidt, R.K. Assessing the validity and reliability of descriptor variables used in scenic highway analysis. Landsc. Urban Plan. 2004, 66, 239. [Google Scholar] [CrossRef]
  74. Arriaza, M.; Cañas-Ortega, J.F.; Cañas-Madueño, J.A.; Ruiz-Aviles, P. Assessing the visual quality of rural landscapes. Landsc. Urban Plan. 2004, 69, 115–125. [Google Scholar] [CrossRef]
  75. Fontana, S.; Sattler, T.; Bontadina, F.; Moretti, M. How to manage the urban green to improve bird diversity and community structure. Landsc. Urban Plan. 2011, 101, 278–285. [Google Scholar] [CrossRef]
  76. Tyrväinen, L.; Kirsi, M.; Jasper, S. Tools for mapping social values of urban woodlands and other green areas. Landsc. Urban Plan. 2007, 79, 5–19. [Google Scholar] [CrossRef]
  77. Hurtado-M, A.B.; Echeverry-Galvis, M.Á.; Salgado-Negret, B.; Muñoz, J.C.; Posada, J.M.; Norden, N. Little trace of floristic homogenization in peri-urban Andean secondary forests despite high anthropogenic transformation. J. Ecol. 2021, 109, 1468–1478. [Google Scholar] [CrossRef]
  78. Fjellstad, W.; Eiter, S.; Puschmann, O.; Krøgli, S.O. Planning the first view: Establishing a landscape monitoring scheme based on photography. Landsc. Urban Plan. 2022, 226, 104470. [Google Scholar] [CrossRef]
  79. Davidowitz, G.; Rosenzweig, M.L. The latitudinal gradient of species diversity among North Ameri-can grasshoppers (Acrididae) within a single habitat: A test of the spatial heterogeneity hypothesis. J. Biogeogr. 1998, 25, 553–560. [Google Scholar] [CrossRef]
  80. Orians, G.H. Habitat selection: General theory and applications to human behavior. In The Evolution of Human Social Behavior; Oxford University Press: Oxford, UK, 1980. [Google Scholar]
  81. Tang, F.; Yang, J.; Wang, Y.; Ge, Q. Analysis of the Image of Global Glacier Tourism Destinations from the Perspective of Tourists. Land 2022, 11, 1853. [Google Scholar] [CrossRef]
  82. Karasov, O.; Heremans, S.; Külvik, M.; Domnich, A.; Burdun, I.; Kull, A.; Helm, A.; Uuemaa, E. Beyond land cover: How integrated remote sensing and social media data analysis facili-tates assessment of cultural ecosystem services. Ecosyst. Serv. 2022, 53, 101391. [Google Scholar] [CrossRef]
  83. Choi, H.; Kim, H.; Nam, B.E.; Bae, Y.J.; Kim, J.G. Effect of initial planting on vegetation establishment in different depth zones of constructed farm ponds. Restor. Ecol. 2021, 30, e13488. [Google Scholar] [CrossRef]
  84. Tveit, M.S. Indicators of visual scale as predictors of landscape preference; a comparison between groups. J. Environ. Manag. 2009, 90, 2882–2888. [Google Scholar] [CrossRef]
Figure 1. Location of the four urban wetland parks.
Land 11 02284 g001
Figure 2. This shows the process for achieving the research objectives.
Land 11 02284 g002
Figure 3. Photo element recognition statistics.
Land 11 02284 g003
Figure 4. Focus on landscape elements in the four seasons (F1: the element with the highest attention from tourists, S2: the element with relatively little attention, T3: the element with little attention).
Land 11 02284 g004
Figure 5. The four seasons focus on landscape elements.
Land 11 02284 g005
Figure 6. Analysis of views of 4 urban wetland parks.
Land 11 02284 g006
Table 1. Basic information about the four wetland parks.
Park NameTotal Area (m2)Wetland Area (m2)Wetland Type
Harbin Qunli342,000231,000Natural wetlands, Artificial wetlands
Cultural Center1,180,000553,000Swamp meadow, Prairie meadow
Changchun Beihu11,970,0003,765,000Rivers, Lakes, Swamps, Constructed wetlands
Changchun Nanxi310,000112,000Constructed wetlands, River wetlands
Table 2. Visual preference metrics and scoring principles [69].
Measure ValueDefinitionCalculationReferences
NaturalnessNaturalness of vegetationNatural Vegetation Proportion 0–25% = 0; 25–50% = 1; 50–75% = 2; 75–100% = 3Kaplan and Kaplan (1989) [30] Ulrich (1984) [71]
DiversityRich landscape elementsNumber of landscape elements per viewKellert and Wilson (1993) [72]
WildernessDegree of artificial constructionHouse + road + other = 0; few artificial independent elements = 1; wetlands with no artificial elements = 2; wild vegetation = 3Clay and Smidt (2004) [73]
Temporality(1) Landscape properties with seasonal changes
(2) Landscape attributes (water) with weather characteristics
No time difference = 0; multi-season landscape = 1; single-season landscape = 2; meteorological landscape = 3Kaplan and Kaplan(1989) [30]
Ulrich (1984) [71]
Positive artificial elementArtificial landscape and local architectureNone = 0; 1 element = 1; 2 elements = 2; 3 elements and more = 3Arriaza M (2004) [74]
Negative artificial elementHighways, industrial facilities, electrical wiringNone = 0; 1 element = 1; 2 elements = 2; 3 elements and more = 3Arriaza M (2004) [74]
Table 3. Classification standard of habitat units in urban wetland parks [25].
Habitat Unit TypeDescription of Habitat Indicators Scale Standard
Area elements/m2
(1)
Natural stand (natural or semi-natural forest vegetation)
(2)
Scrub (shrub)
(3)
Grass (herb)
(4)
Tall vegetation (including reeds)
(5)
Hydrological elements (waters)
(6)
Islands
(7)
Parking lot (place where vehicles are parked)
Deciduous forest (deciduous forest)
mixed forest
Length < 10 m, area > 100 m2
Linear elements/m
(1)
Roads (belts for pedestrians and traffic services)
(2)
Tree column (trees planted in column)
(3)
Long span bridge
(4)
Landscape wall, etc.
Roads with a width of ≥2 m (main road, secondary road);Roads with a width of less than 2 m (plank roads, grass walks, air corridors); Shelter forest, street tree column≥10 m
Point element/piece
(1)
Single tree or shrub
(2)
Shallow water and sports fields within 100 m2
(3)
Infrastructure
Buildings, pavilions, sculptures, monuments<100 m2
Table 4. Test statistics a,b.
MenBuildingsStructuresFacilitiesCement RoadWooden WALKWAYStepsAerial BOARDWALKSkyWater SurfaceTreesLawnsHerbaceous PlantShrubHydrophyte
Kruskal–Wallis H128.422206.658151.46836.50814.757104.89023.182220.398157.619172.547259.91875.938158.26026.72273.424
df333333333333333
Asymp. Sig.0.0000.0000.0000.0000.0000.0000.0000.0000.0000.0000.0000.0000.0000.0000.000
a. Kruskal–Wallis Test. b. Grouping variable: type
Table 5. The correlation between the habitat diversity of the samples and the measure of visual preference [69].
Habitat SaturationLandscape ComplexityHabitat Diversity
Naturalness0.2390.0140.355 *
Diversity0.113−0.0230.186
Wilderness0.211−0.313 *−0.186
Temporality0.225−0.514 **−0.419 **
Positive artificial element0.487 **−0.2180.304 *
Negative artificial element0.099−0.170−0.129
Visual scale0.088−0.174−0.011
* p < 0.05 ** p < 0.01.
Publisher’s Note: MDPI stays neutral with regard to jurisdictional claims in published maps and institutional affiliations.

