

Exploring the Role of Deforestation and Cropland Expansion in Driving a Fire-Transition in the Brazilian Amazon
 ,
,
Abstract
:1. Introduction
2. Materials and Methods
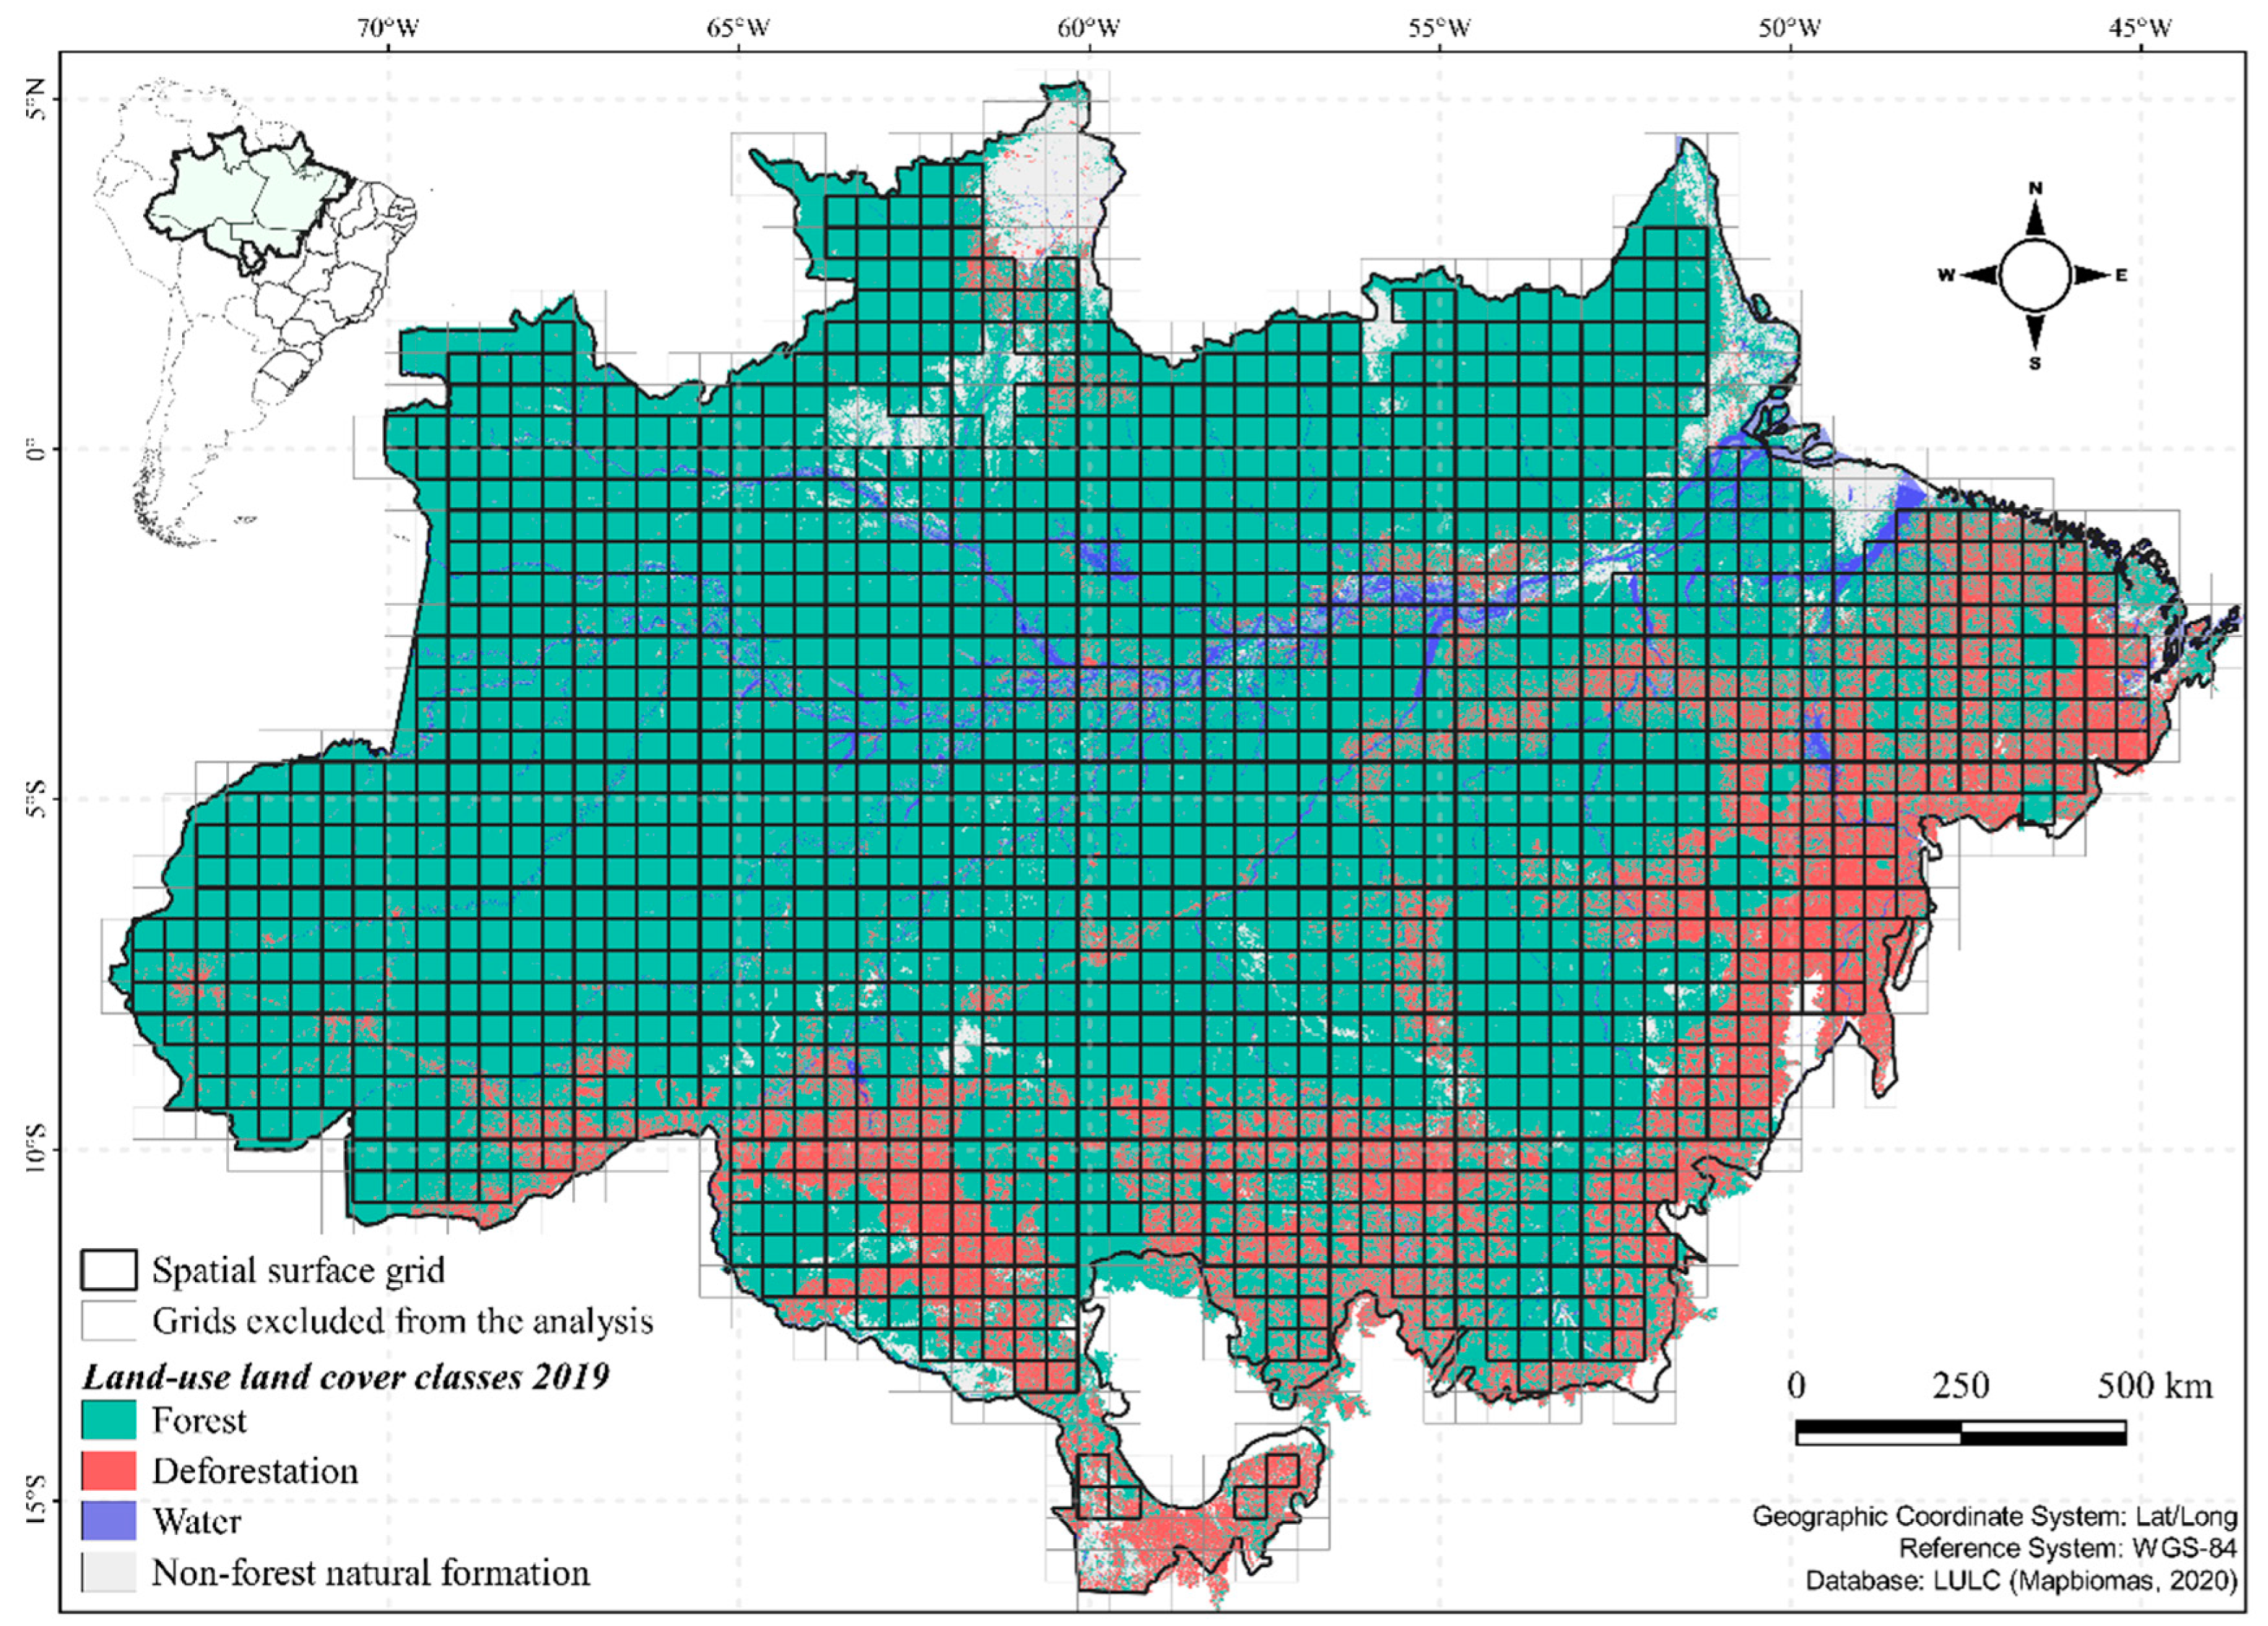
2.1. Study Area
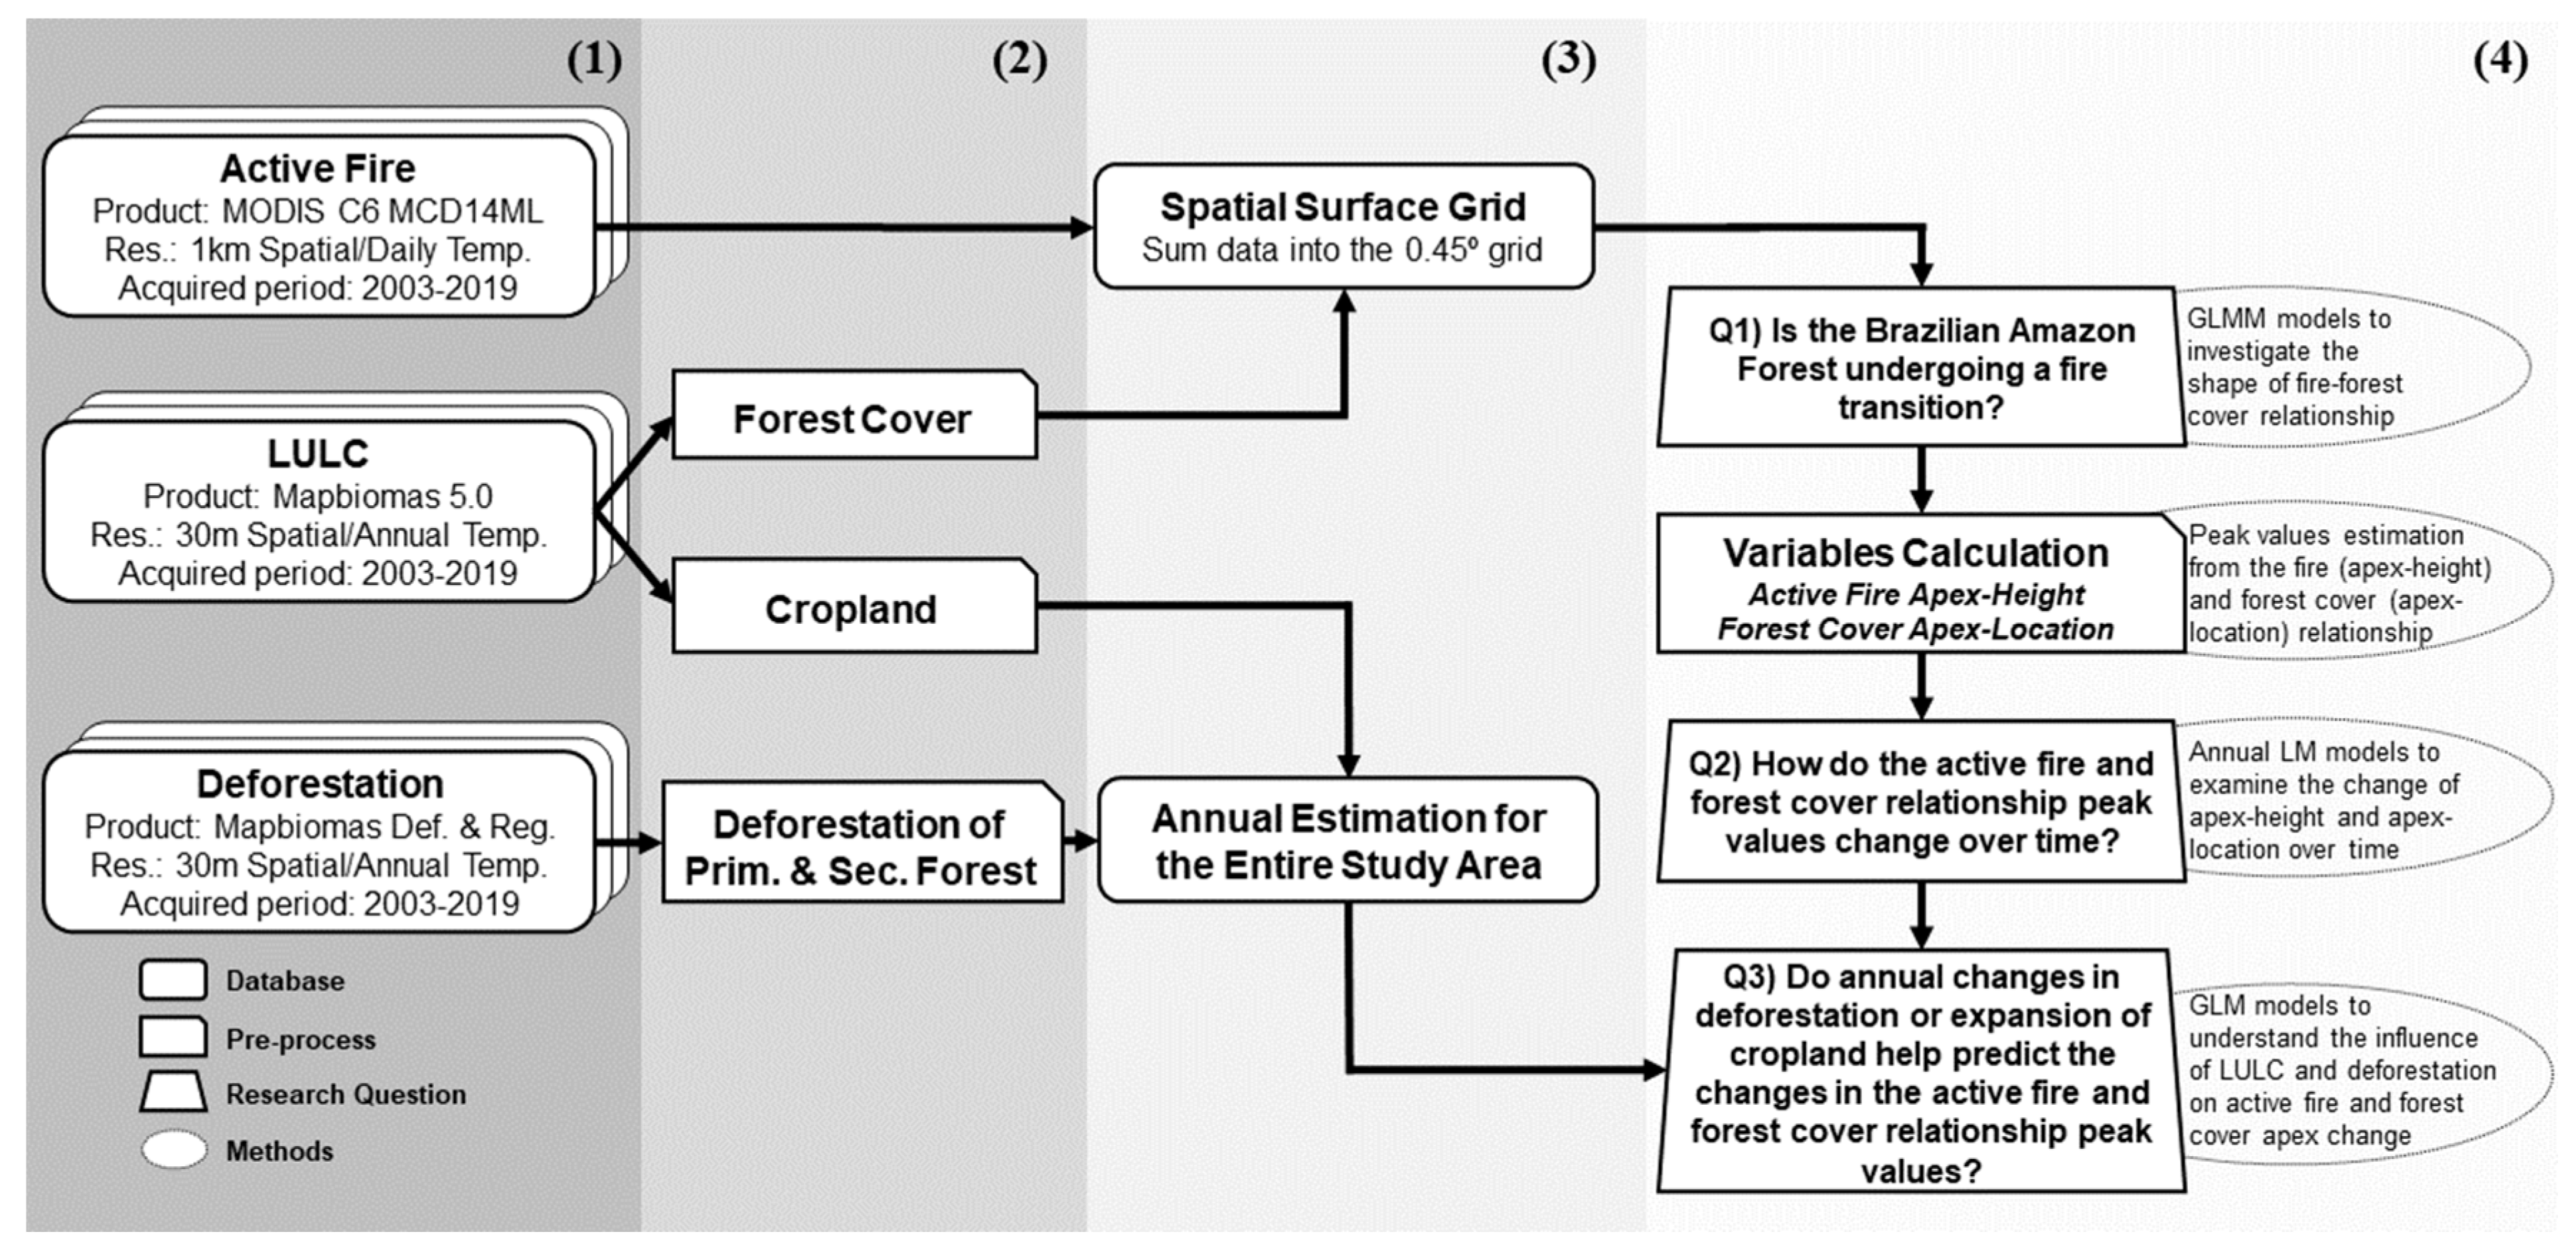
2.2. Datasets
2.2.1. Active Fire
2.2.2. Land Use and Land Cover
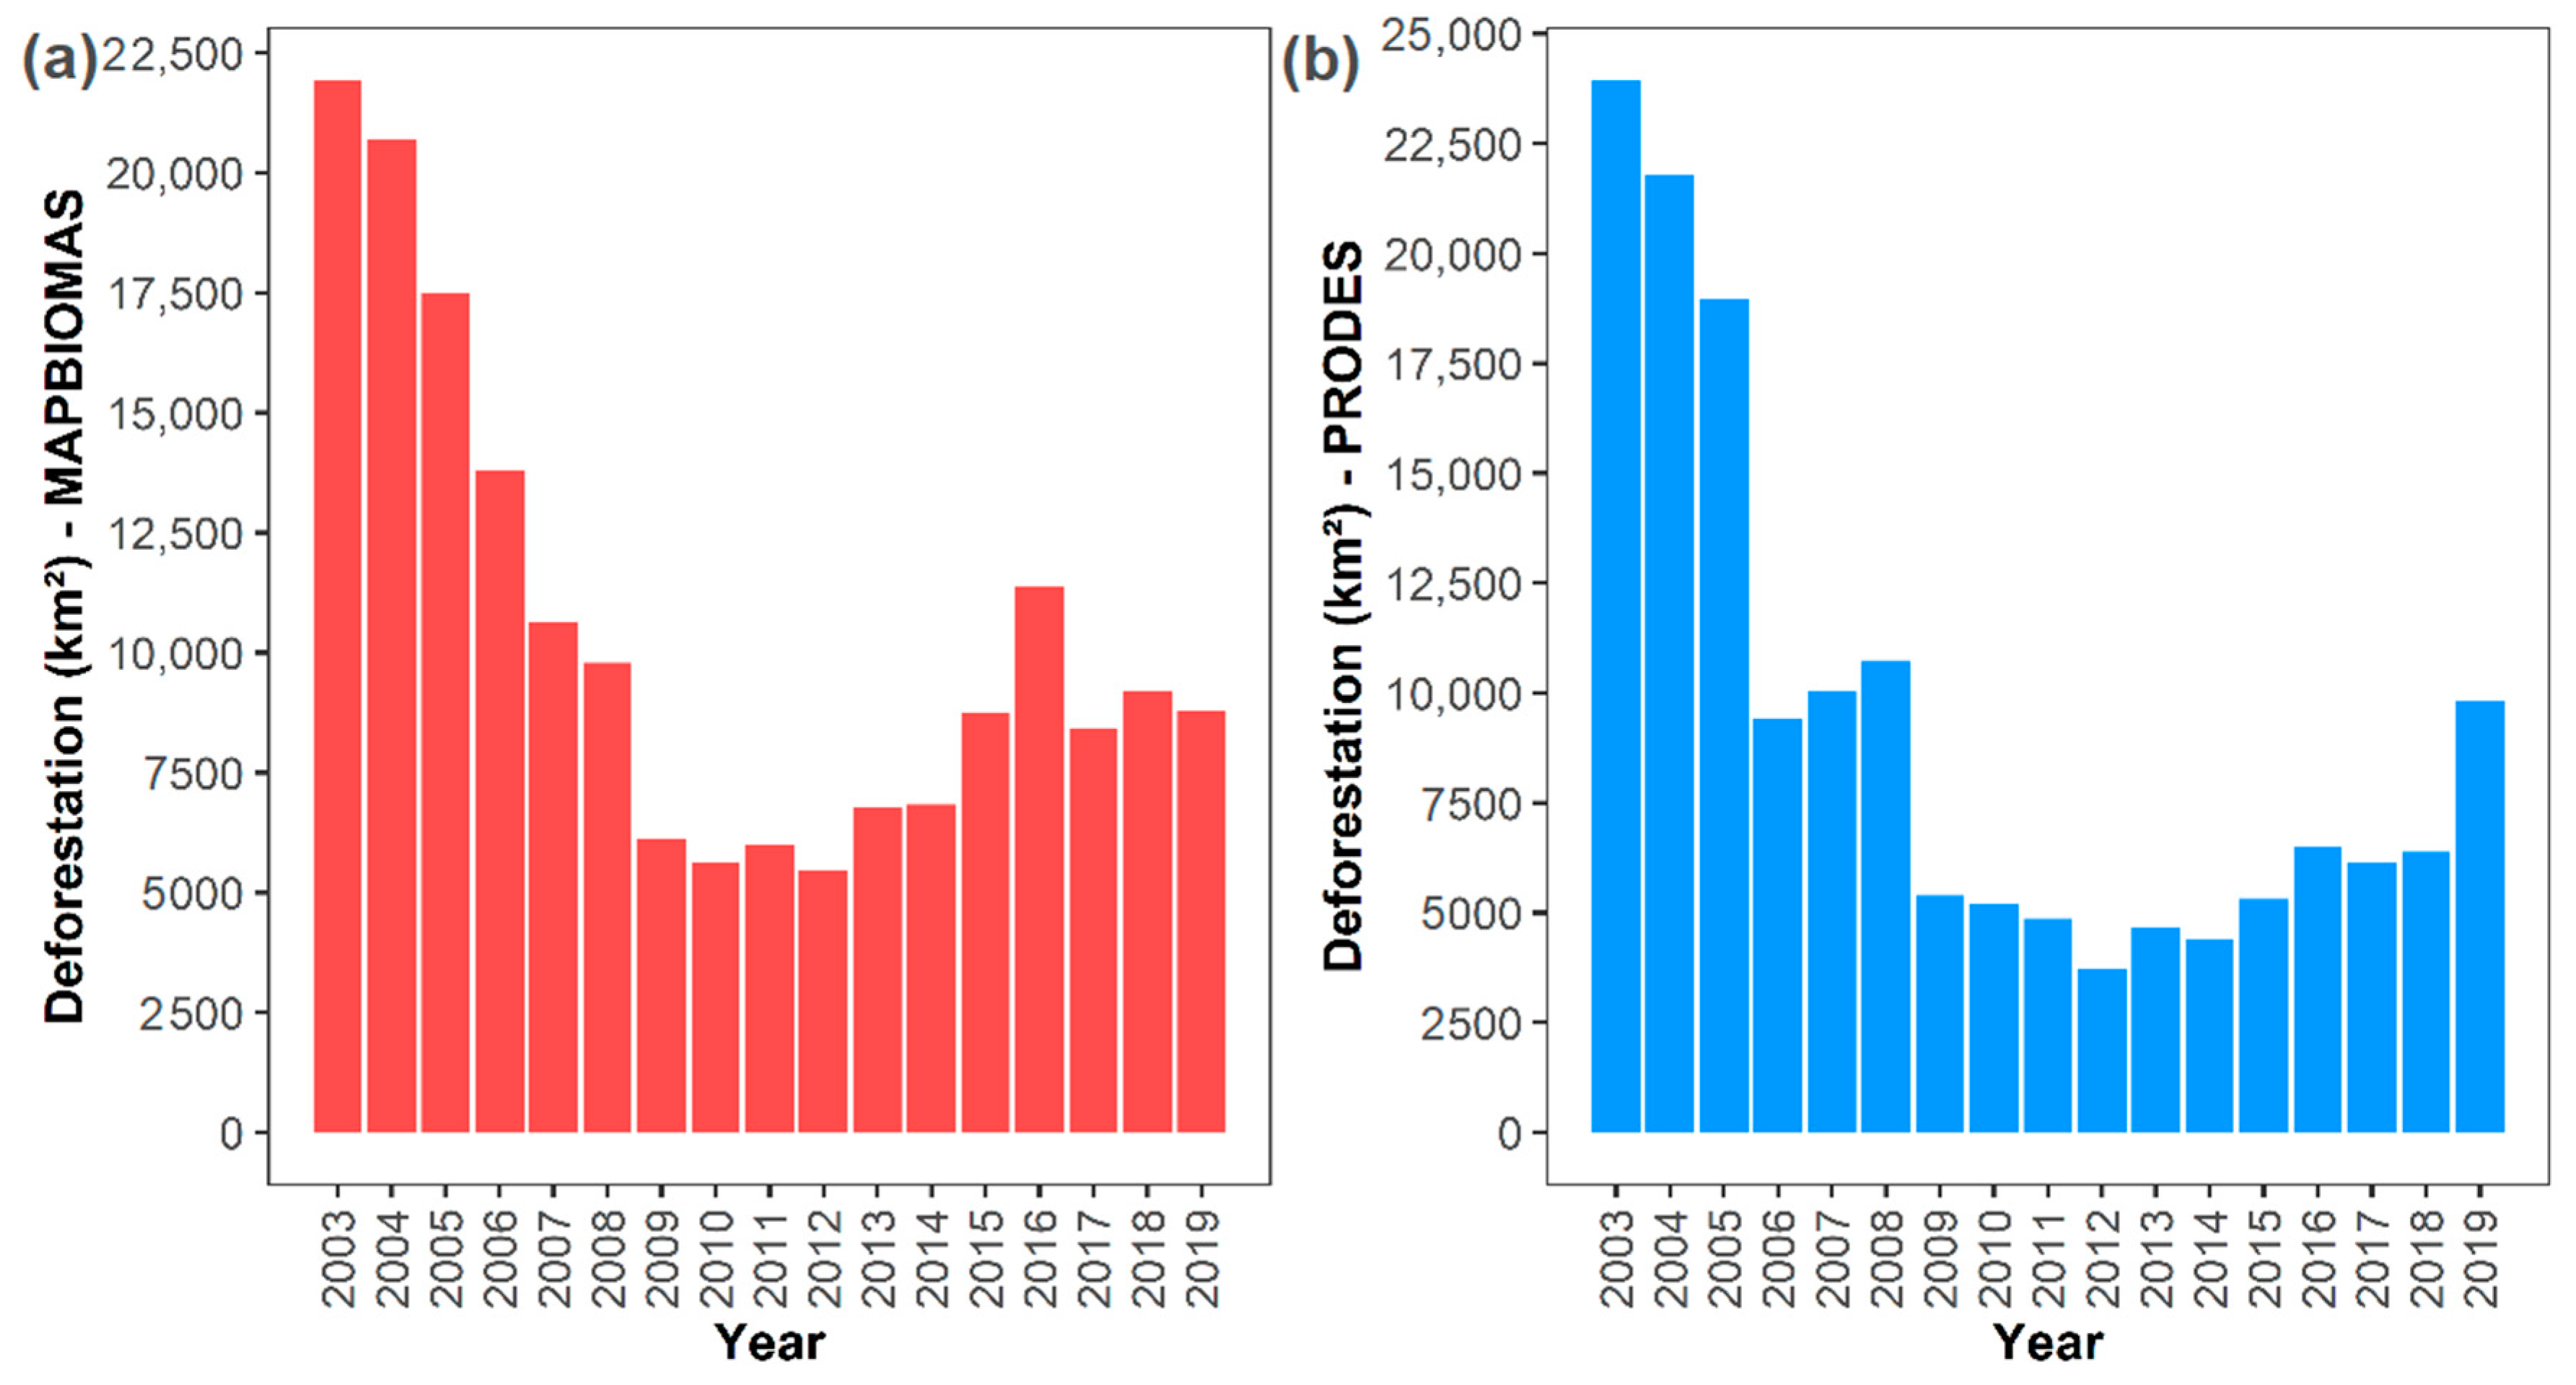
2.2.3. Deforestation
2.3. Data Analysis
3. Results
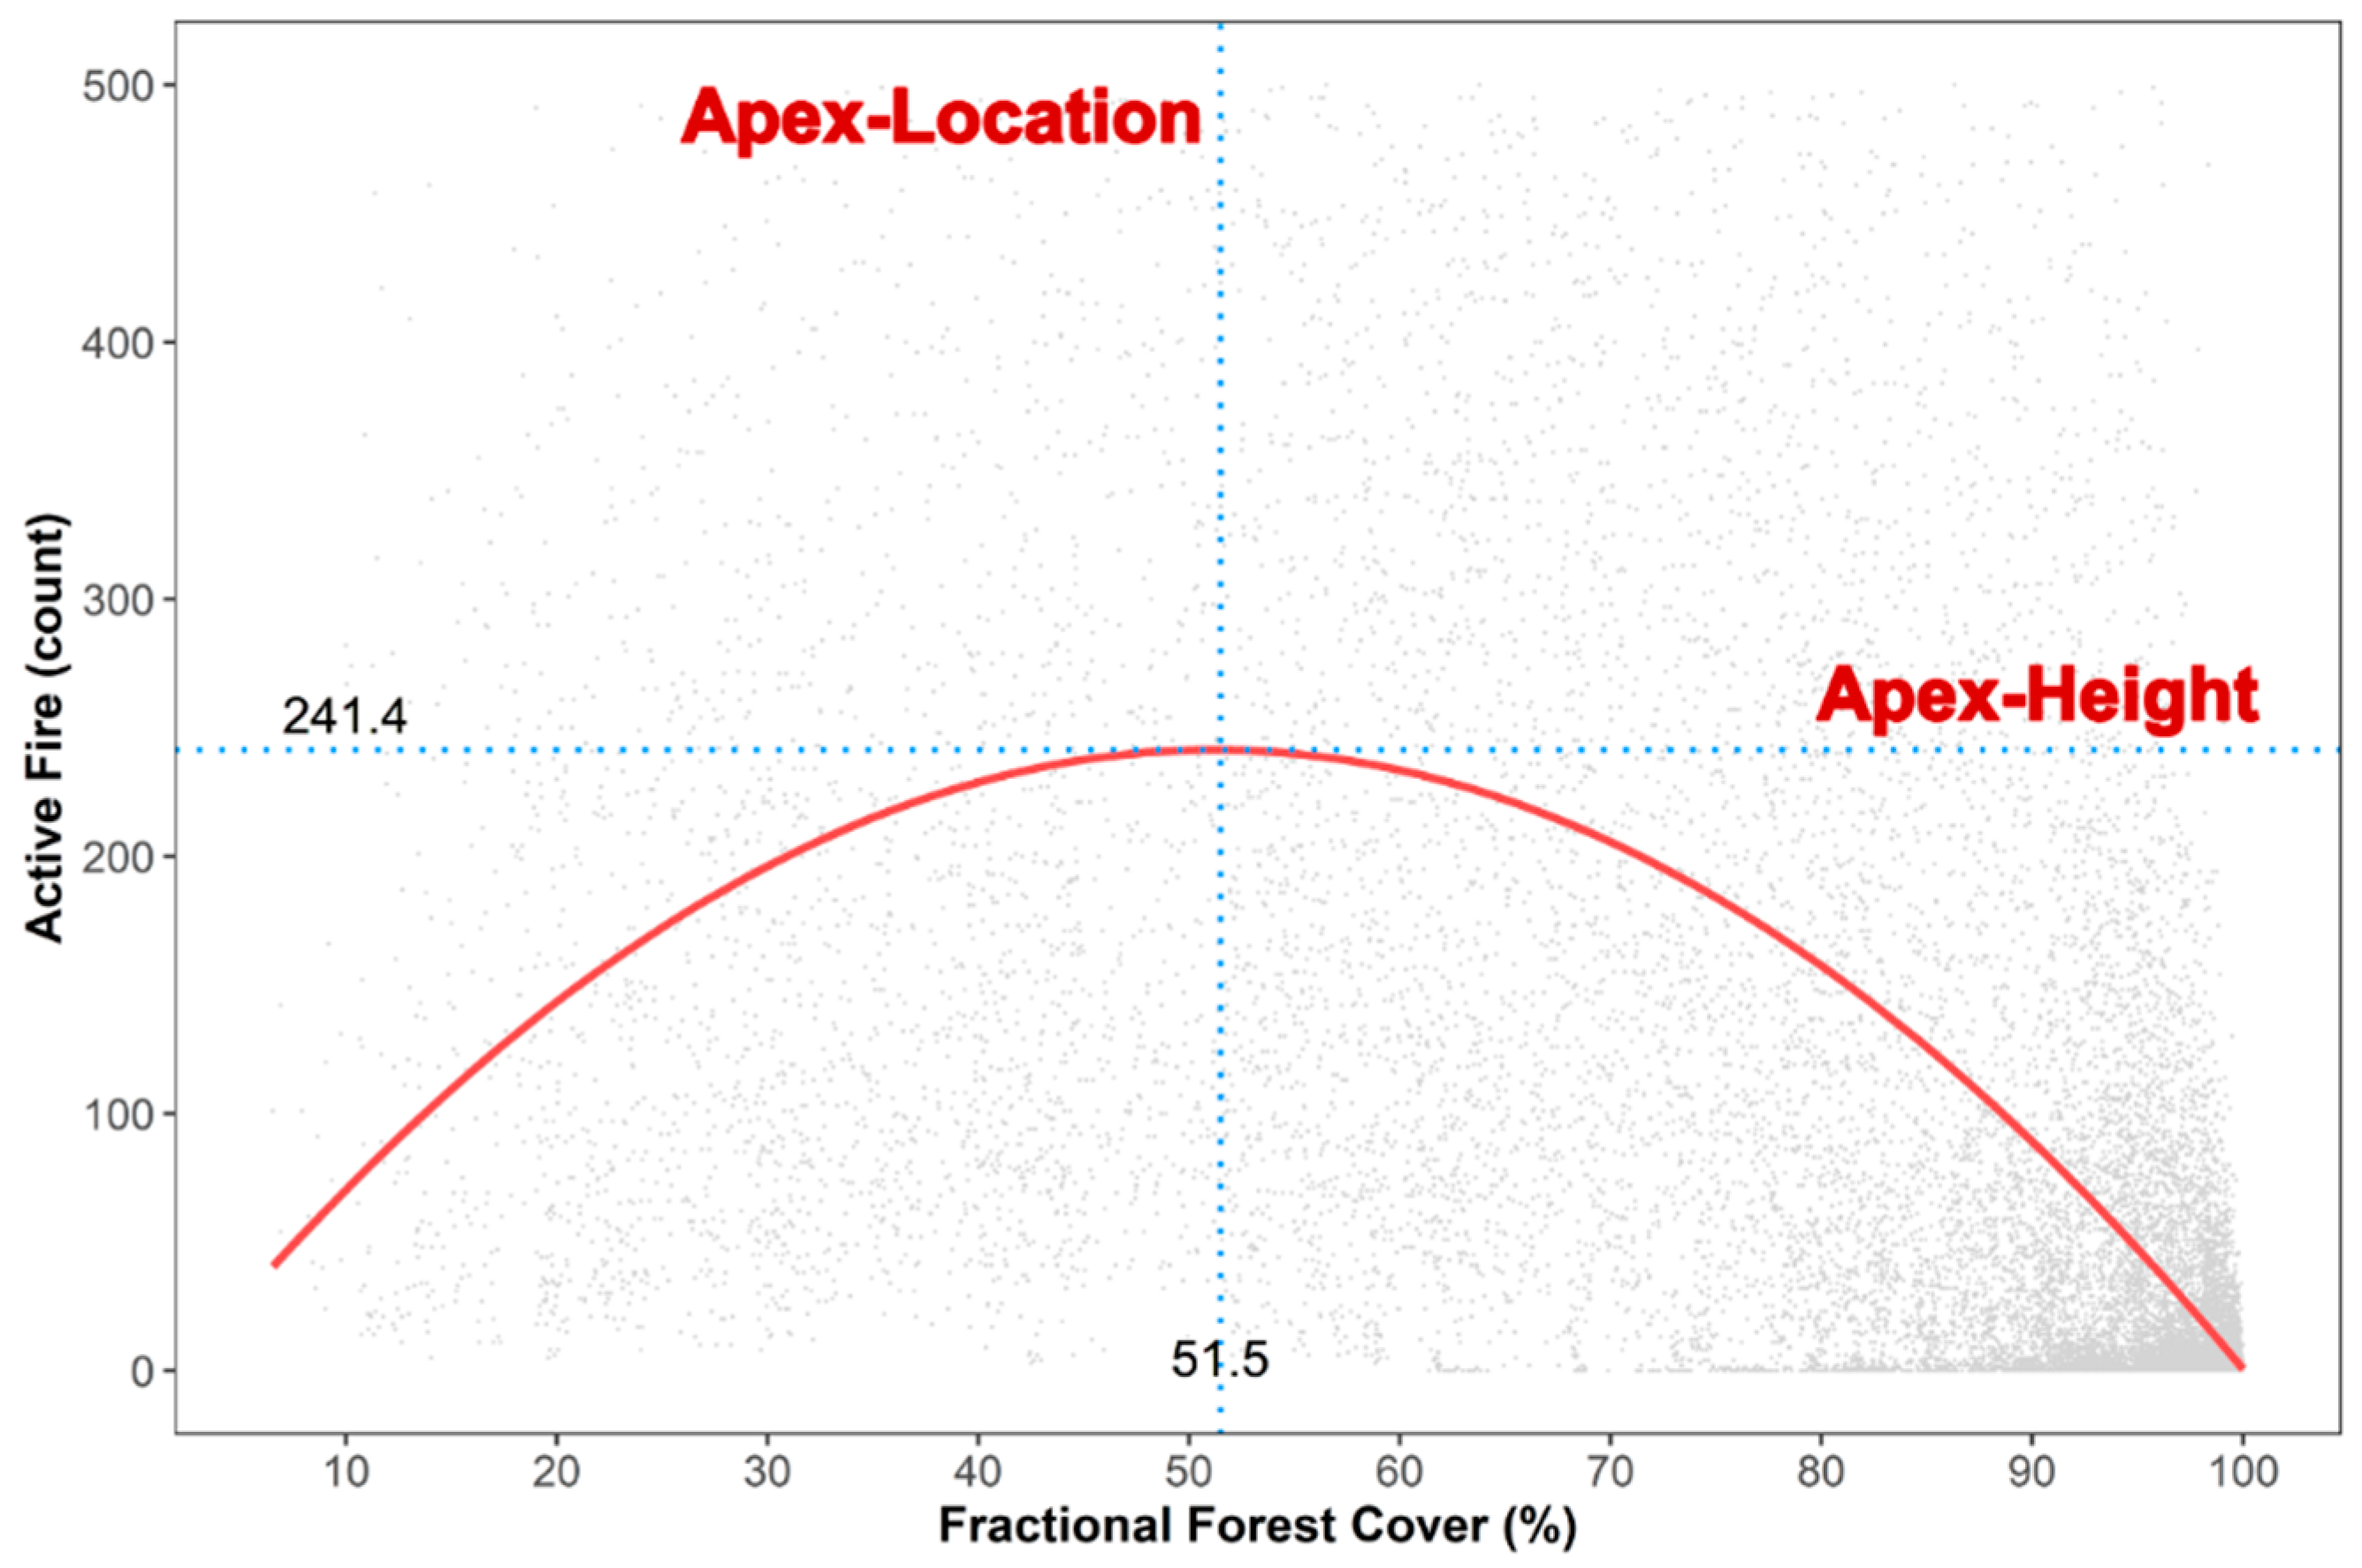
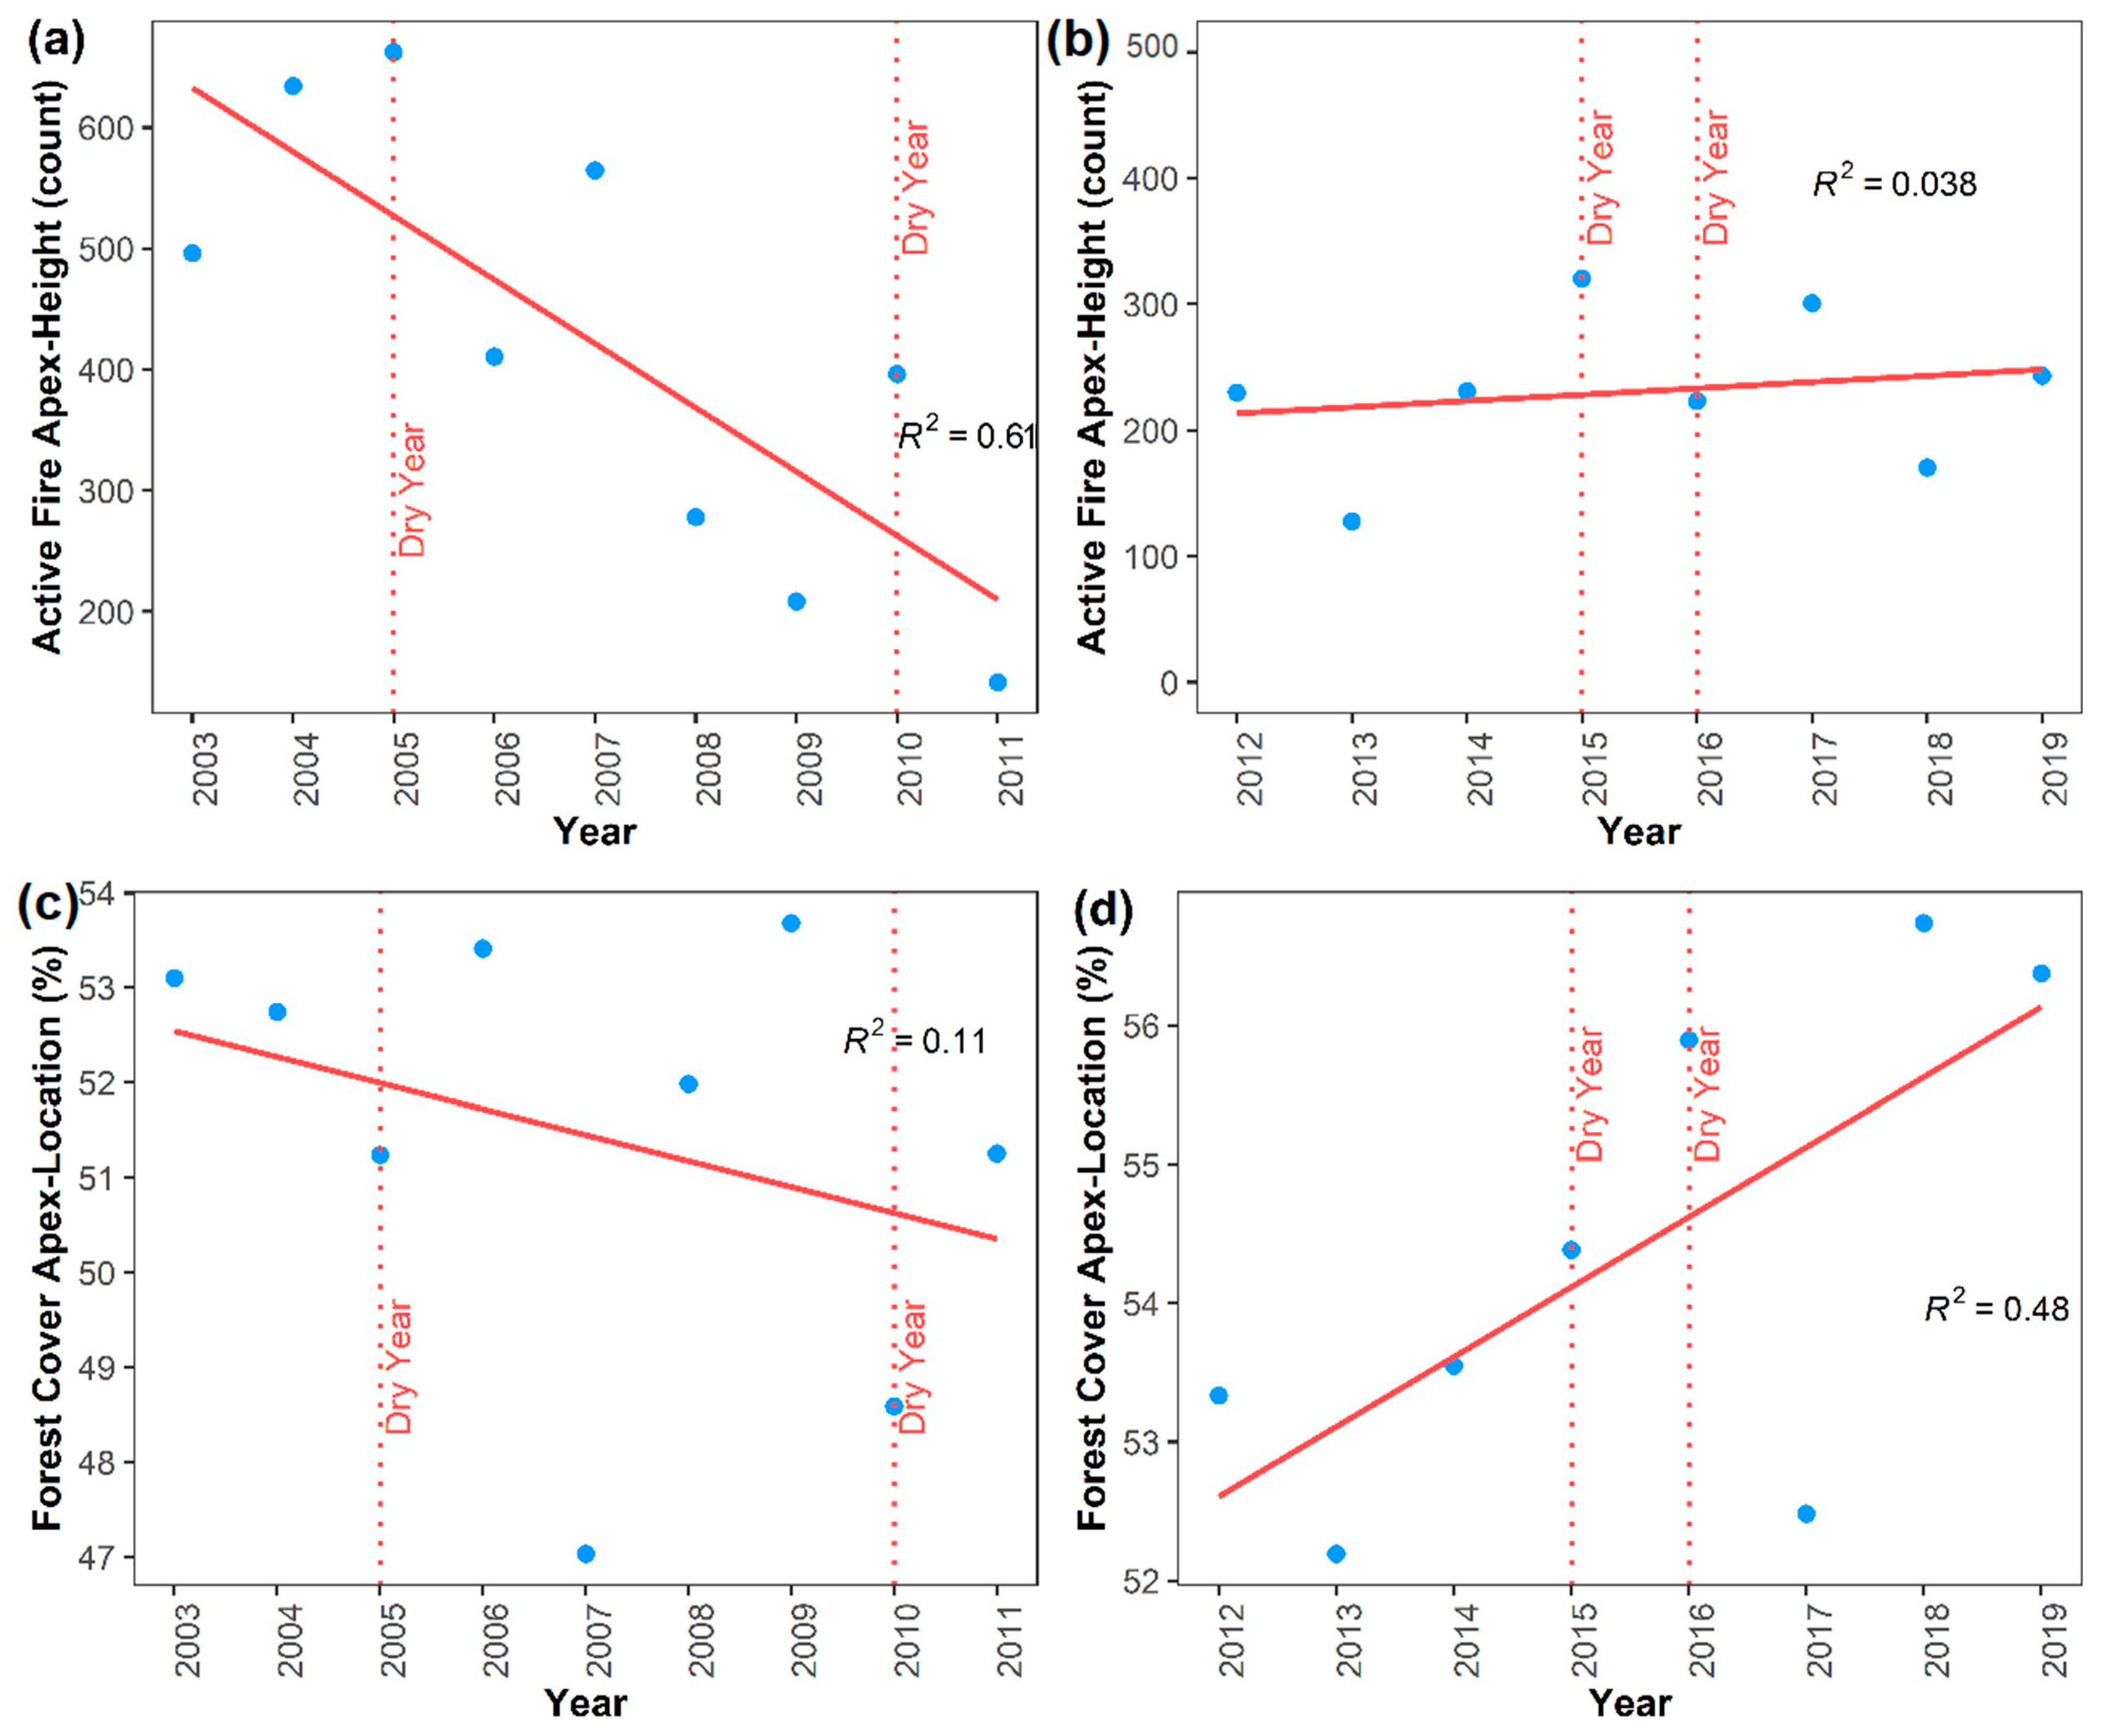
3.1. Analysing an Amazon Fire-Transition
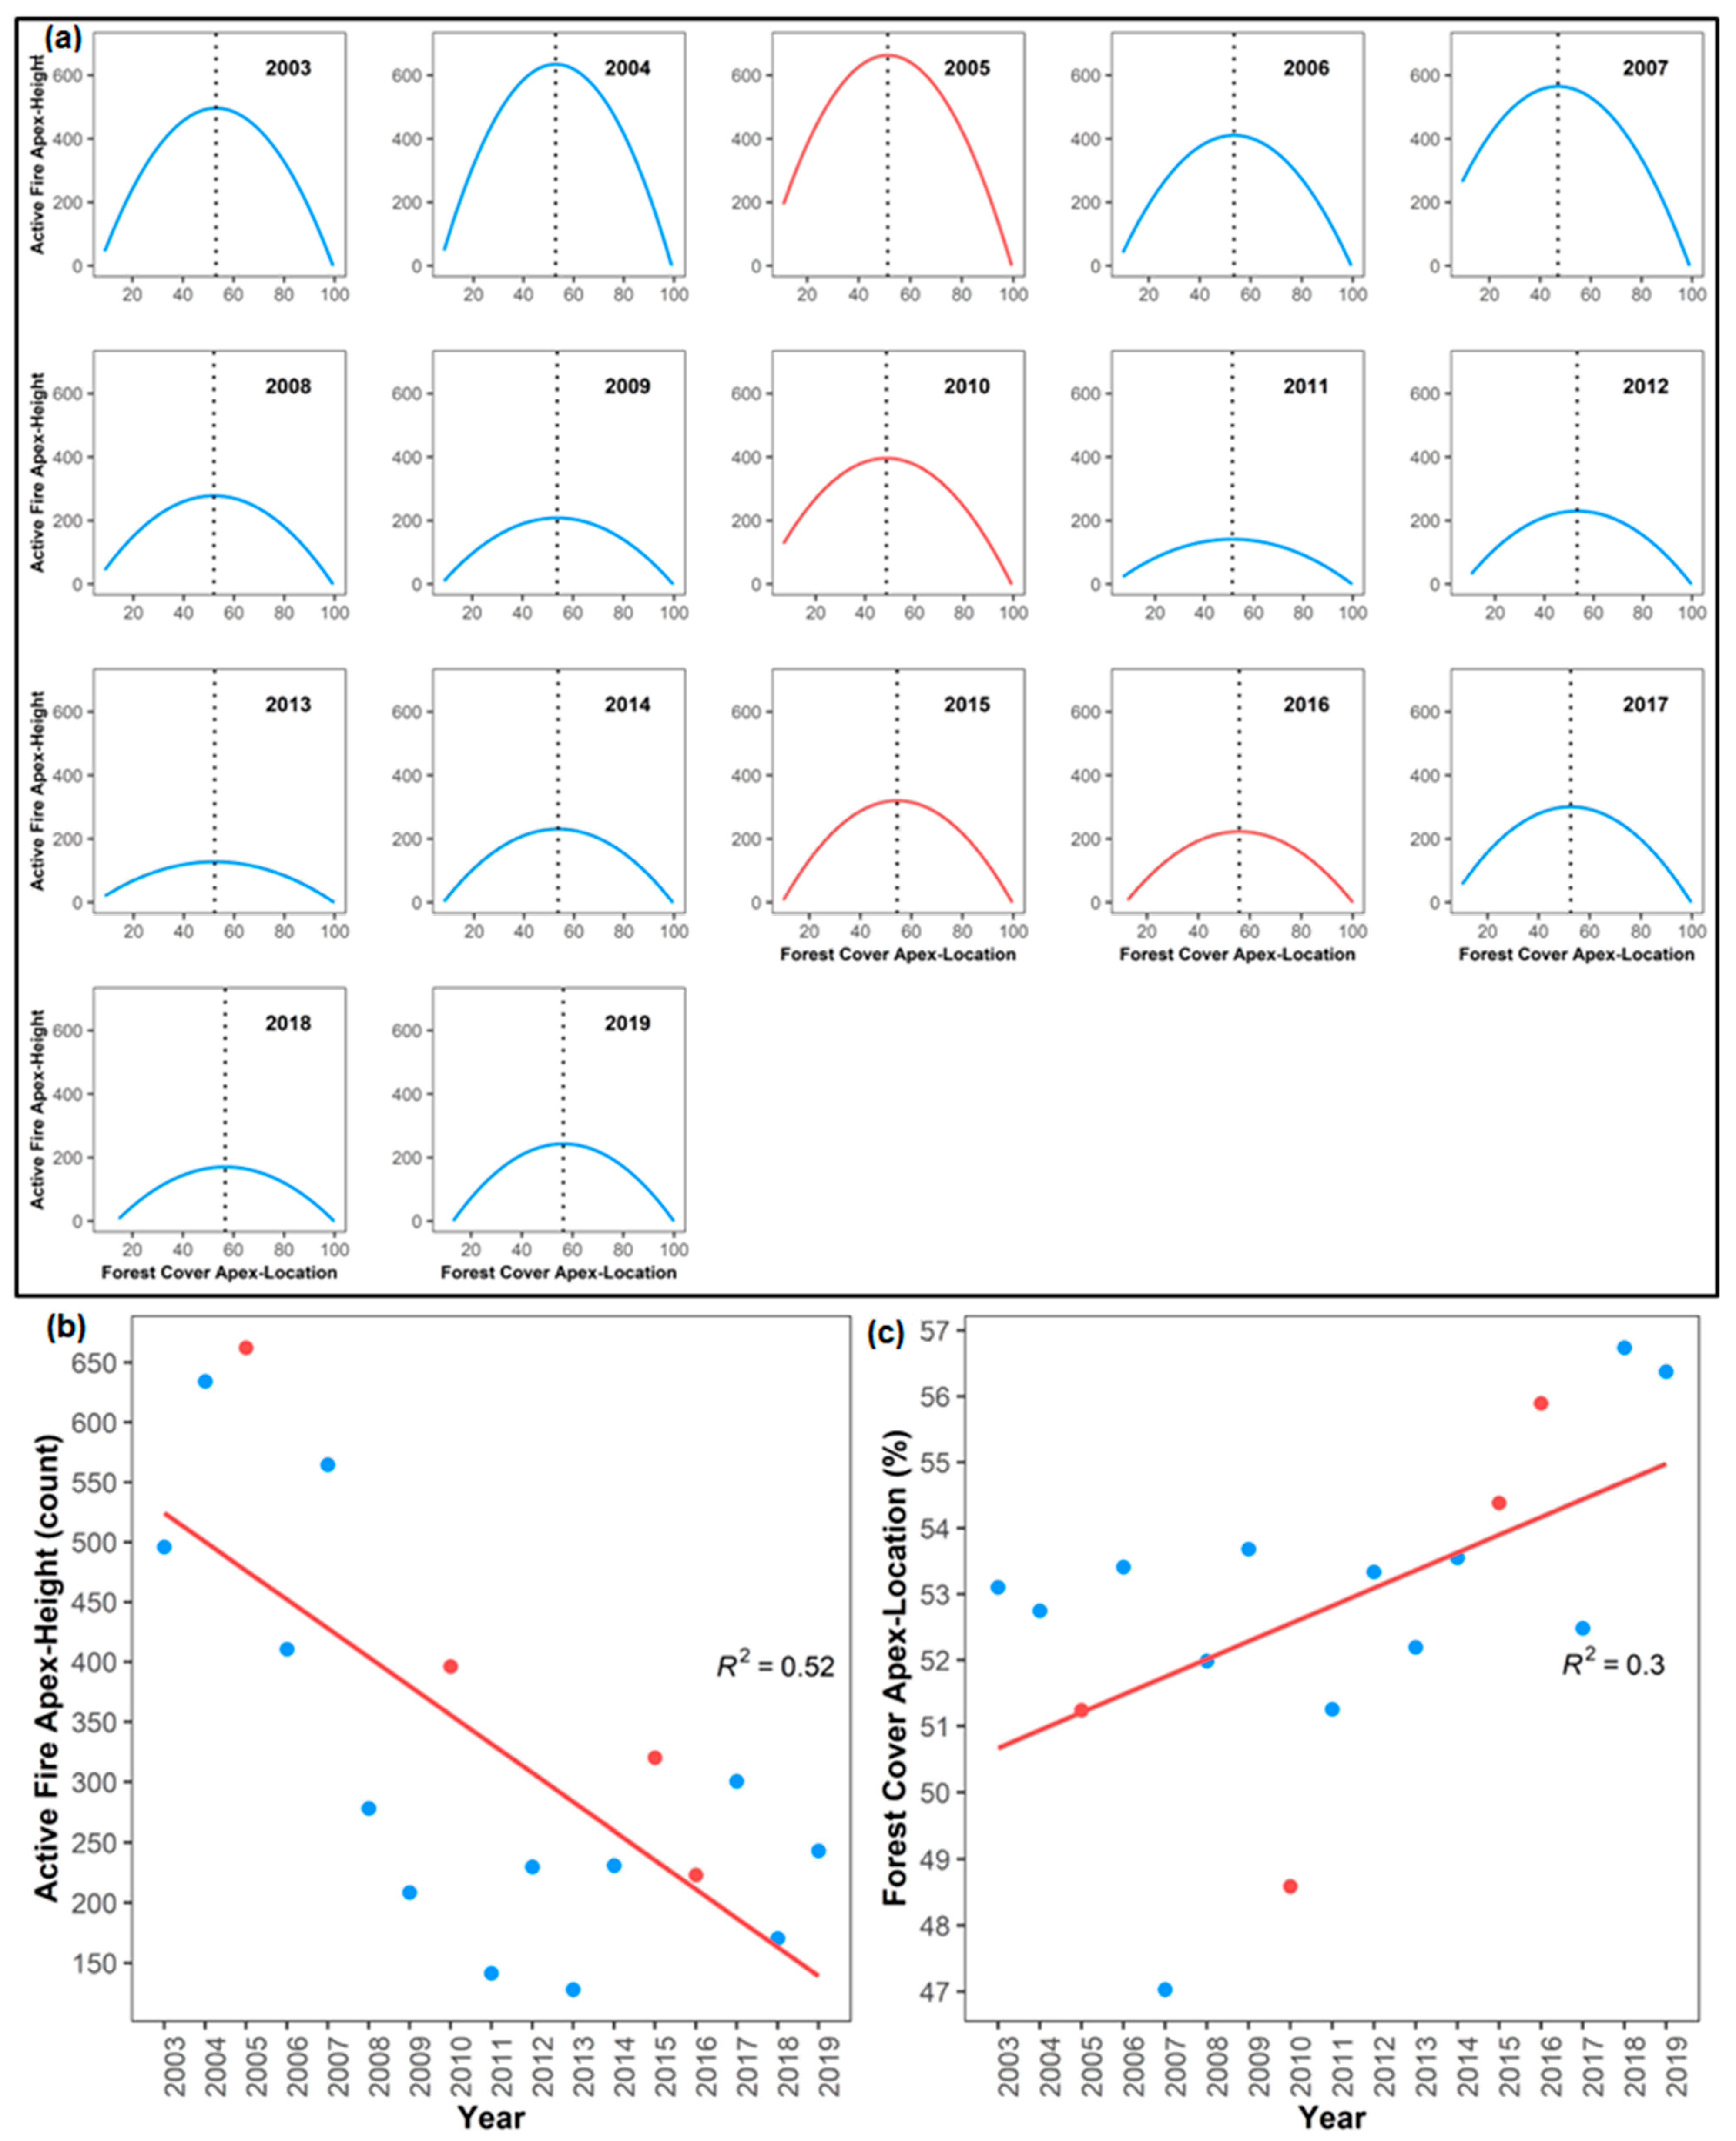
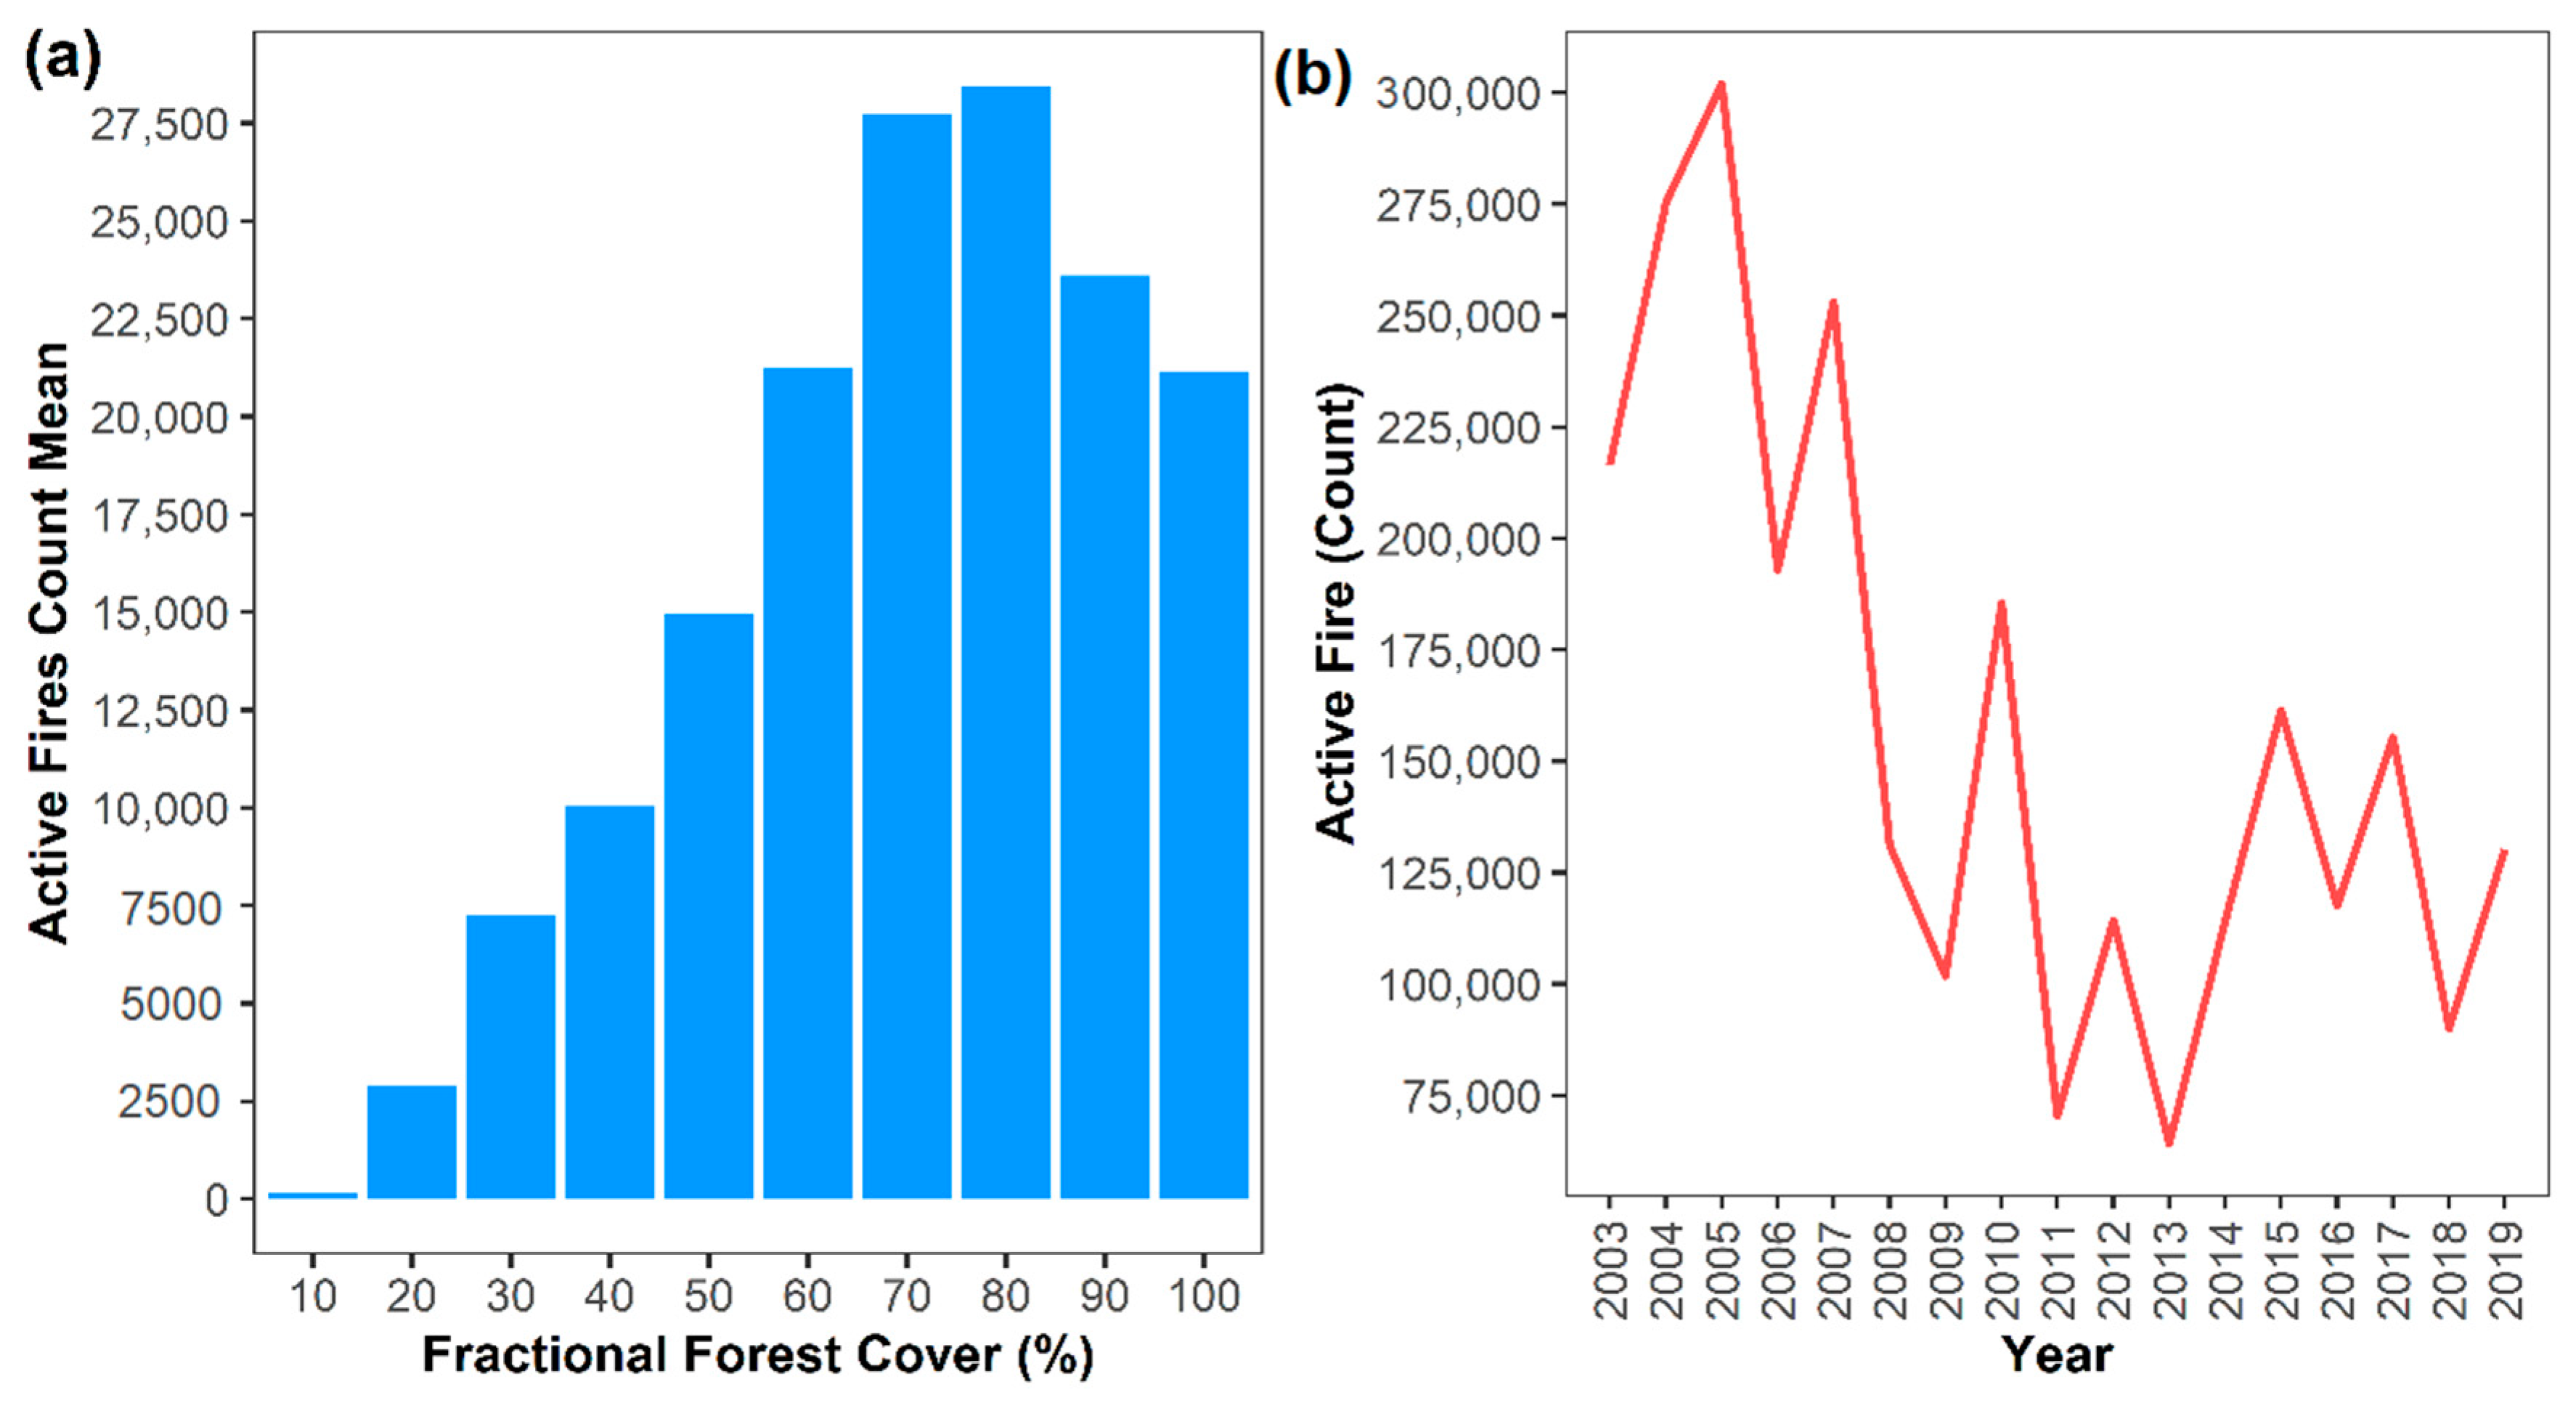
3.2. Key Parameters Defining a Forest Cover-Fire Occurrence Relationship
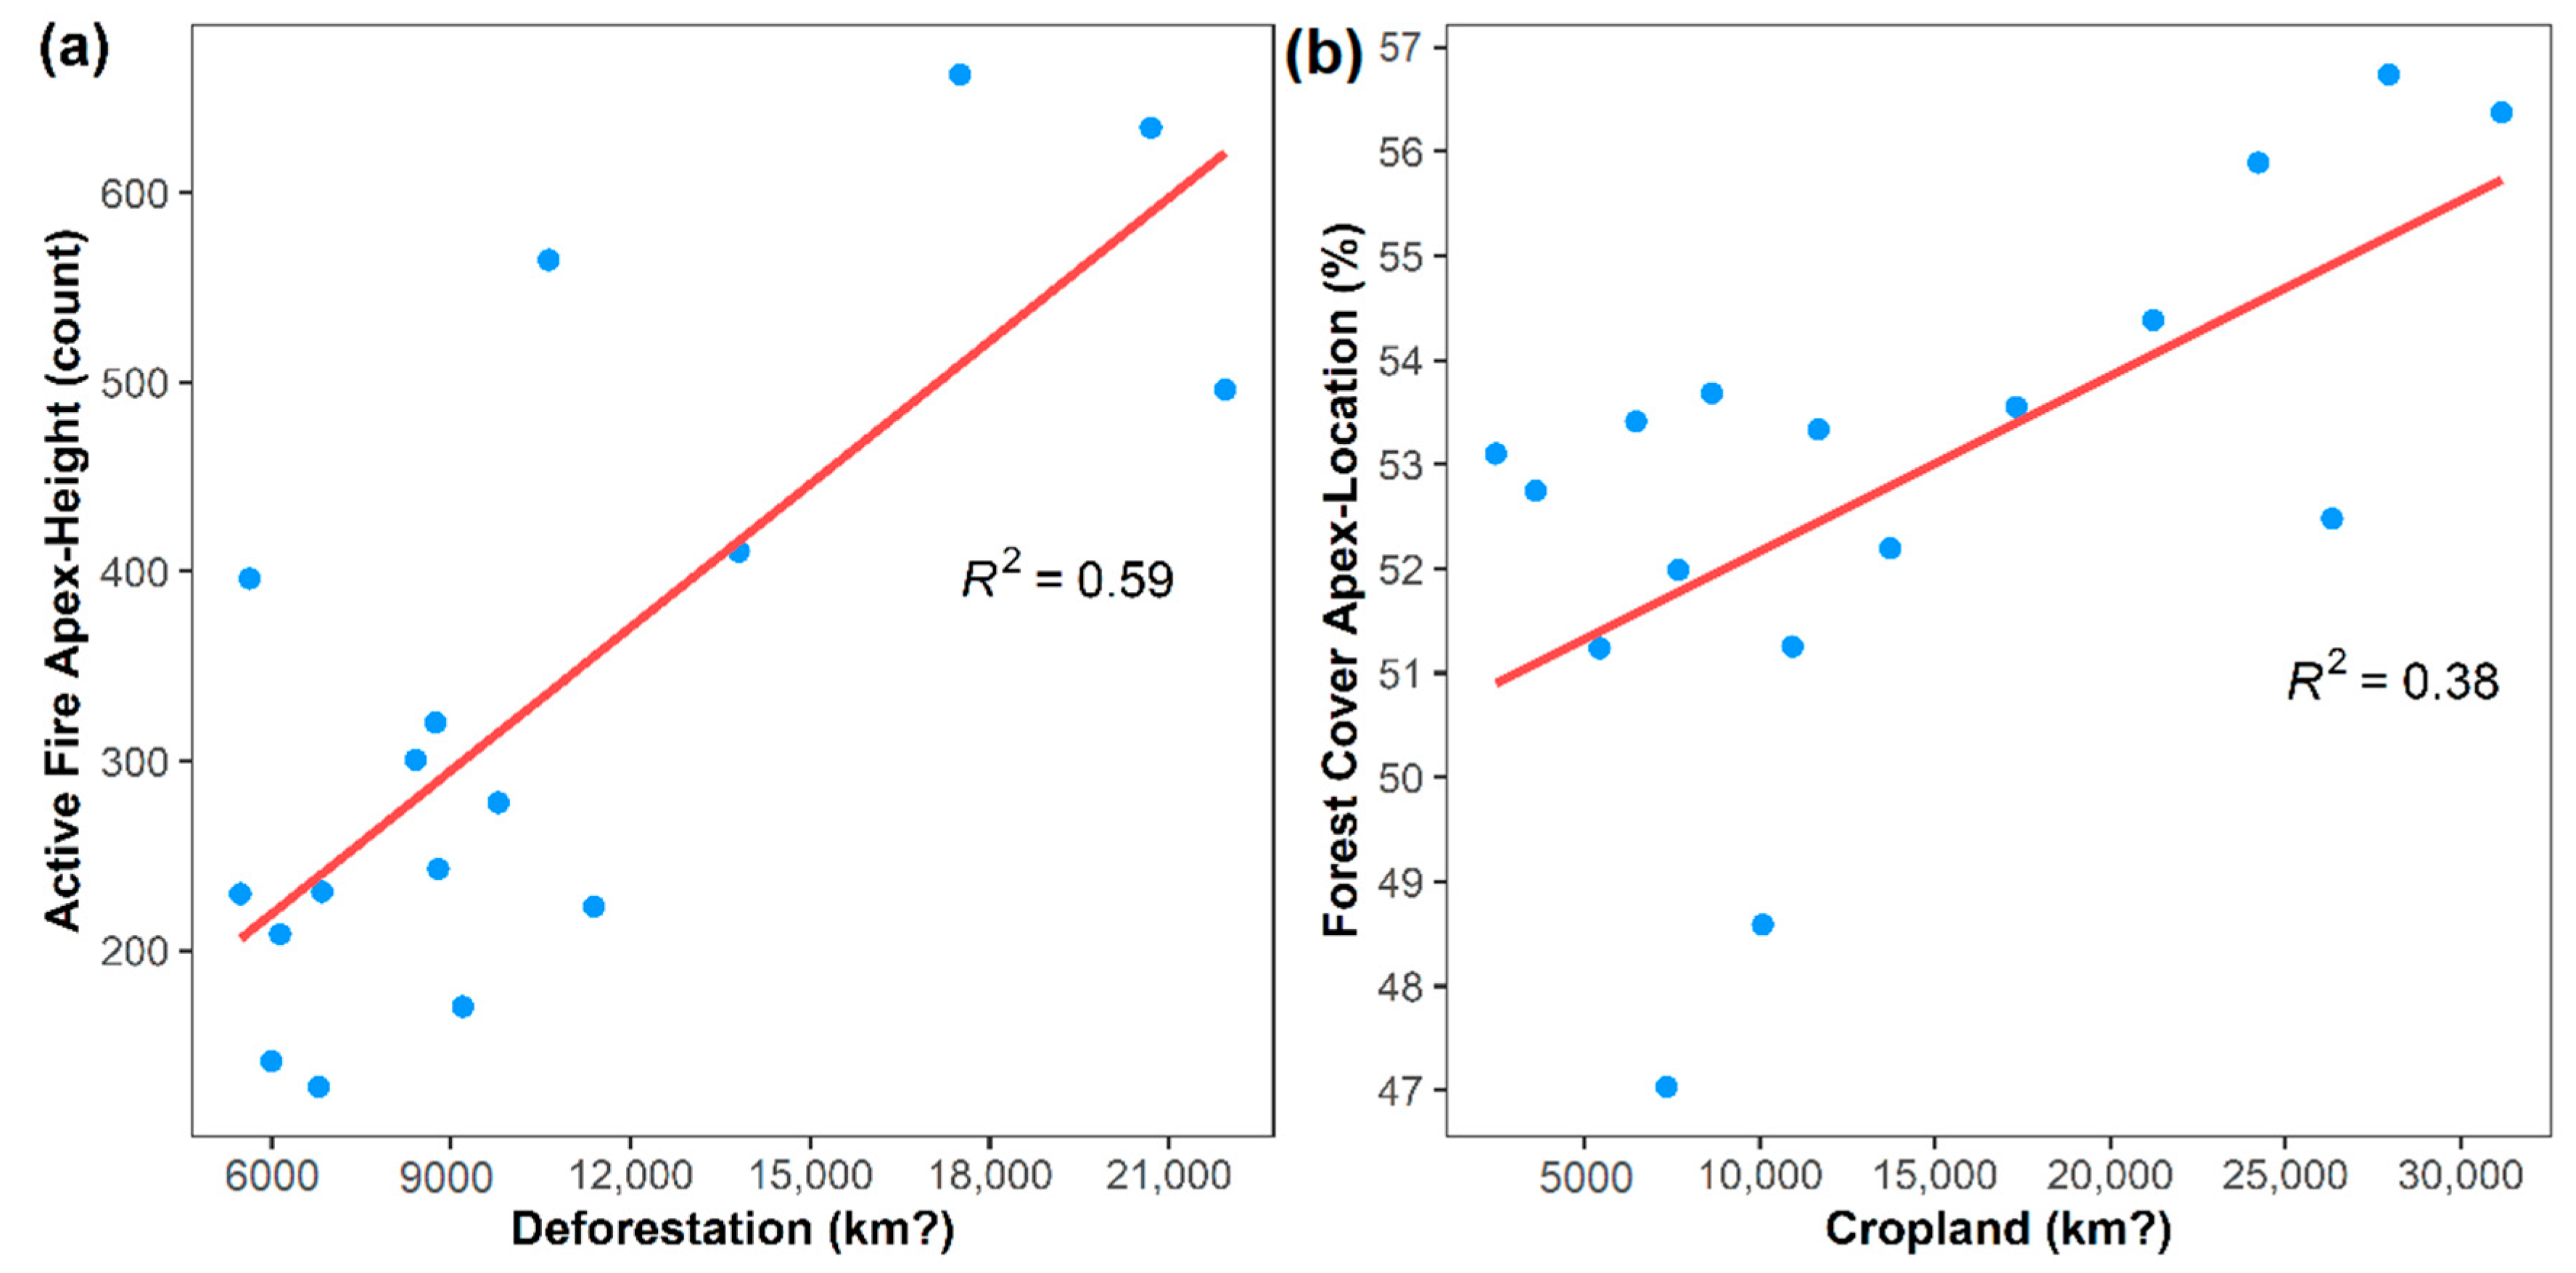
3.3. The Influence of Deforestation Rates and Cropland Expansion on the Forest Cover-Fire Occurrence Relationship
4. Discussion
4.1. Fire-Transition Patterns in Brazilian Amazon
4.2. Spatiotemporal Changes in Fire Occurrence
4.3. Socio-Environmental Implications of the Fire-Transition Relationship with Land-Use Variables in the Brazilian Amazon
5. Conclusions
Author Contributions
Funding
Data Availability Statement
Acknowledgments
Conflicts of Interest
Appendix A


Appendix B

| Dependent Variable | Intercept | Cropland Area | Deforestation Area | Deforestation X Cropland | AICc | Delta | Weight |
|---|---|---|---|---|---|---|---|
| Active Fire Apex-Height 2003–2019 | 68.1341 | NA | 0.0252 | NA | 214.2524 | 0.0000 | 0.5396 |
| 185.1137 | −0.0053 | 0.0210 | NA | 214.8702 | 0.6178 | 0.3962 | |
| 227.6442 | −0.0110 | 0.0176 | 0.0000 | 218.8215 | 4.5690 | 0.0549 | |
| 479.5580 | −0.0106 | NA | NA | 222.6618 | 8.4093 | 0.0081 | |
| 331.6909 | NA | NA | NA | 226.4416 | 12.1892 | 0.0012 | |
| Forest Cover Apex-Location 2003–2019 | 50.4838 | 0.0002 | NA | NA | 78.0671 | 0.0000 | 0.4685 |
| 47.9510 | 0.0002 | 0.0002 | NA | 78.2357 | 0.1686 | 0.4306 | |
| 47.7533 | 0.0002 | 0.0002 | 0.0000 | 82.3456 | 4.2785 | 0.0552 | |
| 52.8240 | NA | NA | NA | 83.1258 | 5.0587 | 0.0373 | |
| 52.7333 | NA | 0.0000 | NA | 86.1093 | 8.0423 | 0.0084 |
| Dependent Variable | Intercept | Cropland Area | Deforestation Area | Deforestation X Cropland | AICc | Delta | Weight |
|---|---|---|---|---|---|---|---|
| Active Fire Apex-Height 2003–2019 | 68.1341 | NA | 0.0252 | NA | 214.2524 | 0.0000 | 0.5024 |
| 217.5720 | −0.0051 | 0.0203 | NA | 214.7015 | 0.4490 | 0.4014 | |
| 339.4363 | −0.0152 | 0.0099 | 0.0000 | 217.8758 | 3.6234 | 0.0821 | |
| 531.5038 | −0.0103 | NA | NA | 221.5704 | 7.3179 | 0.0129 | |
| 331.6909 | NA | NA | NA | 226.4416 | 12.1892 | 0.0011 | |
| Forest Cover Apex-Location 2003–2019 | 46.5932 | 0.0002 | 0.0002 | NA | 77.1620 | 0.0000 | 0.5438 |
| 49.8425 | 0.0002 | NA | NA | 78.0471 | 0.8851 | 0.3494 | |
| 45.8719 | 0.0003 | 0.0003 | 0.0000 | 81.1776 | 4.0156 | 0.0730 | |
| 52.8240 | NA | NA | NA | 83.1258 | 5.9637 | 0.0276 | |
| 52.7333 | NA | 0.0000 | NA | 86.1093 | 8.9473 | 0.0062 |
| Dependent Variable | Intercept | Cropland Area | Deforestation Area | Deforestation X Cropland | AICc | Delta | Weight |
|---|---|---|---|---|---|---|---|
| Active Fire Apex-Height No Dry Years | 50.5988 | NA | 0.0251 | NA | 162.5920 | 0.0000 | 0.8178 |
| 118.6297 | −0.0030 | 0.0225 | NA | 165.9493 | 3.3573 | 0.1526 | |
| 262.6756 | −0.0258 | 0.0104 | 0.0000 | 169.8633 | 7.2713 | 0.0216 | |
| 435.2554 | −0.0093 | NA | NA | 172.8497 | 10.2576 | 0.0048 | |
| 310.5030 | NA | NA | NA | 173.7141 | 11.1221 | 0.0031 | |
| Forest Cover Apex-Location No Dry Years | 51.0259 | 0.0001 | NA | NA | 61.9643 | 0.0000 | 0.5479 |
| 52.9153 | NA | NA | NA | 63.4096 | 1.4453 | 0.2660 | |
| 49.1293 | 0.0002 | 0.0001 | NA | 64.8540 | 2.8897 | 0.1292 | |
| 53.0844 | NA | 0.0000 | NA | 66.8583 | 4.8940 | 0.0474 | |
| 47.7071 | 0.0004 | 0.0003 | 0.0000 | 70.0586 | 8.0943 | 0.0096 |

Appendix C

| Dependent Variable | Intercept | Cropland Area | Deforestation Area | Deforestation X Cropland | AICc | Delta | Weight |
|---|---|---|---|---|---|---|---|
| Active Fire Apex-Height 2003–2011 | 147.816 | NA | 0.022 | NA | 121.706 | 0.000 | 0.523 |
| 753.998 | −0.048 | NA | NA | 122.615 | 0.908 | 0.332 | |
| 421.384 | NA | NA | NA | 124.472 | 2.766 | 0.131 | |
| 7.281 | 0.011 | 0.027 | NA | 128.872 | 7.165 | 0.015 | |
| 175.291 | -0.023 | 0.009 | 0.000 | 138.938 | 17.231 | 0.000 | |
| Active Fire Apex-Height 2012–2019 | 230.786 | NA | NA | NA | 94.197 | 0.000 | 0.868 |
| 177.852 | 0.002 | NA | NA | 99.182 | 4.985 | 0.072 | |
| 183.840 | NA | 0.006 | NA | 99.572 | 5.375 | 0.059 | |
| 187.893 | 0.003 | −0.002 | NA | 108.494 | 14.297 | 0.001 | |
| −266.007 | 0.026 | 0.061 | 0.000 | 126.271 | 32.074 | 0.000 | |
| Forest Cover Apex-Location 2003–2011 | 51.450 | NA | NA | NA | 45.261 | 0.000 | 0.735 |
| 53.629 | −0.0003 | NA | NA | 48.610 | 3.348 | 0.138 | |
| 49.862 | NA | 0.0001 | NA | 48.836 | 3.575 | 0.123 | |
| 56.883 | −0.0006 | −0.0001 | NA | 55.746 | 10.485 | 0.004 | |
| 55.904 | −0.0004 | 0.0000 | 0.0000 | 67.544 | 22.283 | 0.000 | |
| Forest Cover Apex-Location 2012–2019 | 54.369 | NA | NA | NA | 37.193 | 0.000 | 0.398 |
| 50.529 | 0.0002 | NA | NA | 37.494 | 0.302 | 0.343 | |
| 49.036 | NA | 0.0007 | NA | 38.094 | 0.901 | 0.254 | |
| 49.194 | 0.0001 | 0.0003 | NA | 45.967 | 8.774 | 0.005 | |
| 65.328 | −0.0007 | −0.002 | 0.0000 | 61.432 | 24.239 | 0.000 |

References
- Bowman, D.M.J.S.; Kolden, C.A.; Abatzoglou, J.T.; Johnston, F.H.; Van Der Werf, G.R.; Flannigan, M. Vegetation fires in the Anthropocene. Nat. Rev. Earth Environ. 2020, 1, 500–515. [Google Scholar] [CrossRef]
- Jolly, W.M.; Cochrane, M.A.; Freeborn, P.H.; Holden, Z.A.; Brown, T.J.; Williamson, G.J.; Bowman, D.M.J.S. Climate-induced variations in global wildfire danger from 1979 to 2013. Nat. Commun. 2015, 6, 7537. [Google Scholar] [CrossRef] [PubMed] [Green Version]
- Andela, N.; Morton, D.C.; Giglio, L.; Chen, Y.; van der Werf, G.R.; Kasibhatla, P.S.; DeFries, R.S.; Collatz, G.J.; Hantson, S.; Kloster, S.; et al. A human-driven decline in global burned area. Science 2017, 356, 1356–1362. [Google Scholar] [CrossRef] [PubMed] [Green Version]
- Pivello, V.R. The Use of Fire in the Cerrado and Amazonian Rainforests of Brazil: Past and Present. Fire Ecol. 2011, 7, 24–39. [Google Scholar] [CrossRef]
- Thonicke, K.; Venevsky, S.; Sitch, S.; Cramer, W. The role of fire disturbance for global vegetation dynamics: Coupling fire into a Dynamic Global Vegetation Model. Glob. Ecol. Biogeogr. 2001, 10, 661–677. [Google Scholar] [CrossRef] [Green Version]
- Barlow, J.; França, F.; Gardner, T.A.; Hicks, C.C.; Lennox, G.D.; Berenguer, E.; Castello, L.; Economo, E.P.; Ferreira, J.; Guénard, B.; et al. The future of hyperdiverse tropical ecosystems. Nature 2018, 559, 517–526. [Google Scholar] [CrossRef] [Green Version]
- Kelly, L.T.; Giljohann, K.M.; Duane, A.; Aquilué, N.; Archibald, S.; Batllori, E.; Bennett, A.F.; Buckland, S.T.; Canelles, Q.; Clarke, M.F.; et al. Fire and biodiversity in the Anthropocene. Science 2020, 370, eabb0355. [Google Scholar] [CrossRef]
- Bedia, J.; Herrera, S.; Gutiérrez, J.M.; Benali, A.; Brands, S.; Mota, B.; Moreno, J.M. Global patterns in the sensitivity of burned area to fire-weather: Implications for climate change. Agric. For. Meteorol. 2015, 214–215, 369–379. [Google Scholar] [CrossRef] [Green Version]
- Cochrane, M.A.; Barber, C.P. Climate change, human land use and future fires in the Amazon. Glob. Chang. Biol. 2009, 15, 601–612. [Google Scholar] [CrossRef]
- Morton, D.C.; Defries, R.S.; Randerson, J.T.; Giglio, L.; Schroeder, W.; Van der Werf, G.R. Agricultural intensification increases deforestation fire activity in Amazonia. Glob. Chang. Biol. 2008, 14, 2262–2275. [Google Scholar] [CrossRef]
- Aragão, L.E.O.C.; Anderson, L.O.; Fonseca, M.G.; Rosan, T.M.; Vedovato, L.B.; Wagner, F.H.; Silva, C.V.J.; Silva Junior, C.H.L.; Arai, E.; Aguiar, A.P.; et al. 21st Century drought-related fires counteract the decline of Amazon deforestation carbon emissions. Nat. Commun. 2018, 9, 536. [Google Scholar] [CrossRef] [Green Version]
- Barlow, J.; Berenguer, E.; Carmenta, R.; França, F. Clarifying Amazonia’s burning crisis. Glob. Chang. Biol. 2020, 26, 319–321. [Google Scholar] [CrossRef] [Green Version]
- Anderson, L.O.; Neto, G.R.; Cunha, A.P.; Fonseca, M.G.; De Moura, Y.M.; Dalagnol, R.; Wagner, F.H.; Aragão, L.E.O.E.C.D. Vulnerability of Amazonian forests to repeated droughts. Philos. Trans. R. Soc. B Biol. Sci. 2018, 373, 20170411. [Google Scholar] [CrossRef]
- Erfanian, A.; Wang, G.; Fomenko, L. Unprecedented drought over tropical South America in 2016: Significantly under-predicted by tropical SST. Sci. Rep. 2017, 7, 22–24. [Google Scholar] [CrossRef] [Green Version]
- Wigneron, J.-P.; Fan, L.; Ciais, P.; Bastos, A.; Brandt, M.; Chave, J.; Saatchi, S.; Baccini, A.; Fensholt, R. Tropical forests did not recover from the strong 2015–2016 El Niño event. Sci. Adv. 2020, 6, eaay4603. [Google Scholar] [CrossRef] [Green Version]
- Brando, P.; Macedo, M.; Silvério, D.; Rattis, L.; Paolucci, L.; Alencar, A.; Coe, M.; Amorim, C. Amazon wildfires: Scenes from a foreseeable disaster. Flora Morphol. Distrib. Funct. Ecol. Plants 2020, 268, 151609. [Google Scholar] [CrossRef]
- Cano-Crespo, A.; Oliveira, P.J.C.; Boit, A.; Cardoso, M.; Thonicke, K. Forest edge burning in the Brazilian Amazon promoted by escaping fires from managed pastures. J. Geophys. Res. Biogeosci. 2015, 120, 2095–2107. [Google Scholar] [CrossRef] [Green Version]
- Nobre, C.A.; Sampaio, G.; Borma, L.S.; Castilla-Rubio, J.C.; Silva, J.S.; Cardoso, M. Land-use and climate change risks in the Amazon and the need of a novel sustainable development paradigm. Proc. Natl. Acad. Sci. USA 2016, 113, 10759–10768. [Google Scholar] [CrossRef] [Green Version]
- Barlow, J.; Parry, L.; Gardner, T.A.; Ferreira, J.; Aragão, L.E.; Carmenta, R.; Berenguer, E.; Vieira, I.C.; Souza, C.; Cochrane, M.A. The critical importance of considering fire in REDD+ programs. Biol. Conserv. 2012, 154, 1–8. [Google Scholar] [CrossRef]
- Berenguer, E.; Lennox, G.D.; Ferreira, J.; Malhi, Y.; Aragão, L.E.O.C.; Barreto, J.R.; Espírito-Santo, F.D.B.; Figueiredo, A.E.S.; França, F.; Gardner, T.A.; et al. Tracking the impacts of El Niño drought and fire in human-modified Amazonian forests. Proc. Natl. Acad. Sci. USA 2021, 118, e2019377118. [Google Scholar] [CrossRef]
- Silva, C.V.J.; Aragão, L.E.O.C.; Young, P.J.; Espirito-Santo, F.; Berenguer, E.; Anderson, L.O.; Brasil, I.; Pontes-Lopes, A.; Ferreira, J.; Withey, K.; et al. Estimating the multi-decadal carbon deficit of burned Amazonian forests. Environ. Res. Lett. 2020, 15, 114023. [Google Scholar] [CrossRef]
- Foley, J.A.; DeFries, R.; Asner, G.P.; Barford, C.; Bonan, G.; Carpenter, S.R.; Chapin, F.S.; Coe, M.T.; Daily, G.C.; Gibbs, H.K.; et al. Global consequences of land use. Science 2005, 309, 570–574. [Google Scholar] [CrossRef] [PubMed] [Green Version]
- Aragão, L.E.O.C.; Shimabukuro, Y.E. The Incidence of Fire in Amazonian Forests with Implications for REDD. Science 2010, 328, 1275–1278. [Google Scholar] [CrossRef] [PubMed]
- INPE. Monitoramento Do Desmatamento Da Floresta Amazônica Brasileira Por Satélite; PRODES Amazônia: Belém, Brazil, 2020. [Google Scholar]
- MapBiomas. Mapbiomas Deforestation and Regeneration Toolkit 2021; MapBiomas: São Paulo, Brazil, 2021. [Google Scholar]
- Barbosa, R.I.; Fearnside, P.M. Fire frequency and area burned in the Roraima savannas of Brazilian Amazonia. For. Ecol. Manag. 2005, 204, 371–384. [Google Scholar] [CrossRef]
- Giglio, L.; Schroeder, W.; Justice, C.O. The collection 6 MODIS active fire detection algorithm and fire products. Remote Sens. Environ. 2016, 178, 31–41. [Google Scholar] [CrossRef] [Green Version]
- Souza, C.M.; Shimbo, J.Z.; Rosa, M.R.; Parente, L.L.; Alencar, A.; Rudorff, B.F.; Hasenack, H.; Matsumoto, M.; Ferreira, L.G.; Souza-Filho, P.W.E.; et al. Reconstructing Three Decades of Land Use and Land Cover Changes in Brazilian Biomes with Landsat Archive and Earth Engine. Remote Sens. 2020, 12, 2735. [Google Scholar] [CrossRef]
- Mapbiomas Mapbiomas Collection 5.0. Available online: http://mapbiomas.org/ (accessed on 1 March 2021).
- Chen, Y.; Morton, D.C.; Jin, Y.; Collatz, G.J.; Kasibhatla, P.; van der Werf, G.; DeFries, R.S.; Randerson, J.T. Long-term trends and interannual variability of forest, savanna and agricultural fires in South America. Carbon Manag. 2013, 4, 617–638. [Google Scholar] [CrossRef]
- Armenteras, D.; Barreto, J.S.; Tabor, K.; Molowny-Horas, R.; Retana, J. Changing patterns of fire occurrence in proximity to forest edges, roads and rivers between NW Amazonian countries. Biogeosciences 2017, 14, 2755–2765. [Google Scholar] [CrossRef] [Green Version]
- MapBiomas. Deforestation Method. Available online: https://mapbiomas.org/en/deforestation-method (accessed on 1 December 2021).
- Fearnside, P.; Barbosa, R.I.; Graça, P. Burning of secondary forest in Amazonia: Biomass, burning efficiency and charcoal formation during land preparation for agriculture in Apiaú, Roraima, Brazil. For. Ecol. Manag. 2007, 242, 678–687. [Google Scholar] [CrossRef]
- Nakagawa, S.; Johnson, P.C.D.; Schielzeth, H. The coefficient of determination R2 and intra-class correlation coefficient from generalized linear mixed-effects models revisited and expanded. J. R. Soc. Interface 2017, 14, 20170213. [Google Scholar] [CrossRef]
- Brooks, M.; Kristensen, K.; van Benthem, K.; Magnusson, A.; Berg, C.; Nielsen, A.; Skaug, H.; Mächler, M.; Bolker, B. Modeling Zero-Inflated Count Data with GlmmTMB. bioRxiv 2017, 132753. [Google Scholar] [CrossRef] [Green Version]
- Bartón, K. MuMIn: Multi-Model Inference. R Package, Version 1.43.17; 2020. Available online: https://cran.r-project.org/web/packages/MuMIn/MuMIn.pdf (accessed on 1 March 2021).
- R Core Team. R: A Language and Environment for Statistical Computing; R Foundation for Statistical Computing: Vienna, Austria, 2021. [Google Scholar]
- Schroeder, W.; Alencar, A.; Arima, E.; Setzer, A.; Walker, R.; Defries, R.; Vera-Diaz, M.D.C.; Shimabukuro, Y.; Venturieri, A. The spatial distribution and interannual variability of fire in Amazonia. Geophys. Monogr. Ser. 2009, 186, 43–60. [Google Scholar] [CrossRef]
- Fearnside, P.M. Deforestation soars in the Amazon. Nature 2015, 521, 423. [Google Scholar] [CrossRef] [Green Version]
- Gibbs, H.K.; Brown, S.; Niles, J.O.; Foley, J.A. Monitoring and estimating tropical forest carbon stocks: Making REDD a reality. Environ. Res. Lett. 2007, 2, 045023. [Google Scholar] [CrossRef] [Green Version]
- de Toledo, P.M.; Dalla-Nora, E.; Vieira, I.C.G.; Aguiar, A.P.D.; Araújo, R. Development paradigms contributing to the transformation of the Brazilian Amazon: Do people matter? Curr. Opin. Environ. Sustain. 2017, 26–27, 77–83. [Google Scholar] [CrossRef]
- Sauer, S. Soy expansion into the agricultural frontiers of the Brazilian Amazon: The agribusiness economy and its social and environmental conflicts. Land Use Policy 2018, 79, 326–338. [Google Scholar] [CrossRef]
- Foley, J.A.; Asner, G.; Costa, M.; Coe, M.T.; DeFries, R.; Gibbs, H.K.; Howard, E.A.; Olson, S.; Patz, J.; Ramankutty, N.; et al. Amazonia revealed: Forest degradation and loss of ecosystem goods and services in the Amazon Basin. Front. Ecol. Environ. 2007, 5, 25–32. [Google Scholar] [CrossRef]
- Steward, C. From colonization to “environmental soy”: A case study of environmental and socio-economic valuation in the Amazon soy frontier. Agric. Hum. Values 2007, 24, 107–122. [Google Scholar] [CrossRef]
- Garrett, R.; Gardner, T.A.; Morello, T.F.; Marchand, S.; Barlow, J.; De Blas, D.E.; Ferreira, J.; Lees, A.C.; Parry, L. Explaining the persistence of low income and environmentally degrading land uses in the Brazilian Amazon. Ecol. Soc. 2017, 22, 27. [Google Scholar] [CrossRef]
- Schiesari, L.C.; Grillitsch, B. Pesticides meet megadiversity in the expansion of biofuel crops. Front. Ecol. Environ. 2011, 9, 215–221. [Google Scholar] [CrossRef]
- Damiani, S.; Guimarães, S.M.F.; Montalvão, M.T.L.; Passos, C.J.S. “All That’s Left is Bare Land and Sky”: Palm Oil Culture and Socioenvironmental Impacts on a Tembé Indigenous Territory in the Brazilian Amazon. Ambient. Soc. 2020, 23, 1–25. [Google Scholar] [CrossRef]
- Gatti, L.V.; Basso, L.S.; Miller, J.B.; Gloor, M.; Domingues, L.G.; Cassol, H.L.G.; Tejada, G.; Aragão, L.E.O.C.; Nobre, C.; Peters, W.; et al. Amazonia as a carbon source linked to deforestation and climate change. Nature 2021, 595, 388–393. [Google Scholar] [CrossRef] [PubMed]
- Bullock, E.L.; Woodcock, C.E.; Souza, C.; Olofsson, P. Satellite-based estimates reveal widespread forest degradation in the Amazon. Glob. Chang. Biol. 2020, 26, 2956–2969. [Google Scholar] [CrossRef] [PubMed]
- Holdsworth, A.R.; Uhl, C. Fire in Amazonian Selectively Logged Rain Forest and the Potential for Fire Reduction Stable. Ecol. Appl. 2016, 7, 713–725. Available online: http://www.jstor.org/stable/2269533 (accessed on 22 March 2016). [CrossRef]
- Carmenta, R.; Vermeylen, S.; Parry, L.; Barlow, J. Shifting Cultivation and Fire Policy: Insights from the Brazilian Amazon. Hum. Ecol. 2013, 41, 603–614. [Google Scholar] [CrossRef]
- Barlow, J.; Sist, P.; Almeida, R.; Arantes, C.; Berenguer, E.; Caron, P.; Cuesta, F.; Doria, C.R.D.C.; Ferreira, J.; Flecker, A.; et al. Restoration Priorities and Benefits within Landscapes and Catchments and Across the Amazon Basin; Amazon Assessment Report 2021. United Nations Sustainable Development Solutions Network, 2021; pp. 29.3–29.26. Available online: https://e-space.mmu.ac.uk/628964/1/Chapter%2029%20Amazon%20Report.pdf (accessed on 1 March 2021).
- Spínola, J.N.; Da Silva, M.J.S.; Da Silva, J.R.A.; Barlow, J.; Ferreira, J. A shared perspective on managing Amazonian sustainable-use reserves in an era of megafires. J. Appl. Ecol. 2020, 57, 2132–2138. [Google Scholar] [CrossRef]
- Funk, C.; Peterson, P.; Landsfeld, M.; Pedreros, D.; Verdin, J.; Shukla, S.; Husak, G.; Rowland, J.; Harrison, L.; Hoell, A.; et al. The climate hazards infrared precipitation with stations—A new environmental record for monitoring extremes. Sci. Data 2015, 2, 150066. [Google Scholar] [CrossRef] [Green Version]
- Aragão, L.E.O.C.; Malhi, Y.; Roman-Cuesta, R.M.; Saatchi, S.; Anderson, L.O.; Shimabukuro, Y.E. Spatial patterns and fire response of recent Amazonian droughts. Geophys. Res. Lett. 2007, 34, L07701. [Google Scholar] [CrossRef] [Green Version]
- Campanharo, W.A.; Silva Junior, C.H.L. Maximum Cumulative Water Deficit—MCWD: A R Language Script. Zenodo 2019. [Google Scholar] [CrossRef]
- Silva, C.V.J.; Aragão, L.E.O.C.; Barlow, J.; Espírito-Santo, F.; Young, P.J.; Anderson, L.O.; Berenguer, E.; Brasil, I.; Brown, I.F.; Castro, B.; et al. Drought-induced Amazonian wildfires instigate a decadal-scale disruption of forest carbon dynamics. Philos. Trans. R. Soc. B Biol. Sci. 2018, 373, 20180043. [Google Scholar] [CrossRef]


Publisher’s Note: MDPI stays neutral with regard to jurisdictional claims in published maps and institutional affiliations. |
© 2022 by the authors. Licensee MDPI, Basel, Switzerland. This article is an open access article distributed under the terms and conditions of the Creative Commons Attribution (CC BY) license (https://creativecommons.org/licenses/by/4.0/).
Share and Cite
Tavares, P.A.; Ferreira, J.; Silva, C.V.J.; Berenguer, E.; Barlow, J. Exploring the Role of Deforestation and Cropland Expansion in Driving a Fire-Transition in the Brazilian Amazon. Land 2022, 11, 2274. https://doi.org/10.3390/land11122274
Tavares PA, Ferreira J, Silva CVJ, Berenguer E, Barlow J. Exploring the Role of Deforestation and Cropland Expansion in Driving a Fire-Transition in the Brazilian Amazon. Land. 2022; 11(12):2274. https://doi.org/10.3390/land11122274
Chicago/Turabian StyleTavares, Paulo Amador, Joice Ferreira, Camila V. J. Silva, Erika Berenguer, and Jos Barlow. 2022. "Exploring the Role of Deforestation and Cropland Expansion in Driving a Fire-Transition in the Brazilian Amazon" Land 11, no. 12: 2274. https://doi.org/10.3390/land11122274