Article

Assessment of Remote Sensing Ecological Quality by Introducing Water and Air Quality Indicators: A Case Study of Wuhan, China

School of Public Administration, China University of Geosciences, Wuhan 430074, China
*
Author to whom correspondence should be addressed.
Land 2022, 11(12), 2272; https://doi.org/10.3390/land11122272
Submission received: 9 November 2022 / Revised: 1 December 2022 / Accepted: 8 December 2022 / Published: 12 December 2022

Abstract

:
In the context of ecological protection and urban expansion, the quality of the ecological environment and ecological security are gravely at risk. A simple, effective, and comprehensive assessment method for regional environmental quality monitoring is urgently required at this time. This study proposes a comprehensive approach for evaluating regional ecological quality. Based on Landsat TM+OLI/TIRS images, indicators representing the ecological quality of land and water were constructed. Land ecological quality consists of land surface moisture (WET), normalized difference vegetation index (NDVI), normalized building bare soil index (NDBSI), and land surface temperature (LST), which represent humidity, greenness, dryness, and temperature, respectively. At the same time, the remote sensing indices of chlorophyll_a (chl_a) and suspended solids (SS) were constructed to characterize the water quality. Air quality was characterized based on aerosol optical depth (AOD) in MCD19A2. By introducing water and air quality indicators and utilizing principal component analysis, a remote sensing ecological index that improves water area assessment (WIRSEI) was established and applied to Wuhan from 2000 to 2020. The driving force of WIRSEI change was analyzed using the geographically weighted regression (GWR) model. The results revealed that (1) air quality AOD and humidity WET greatly impacted the ecological quality (WIRSEI). WIRSEIs in seven central urban areas were significantly lower than that in six remote urban regions, and the ecological quality of lakes was higher than that of rivers. (2) From 2000 to 2020, Wuhan’s overall WIRSEI showed a “rising–falling–rising–stable” trend. In most regions, the degree of ecological quality change was relatively small; most grades were “no change”, “slightly better”, and “slightly worse”, representing 88–93% of the total area. (3) The change in WIRSEI from 2000 to 2020 was closely related to urban expansion, population change, and economic development. The effects of land use and socioeconomic changes on WIRSEI were significantly different in spatial distribution. Compared to the driving factors, land use dynamics (LUCD) significantly impacted WIRSEI changes, while the effects of gross domestic product (GDP) and population (POP) were very small. This study uses WIRSEI to evaluate the regional ecological quality, providing a vital reference and basis for enhancing regional ecological quality assessment methods, promoting ecological environmental protection and restoration, regional coordination, and sustainable development. The research results show that the proposed approach is simple and effective, strongly supporting regional ecological quality and protection monitoring.

1. Introduction

Changes in land use/cover and human activities have led to alterations in ecological patterns and quality in the context of economic development and urban expansion. China’s economic growth and urbanization have achieved significant strides in the past few decades. At the same time, the disadvantages of sacrificing the ecological environment and natural resources for rapid development in the early years have gradually emerged, and ecological environment issues have become an essential factor affecting and restricting China’s social and economic evolution [1]. Inefficient economic growth and urban expansion often sacrifice ecological security and the environment, resulting in the escalating challenges of biodiversity loss and land degradation. Urgent action was required to strengthen ecological security and implement ecological restoration [2]. Against the backdrop of ecological civilization construction in the new era, China’s socioeconomic development was in a critical transition period, with many regions facing dual pressures of ecological protection and urban and rural construction. Since 2019, territorial and spatial planning preparation in all areas of China has been in full swing, with ecological environmental protection and restoration among the most important contents. Since 2021, several regions have gradually carried out the preparation of special plans for territorial space ecological restoration, and there is still more work to be done regarding territorial space ecological environmental protection and restoration. Hence, it is necessary to effectively grasp ecological quality’s temporal and spatial differences by monitoring and evaluating regional ecological conditions [3]. This is crucial for ensuring the structure and function of the ecosystem, encouraging biodiversity protection, effectively promoting ecological conservation and restoration, and improving the living environment of humans in territorial space.
The technical specifications for ecological environment assessment (trial) and the updated technical specifications for ecological environment assessment were established as industry standards by the National Environmental Protection Department of China in 2006 and 2015, respectively [4,5]. It proposes the ecological index (EI), including biological abundance, air pollution, water network density, vegetation coverage, land degradation, and others. The Ministry of Ecology and Environment of China issued the measures for regional ecological quality assessment (for trial implementation) in 2021 [6]. These two approaches for evaluating ecological quality were primarily intended for administrative divisions at the county level and higher. The evaluation results were a numerical value for the overall ecological quality of the region. It was difficult to visualize and master the spatial distribution of ecological quality and analyze the spatial differences and changes in ecological quality.
Remote sensing spatial information technology has the advantages of rapid, real-time, and large-scale monitoring and has been widely used in the field of ecological environment. In 2013, Xu [7] proposed the remote sensing ecological index (RSEI), which couples four indicators, including vegetation index, humidity component, surface temperature, and dryness index, to assess ecological quality from the perspectives of greenness, humidity, heat, and dryness [8]. This remote sensing ecological index was broadly applied by scholars, thus compensating for the shortcomings of EI. It also aids in studying the interaction between human activities and natural ecology, and the resulting knowledge of theories, concepts, and methods are expected to benefit local development [9]. In recent years, the RSEI has been utilized to monitor the ecological quality of 35 cities worldwide [10,11,12,13]. However, the ecological quality of the water region has not been considered in RSEI. Special attention must be paid to the ecological quality of the area with a high proportion of water region. Chlorophyll-a (chl_a) and suspended solids (SS) are two of the main indicators for remote sensing monitoring of water quality [14], which can effectively characterize the ecological quality of water bodies. The chl_a is one of the important components of pigments in planktonic organisms. Its content is closely related to the species and quantity of algae in the water body. It is one of the important parameters for the assessment of water nutrient status and eutrophication. Its concentration is one of the most selected monitoring indicators in remote sensing monitoring of inland surface water. Most of the existing research uses the characteristics of red light band and near-infrared band to carry out remote sensing inversion of chl_a concentration in water [15,16,17,18,19,20]. Suspended solids include organic debris produced by the death of phytoplankton and inorganic suspended particles produced by the resuspension of terrestrial or lake bottom mud. It is also one of the most important indicators for remote sensing monitoring of water quality, which directly affects the turbidity and transparency of water bodies, and then affects the ecological conditions and primary productivity of water bodies [21,22]. In recent years, China’s urban air quality problems have been more serious, especially in central cities and surrounding areas. The concentration of fine particulate matter (PM2.5) in the air is often the primary source of air pollution [23]. Aerosol Optical Depth (AOD) was widely employed to study the spatial distribution of PM2.5 concentration [24,25], so AOD can be regarded as replacing air quality indicators. This paper introduces water and air quality indicators to compensate for the shortcomings of Remote Sensing Ecological Index (RSEI) in water and air characterization.
Wuhan is located east of Jianghan Plain and in the middle reaches of the Yangtze River. The Yangtze River and its largest tributary, the Hanjiang River, meet in the city. Rivers crisscross the city, and lakes and harbors intertwine. The water area accounts for one-quarter of the city’s total area. Wuhan is the core city of Central China and the Yangtze River Economic Belt. It plays a leading role in developing the urban agglomeration in the middle reaches of the Yangtze River and Central China, radiating around and driving the overall high-quality growth. In the past decades of Wuhan’s development, urban expansion and construction have caused dramatic changes in the spatial pattern of land and many environmental problems, resulting in a reduction in the ecological quality of some regions. In the face of the imbalance and disorder of territorial space and the decline in ecological quality imbalance, Wuhan must build an efficient and safe territorial space pattern, and pursue high-quality green development. Specifically, it is necessary to achieve high-quality ecological environment remodeling and ensure ecological security and ecological quality by implementing land space ecological protection and restoration. Therefore, it is necessary to achieve a comprehensive and effective assessment of the ecological quality of Wuhan by means of remote sensing. However, it is difficult for the existing RSEI index to meet the assessment requirements for a large proportion of water area and air quality in Wuhan. It is necessary to introduce water area and air quality index to improve RSEI’s deficiencies in water quality and air quality. It is expected to provide reliable and effective support for the orderly development of Wuhan’s territorial space, ensuring ecological security, and attaining the objectives of ecological protection and restoration.

2. Materials and Methods
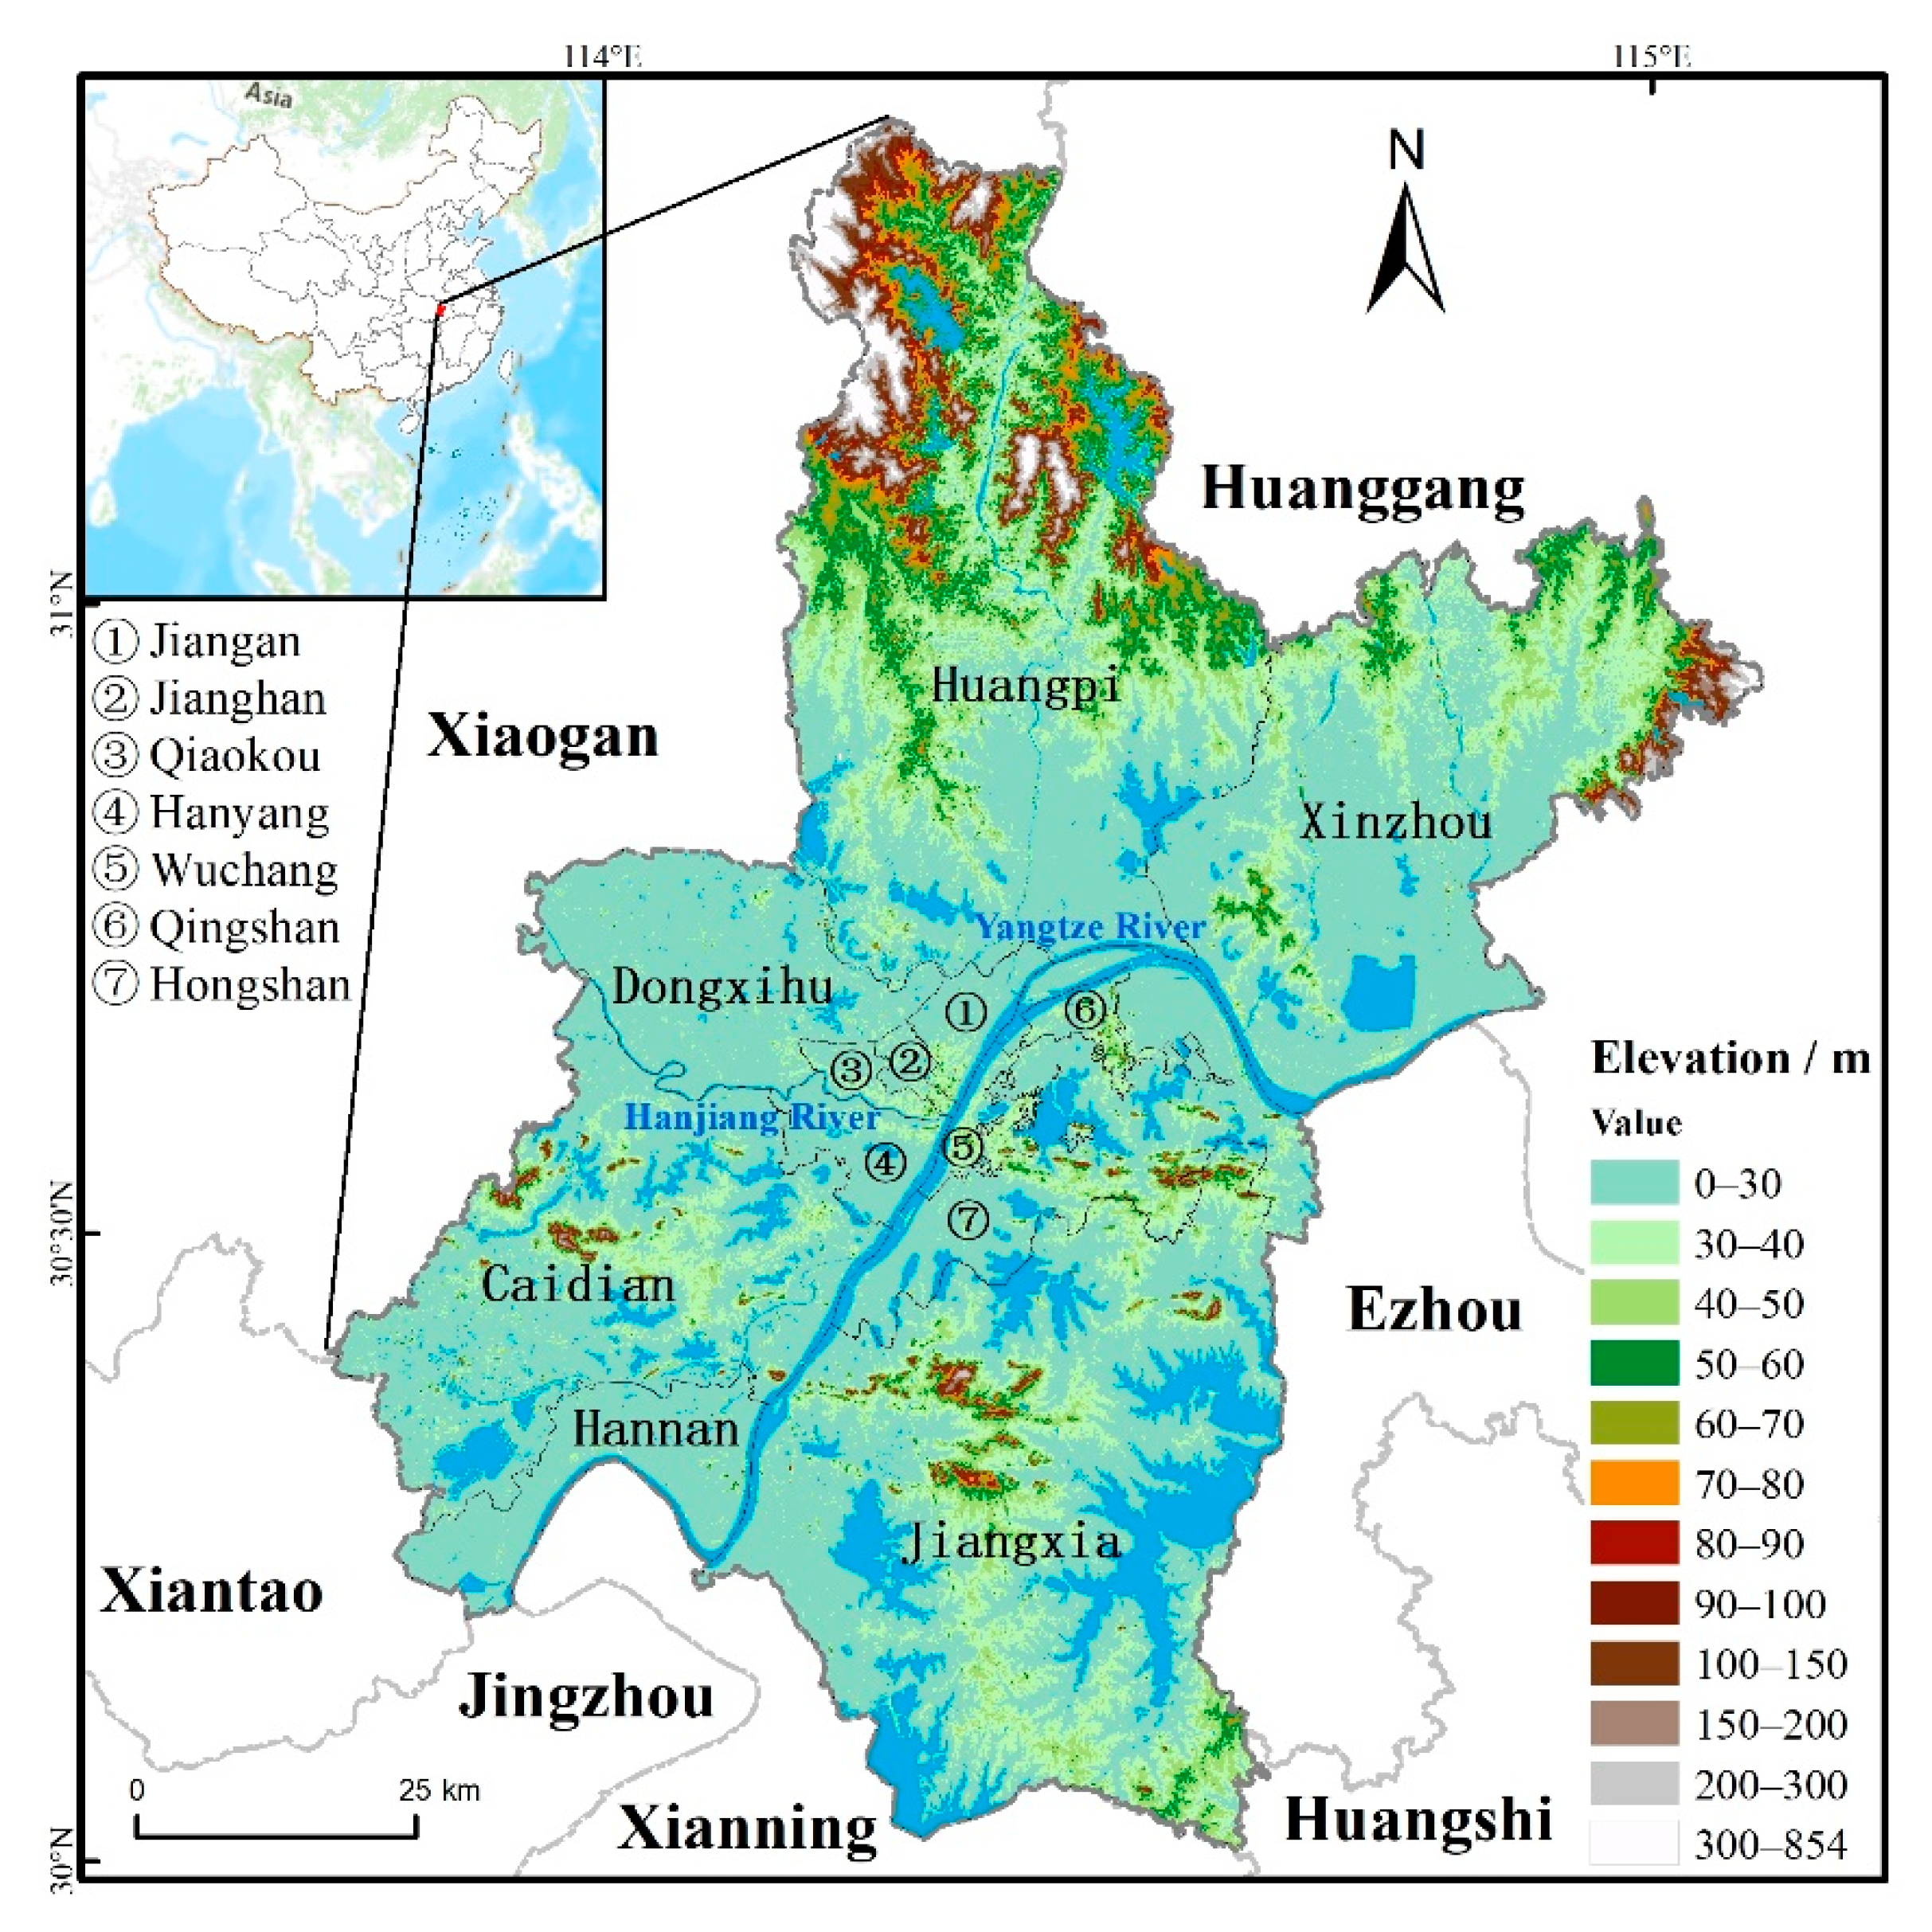
2.1. Study Area

Wuhan was selected as the study area for ecological monitoring and evaluation. Wuhan is the capital of Hubei Province, the central city of central China and the Yangtze River’s middle reaches. Its geographical location is 29°58′–31°22′ N and 113°41′–115°05′ E (Figure 1). The city governs six central urban areas and seven remote urban areas, with a total area of 8569.15 square kilometers. By 2021, the permanent population had reached 13.6489 million. As the leader of economic development in central China, Wuhan’s GDP has continued to grow (in 2020, due to the outbreak of the COVID-19, the GDP declined). In 2021, the city’s GDP reached 1.77 trillion yuan (RMB). Wuhan has a subtropical humid monsoon climate with abundant rainfall and heat throughout the year. The annual average temperature is between 15.8 and 17.5 °C. The ecological endowment of this area is superior. Rivers and lakes are crisscrossed in the city, and lakes and harbors are intertwined. The water area accounts for one-quarter of the total area of the city. It has 166 lakes of different areas, known as the “City of Hundred Lakes”. In the past two decades, urban expansion has caused dramatic changes in the spatial pattern of land and ecological and environmental problems, resulting in a decline in ecological quality.

2.2. Data and Preprocessing

This study mainly uses remote sensing images, land use/cover, population, and economic data (Table 1). Among them, Landsat TM and OLI remote sensing images and MCD19A2 data are mainly used for WIRSEI evaluation, and other data are used for driving force analysis of WIRSEI. The exact data name, date, resolution, and acquisition channel are shown in Table 1. The dates of Landsat TM image acquisition are 31 October 2000, 11 September 2005, and 12 November 2010, and the dates of Landsat OLI image acquisition are 25 October 2015 and 7 November 2020. The selection of remote sensing images takes into account the data quality, such as cloud cover, vegetation, etc. The cloud cover of all selected remote sensing images is 0%. The image is atmospherically corrected by ENVI software using the FLAASH model. The source date of the image is relatively close, so the difference caused by various seasons and vegetation growth can be ignored. The GLC_FCS30-1985-2020 achieved an overall accuracy of 82.5% and a kappa coefficient of 0.784 [26]. Its accuracy and spatial resolution meet the requirements of this study. After obtaining the whole year’s MCD19A2 data, the annual mean value of AOD was calculated. In addition, MCD19A2 is resampled to 30 m spatial resolution. Due to the mobility of air and the abstractness of the spatial expression of social and economic information, the AOD, population, and GDP data with a spatial resolution of 1000 m are sufficient to express their spatial differences.

2.3. Methodology

2.3.1. Modeling Framework

The research utilizes land surface moisture (WET), normalized difference vegetation index (NDVI), normalized building bare soil index (NDBSI), and land surface temperature (LST) to represent terrestrial ecological quality, chl_a and SS to represent water quality, and AOD to represent air quality. The indicators used to represent land, water, and air quality have been proved to be universally applicable and widely used in land, water, and air quality assessment research. Among them, WET, NDVI, NDBSI, and LST have been used in RSEI, “chl_a” and “SS” are the most important and common water quality indicators, and AOD has also been used in many studies to evaluate PM2.5 concentration. Before assessing the ecological quality of the study area, we identified the water region based on the modified standardized difference water index (MNDWI); assessed the ecological quality of the land region based on WET, NDVI, NDBSI, LST, and AOD; and assessed the ecological quality of the water region based on chl_a, SS, and AOD. Combining the ecological quality assessment results of land and water regions in space, the ecological quality assessment results of the whole study area, namely WIRSEI, were formed. WIRSEI was designed to facilitate remote sensing ecological quality assessment in areas with a large proportion of water regions. Figure 2 indicates that the WIRSEI calculation and analysis framework includes three main steps. First, remote sensing images data and population, economy, land use/cover, and other data were gathered and preprocessed. Second, the water region was identified using the MNDWI index. The WET, NDVI, NDBSI, LST, and AOD indices of the land region and the AOD, chl_a, and SS indices of the water region were calculated. In order to avoid the weight of each indicator varying with individuals and methods, the PCA method [7,27,28] was selected to construct the ecological quality index. The PCA method automatically and objectively determines the index weight according to the nature of the data and the contribution of each index to each main component. First, we calculated the ecological quality of land and water by the PCA method, and then mosaicked the ecological quality calculation results of land and water to obtain the WIRSEI of the study area. Finally, the ecological indicators of land and water regions were investigated and the spatial and temporal differences and dynamic changes in WIRSEI were analyzed, as well as the driving forces of WIRSEI.

2.3.2. Water Mask and Standardization

It is challenging for the remote sensing ecological index (RSEI) to represent the ecological quality of the water region, so it is necessary to cover the water region in the study area. This research uses the modified standardized difference water index (MNDWI) to distinguish these water regions [29]. The formula is:
M N D W I = ( ρ G r e e n ρ M I R ) / ( ρ G r e e n + ρ M I R )
where ρ G r e e n is the reflectivity of the green band and ρ M I R is the reflectivity of the mid-infrared band.

2.3.3. Water Remote Sensing Ecological Index

The chl_a is an important parameter for eutrophic water, SS is the main cause of water turbidity, and both are the most commonly used water quality parameters. Traditional water quality monitoring methods cannot be used for real-time monitoring. Remote sensing technology has the advantages of a wide monitoring range, low cost, and convenience for long-term dynamic detection, which can quickly reflect the water quality status of the whole study area in real time. In the absence of actual water quality monitoring data, the ratio calculation model composed of the red, blue, and near-infrared band of the Landsat image can be applied to investigate the concentration changes in SS and chl_a in water [30]:
chl _ a = ρ N I R / ρ R E D
SS = ρ R E D / ρ B L U E
where ρ R E D is the pixel brightness value in the red light band, ρ B L U E is the pixel brightness value in the blue light band, and ρ N I R is the pixel brightness value in the near-infrared band.

2.3.4. Land and Air Remote Sensing Ecological Index

  • Land
The NDVI is usually applied to monitor vegetation growth and directly represents the quality of the regional ecological environment [31,32,33]. The temperature value at the sensor can be calculated by using the model in the Landsat User’s Manual and the parameter revised by Chander, and then converted to the surface temperature LST through emissivity correction [7,34,35]. LST [36,37] is closely related to vegetation growth, crop yield, surface water cycle, urbanization, other natural phenomena and processes, and human activities [38], and it can be used as a thermal indicator to illustrate the surface ecological environment. Kauth Thomas transform (also known as tassel cap transform) is a linear transform method based on multispectral imaging [39,40]. The moisture content obtained through this transform reflects the moisture information in soil and vegetation (WET). The drying index quantifies the soil drying degree, which harms the ecological environment. Since most urban construction lands are located in the study area, the dryness index can be defined by combining the bare soil index (SI) and building index (IBI) into a normalized building bare soil index (NDBSI) [41]. The remote sensing ecological index (RSEI), which is composed of four indicators, including humidity (WET), greenness (NDVI), temperature (LST), and dryness (NDBSI), has been widely used since it was proposed [7,8,28,42]. These four indicators were utilized to represent the terrestrial ecological quality in this study.
  • Air
Relevant research shows that AOD can accurately reflect the particulate air quality in a specific region [43], and the spatial coupling degree with pollutant emissions is relatively maximum [44]. Therefore, AOD is selected to represent air quality. The AOD data are collected by the MAIAC (Multi-angle Implementation of Atmospheric Correction) algorithm from MCD19, a new aerosol product of MODIS [45,46].

2.3.5. Geographical Weighted Regression

Regression analysis is often utilized to quantitatively analyze geographical relationships, and the interaction of geographical factors mainly occurs locally and changes with geographical location. Fotheringham and Brunsdon [47] proposed a geographical weighted regression model (GWR) based on the idea of local regression and variable parameter regression. This method extends the parameter estimation framework of the classical regression model to estimate the local parameters. This paper utilized GWR to analyze the driving force of WIRSEI changes and selected the dynamic degree of land use (LUCD) [48] and the changes in GDP and POP as the independent variables. The model was performed using Arcgis10.2. The expression of the model is as follows:
y i = β 0 ( u i , v i ) + j = 1 k β i ( u i , v i ) x i j + ε i
where x i j is the value of the j independent variable in sample i; ( u i , v i ) is the geographic center coordinate (such as longitude and latitude) of the i sample; β 0 ( u i , v i ) is the constant term estimate of the i sample; β i ( u i , v i ) is the j regression parameter of the i sample, which is a function of geographical location; and i is the error of independent normal distribution with zero mean value.

3. Results

3.1. Ecological Factors

3.1.1. Ecological Factors of Land Region

The high-value areas of WET are primarily distributed near the Yangtze River and other major lakes and rivers by comparing the spatial distribution of five ecological factors in the land region from 2000 to 2020 (Figure 3). Three sides of the Dongxihu district are surrounded by water, and there are many lakes, so the WET value was high overall. The spatial distribution characteristics of NDVI values were consistent with land types. Most high-value areas were densely covered with forests and grasslands, while low-value areas were mainly central urban and major residential regions. The spatial distribution of NDBSI value was affected by impervious ground distribution and the dryness of bare soil, so the value near the water and forest areas was low, while the value of cultivated land and human settlements was high. Human activities, the natural environment, and climate influenced the spatial distribution of LST value. In general, the LST value of central urban regions was high. The AOD reflects the primary air quality situation, and multiple factors, including human activities, natural climate and the environment, and surrounding areas, impacted its spatial distribution difference.
The LST value of Jiangxia and Hannan was significantly higher than that of Huangpi and Xinzhou in 2000, while the AOD value of the central and western regions was much greater than that of other regions. In 2005, the central urban regions were a high-value area of NDBSI, and the central and southern parts of Huangpi and the central and western parts of Xinzhou were high-value areas of AOD. In 2010, the LST values of Caidian and Hannan were on the high side, while the region from Dongxihu to Xinzhou via the south of Huangpi was a high AOD area. In 2015, the WET in central Huangpi and north central Xinzhou was much lower than in Jiangxia, although the distribution of NDBSI and AOD in these two places was opposite of WET. In addition, the central part had a high LST area. In 2020, Xinzhou, the south of Huangpi, and the west of Caidian were high-value areas of AOD.

3.1.2. Ecological Factors of Water Region

Comparing the spatial distribution of three ecological factors in the water area from 2000 to 2020 (Figure 4), it was determined that the chl_a value of the lake was generally higher than that of the river, the lake edge was higher than the lake center, and the SS value of the river was generally greater than that of the lake. In 2000, the Yangtze River was the high-value area for AOD and SS, and the AOD of Wu Lake and Zhangdu Lake was also large. In 2005, the AODs of Yangtze River, Wu Lake, and Zhangdu Lake were higher. In 2010, the AODs of Yangtze River, Baishui Lake, Hou Lake, Wu Lake, and Zhangdu Lake were higher. In 2015, the AOD of Liangzi Lake was low, the SS of Yangtze River was high, and the SS values of Mulan Lake and Taiyang Lake were low. In 2020, the AOD of Zhangdu Lake was higher, while the AOD of Liangzi Lake was lower. The SS values of Yangtze River and Zhangdu Lake were higher, while the SS values of Mulan Lake and Taiyang Lake were lower.

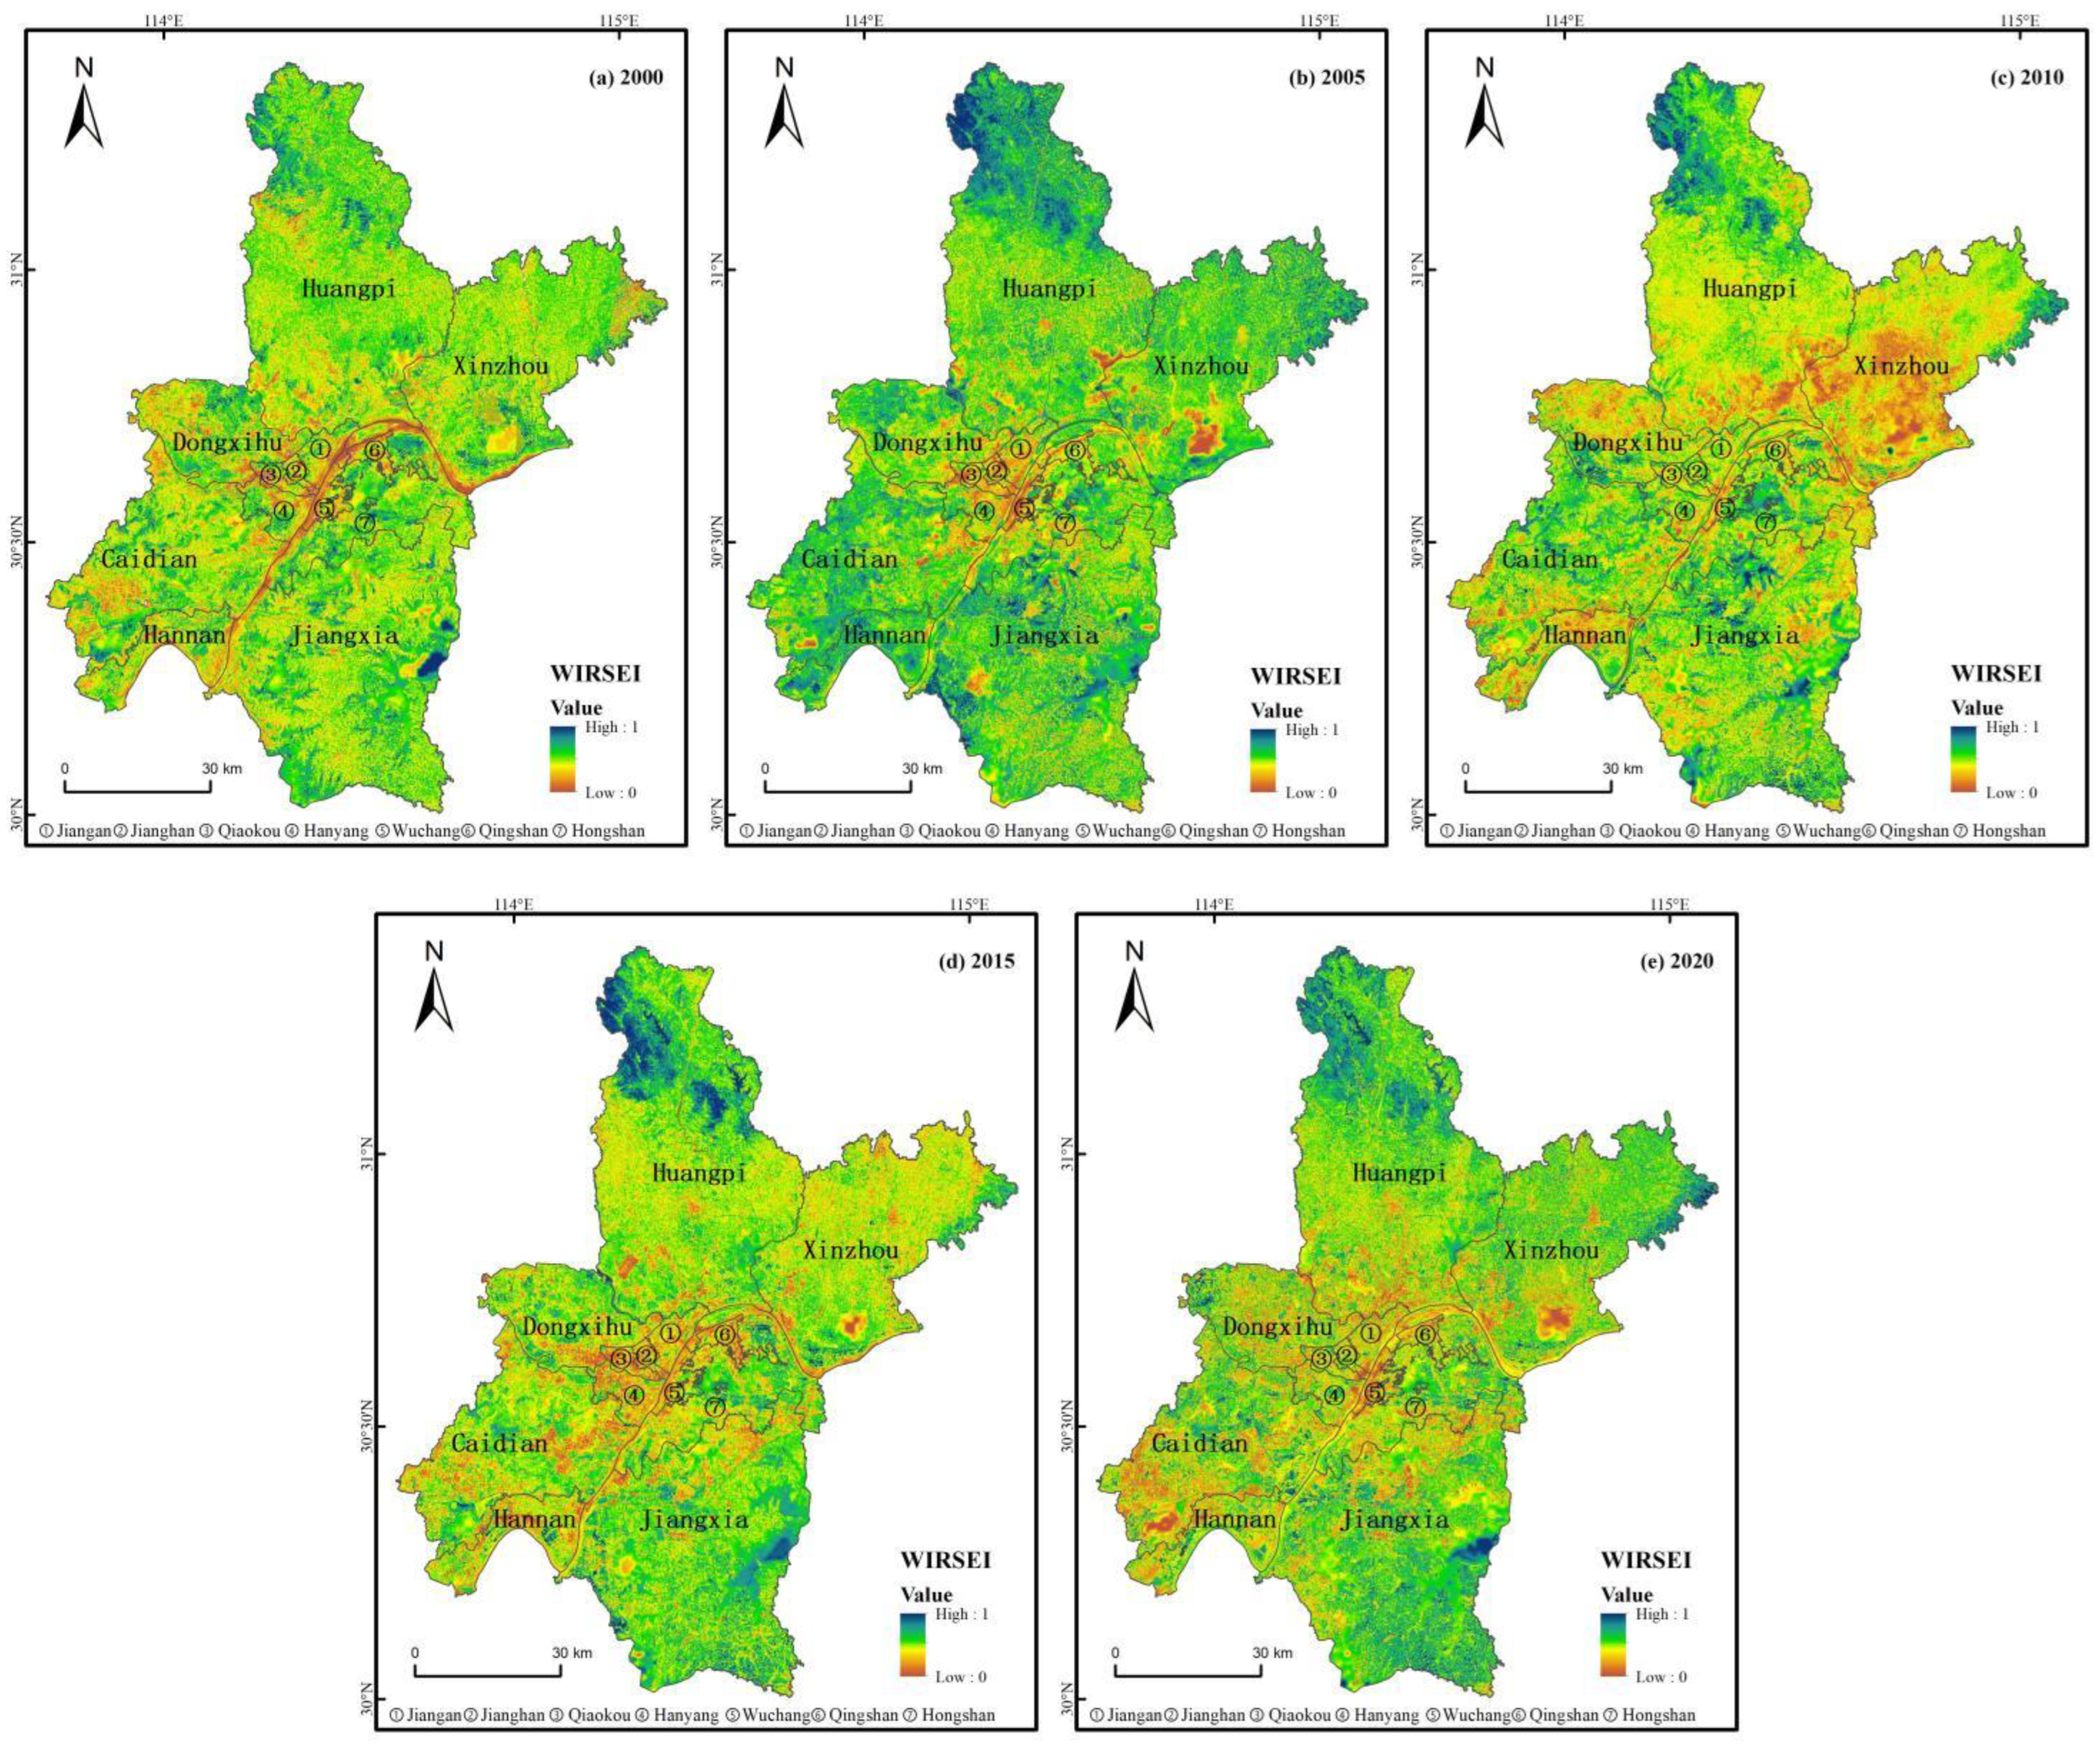
3.2. Spatial and Temporal Distribution of WIRSEI in Wuhan

Based on the spatial distribution characteristics of ecological indicators presented in Section 3.1 and the weight of each indicator (Table 2), the spatial distribution characteristics and causes of WIRSEI for the 5 years of 2000, 2005, 2010, 2015, and 2020 were analyzed (Figure 5). In 2000, the WIRSEI of the Yangtze River, Wu Lake, and Zhangdu Lake were relatively low, mainly due to high AOD and poor air quality. In the land regions, the WIRSEI of Huangpi and central Xinzhou was significantly higher than that of Jiangxia and Hannan, mainly due to the LST surface temperature difference. In 2005, under the influence of AOD and NDBIS, WIRSEI in the central urban region was relatively low. In addition, Wu Lake and Zhangdu Lake were affected by AOD, resulting in low WIRSEI. In 2010, the region from Dongxihu to Xinzhou via the south of Huangpi was a low-value WIRSEI zone, primarily due to its high AOD and poor air quality. In 2015, due to the high LST, the WIRSEI in the central urban region in the middle was low. The spatial difference between WET, NDBSI, and AOD, the WIRSEI in the middle of Huangpi and the north-central part of Xinzhou in the land region was lower than that in Jiangxia. In addition, the higher SS in the Yangtze River led to the lower WIRSEI, the lower AOD in Liangzi Lake contributed to a higher WIRSEI, and the lower SS in Mulan Lake and Taiyang Lake led to the higher WIRSEI. In 2020, WIRSEIs in southern Xinzhou, Huangpi, and western Caidian were low, mainly because of poor air quality and high AOD. In addition, Zhangdu Lake had a high AOD and SS, and the Yangtze River had a high SS, resulting in a low WIRSEI. Overall, the spatial distribution of AOD (air quality) always significantly impacted the WIRSEI of land and water regions. The spatial distribution difference of WET and LST has always had a substantial impact on the WIRSEI of land regions. The influence of other indicators varied greatly in different years.
The spatial distribution of WIRSEI in Wuhan from 2000 to 2020 showed a low center and a high periphery pattern, with seven central urban districts much lower than six remote urban districts. Affected by urban construction and expansion, impervious water accounts for a high proportion of the seven central urban districts, resulting in overall poor ecological quality (Table 3). From 2000 to 2020, the WIRSEIs of six central urban districts, Jiang’an, Jianghan, Qiaokou, Hanyang, Wuchang, and Qingshan, were much lower than those of other districts, most of which were below 0.45. Hongshan District has a large area of non-construction areas as a central urban district, which leads to its average ecological quality being higher than other central urban districts. Hongshan, Dongxihu, Caidian, and Hannan WIRSEIs were between 0.3 and 0.5. Jiangxia, Huangpi, and Xinzhou had the highest WIRSEI values, at 0.45 and 0.55.
From 2000 to 2020 (Figure 6), the overall WIRSEI of Wuhan City exhibited a changing trend of “up–down–up–stable”, with the WIRSEI change in the land region consistent with the overall trend. In addition, the WIRSEI in the water region showed a changing trend of “up–down–down–stable”. The proportion of water area in Wuhan is relatively high, so the water region’s ecological quality dramatically impacts the overall environmental quality. For the convenience of research and visual display, the WIRSEIs of 11 significant lakes and three important rivers were counted (Table 4). In general, the ecological quality of lakes was higher than that of rivers. The Yangtze River has the lowest ecological quality among rivers. Donghu Lake, Tangxun Lake, Liangzi Lake, Taiyang Lake, and Mulan Lake have the greatest water quality, while Wuhu Lake and Zhangdu Lake have the lowest water quality.
Figure 7 depicts the proportion and conversion of WIRSEI grades from 2000 to 2020. It can be seen from the grade conversion that the overall WIRSEI trend is “up–down–up–stable” from 2000 to 2020, which is consistent with the previous research conclusions. The 0–0.2 grade area proportion was the least, fluctuating between 1.14% and 3.73%. The next grade was 0.8–1, and the area proportion fluctuated between 2.5% and 6.6%. The area of grades 0.4–0.6 accounts for the most, with the proportion between 39.91% and 55.1%. The proportion of 0.2–0.4 and 0.6–0.8 grade areas was between 15.5% and 31.7%. From 2000 to 2005, there was a significant improvement in ecological quality. First, over half of the 0.4–0.6 grade area changed to 0.6–0.8 and 0.8–1. Second, in the 0.2–0.4 grade area, more than half of the area varied from 0.4 to 0.6. From 2005 to 2010, the ecological quality decreased significantly, the area proportion of 0.8–1 and 0.6–0.8 grades declined from 48.01% to 18.09%, and the area proportion of 0.2–0.4 and 0–0.2 grades increased from 12.08% to 35.53%. From 2010 to 2015, the ecological quality improved slightly. From 2015 to 2020, the ecological quality was stable.

3.3. Dynamic Monitoring of WIRSEI in Wuhan

In order to further evaluate the spatial difference of WIRSEI changes, the WIRSEI variations were divided into seven categories according to WIRSEI index changes. The detected change level ranged from −1 to +1. A positive value revealed an improvement in ecological quality, whereas a negative value indicated a decline in ecological quality. Among them, −0.1–0.1 was classified as no change, −0.3–(−0.1) as slightly worse, −0.5–(−0.3) as obviously worse, and −1–(−0.5) as significantly worse, whereas 0.1–0.3 shows slightly better, 0.3–0.5 indicates obviously better, and 0.5–1 represents significantly better (Table 5).
Table 6 shows the ecological quality changes in Wuhan from 2000 to 2020. In the past 20 years, 88–93% of the ecological quality change grades have been no change, slightly better, and slightly worse. In 2000–2005 and 2010–2015, the proportion of slightly better was greater than or close to 30%, significantly higher than that of slightly worse. From 2005 to 2010, the proportion of slightly worse was more than 30%, significantly higher than that of slightly better. From 2015 to 2020, the proportions of slightly better and slightly worse were basically the same. In addition, from 2000 to 2005, the proportion of obviously better was 8.3%, significantly more than that of obviously worse, which was 1.64%. From 2005 to 2010, the proportion of obviously better was 1.01%, significantly lower than proportion of 13.68% for obviously worse. This change feature demonstrates that WIRSEI improved greatly from 2000 to 2005, declined considerably from 2005 to 2010, improved slightly from 2010 to 2015, and remained stable from 2015 to 2020.
The spatial distribution difference of WIRSEI variation was analyzed according to Figure 8. From 2000 to 2005, WIRSEI improved in most regions. From 2005 to 2010, the WIRSEI of some areas in the central urban region increased, while the WIRSEI of most other areas worsened. From 2010 to 2015, the WIRSEI of the “Dongxihu Huangpi Xinzhou” region near the north of the central urban districts became better, while the WIRSEI of the “Caidian and Jiangxia” region near the south of the central urban districts became worse because the main direction of urban expansion during this period was to the south. From 2015 to 2020, the WIRSEI did not change in many regions, and the areas of a few regions that improved or declined were roughly equaled.

3.4. Driving Force Analysis of WIRSEI Change

Figure 9 illustrates the spatial distributions of the effect of driving factors on WIRSEI changes. Based on the collinearity principle of drivers, LUCD, GDP, and POP variables were selected as drivers to explain the variations in WIRSEI. The impact of each driving factor on WIRSEI variations shows evident spatial heterogeneity, in which the coefficient of LUCD variables was substantial, and the coefficients of GDP variables and POP variables were small. This shows that land use change was the largest and most direct human activity affecting ecological quality. In contrast, economic and population changes have a less direct impact on ecological quality changes.
From 2000 to 2005, there was a large spatial difference in LUCD variables coefficients between the southern part of Xinzhou and the central urban districts, consistent with the region of WIRSEI variation (Figure 8a). From 2005 to 2010, the spatial distribution of LUCD variables coefficients presents a pattern of gathering in the middle and scattering outside, consistent with WIRSEI’s layout of getting better in the middle and getting worse outside (Figure 8b). In the region of “the south of Dongxihu–the north of Caidian–the central urban districts–the east of Hongshan” between 2010 and 2015, LUCD variables and WIRSEI variation trends were highly positively correlated. In the northeast of Dongxi Lake and the southwest of Huangpi, the east of Caidian and the northwest of Jiangxia, and the east of Jiangxia, LUCD variables were substantially negatively correlated with WIRSEI changes. The spatial distribution of GDP and POP variables coefficients show a pattern of low in the middle and high around. From 2015 to 2020, the spatial distribution of LUCD variables coefficients was dispersed, with higher coefficients in the northeast of Dongxihu, the southwest of Huangpi, the northeast of Hongshan, and the south of Xinzhou. The spatial distribution of GDP coefficient was lower in the middle and higher around.
This trend shows that the change in WIRSEI from 2000 to 2020 was closely related to urban expansion, population change, and economic development. The years 2000–2005, 2005–2010, 2010–2015, and 2015–2020 were four distinctive development and construction stages. From 2000 to 2005, the development was relatively slow, the ecological quality was less affected, and WIRSEI rose. From 2005 to 2010, the city expanded rapidly, the ecological quality was greatly affected, and the WIRSEI was severely reduced in some parts. From 2010 to 2015, development was constant, the impact on ecological quality was reduced, and WIRSEI slightly increased in some areas. From 2015 to 2020, affected by the construction of ecological civilization and the structural adjustment of development, WIRSEI was generally stable, exhibiting a pattern of small in the middle and large in the surrounding area.

4. Discussion

The remote sensing ecological index (RSEI) is a simple and effective ecological quality assessment method. Since Xu [7] proposed RSEI, scholars have increasingly accepted and applied it. Xu and Wang [41] calculated RSEI using Sentinel 2A images to increase spatial resolution. Airiken and Zhang [49] developed the vegetation drought index TVDI to improve the RSEI index to adapt ecological quality assessment in arid areas. Li and Gong [42] presented the entropy approach to enhance index weight determination, while Liu and Dong [50] improved RSEI and added air quality indicators. It is feasible to characterize the land ecological quality with WET, NDVI, NDBSI, and LST indicators that constitute the RSEI index. However, the ecological quality of the water and air regions have not been considered in RSEI. In addition, the ecological quality of the water region is difficult to ignore in areas with a high proportion of water area. The AOD was widely employed to study the spatial distribution of PM2.5 concentration [24,25], so it can be regarded as replacing air quality indicators. The chl_a and SS are the main indicators of remote sensing monitoring of water quality and are widely used [42,43,44,45,46,47]. This study selected chl_a and SS as indicators of the water quality. At the same time, AOD, an air quality indicator, was introduced to improve remote sensing ecological quality assessment. The method was demonstrated to be feasible and can effectively represent the spatial difference in the water quality.
This study evaluated the ecological quality of Wuhan in 5 years (2000, 2005, 2010, 2015, and 2020). In the past 20 years, the ecological quality has significantly fluctuated due to urban expansion. From 2000 to 2005, the overall ecological quality showed an upward trend, mainly due to the substantial increase in the ecological quality of farmland, forests, and waters. The water area stayed unchanged, while the average WIRSEI increased from 0.4924 to 0.5827. The forest area declined from 571.80 km2 to 527.29 km2, but the average WIRSEI rose from 0.6058 to 0.7516. The farmland region decreased from 6480.70 km2 to 6323.41 km2, but the average WIRSEI increased from 0.4950 to 0.5880. From 2005 to 2010, the overall ecological quality showed a downward trend, mainly because the ecological quality of farmland and forests decreased significantly. The area of farmland decreased from 6323.41 km2 to 6143.42 km2, and the average WIRSEI decreased from 0.5880 to 0.4450. The forest area decreased slightly, but the average WIRSEI decreased from 0.7516 to 0.6852. From 2010 to 2015, the overall ecological quality showed an upward trend, mainly due to the rising ecological quality of farmland and forests. The area of farmland decreased from 6143.42 km2 to 5828.97 km2, and the average WIRSEI increased from 0.4450 to 0.5119. The forest area decreased slightly, but the average WIRSEI increased from 0.6852 to 0.7369. From 2015 to 2020, the overall ecological quality was stable.
The change in ecological quality in Wuhan during the past two decades is related to urban expansion, the growth in building land, and the annual decrease in the ecological land. However, simultaneously with the increase in ecological protection and the control and adjustment of urban expansion, the internal ecological quality of ecological land shows a year-over-year upward trend. The interlaced and fragmented situation of construction and ecological lands has also been improved, enhancing the ecological quality to a certain extent. In addition, the ecological quality of the waters showed a significant downward trend after 2005. The water quality was greatly affected by human activities and the ecological environment quality of the surrounding land. It was necessary to strengthen the management and treatment of water bodies, particularly the development of construction land around lakes, agricultural production, sewage discharge, and others. It can be achieved by integrating the POP and GDP driving force analysis results.
Based on RSEI, this study introduced the ecological quality indicators of water and air to form WIRSEI. This research method fills the previous gap of RSEI in water area assessment, which has significant implications for remote sensing assessment of ecological quality in multi-water areas. Air quality indicators have considerably enriched the scope of remote sensing ecological assessment. At the same time, the WIRSEI calculation process of the water and land regions has a separate and parallel relationship. Although it can represent the spatial difference in ecological quality between land and water regions, the ecological quality difference between land and water areas lacks contrast. In addition, this paper refers to the calculation method of RSEI, realizes the weight assignment of each index, and constructs the comprehensive ecological index, WIRSEI, through PCA. However, PCA generally selects the first or the first two main components (the first principal component is selected in this paper, and the cumulative contribution exceeds 90%), resulting in a small amount of missing indicator information. The next step was to evaluate and analyze the relationship between the ecological quality of land and water, and increase the expression of the correlation between the ecological quality of water and land. New remote sensing indicators were included that can simultaneously represent the ecological quality of water and land to improve the ecological quality index. Moreover, new methods will be introduced to improve the lack of information in PCA. In addition, it is suggested to further optimize the remote sensing ecological index by combining remote sensing interpretation of land cover and habitat quality data in the future.

5. Conclusions

This research introduced the ecological quality indicators of water and air, developed the water region improvement remote sensing ecological index (WIRSEI), realized the environmental quality assessment from 2000 to 2020, and analyzed the spatial and temporal evolution and driving force of WIRSEI. The study’s results were as follows:
(1)
On the whole, the spatial distribution difference of AOD, or air quality, always has a substantial WIRSEI impact on land and water. The spatial distribution difference of WET and humidity always significantly affects WIRSEI on land. The influence of other indicators varies highly across years. The spatial distribution of WIRSEI in Wuhan from 2000 to 2020 shows a low center and high periphery pattern, i.e., seven central urban districts were much lower than six remote urban districts. Affected by urban construction and expansion, the impermeable land accounts for a high proportion in the seven central urban districts, resulting in the overall low ecological quality. Wuhan has a relatively high percentage of water area, and the water region’s ecological quality significantly impacts the city’s ecological quality. The ecological quality of lakes exceeds that of rivers.
(2)
From the perspective of WIRSEI grade composition, the 0–0.2 grade area proportion was the least, fluctuating between 1.14% and 3.73%. The next grade was 0.8–1, with the area proportion fluctuating between 2.5% and 6.6%. The area of grades 0.4–0.6 accounts for the most, with the proportion between 39.91% and 55.1%. The proportion of 0.2–0.4 and 0.6–0.8 grade areas was between 15.5% and 31.7%. From 2000 to 2020, the overall WIRSEI of Wuhan exhibited a changing pattern of “up–down–up–stable”. The WIRSEI change in the land region was consistent with the overall trend; however, the WIRSEI variation in the water region showed a changing trend of “up–down–down–stable”.
(3)
Based on the statistics of change degree, 88–93% of the ecological quality change grades during the past 20 years mainly were no change, slightly better, and slightly worse. From the perspective of the spatial distribution of change level, WIRSEI improved in most regions from 2000 to 2005. From 2005 to 2010, the WIRSEI of some areas in the central urban region increased, while the WIRSEI of most other regions worsened. From 2010 to 2015, WIRSEIs of Dongxihu, Huangpi, and Xinzhou near the north of the central city became better, while WIRSEIs of Caidian and Jiangxia near the south of the central city became worse because the main direction of urban expansion during this period was to the south. From 2015 to 2020, it was stable with slight variation.
(4)
The change in WIRSEI from 2000 to 2020 was closely related to urban expansion, population change, and economic development. The impact of land use and economic and social variables on WIRSEI shows apparent spatial heterogeneity. Comparing various driving factors, LUCD variables have a greater impact on WIRSEI changes, while GDP and POP variables have a smaller impact.
The proposed WIRSEI assessment model is feasible and simple, which supplements the expression of ecological quality in the water region. Hence, it can be used as a reference for ecological quality assessment in multi-water regions. The method of introducing water quality and air quality indicators to improve RSEI indicators in this paper can also provide reference for future research on remote sensing ecological monitoring.

Author Contributions

Conceptualization, Y.P. and J.G.; methodology, Y.P. and J.L.; validation, Y.P.; data curation, Y.P.; writing—original draft preparation, Y.P.; writing—review and editing, Y.P. and J.G.; funding acquisition, J.G. All authors have read and agreed to the published version of the manuscript.

Funding

This research was funded by the National Natural Science Foundation of China, grant number 42071254.

Institutional Review Board Statement

Not applicable.

Informed Consent Statement

Not applicable.

Data Availability Statement

The satellite images used in this study are obtained from http://earthexplorer.usgs.gov (accessed on 27 November 2021) and https://ladsweb.modaps.eosdis.nasa.gov (accessed on 9 August 2022). The Land use/cover classification used in this study are obtained from https://data.casearth.cn/ (accessed on 7 December 2021). The Population and Economic used in this study are obtained from https://www.worldpop.org/ (accessed on 14 March 2022) and https://www.resdc.cn/ (accessed on 14 March 2022).

Conflicts of Interest

The authors declare no conflict of interest.

References

  1. Liu, S.; Dong, Y.; Cheng, F.; Coxixo, A.; Hou, X. Practices and opportunities of ecosystem service studies for ecological restoration in China. Sustain. Sci. 2016, 11, 935–944. [Google Scholar] [CrossRef]
  2. Hochreiter, S.; Schmidhuber, J. Long Short-Term Memory. Neural Comput. 1997, 9, 1735–1780. [Google Scholar] [CrossRef] [PubMed]
  3. Lin, T.; Ge, R.; Huang, J.; Zhao, Q.; Lin, J.; Huang, N.; Zhang, G.; Li, X.; Ye, H.; Yin, K. A quantitative method to assess the ecological indicator system’s effectiveness: A case study of the ecological province construction indicators of China. Ecol. Indic. 2016, 62, 95–100. [Google Scholar] [CrossRef]
  4. HJ/T192-2006; State Environmental Protection Administration. Technical Criterion for Eco-Environmental Status Evaluation (Trial). China Environmental Science Press: Beijing, China, 2006. Available online: http://www.gfx.gov.cn/gfx/cmsfile/20201231/2DC4F277436312285C41E7CE29969734.pdf (accessed on 8 November 2022).
  5. HJ/T192-2015; Ministry of Environmental Protection. Technical Criterion for Ecosystem Status Evaluation. China Environmental Science Press: Beijing, China, 2015. Available online: https://www.mee.gov.cn/ywgz/fgbz/bz/bzwb/stzl/201503/W020150326489785523925.pdf (accessed on 8 November 2022).
  6. Ministry of Ecology and Environment. Measures for Regional Ecological Quality Assessment (Trial); China, 2021. Available online: https://www.mee.gov.cn/xxgk2018/xxgk/xxgk03/202111/W020211124377111066485.pdf (accessed on 8 November 2022).
  7. Xu, H. A remote sensing index for assessment of regional ecological changes. China Environ. Sci. 2013, 33, 889–897. [Google Scholar]
  8. Hu, X.; Xu, H. A new remote sensing index for assessing the spatial heterogeneity in urban ecological quality: A case from Fuzhou City, China. Ecol. Indic. 2018, 89, 11–21. [Google Scholar] [CrossRef]
  9. Cai, B.; Shao, Z.; Fang, S.; Huang, X.; Huq, E.; Tang, Y.; Li, Y.; Zhuang, Q. Finer-scale spatiotemporal coupling coordination model between socioeconomic activity and eco-environment: A case study of Beijing, China. Ecol. Indic. 2021, 131, 108165. [Google Scholar] [CrossRef]
  10. Shan, W.; Jin, X.; Ren, J.; Wang, Y.; Xu, Z.; Fan, Y.; Gu, Z.; Hong, C.; Lin, J.; Zhou, Y. Ecological environment quality assessment based on remote sensing data for land consolidation. J. Clean. Prod. 2019, 239, 118126. [Google Scholar] [CrossRef]
  11. Yue, H.; Liu, Y.; Li, Y.; Lu, Y. Eco-Environmental Quality Assessment in China’s 35 Major Cities Based On Remote Sensing Ecological Index. IEEE Access 2019, 7, 51295–51311. [Google Scholar] [CrossRef]
  12. Liao, W.; Jiang, W. Evaluation of the Spatiotemporal Variations in the Eco-environmental Quality in China Based on the Remote Sensing Ecological Index. Remote. Sens. 2020, 12, 2462. [Google Scholar] [CrossRef]
  13. Wang, J.; Liu, D.; Ma, J.; Cheng, Y.; Wang, L. Development of a large-scale remote sensing ecological index in arid areas and its application in the Aral Sea Basin. J. Arid Land 2021, 13, 40–55. [Google Scholar] [CrossRef]
  14. Xu, X. The Study of Remote Sensing Imagery Water Quality Parameter Algorithms and Spatial and Temporal Patterns Variation of Water Quality in Lake Liangzi. Ph.D. Thesis, Wuhan University, Wuhan, China, 2017. Available online: https://kns.cnki.net/KCMS/detail/detail.aspx?dbname=CDFDLAST2020&filename=1018033142.nh (accessed on 8 November 2022).
  15. Tebbs, E.J.; Avery, S.T.; Chadwick, M.A. Satellite remote sensing reveals impacts from dam-associated hydrological changes on chlorophyll-a in the world’s largest desert lake. River Res. Appl. 2020, 36, 211–222. [Google Scholar] [CrossRef]
  16. Yang, X.; Jiang, Y.; Deng, X.; Zheng, Y.; Yue, Z. Temporal and Spatial Variations of Chlorophyll a Concentration and Eutrophication Assessment (1987–2018) of Donghu Lake in Wuhan Using Landsat Images. Water 2020, 12, 2192. [Google Scholar] [CrossRef]
  17. Cao, Z.; Ma, R.; Duan, H.; Pahlevan, N.; Melack, J.; Shen, M.; Xue, K. A machine learning approach to estimate chlorophyll-a from Landsat-8 measurements in inland lakes. Remote. Sens. Environ. 2020, 248, 111974. [Google Scholar] [CrossRef]
  18. Pahlevan, N.; Smith, B.; Schalles, J.; Binding, C.; Cao, Z.; Ma, R.; Alikas, K.; Kangro, K.; Gurlin, D.; Nguyen, H.; et al. Seamless retrievals of chlorophyll-a from Sentinel-2 (MSI) and Sentinel-3 (OLCI) in inland and coastal waters: A machine-learning approach. Remote Sens. Environ. 2020, 240, 111604. [Google Scholar] [CrossRef]
  19. Kim, E.-J.; Nam, S.-H.; Koo, J.-W.; Hwang, T.-M. Hybrid Approach of Unmanned Aerial Vehicle and Unmanned Surface Vehicle for Assessment of Chlorophyll-a Imagery Using Spectral Indices in Stream, South Korea. Water 2021, 13, 1930. [Google Scholar] [CrossRef]
  20. Kravitz, J.; Matthews, M.; Bernard, S.; Griffith, D. Application of Sentinel 3 OLCI for chl-a retrieval over small inland water targets: Successes and challenges. Remote. Sens. Environ. 2020, 237, 111562. [Google Scholar] [CrossRef]
  21. Di Trapani, A.; Corbari, C.; Mancini, M. Effect of the Three Gorges Dam on Total Suspended Sediments from MODIS and Landsat Satellite Data. Water 2020, 12, 3259. [Google Scholar] [CrossRef]
  22. Kupssinskü, L.S.; Guimarães, T.T.; De Souza, E.M.; Zanotta, D.C.; Veronez, M.R.; Gonzaga, J.L.; Mauad, F.F. A Method for Chlorophyll-a and Suspended Solids Prediction through Remote Sensing and Machine Learning. Sensors 2020, 20, 2125. [Google Scholar] [CrossRef] [Green Version]
  23. He, K.; Yang, F.; Ma, Y.; Zhang, Q.; Yao, X.; Chan, C.K.; Cadle, S.; Chan, T.; Mulawa, P. The characteristics of PM2. 5 in Beijing, China. Atmos. Environ. 2001, 35, 4959–4970. [Google Scholar] [CrossRef]
  24. Peng, J.; Chen, S.; Lü, H.; Liu, Y.; Wu, J. Spatiotemporal patterns of remotely sensed PM2. 5 concentration in China from 1999 to 2011. Remote Sens. Environ. 2016, 174, 109–121. [Google Scholar] [CrossRef]
  25. Van Donkelaar, A.; Martin, R.V.; Brauer, M.; Boys, B.L. Use of Satellite Observations for Long-Term Exposure Assessment of Global Concentrations of Fine Particulate Matter. Environ. Health Perspect. 2015, 123, 135–143. [Google Scholar] [CrossRef] [PubMed]
  26. Zhang, X.; Liu, L.; Chen, X.; Gao, Y.; Xie, S.; Mi, J. GLC_FCS30: Global land-cover product with fine classification system at 30 m using time-series Landsat imagery. Earth Syst. Sci. Data 2021, 13, 2753–2776. [Google Scholar] [CrossRef]
  27. Seddon, A.W.R.; Macias-Fauria, M.; Long, P.R.; Benz, D.; Willis, K.J. Sensitivity of global terrestrial ecosystems to climate variability. Nature 2016, 531, 229–232. [Google Scholar] [CrossRef] [PubMed] [Green Version]
  28. Xu, H. A remote sensing urban ecological index and its application. Acta Ecol. Sin. 2013, 33, 7853–7862. [Google Scholar]
  29. Gautam, V.K.; Gaurav, P.K.; Murugan, P.; Annadurai, M. Assessment of Surface Water Dynamicsin Bangalore Using WRI, NDWI, MNDWI, Supervised Classification and K-T Transformation. Aquat. Procedia 2015, 4, 739–746. [Google Scholar] [CrossRef]
  30. Xu, H. Water colour variation analysis of the coastal waters surrounding Xiamen Island of SE China by multispectral and multitem poral remote sensing measurements. Acta Sci. Circum Stantiae 2006, 26, 1209–1218. [Google Scholar]
  31. Townshend, J.R.G.; Justice, C.O. Analysis of the dynamics of African vegetation using the normalized difference vegetation index. Int. J. Remote Sens. 1986, 7, 1435–1445. [Google Scholar] [CrossRef]
  32. Robinson, N.P.; Allred, B.W.; Jones, M.O.; Moreno, A.; Kimball, J.S.; Naugle, D.E.; Erickson, T.A.; Richardson, A.A. A Dynamic Landsat Derived Normalized Difference Vegetation Index (NDVI) Product for the Conterminous United States. Remote Sens. 2017, 9, 863. [Google Scholar] [CrossRef] [Green Version]
  33. Zhang, J.; Zhu, Y.; Fan, F. Mapping and evaluation of landscape ecological status using geographic indices extracted from remote sensing imagery of the Pearl River Delta, China, between 1998 and 2008. Environ. Earth Sci. 2016, 75, 327. [Google Scholar] [CrossRef]
  34. Nichol, J. Remote Sensing of Urban Heat Islands by Day and Night. Photogramm. Eng. Remote. Sens. 2005, 71, 613–621. [Google Scholar] [CrossRef]
  35. Chander, G.; Markham, B.L.; Helder, D.L. Summary of current radiometric calibration coefficients for Landsat MSS, TM, ETM+, and EO-1 ALI sensors. Remote. Sens. Environ. 2009, 113, 893–903. [Google Scholar] [CrossRef]
  36. Buyantuyev, A.; Wu, J. Urban heat islands and landscape heterogeneity: Linking spatiotemporal variations in surface temperatures to land-cover and socioeconomic patterns. Landsc. Ecol. 2010, 25, 17–33. [Google Scholar] [CrossRef]
  37. Li, J.; Song, C.; Cao, L.; Zhu, F.; Meng, X.; Wu, J. Impacts of landscape structure on surface urban heat islands: A case study of Shanghai, China. Remote. Sens. Environ. 2011, 115, 3249–3263. [Google Scholar] [CrossRef]
  38. Sobrino, J.A.; Jiménez-Muñoz, J.C.; Paolini, L. Land surface temperature retrieval from LANDSAT TM 5. Remote. Sens. Environ. 2004, 90, 434–440. [Google Scholar] [CrossRef]
  39. Collins, J.B.; Woodcock, C.E. An assessment of several linear change detection techniques for mapping forest mortality using multitemporal landsat TM data. Remote. Sens. Environ. 1996, 56, 66–77. [Google Scholar] [CrossRef]
  40. Yarbrough, L.D.; Easson, G.; Kuszmaul, J.S. Proposed workflow for improved Kauth–Thomas transform derivations. Remote Sens. Environ. 2012, 124, 810–818. [Google Scholar] [CrossRef]
  41. Xu, H.; Wang, M.; Shi, T.; Guan, H.; Fang, C.; Lin, Z. Prediction of ecological effects of potential population and impervious surface increases using a remote sensing based ecological index (RSEI). Ecol. Indic. 2018, 93, 730–740. [Google Scholar] [CrossRef]
  42. Li, J.; Gong, J.; Guldmann, J.-M.; Yang, J. Assessment of Urban Ecological Quality and Spatial Heterogeneity Based on Remote Sensing: A Case Study of the Rapid Urbanization of Wuhan City. Remote. Sens. 2021, 13, 4440. [Google Scholar] [CrossRef]
  43. Paciorek, C.J.; Liu, Y.; Moreno-Macias, H.; Kondragunta, S. Spatiotemporal Associations between GOES Aerosol Optical Depth Retrievals and Ground-Level PM2.5. Environ. Sci. Technol. 2008, 42, 5800–5806. [Google Scholar] [CrossRef] [Green Version]
  44. Zhang, J.T.; Zhao, Y.D.; Tian, Y.G.; He, Q.Q.; Zhuang, Y.H.; Peng, Y.X.; Hong, S. Spatial non-coupling of air pollutant emissions and particulate matter-related air quality: A case study in Wuhan City, China. Prog. Geogr. 2019, 38, 612–624. [Google Scholar]
  45. Lyapustin, A.; Martonchik, J.; Wang, Y.; Laszlo, I.; Korkin, S. Multiangle implementation of atmospheric correction (MAIAC): 1. Radiative transfer basis and look-up tables. J. Geophys. Res. 2011, 116, 3210. [Google Scholar] [CrossRef]
  46. Lyapustin, A.; Wang, Y.; Laszlo, I.; Kahn, R.; Korkin, S.; Remer, L.; Levy, R.; Reid, J.S. Multiangle implementation of atmospheric correction (MAIAC): 2. Aerosol algorithm. J. Geophys. Res. 2011, 116, 3211. [Google Scholar] [CrossRef]
  47. Fotheringham, A.S.; Brunsdon, C.; Charlton, M. Geographically Weighted Regression: The Analysis of Spatially Varying RelationShips; John Wiley & Sons: Hoboken, NJ, USA, 2003. [Google Scholar]
  48. Liu, J.; Bu, H.; Ao, S. Study on Spatio-Temporal Faeture of Modern Land Use Change in China: Using Remote Sensing Techniques. Quat. Sci. 2000, 20, 229–239. [Google Scholar]
  49. Airiken, M.; Zhang, F.; Chan, N.W.; Kung, H.-T. Assessment of spatial and temporal ecological environment quality under land use change of urban agglomeration in the North Slope of Tianshan, China. Environ. Sci. Pollut. Res. 2022, 29, 12282–12299. [Google Scholar] [CrossRef] [PubMed]
  50. Liu, Y.; Dang, C.; Yue, H.; Lyu, C.; Qian, J.; Zhu, R. Comparison between modified remote sensing ecological index and RSEI. Natl. Remote Sens. Bull. 2022, 26, 683–697. [Google Scholar]
Figure 1. Location of Wuhan city.
Land 11 02272 g001
Figure 2. Overall methodological framework.
Land 11 02272 g002
Figure 3. Spatial distribution of the ecological indicators in the land region.
Land 11 02272 g003
Figure 4. Spatial distribution of the ecological indicators in the water region.
Land 11 02272 g004
Figure 5. WIRSEI in Wuhan from 2000 to 2005.
Land 11 02272 g005
Figure 6. The WIRSEI of the whole, land, and water areas of Wuhan from 2000 to 2020.
Land 11 02272 g006
Figure 7. WIRSEI transformation matrix for 2000, 2005, 2010, 2015, and 2020.
Land 11 02272 g007
Figure 8. Spatial transfer distributions of the ecological levels of the WIRSEI in Wuhan from 2000 to 2020.
Land 11 02272 g008
Figure 9. Spatial distributions of the effect of driving factors on WIRSEI from 2000 to 2020 (coef: coefficient).
Land 11 02272 g009
Table 1. Data used and their source.
Data TypeData UsedDateSpatial ResolutionSource
Remote sensing imageLandsat TM2000, 2005, 201030http://earthexplorer.usgs.gov/ (accessed on 27 November 2021)
Landsat OLI/TIRS2015, 202030
MCD19A22000, 2005, 2010, 2015, 20201000https://ladsweb.modaps.eosdis.nasa.gov/ (accessed on 9 August 2022)
Land use/cover classificationGLC_FCS30-1985-20202000, 2005, 2010, 2015, 202030https://data.casearth.cn/ (accessed on 7 December 2021)
PopulationUnconstrained individual countries 2000–2020 UN adjusted2000, 2005, 2010, 2015, 20201000https://www.worldpop.org/ (accessed on 14 March 2022)
Economic1 km grid data of China’s GDP2000, 2005, 2010, 2015, 20191000https://www.resdc.cn/ (accessed on 14 March 2022)
Note: Due to COVID-19, Wuhan’s GDP declined in 2020, which is not in line with the overall trend; hence it is replaced by the 2019 GDP.
Table 2. Weights of indicators.
Weights/
PCA1
20002005201020152020
Land
Region
Water
Region
Land
Region
Water
Region
Land
Region
Water
Region
Land
Region
Water
Region
Land
Region
Water
Region
WET+0.6208+0.5827+0.6330+0.6665+0.5901
NDVI+0.1236+0.3224+0.3189+0.2380+0.3332
NDBSI−0.3353−0.4673−0.2665−0.3731−0.4119
LST−0.5181−0.0906−0.3712−0.4585−0.2551
AOD−0.4674−0.7616−0.5744−0.8878−0.5373−0.8034−0.3869−0.5491−0.5531−0.6234
chl_a−0.4789−0.4467−0.1722−0.3300−0.1370
SS−0.4366−0.1107−0.5700−0.7679−0.7698
Note: The effect direction of WET and NDVI is positive; the effect direction of NDBSI, LST, AOD, chl_a, and SS is negative. The characteristic contribution of each PCA1 exceeds 90%.
Table 3. The WIRSEI in each district of Wuhan from 2000 to 2020.
Mean20002005201020152020
Jianghan0.35520.35320.44390.32780.4007
Qiaokou0.34230.39120.44080.31550.4049
Qingshan0.35990.45490.41590.35070.3995
Jiangan0.40360.43400.43960.37590.3694
Hanyang0.44300.46310.46430.36980.4306
Wuchang0.34610.39760.45310.40480.3459
Hongshan0.49860.53780.47200.48100.4589
Dongxihu0.46880.55400.43090.48170.4510
Caidian0.47360.58070.48530.46650.4451
Jiangxia0.52090.59230.50670.54810.5351
Huangpi0.51160.61100.48280.54910.5297
Xinzhou0.49050.58280.37650.47110.4985
Hannan0.45750.63900.39000.42940.4440
Table 4. Water RSEI of major lakes and rivers.
20002005201020152020Average
A0.23830.54740.45710.32660.40260.3944
B0.27150.70940.73560.39880.44630.5123
C0.43720.67790.56020.40280.41340.4983
D0.42420.56180.52190.48150.45740.4894
E0.4130.5520.43180.52820.42850.4707
F0.41830.38160.36670.55750.59270.4634
G0.41590.24260.28720.37220.28370.3203
H0.51220.59940.6720.57730.52490.5772
I0.52660.70160.73910.5140.50320.5969
J0.59810.65690.59360.65760.5840.618
K0.55860.48720.52710.53410.53210.5278
L0.60010.58610.61730.58310.55790.5889
M0.52130.66730.53280.79040.74030.6504
N0.51130.6940.63910.83070.80880.6968
Note: A. Yangtze River; B. Hanjiang River; C. Fuhuan River; D. Baishui Lake; E. Hou Lake; F. Wu Lake; G. Zhangdu Lake; H. Dong Lake; I. Tangxun Lake; J. Liangzi Lake; K. Lu Lake; L. Futou Lake; M. Mulan Lake; N. Taiyang Lake.
Table 5. Change in the ecological index grade.
Change GradeWIRSEI Indicator Change
Significantly worse−1–(−0.5)
Obviously worse−0.5–(−0.3)
Slightly worse−0.3–(−0.1)
No change−0.1–0.1
Slightly better0.1–0.3
Obviously better0.3–0.5
Significantly better0.5–1
Table 6. Change in the ecological index grade from 2000 to 2020.
Change Grade
(km2 %)
2000–20052005–20102010–20152015–2020
AreaPercentageAreaPercentageAreaPercentageAreaPercentage
Significantly worse13.930.16%168.071.96%24.680.29%55.330.65%
Obviously worse141.051.64%1173.0713.68%183.442.14%369.524.31%
Slightly worse920.1610.73%3225.7937.61%1312.4615.30%1752.8320.45%
No change3392.7039.55%3187.4137.16%4059.5547.33%4288.7750.04%
Slightly better3306.6338.55%726.198.47%2500.6729.16%1893.3222.09%
Obviously better712.128.30%86.391.01%449.965.25%194.302.27%
Significantly better90.771.06%9.700.11%46.040.54%16.780.20%
Publisher’s Note: MDPI stays neutral with regard to jurisdictional claims in published maps and institutional affiliations.

