Article

Carbon Sequestration Potentials of Different Land Uses in Wondo Genet Sub-Catchment, Southern Ethiopia

1
Wondo Genet College of Forestry and Natural Resources, Hawassa University, Shashemene P.O. Box 128, Ethiopia
2
Ethiopian Biodiversity Institute, Ministry of Agriculture, Addis Ababa P.O. Box 30726, Ethiopia
3
Australian Rivers Institute and School of Engineering and Built Environment, Griffith University, Nathan, QLD 4111, Australia
*
Author to whom correspondence should be addressed.
Land 2022, 11(12), 2252; https://doi.org/10.3390/land11122252
Submission received: 6 October 2022 / Revised: 6 December 2022 / Accepted: 7 December 2022 / Published: 9 December 2022

Abstract

:
Forests play an important role in combating the challenges posed by changing climate through sequestering carbon in their living biomasses and the soil. Tropical forests, which harbour a large number of species, are anticipated to play a great role in this regard due to the favourable growing environments. However, there is limited knowledge of the variability in carbon stock among land use types and its relationship with biodiversity. Therefore, this study assessed the variability in storing the different carbon pools among natural forest, woodland and khat plantation land use types. It also explored the relationship between biodiversity and carbon storage in the different carbon pools. Plant inventory and sample collection were undertaken following standard methods. In addition, soil samples were taken at three depth profile classes of 0–30 cm (top layer), 30–60 cm (middle layer) and 60–100 cm (bottom layer). Results of the study revealed that there was no statistically significant relationship between biodiversity and total biomass carbon, soil organic carbon or total carbon stock at a 95% level of confidence. The results indicated that the natural forest had the highest plant biomass (456.93 Mg ha−1) followed by woodland (19.78 Mg ha−1) and khat plantation (2.46 Mg ha−1). Consequently, the total carbon stock estimate of the natural forest (366.47 Mg ha−1) was significantly larger than that of the woodland (141.85 Mg ha−1) and khat plantation (125.86 Mg ha−1). The variation in total carbon stock among land use types arises from the variation in the total biomass carbon stock. The study results also revealed that soil organic carbon stock decreased with soil depth in all the land-use types. The findings of this study have implication of improving topsoil management in monoculture crops such as khat plantation and conserving natural forests for enhancing carbon sequestration potentials.

1. Introduction

Climate change has posed tremendous challenges to the global environment. In the past several decades, we have experienced many violent weather events that have disrupted the lifestyle of communities across the world [1]. The prevalence of recurrent floods, irregularity of rainfall, rising temperature and melting of ice have caused severe infrastructure losses, agricultural yield reductions, infectious disease outbreaks, famine, and loss of human life in different parts of the world [2,3,4,5,6]. Climate projections show that the change will keep on imposing its multifaceted impacts unless it is quickly unabated.
International conventions on climate change have indicated the importance of using mitigation measures to reduce such impacts. One of the most effective measures of mitigating climate change is managing forests due to their enormous potentials for regulating the global environment [7]. Forests play a substantial role as carbon sinks to mitigate the impacts of the changing climate [8,9]. Tropical forests, in particular, are more productive and cover a large part of the terrestrial ecosystem [10] that make them the focus of REDD+ (reducing emission from deforestation and forest degradation, plus the conservation and enhancement of forest carbon stocks through sustainable forest management) mechanisms. The United Nations initiative of the REDD+ mechanism has given attention to protect tropical forests for they store a large amount of carbon in their biomass [10,11] and are under continuous disturbance [12]. Tropical forests have faced problems of degradation and conversion to other land uses. Consequently, the tropical forest carbon stock in South America and Africa has been decreasing since 1990 [9]. This has been happening regardless of the increasing importance of forest biomass due to its applications in renewable energy, bio-based products development and reducing greenhouse gas emissions.
The extent of change on the carbon stock dynamics in the process of forest degradation and conversion to other land-uses required detail studies, particularly in tropical forests where the process is extensive [13]. Therefore, efforts have been made to quantify the amount of carbon stock in forests and other land-use systems. Two broad categories of carbon storage are measured in forest ecosystems; namely the biomass carbon pool and the soil organic carbon (SOC) pool [14]. Carbon pool is a component of an ecosystem that serves as a reservoir to accumulate or release carbon [14]. Thus, biomass carbon pool is the component that stores carbon in the plant biomass through the process of photosynthesis and releases it to the atmosphere when ecosystems are disturbed [15]. The biomass component is further divided into aboveground biomass (AGB) and belowground biomass (BGB) categories [14]. AGB is the weight of all living materials of plants above the soil surface including the stem, stump, branches, bark, seeds and leaves [14]. The BGB mainly refers to the dry weight of live roots [14]. Biomass of non-living plant components such as litter and deadwood have the potential to store carbon too. Biomass plays a great role in the global carbon balance [16]. Carbon stock, which is the quantity of carbon in a carbon pool, was assessed in each of the carbon pools mentioned above.
Biodiversity conservation is a simultaneously important function of forests. Tropical forests, particularly, harbour many species and support two-thirds of the world’s biodiversity [17]. On the contrary, the recent increase in tropical deforestation and forest degradation has affected biodiversity [17,18]. This was particularly true since REDD+ programs have a prime concern to carbon stock enhancement rather than biodiversity conservation [19]. However, biodiversity conservation should get similar attention to carbon stock enhancement. There is interest in the possibility for carbon stock enhancement projects to incorporate biodiversity conservation objectives. This needs information about the congruency of biodiversity conservation to carbon stock enhancement. There is uncertainty in our understanding of the relationship between carbon storage and biodiversity [20]. Studies are needed to understand the relationship between carbon storage and biodiversity conservation in different land-use types. Field measurement of carbon stock provides an accurate estimate of the different carbon pools and their contribution to the total ecosystem carbon stock [21]. Therefore, the objectives of this study were to: (1) estimate carbon stock in the various carbon pools in natural forest, woodland and khat plantation in Wondo Genet sub-catchment, (2) explore the relationship between different components of carbon stock and biodiversity, and (3) investigate the effect of soil depth on the SOC stock.
This study tried to test the following research hypothesis.
  • There is no variation in mean carbon stock of the different carbon pools among natural forest, woodland and khat plantation.
  • Biodiversity does not have significant relationship with different components of carbon stocks.
  • Soil depth does not have any effect on soil organic carbon stock.

2. Methods

This study assessed the variations in carbon stock potentials of different land use types in one of the tropical ecosystems and compared them with biodiversity variables. The methods used in this study are established methods for collecting and analysing carbon stock and biodiversity data in various parts of the world. Therefore, standard methods for measuring tree, shrub, soils and plant characteristics and data analysis were adopted from previous scientific works.

2.1. Study Area Description

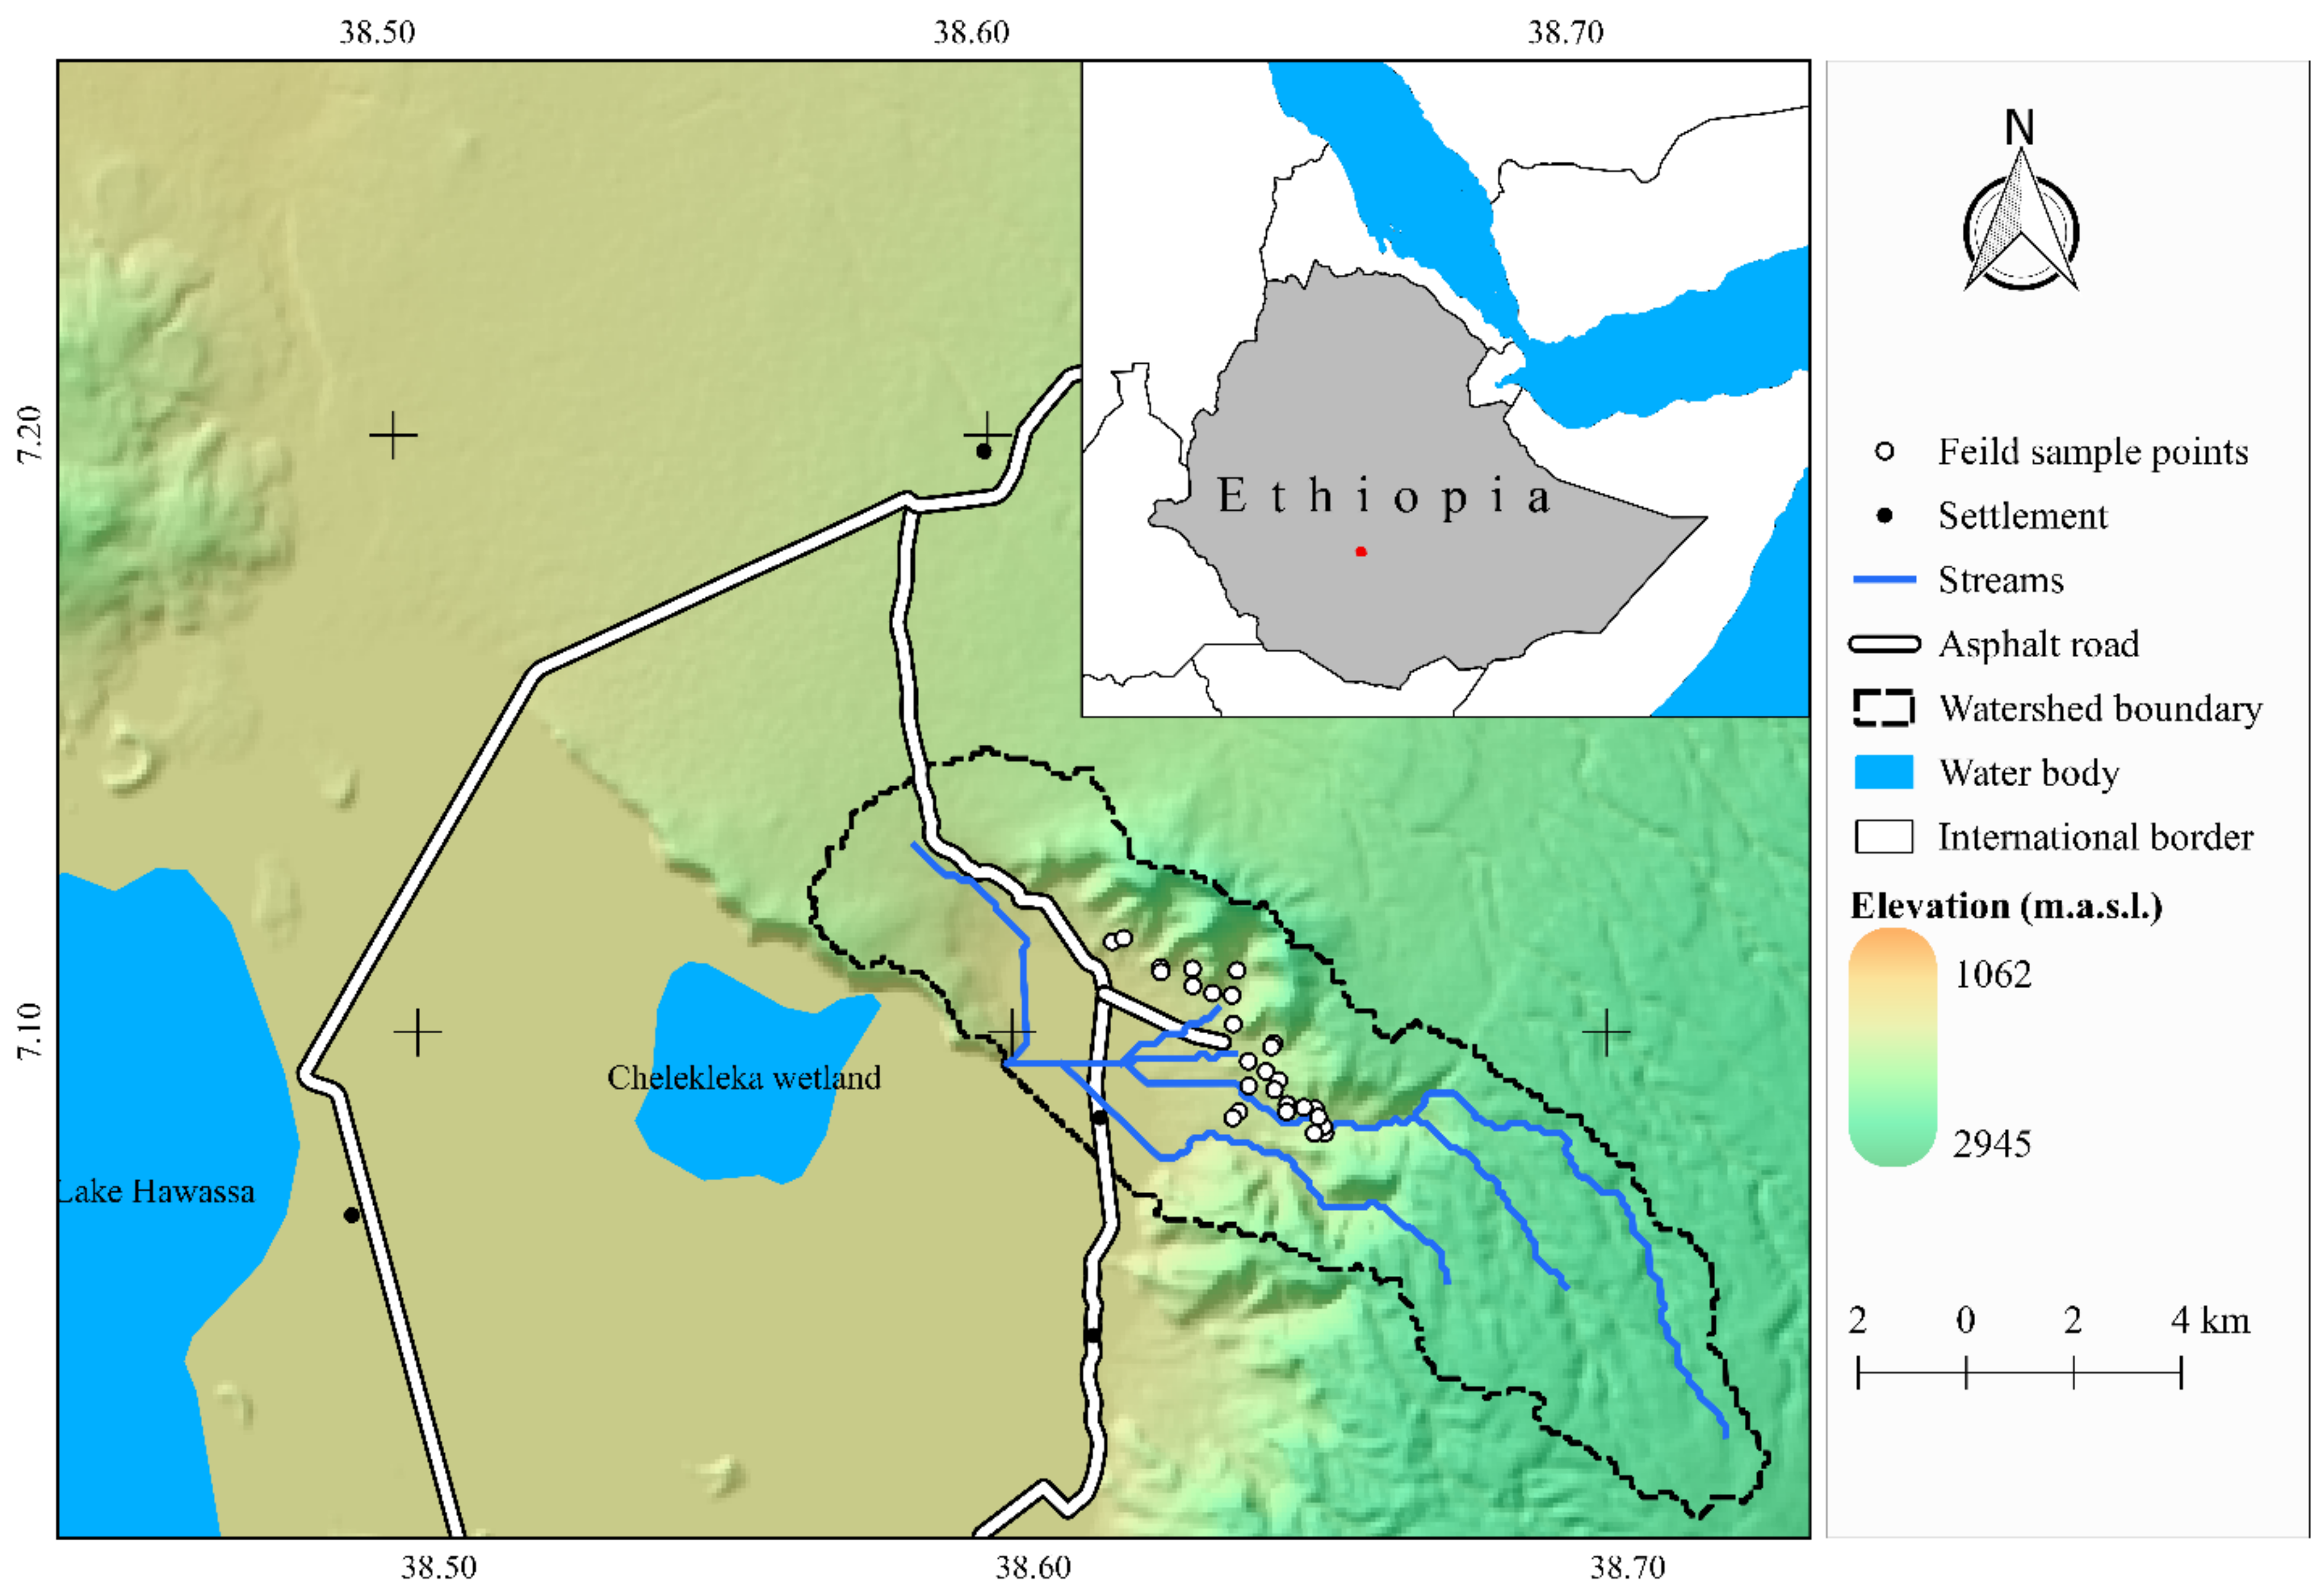
The study was conducted in Wondo Genet sub-catchment, which used to be an intact forest some decades ago [22]. The mountain ranges are sources of streams that drain to the Chelekleka wetland and then to Lake Hawassa. Therefore, the catchment is an important terrestrial ecosystem that connects tourism, agriculture, urban livelihoods and ecosystem services including biodiversity conservation.
Wondo Genet sub-catchment is geographically located between 38°56′ and 38°73′ E longitudes and between 7°01′ and 7°15′ N latitudes (Figure 1). The altitudinal range of the study area is from 1770 to 2584 m above sea level. The dominant soil types in the sub-catchment are Luvisols (Alfisols), Andosols (Andisols) and Nitisols (Kandic alfisols, Utisols and Inceptisols) according to the FAO-UNESCO (and USDA) soil classification schemes, respectively [23]. The area has bimodal rainfall with mean annual precipitation at Wondo Genet station of about 1200 mm. The main rainy season is from June to August, while small rains come between March and April. The mean monthly temperature of the area ranges from 19 °C to 25 °C. The main land-use types in the sub-catchment are natural forest, plantation forest, woodland, khat plantation, sugarcane plantation, agriculture and settlements. The dominant tree species in the natural forest and woodland land-use types include Celtis africana, Pouteria adolfi-friedericii, Acokanthera schimperi, Albizia schimperiana, Millettia ferruginea, Combretum molle, Croton macrostachyus and Afrocarpus falcatus. Although the forests provide multiple services to the local community, they are under huge pressure due to illegal cutting of trees and land-use change for settlement and expansion of monoculture plantations, particularly khat. Consequently, the rich biodiversity in the Wondo Genet natural forest has dwindled in recent decades due to illegal logging and conversion of the forests to monoculture of khat and sugarcane plantations [24,25].

2.2. Sampling Design

Stratified random sampling design was employed to collect the field data. A sketch map of the land use types was derived from high-resolution Google Earth images supported with field validation. The strata used for this study were dense remnant forest patches, woodland and khat cultivated land uses. Ten samples were surveyed in the natural forest and woodland while it was possible to collect seven samples in the khat plantations due to restrictions to access the remaining three plots.
A nested plot design was used to collect data of the different carbon pools from each sample plot location. The total tree height and diameter at breast height (i.e., at 1.3 m above the ground) of individual trees ≥50 cm were measured in the sampling plots of 35 m × 35m (1225 m2) area using hypsometer and calliper or diameter tape based on the size of the trees, respectively. Shrubs and trees with smaller DBH (diameter at breast height), which is the diameter at 1.3 m above the ground, were measured in the nested plots as indicated in Table 1.
In each of the sample plots in the natural forest and woodland, three subplots were identified for grass, litter and soil sampling. These plots fall were established along the diagonal of the big sample plot at an interval of 12 m. In each of the sub-plots, the herbaceous plants were harvested, the litter separately sampled, and fresh weights measured. Then, at each of the sub-plots, a soil profile was dug to collect soil samples for bulk density and carbon content analysis. Soil samples were taken at three depth class of 0–30 cm, 30–60 cm and 60–100 cm.
Data regarding deadwood biomass was collected in the natural forest and woodland sampling plots along a North–South transect line that passed through the plot centre. The line had a length of 100 m (50 m on to the North and South directions). Deadwood found within a width of 5 m on each side of the line was measured for diameter and length. Besides, wood samples were brought to the laboratory for carbon fraction analysis.

2.3. Plant Diversity Analysis

The list and number of all woody plants was recorded during the field survey for biodiversity assessment. Different biodiversity indicators were calculated to identify the ones that better characterize carbon stock. Below are the equations for calculating the diversity indices used in this study [26].
D S = 1 i = 1 s n i n i 1 N N 1
H = i = 1 s p i × ln ( p i )
R = s N
where D S is Simpson’s index (entropy); H is Shannon–Weiner diversity index; R is the species richness index; n i is the total number of individuals of one species (i); s is the number of species; N is the total number of individuals of all the species; p i is the species abundance (proportion of the total number of individuals of a species from the community or the probability that a given individual belongs to the species) and is calculated as p i = n i N .

2.4. Estimation of Tree and Shrub Biomass Carbon

Live biomass of trees and shrubs were estimated using non-destructive field survey sampling and allometric equations. Tree AGB was estimated from DBH and tree height measurements using the generalized biomass regression model for tropical forests suggested by Chave, Réjou-Méchain [27].
y tree = 0.0673 × ρ × DBH 2 × H 0.976
where y tree is the tree biomass (Kg); ρ is wood basic density (g cm−3); DBH is the diameter at breast height (cm), and H is total tree height (m).
The wood basic density data of individual tree species were obtained from different sources including the global wood density database [28] and ICRAF wood density database (http://db.worldagroforestry.org/wd; accessed on 10 October 2022). Those tree species for which we found local research findings, we used the basic wood density values from the local research findings in Ethiopia [29,30,31,32].
The general model of shrub biomass estimation developed for Australia by [33] was adopted for estimating AGB of shrubs and saplings.
y sh = 1.128 × e 2.428 × ln ( D 10 3.007 )
where, y sh is the dry weight of the plant (kg); e is Euler’s number, which is a mathematical constant approximately equal to 2.71828; D 10 is diameter at 10 cm height.
The individual plant biomass in each sample plot (expressed in kg/m2) was converted to plot-level AGBj (Mg ha−1) using Equation (6).
AGB j = i = 1 n AGB i , j a j × 10 , 000 1000
where AGB i , j is the aboveground biomass (kg) of a single tree or shrub (i) in plot j; n is the number of measured trees or shrubs in sample plot j; and a j is the area of plot j in which the tree or shrub was measured; factor 1000 is the conversion of sample units of kg to Mg, and factor 10,000 is the conversion of the area in m2 to a hectare.
In addition to the AGB, BGB of woody plants is an important carbon pool for many vegetation and land use types. Therefore, the amount of BGB was estimated from root-shoot ratio estimates, which account for about 20–24% of the AGB in tropical forests based on the amount of AGB (Cairns et al., 1997; Mokany et al., 2006). This conversion factor was adopted since BGB estimation is more difficult and time-consuming than estimating AGB. Equation (7) was used to calculate BGB of trees and shrubs based on Ponce-Hernandez (2004) and Gibbs et al. (2007).
BGB = 0.20 × AGB ,                 for   plots   with   AGB < 125   Mg   ha 1   0.24 × AGB ,                 for   plots   with   AGB 125   Mg   ha 1
Carbon stock content in the total biomass (TB) of trees and shrubs was estimated by multiplying the TB (i.e., the sum of AGB and BGB) by 0.47, which is a default carbon fraction accepted by the international panel on climate change [34,35].
BCD = TB × 0.47
where BCD is the tree and/or shrub biomass carbon density (Mg ha−1).

2.5. Biomass Carbon of Herbaceous Vegetation

For determining biomass carbon stock of herbaceous vegetation (which includes different grass species and seedlings of trees or shrubs), samples collected using destructive techniques were oven-dried at a temperature of 70 °C until constant weights were achieved. Then, the oven-dried samples were ignited at 550 °C for three hours in a furnace for carbon content determination. The ash was weighed and carbon fraction calculated. The carbon stock of herbaceous vegetation samples at each sample plot j ( HBC j , Mg ha−1) was calculated using Equation (9), which was recommended by Pearson et al. (2005) [36].
HBC j = i = 1 3 ( W field i ,   j a × W dry i ,   j W fresh i ,   j ) 3 × 100 × cf
where W dry i ,   j , W fresh i , j and W field i ,   j are weights of the oven-dried sub-sample (ignited), fresh sub-sample (ignited), and fresh sample (field sample) of the ith sample of the jth sample plot, respectively; i is the index of the samples collected in the sampling plot j (1, 2 or 3); cf is the carbon fraction (%); and a is the area of the sampling quadrants, which was 0.25 m2 in this study.

2.6. Deadwood Carbon

Deadwood carbon was estimated by applying the general log volume estimation technique using Smalian formula (Equation (10)), and converting the estimated volume to biomass and then to carbon [37].
V = f Ds 2 + Db 2 * L / 2
where V = wood volume ( m 3 ) ,   Ds = small diameter (cm), Db = large diameter (cm), L = length (m), and f (i.e., adjustment factor) = 0.00007854.
The wood volume was converted to biomass of deadwood by multiplying it with the density of the wood samples obtained from laboratory analysis [38] (Equation (11)).
DWC   =   V   ×   ρ   ×   cf
where DWC is the deadwood carbon density (Mg ha−1), ρ is wood density (g m−3), and cf is the carbon fraction.

2.7. Carbon Stock in Litter Biomass

Litter layer is defined as all dead organic surface material on top of the mineral soil. It includes recognizable materials such as dead leaves, twigs, dead grasses and small branches. Equation (9) was used to determine litter biomass carbon (LBC) stock. The total dry weight was determined in the laboratory after oven drying of the sample. Oven-dried samples were taken into pre-weighed crucibles. The samples were ignited at 550 °C for one hour in a furnace. Then, the crucibles with ash were weighed and the percentage of organic carbon was calculated.

2.8. Soil Organic Carbon Estimation

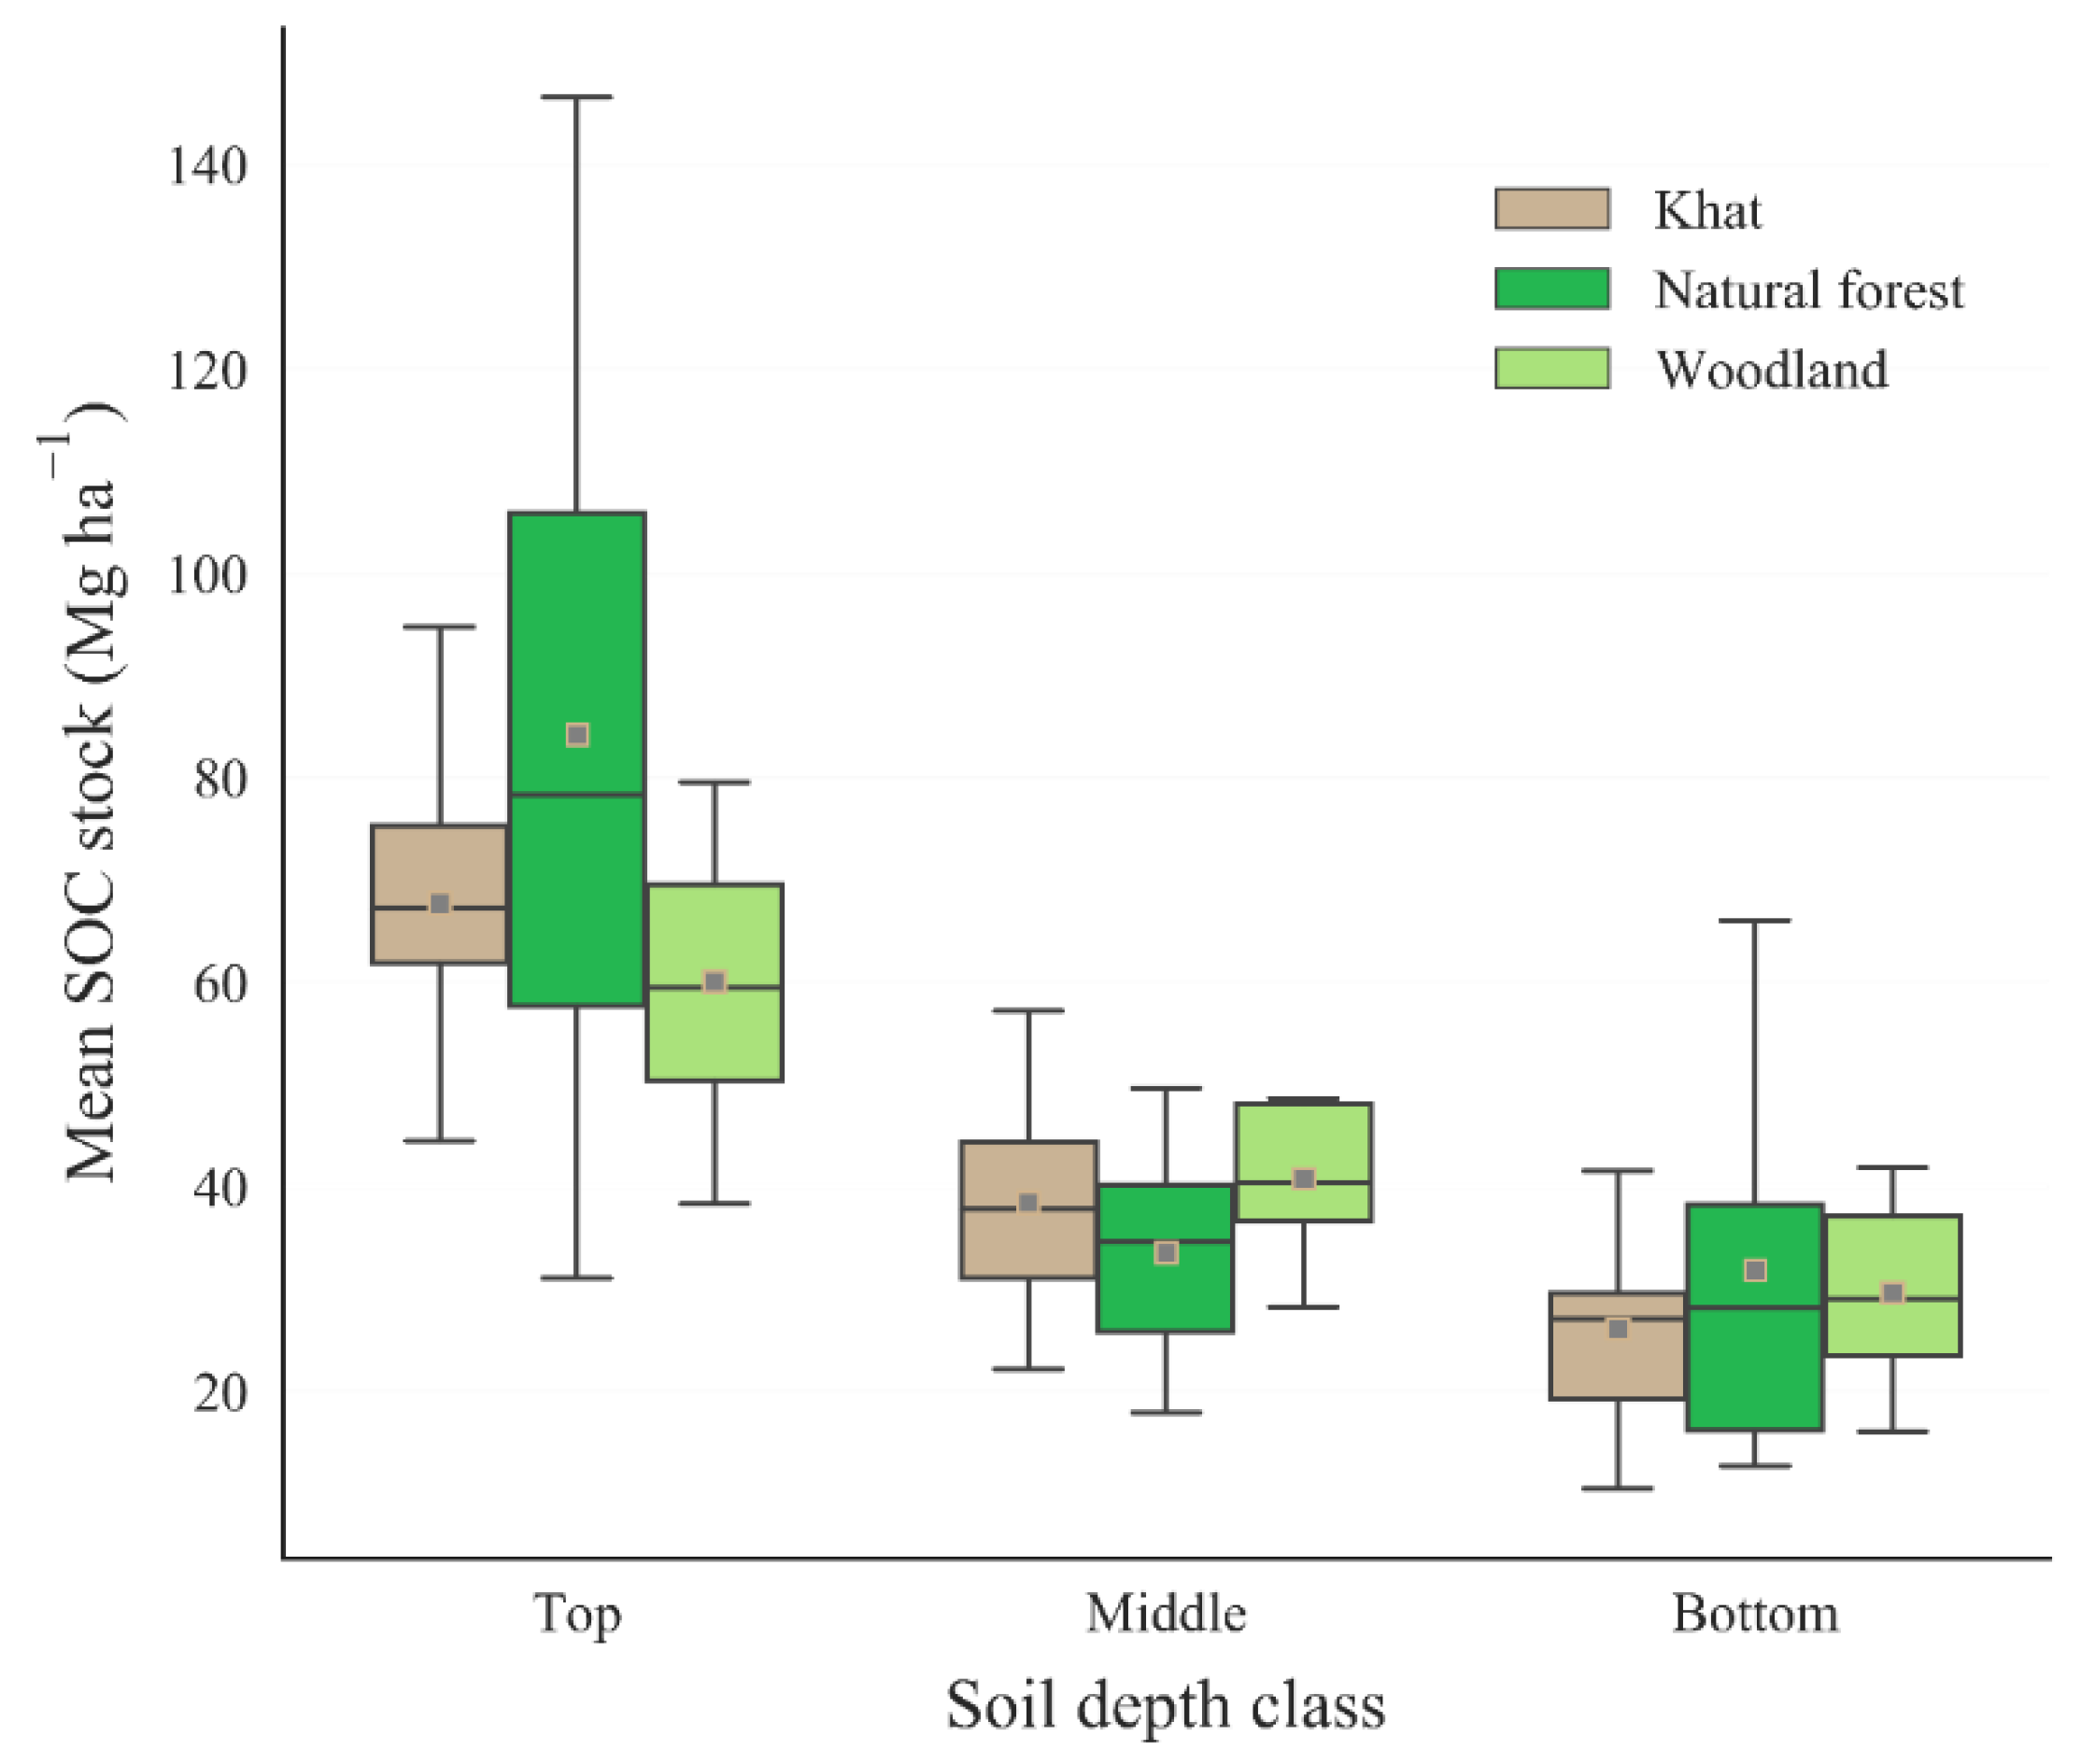
In this study, 81 soil samples were collected from three sub-plots in each of the 27 sample plots. At each of the soil sampling sites, a soil profile to a maximum depth of 100 cm was dug depending on the presence of the impervious bedrock at a depth less than 100 cm. Samples were taken at three profile classes of 0–30 cm (top layer), 30–60 cm (middle layer) and 60–100 cm (bottom layer). Three types of soil variables were measured; namely depth, bulk density (calculated from the oven-dried weight of a known volume of sampled soil), and the concentrations of organic carbon within the sample [36].
For bulk density assessment, undisturbed mineral soil samples were collected using a core sampler and oven-dried at 105 °C for about 24 h until constant weights were attained. The soil bulk density was calculated as the ratio of the oven-dried weight of the soil sample to the volume of the core sampler (Equation (12)).
Bulk   density   g cm 3 = mass   of   oven     dried   soil   g total   volume cm 3
A composite sample was created for each plot for chemical analysis. The Walkley and Black [39] was used to determine organic carbon content after the samples were grounded and passed through a 2 mm sieve. The SOC (Mg ha−1) at each soil profile class or the total SOC was estimated as the product of organic carbon content (C, %), soil bulk density (ρ, g cm−3) and soil depth (d, cm) as shown in Equation (13) [36,40].
SOC   =   ρ   ×   d   ×   C  
Hence, the total SOC density at a sampling plot was obtained by summing up the SOC of the soil profile depth classes.

2.9. Carbon Stock in Khat Plantation

We conducted plant density assessment in seven of the planned ten randomly selected khat plantation sites. We found that the average spacing between khat plants in the plots studied was 70 cm, which yields a stocking of 20,000 khat plants per hectare. We did not get permission from the owners of the remaining three sites to collect samples. Thus, 14 khat plants were harvested in the seven sample plots and sorted into stem and root sections. The fresh weight of the stem and root were measured separately. They were dried and their carbon fractions analysed. Then, the carbon stock of the stem and root parts were calculated using a modified form of Equation (9) [36].
KBC   = W field a × W dry i ,   j W fresh i ,   j × 1 10 , 000 ×   cf
where KBC is khat biomass carbon (aboveground or belowground); W dry i ,   j , W fresh i , j and W field i ,   j are weights of the oven-dried sub-sample (ignited), fresh sub-sample (ignited), and fresh sample (field sample) of the ith sample of the jth sample plot, respectively; i is the index of the samples collected in the sampling plot j (1, 2 or 3); cf is the carbon fraction (%); and a is the area of the sampling quadrants, which was 0.25 m2 in this study.
The aboveground and belowground biomass carbon stocks of the khat plants in the same plot were averaged to get a typical estimate of aboveground khat biomass carbon (AKBC) and belowground khat biomass carbon (BKBC) stocks. The AKBC and BKBC of respective plots were added to obtain TBC of the khat plots.

2.10. Total Carbon Stock Estimation

The total carbon stock (TCS) at each sample plot was calculated by summing up the carbon stock densities of the individual carbon pools in the plot. Accordingly, TCS was estimated using Equation (15) [41].
TCS = TBC + HBC + DWC + LBC + SOC ;   for   natural   forest   and   woodland AKBC + BKBC + SOC ;                                                                                                     for   khat   plantation

2.11. Statistical Analyses

Shannon-Wiener, Simpson’s diversity and species richness indices were compared to identify one index for discussing biodiversity in the land used types and its relationship with carbon stock. Pearson’s correlation analysis was used to explore the relationship between biodiversity and biomass carbon stock.
We used analysis of variance (ANOVA) test to study the effect of forest disturbance or conversion to monoculture khat plantation on the carbon stock distribution. The fixed effects of land use (natural forest, woodland, and khat-cultivated land) on biomass and carbon stock distribution in each carbon pool were compared. For those factors that showed significant differences in biomass or carbon distributions, the mean estimates were compared using the Tukey honestly significant difference (HSD) test (p = 0.05). ANOVA test was also used to explore the effect of soil depth on mean estimates of SOC. Data analysis was run in python programming language.

3. Results

3.1. Plant Diversity Indices

The three indices of plant diversity used in this study were strongly intercorrelated (Table 2) suggesting the possibility to select one of them without causing a severe consequence in the overall results. Therefore, we chose the Simpson’s index (Ds) in this paper since it is strongly correlated to the commonly used Shannon–Wiener index (H’) and is a standardized index that helps comparison of the results between land-use types.
Results indicated that natural forest has higher diversity than woodland with mean Ds of 0.84 and 0.76, respectively (Table 3). The khat plantation has Ds of zero since it is a monoculture. Results of ANOVA test revealed that the mean Ds index among the land use types were significant at 95% confidence level. However, multiple comparisons of the means were assessed using the Tukey HSD test and showed that the mean diversity estimates of forest and woodland were not significantly different. The uncertainty in the estimates of Ds in the natural forest was less than that in the woodland indicating the presence of a more diverse species and intact distribution around the average in the forest patches than those in the woodland where the species diversity swings wider from the average.
Findings of correlation analysis indicated that there was no statistically significant relationship between biodiversity and TBC, SOC or TCS estimates at a 95% level of confidence (Table 4).

3.2. Biomass Distribution by Land Use Type

Table 5 shows that there was a distinct plant biomass distribution in the three land-use types. The natural forest had the highest plant biomass (456.93 Mg ha−1) followed by woodland (19.78 Mg ha−1). Although the planting stock of khat was very dense at an average spacing of 70 cm (i.e., 20,000 plants ha−1), its total biomass density was only 2.46 Mg ha−1. The mean plant biomass (sum of AGB and BGB) estimates of the plots in the natural forest had larger standard error than the plots in the woodland and khat plantation.

3.3. Comparison of Carbon Stocks by Land Use Type

Estimates of carbon stock in different carbon pools by land-use types are shown in Table 6. The mean TCS ranged from 125.86 Mg ha−1 in the khat plantation to 366.47 Mg ha−1 in the natural forest. The results revealed that the proportion of carbon stock in the carbon pool components vary among land-use types. The contribution of HBC and DWC to the TCS of each land use type was not significant with less than 1% share of the TCS. More than half (58.6%) of the carbon in the natural forest was contributed by the biomass of trees and shrubs while the share of SOC was 40.8%. On the other hand, the share of SOC was more than 92% and 99% of the TCS of woodland and khat plantation, respectively.
The share of different carbon pool components in the TCS was significantly different among the land use types at 0.05 level of significance.

3.4. SOC Distribution across Soil Depth Classes

The biomass carbon stock from woodland and khat plantation was very small (Table 5), particularly as compared to the SOC stocks. The study has shown that most of the TCS of these land-use types came from the SOC. Therefore, we explored the variability of SOC across the soil depths and land use types. Figure 2 shows the vertical distribution and statistical variation of SOC stock by land-use types. The results revealed that SOC stocks did not significantly vary by land-use type. However, SOC stocks vary significantly among soil depth classes at 0.05 level of significance. The uncertainty in SOC stock estimates in the sample plots of the natural forest was the largest while that in the woodland was the smallest.
Multiple pairwise comparison of means using Tukey HSD test indicated that the SOC at the top layer was significantly different from that at the middle and bottom layers (see Table 7) at 0.05 level of significance.

4. Discussion

4.1. Relationship between Biodiversity and Carbon Stock

Assessing biodiversity, which is an indicator of the stability of an ecosystem, is useful for understanding the status of a vegetation ecosystem [42]. Three of the biodiversity indices used in this study were strongly intercorrelated and hence Simpson’s diversity index was selected for further analysis since it has standardised values suited for comparison across land-use types (Table 2). As expected, the Simpson’s diversity index of khat plantation was significantly lower than that of the natural forest and woodland since it was covered with a single species only (Table 3). However, the estimates of mean Simpson’s diversity index for natural forest and woodland were not significantly different from each other (Table 4). This might indicate the level of disturbance in the form of illegal logging of economically important tree species and illegal settlement in the natural forest, which contribute to reducing the woody plant species diversity [24].
Correlation analysis of Simpson’s diversity index with TBC, SOC and TCS revealed that plant diversity has a positive relationship with the different carbon stock values implying the potential of improved biodiversity for enhancing carbon sequestration (Table 4), which is in agreement with the findings of Strassburg, Kelly [43]. However, the relationship was not statistically significant at 95% confidence level. Hence, diversity indices did not explain the variability in biomass carbon, SOC or TCS in this study. The absence of a statistically significant difference is in line with other studies [19,44,45].
The study results indicated that the natural forest had considerably higher biomass than the woodland and khat plantation (Table 5). The high biomass distribution in the natural forest might be attributed to the fact that fuelwood collectors from the northern part of the catchment have a topographic barrier that restricted them from easily accessing to the site [22]. Similarly, government institutions such as Wondo Genet College of Forestry and Natural Resources protected the remnant forest patches in the gorges and saved big trees from illegal loggers. The higher standard error in the biomass estimates reveals this phenomenon (Figure 2). The high variability in the biomass distribution of the natural forest shows the heterogeneity in the growing environment (Figure 1) mainly due to topography [22]. The natural forests of Wondo Genet sub-catchment accumulate relatively similar TB to the findings in a dry Afromontane forest in Awi Zone of northwestern Ethiopia [46].

4.2. Carbon Pools and Their Contribution to the Total Carbon Stock

The research findings indicated that herbaceous vegetation and deadwood biomass had a very small contribution to the TCS estimates in each of the land use types under study (Table 6). The small biomass of herbaceous vegetation could be related to forest degradation due to traditional fire and illegal grazing on the undergrowth vegetation [24,47]. The intensive firewood collection because of easy access from the nearby towns and villages might be responsible for the small deadwood biomass stock in the natural forest and woodland. A similar result was observed in Pakistan [48]. In the natural forest and woodland land-use types, total biomass carbon of trees and shrubs and SOC were important in determining the TCS. The small contribution of litter biomass carbon to the TCS might be related to the extent of disturbance as observed in Taita Hills forests of Kenya in the study by Wekesa, Leley [49]. There has been frequent forest fires that could remove the litter layer [47]. Almost all of the TCS of the khat plantation came from the SOC. Examination of the variability in mean TCS estimates revealed that land use was the main factor influencing the TCS distribution. The mean estimates of TCS in the natural forests of Wondo Genet sub-catchment were higher than that of the woodland and khat plantation. The estimated TCS of the natural forest agreed with the findings by Addi et al. [50] in the moist Afromontane Gesha-Sayilem forest, which had a TCS of 362.4 Mg ha−1, and that by Gebeyehu et al. [46] in the dry Afromontane forests in Awi Zone. This large TCS in the natural forest could be attributed to the presence of big trees in the gorges where moisture and nutrients are abundant (Table 6). Biomass carbon component was responsible for the differences in TCS among the land use types. Generally, the natural forest in Wondo Genet sub-catchment stores considerably large amount of carbon and plays an important role in mitigating the challenges of climate change.

4.3. Soil Organic Carbon in Different Land Uses and Its Variability across Depth Classes

The study results indicated that there was more SOC at the top layer in the natural forest than in the woodland and khat plantation (Table 6). This could be related to the level of disturbance in the land use types. The natural forest is relatively less disturbed and has more inflow of organic matter that increased the SOC at the top layer. The uncertainty in estimates of SOC at the top layer in the sample plots of the natural forest was also larger than that of the woodland and khat plantation (Figure 2), which might be associated with the topographic variation that resulted in microclimate variability and soil organic matter distribution. More SOC accumulates in the gorges while ridges have low SOC. However, the differences in SOC levels among the land use types were not statistically different (Figure 2). This shows the stability of SOC among land-use types. Among the variables explored in this study, only soil depth was the main factor that explained the variability in mean SOC estimates in the current study (Figure 2; Table 7). The topsoil had significantly larger SOC than the middle and bottom layers, the latter of which were not statistically distinct from each other (Table 7).

5. Conclusions

A weak linear relationship that exists between biodiversity metrics and carbon stock variables implies the feasibility of any forest type for carbon sequestration projects regardless of the diversity of species.
There was no statistically significant correlation between TBC, SOC and TCS and the selected biodiversity indicator in this study. Although existing literature supported the results, the study had a small sample size and limited geographic coverage to generalize about the actual relationship of biodiversity and the different carbon pools. We recommend further investigation in a wider geographic area with a larger sample size to generalize the findings in this study.
The SOC and TBC contributed to a large part of the TCS estimates for each of the land-use types used in this study. The SOC was consistent in all the land use types making it a stable carbon pool that serves as a sink of organic carbon. In addition to the SOC, a large proportion of the TCS in the natural forest was contributed by the TBC in trees and shrubs. Forest degradation and conversion to cash crop production systems such as khat plantation affect the carbon budget significantly. Therefore, REDD+ projects should focus on afforestation and sustainable forest management to sequester carbon in the woody plant biomass. On the other hand, the proportion of HBC, DWC and LBC were insignificant. Thus, carbon monitoring projects, particularly in dense forest ecosystems; need to focus on accounting for the biomass carbon in trees and shrubs as well as the SOC.
As an important carbon pool, the SOC has a significant contribution to the TCS in each land-use type. The topsoil profile has large SOC stock irrespective of the land use types. Although the variation was not significant, the results indicated that the natural forest has a higher SOC in the topsoil layer than the other land-use types. The estimated SOCs of the land use types were inseparable in the lower soil layers. This has implication of maintaining appropriate topsoil management to enhance carbon accumulation in the soil.

Author Contributions

H.T.: Conceptualization, Methodology, Software, Data gathering, Formal analysis, Investigation, Validation, Writing original draft preparation, Review and Editing; M.N. and T.G.: Review and Editing. G.T.A.: Conceptualization, Resource, Validation, Review and Editing, and acquisition of APC. All authors have read and agreed to the published version of the manuscript.

Funding

Gebiaw T. Ayele covered the APC and received funding from Griffith Graduate Research School, the Australian Rivers Institute and School of Engineering, Griffith University, Queensland, Australia. The UK Aid from the UK government has funded this research; however, the views expressed do not necessarily reflect the UK government’s official policies.

Informed Consent Statement

Not applicable.

Data Availability Statement

All the data are presented in tables and figures in the manuscript.

Acknowledgments

The UK Aid from the UK government has funded this research; however, the views expressed do not necessarily reflect the UK government’s official policies. The technical and logistics support from the CIRCLE programme of the African Academy of Sciences was tremendous. We would like to thank Addis Ababa and Hawassa universities for the support we got throughout the research process. We are indebted to gratitude all the members of the field crew who participated in the fieldwork for their honest contribution. Gebiaw T. Ayele received funding and acknowledges Griffith Graduate Research School, the Australian Rivers Institute and School of Engineering, Griffith University, Queensland, Australia.

Conflicts of Interest

The authors declare no conflict of interest.

References

  1. Codjoe, S.N.A.; Atiglo, D.Y. The implications of extreme weather events for attaining the sustainable development goals in sub-Saharan Africa. Front. Clim. 2020, 2, 592658. [Google Scholar] [CrossRef]
  2. Zhao, C.; Liu, B.; Piao, S.; Wang, X.; Lobell, D.B.; Huang, Y.; Huang, M.T.; Yao, Y.T.; Bassu, S.; Ciais, P.; et al. Temperature increase reduces global yields of major crops in four independent estimates. Proc. Natl. Acad. Sci. USA 2017, 114, 9326–9331. [Google Scholar] [CrossRef] [PubMed] [Green Version]
  3. Wu, X.; Lu, Y.; Zhou, S.; Chen, L.; Xu, B. Impact of climate change on human infectious diseases: Empirical evidence and human adaptation. Environ. Int. 2016, 86, 14–23. [Google Scholar] [CrossRef] [PubMed] [Green Version]
  4. Schweikert, A.; Chinowsky, P.; Espinet, X.; Tarbert, M. Climate change and infrastructure impacts: Comparing the impact on roads in ten countries through 2100. Procedia Eng. 2014, 78, 306–316. [Google Scholar]
  5. Schlenker, W.; Lobell, D.B. Robust negative impacts of climate change on African agriculture. Environ. Res. Lett. 2010, 5, 14010. [Google Scholar] [CrossRef]
  6. Filho, W.L.; Balogun, A.-L.; Ayal, D.Y.; Bethurem, E.M.; Murambadoro, M.; Mambo, J.; Taddese, H.; Tefera, G.W.; Nagy, G.J.; Fudjumdjum, H.; et al. Strengthening climate change adaptation capacity in Africa-case studies from six major African cities and policy implications. Environ. Sci. Policy 2018, 86, 29–37. [Google Scholar] [CrossRef]
  7. Arce, J.J.C. Forests, inclusive and sustainable economic growth and employment. In Background Study Prepared for the Fourteenth Session of the United Nations Forum on Forests; United Nations: New York, NY, USA, 2019. [Google Scholar]
  8. Canadell, J.G.; Raupach, M.R. Managing forests for climate change mitigation. Science 2008, 320, 1456–1457. [Google Scholar]
  9. Köhl, M.; Lasco, R.; Cifuentes, M.; Jonsson, Ö.; Korhonen, K.T.; Mundhenk, P.; de Jesus Navar, J.; Stinson, G. Changes in forest production, biomass and carbon: Results from the 2015 UN FAO Global Forest Resource Assessment. For. Ecol. Manag. 2015, 352, 21–34. [Google Scholar]
  10. Lewis, S.L.; Lopez-Gonzalez, G.; Sonké, B.; Affum-Baffoe, K.; Baker, T.R.; Ojo, L.O.; Phillips, O.L.; Reitsma, J.M.; White, L.; Comiskey, J.A.; et al. Increasing carbon storage in intact African tropical forests. Nature 2009, 457, 1003–1006. [Google Scholar] [CrossRef]
  11. Baccini, A.; Goetz, S.; Walker, W.S.; Laporte, N.T.; Sun, M.; Sulla-Menashe, D.; Hackler, J.L.; Beck, P.S.A.; Dubayah, R.O.; Friedl, M.A.; et al. Estimated carbon dioxide emissions from tropical deforestation improved by carbon-density maps. Nat. Clim. Change 2012, 2, 182–185. [Google Scholar] [CrossRef]
  12. Kim, D.-H.; Sexton, J.O.; Townshend, J.R. Accelerated deforestation in the humid tropics from the 1990s to the 2000s. Geophys. Res. Lett. 2015, 42, 3495–3501. [Google Scholar] [CrossRef] [PubMed]
  13. Zeppetello, L.R.V.; Parsons, L.A.; Spector, J.T.; Naylor, R.L.; Battisti, D.S.; Masuda, Y.J.; Wolff, N.H. Large scale tropical deforestation drives extreme warming. Environ. Res. Lett. 2020, 15, 84012. [Google Scholar] [CrossRef]
  14. Aalde, H.; Gonzalez, P.; Gytarsky, M.; Krug, T.; Kurz, W.A.; Lasco, R.D.; Martino, D.L.; McConkey, B.G.; Ogle, S.; Paustian, K.; et al. Generic methodologies applicable to multiple land-use categories. IPCC Guidel. Natl. Greenh. Gas Invent. 2006, 4, 1–59. [Google Scholar]
  15. Cannell, M. Growing trees to sequester carbon in the UK: Answers to some common questions. Forestry 1999, 72, 237–247. [Google Scholar] [CrossRef]
  16. Houghton, R.A.; Hall, F.; Goetz, S. Importance of biomass in the global carbon cycle. J. Geophys. Res. Biogeosci. 2009, 114, 935. [Google Scholar] [CrossRef]
  17. Giam, X. Global biodiversity loss from tropical deforestation. Proc. Natl. Acad. Sci. USA 2017, 114, 5775–5777. [Google Scholar]
  18. Riswan, S.; Hartanti, L. Human impacts on tropical forest dynamics. Vegetatio 1995, 121, 41–52. [Google Scholar]
  19. Mandal, R.A.; Dutta, I.C.; Jha, P.K.; Karmacharya, S. Relationship between carbon stock and plant biodiversity in collaborative forests in Terai, Nepal. Int. Sch. Res. Not. 2013, 2013, 625767. [Google Scholar] [CrossRef] [Green Version]
  20. Chisholm, R.A.; Muller-Landau, H.; Rahman, K.A.; Bebber, D.P.; Bin, Y.; Bohlman, S.A.; Bourg, N.; Brinks, J.; Bunyavejchewin, S.; Butt, N.; et al. Scale-dependent relationships between tree species richness and ecosystem function in forests. J. Ecol. 2013, 101, 1214–1224. [Google Scholar] [CrossRef] [Green Version]
  21. Pitkänen, T.P.; Raumonen, P.; Liang, X.; Lehtomäki, M.; Kangas, A. Improving TLS-based stem volume estimates by field measurements. Comput. Electron. Agric. 2021, 180, 105882. [Google Scholar] [CrossRef]
  22. Dessie, G.; Kleman, J. Pattern and magnitude of deforestation in the South Central Rift Valley Region of Ethiopia. Mt. Res. Dev. 2007, 27, 162–168. [Google Scholar]
  23. Amare, T.; Hergarten, C.; Hurni, H.; Wolfgramm, B.; Yitaferu, B.; Selassie, Y.G. Prediction of soil organic carbon for Ethiopian highlands using soil spectroscopy. Int. Sch. Res. Not. 2013, 2013, 720589. [Google Scholar] [CrossRef]
  24. Dessie, G.; Kinlund, P. Khat expansion and forest decline in Wondo Genet, Ethiopia. Geogr. Ann. Ser. B Hum. Geogr. 2008, 90, 187–203. [Google Scholar]
  25. Kebede, M.; Yirdaw, E.; Luukkanen, O.; Lemenih, M. Plant community analysis and effect of environmental factors on the diversity of woody species in the moist Afromontane forest of Wondo Genet, South Central Ethiopia. Biodivers. Res. Conserv. 2013, 29, 63. [Google Scholar] [CrossRef] [Green Version]
  26. Peet, R.K. The measurement of species diversity. Annu. Rev. Ecol. Syst. 1974, 5, 285–307. [Google Scholar]
  27. Chave, J.; Réjou-Méchain, M.; Búrquez, A.; Chidumayo, E.; Colgan, M.S.; Delitti, W.B.; Duque, A.; Eid, T.; Fearnside, P.M.; Goodman, R.C.; et al. Improved allometric models to estimate the aboveground biomass of tropical trees. Glob. Change Biol. 2014, 20, 3177–3190. [Google Scholar]
  28. Zanne, A.E.; Lopez-Gonzalez, G.; Coomes, D.A.; Ilic, J.; Jansen, S.; Lewis, S.L.; Miller, R.B.; Swenson, N.G.; Wiemann, M.C.; Chave, J. Data from: Towards a worldwide wood economics spectrum. Dryad Dataset 2009. [Google Scholar] [CrossRef]
  29. Belete, Y.; Abere, F.; Kebede, B.; Soromessa, T. Nondestructive Allometric Model to Estimate Aboveground Biomass: An Alternative Approach to Generic Pan-Tropical Models. 2019. Available online: https://ssrn.com/abstract=3475959 (accessed on 11 October 2022).
  30. Desalegn, G.; Teketay, D.; Gezahgne, A.; Abegaz, M. Commercial Timber Species in Ethiopia: Characteristics and Uses. A Handbook, for Forest Industries, Construction and Energy Sectors, Foresters and Other Stakeholders; Addis Ababa University Press: Addis Ababa, Ethiopia, 2012. [Google Scholar]
  31. Tadesse, G.; Zavaleta, E.; Shennan, C. Effects of land-use changes on woody species distribution and above-ground carbon storage of forest-coffee systems. Agric. Ecosyst. Environ. 2014, 197, 21–30. [Google Scholar] [CrossRef] [Green Version]
  32. Tetemke, B.A.; Birhane, E.; Rannestad, M.M.; Eid, T. Allometric models for predicting aboveground biomass of trees in the dry afromontane forests of Northern Ethiopia. Forests 2019, 10, 1114. [Google Scholar] [CrossRef] [Green Version]
  33. Paul, K.I.; Roxburgh, S.H.; Chave, J.; England, J.R.; Zerihun, A.; Specht, A.; Lewis, T.; Bennett, L.T.; Baker, T.G.; Adams, M.A.; et al. Testing the generality of above-ground biomass allometry across plant functional types at the continent scale. Glob. Change Biol. 2016, 22, 2106–2124. [Google Scholar] [CrossRef]
  34. IPCC (International Panel on Climate Change). 2006 IPCC Guidelines for National Greenhouse Gas Inventories; Prepared by the National Greenhouse Gas Inventories Programme; Eggleston, H.S., Buendia, L., Miwa, K., Ngara, T., Tanabe, K., Eds.; IGES: Kanagawa, Japan, 2006. [Google Scholar]
  35. McGroddy, M.E.; Daufresne, T.; Hedin, L.O. Scaling of C: N: P stoichiometry in forests worldwide: Implications of terrestrial redfield-type ratios. Ecology 2004, 85, 2390–2401. [Google Scholar]
  36. Pearson, T.; Walker, S.; Brown, S. Sourcebook for Land Use, Land-Use Change and Forestry Projects; World Bank: Washington, DC, USA, 2013. [Google Scholar]
  37. Prodan, M. Holzmesslehre; JD Sauerlander: Frankfurt am Main, Germany, 1965. [Google Scholar]
  38. Brown, S.; Lugo, A.E. Aboveground biomass estimates for tropical moist forests of the Brazilian Amazon. Interciencia Caracas 1992, 17, 8–18. [Google Scholar]
  39. Walkley, A.; Black, I.A. An examination of the Degtjareff method for determining soil organic matter, and a proposed modification of the chromic acid titration method. Soil Sci. 1934, 37, 29–38. [Google Scholar] [CrossRef]
  40. Kauffman, J.B.; Donato, D.C. Protocols for the Measurement, Monitoring and Reporting of Structure, Biomass and Carbon Stocks in Mangrove Forests; Citeseer: Bogor, Indonesia, 2012; Volume 86. [Google Scholar]
  41. Pearson, T.R. Measurement Guidelines for the Sequestration of Forest Carbon; U.S. Department of Agriculture, Forest Service, Northern Research Station: Madison, WI, USA, 2007; Volume 18.
  42. Brown, E.D.; Williams, B.K. Ecological integrity assessment as a metric of biodiversity: Are we measuring what we say we are? Biodivers. Conserv. 2016, 25, 1011–1035. [Google Scholar]
  43. Strassburg, B.B.; Kelly, A.; Balmford, A.; Davies, R.G.; Gibbs, H.K.; Lovett, A.; Miles, L.; Orme, C.D.L.; Price, J.; Turner, R.K.; et al. Global congruence of carbon storage and biodiversity in terrestrial ecosystems. Conserv. Lett. 2010, 3, 98–105. [Google Scholar] [CrossRef] [Green Version]
  44. Choliq, M.L.; Kaswanto, R. Correlation of carbon stock and biodiversity index at the small scale agroforestry landscape in Ciliwung Watershed. In IOP Conference Series: Earth and Environmental Science; IOP Publishing: Bristol, UK, 2017. [Google Scholar]
  45. Filqisthi, T.A.; Kaswanto, R.L. Carbon stock and plants biodiversity of pekarangan in Cisadane watershed West Java. In IOP Conference Series: Earth and Environmental Science; IOP Publishing: Bristol, UK, 2017. [Google Scholar]
  46. Gebeyehu, G.; Soromessa, T.; Bekele, T.; Teketay, D. Carbon stocks and factors affecting their storage in dry Afromontane forests of Awi Zone, northwestern Ethiopia. J. Ecol. Environ. 2019, 43, 7. [Google Scholar]
  47. Kim, D.-G.; Taddese, H.; Belay, A.; Kolka, R. The impact of traditional fire management on soil carbon and nitrogen pools in a montane forest, southern Ethiopia. Int. J. Wildland Fire 2016, 25, 1110–1116. [Google Scholar] [CrossRef]
  48. Ali, A.; Ashraf, M.I.; Gulzar, S.; Akmal, M. Estimation of forest carbon stocks in temperate and subtropical mountain systems of Pakistan: Implications for REDD+ and climate change mitigation. Environ. Monit. Assess. 2020, 192, 198. [Google Scholar] [CrossRef]
  49. Wekesa, C.; Leley, N.; Maranga, E.; Kirui, B.; Muturi, G.; Mbuvi, M.; Chikamai, B. Effects of forest disturbance on vegetation structure and above-ground carbon in three isolated forest patches of Taita Hills. Open J. For. 2016, 6, 142–161. [Google Scholar]
  50. Addi, A.; Demissew, S.; Soromessa, T.; Asfaw, Z. Carbon stock of the moist Afromontane forest in Gesha and Sayilem Districts in Kaffa Zone: An implication for climate change mitigation. J. Ecosyst. Ecograph. 2019, 9, 1–8. [Google Scholar]
Figure 1. Location of the study area and distribution of the field plots.
Land 11 02252 g001
Figure 2. Mean SOC stock of each land use type across the depth classes.
Land 11 02252 g002
Table 1. Size and shape of sampling plots for biophysical data collection.
Stem DBH (cm)Plot SizeComponents Measured
<52 m × 2 mSaplings
5–207 m × 7 mSmall trees and shrubs
20–5025 m × 25 mMedium size trees
>5035 m × 35 mBig trees
---0.5 m × 0.5 m (3 sub-plots per plot location)Grasses and litter
---Soil samples (3 sub-plots per plot location)Soil carbon and bulk density
---100 m line intersect per plot with 10 m widthDeadwood
Table 2. Pearson’s correlation coefficient between the three diversity indices used in the current study.
Shannon-Wiener Index (H’)Simpson’s Index (Ds)
Species richness (R)0.9477070.942293
Shannon-Wiener index (H’)---0.979202
Table 3. Mean (±standard error) of Ds of woody plants in three land-use types. Mean values followed by the same letter did not differ significantly (Tukey HSD test, p > 0.05).
Land-Use TypeMean Ds
Natural forest0.84 (±0.02) a
Woodland0.76 (±0.05) a
Khat0.00 (±0.00) b
Table 4. Correlation of Ds with total biomass carbon (TBC), soil organic carbon (SOC) and total carbon stocks (TCS); all in Mg ha−1.
Sources of CarbonCorrelation Coefficientp-Value
TBC0.3040.123
SOC0.2420.225
TCS0.3200.104
Table 5. Mean plant biomass and its standard error among the different land-use types.
Land-Use TypeTotal Live Biomass (Mg ha−1)Standard Error of the Mean (Mg ha−1)
Natural forest456.93155.88
Woodland19.786.29
Khat2.460.59
Table 6. Mean carbon stock (Mg ha−1) and percentage contribution (values in brackets) in each carbon pool component and land-use class. Percentage contributions of the soil organic carbon (SOC), total biomass carbon (TBC), litter biomass carbon (LBC), herbaceous vegetation biomass carbon (HBC) and deadwood carbon (DWC) were calculated for each land-use type. The TCS varies between natural forest and other land-uses at a significance level of 0.05.
Land Use TypeSOCTBCLBCHBCDWCTCS
Natural forest149.57 (40.80)214.76 (58.60)1.33 (0.36)0.40 (0.11)0.41 (0.11)366.47 a
Woodland130.53 (92.02)9.30 (6.60)1.56 (1.10)0.46 (0.30)0.00 (0.00)141.85 b
Khat124.70 (99.10)1.16 (0.90)0.00 (0.00)0.00 (0.00)0.00 (0.00)125.86 b
Table 7. Multiple comparison of means, level of significance = 0.05.
Group1Group2Mean DifferenceAdjusted p-ValueLowerUpperReject (Decision)
BottomMiddle8.43290.1499−2.249119.1149False
BottomTop41.48620.00130.804252.1682True
MiddleTop33.05330.00122.371343.7353True
Publisher’s Note: MDPI stays neutral with regard to jurisdictional claims in published maps and institutional affiliations.

