
Is Cultivated Land Increased by Land Consolidation Sustainably Used in Mountainous Areas?

Abstract
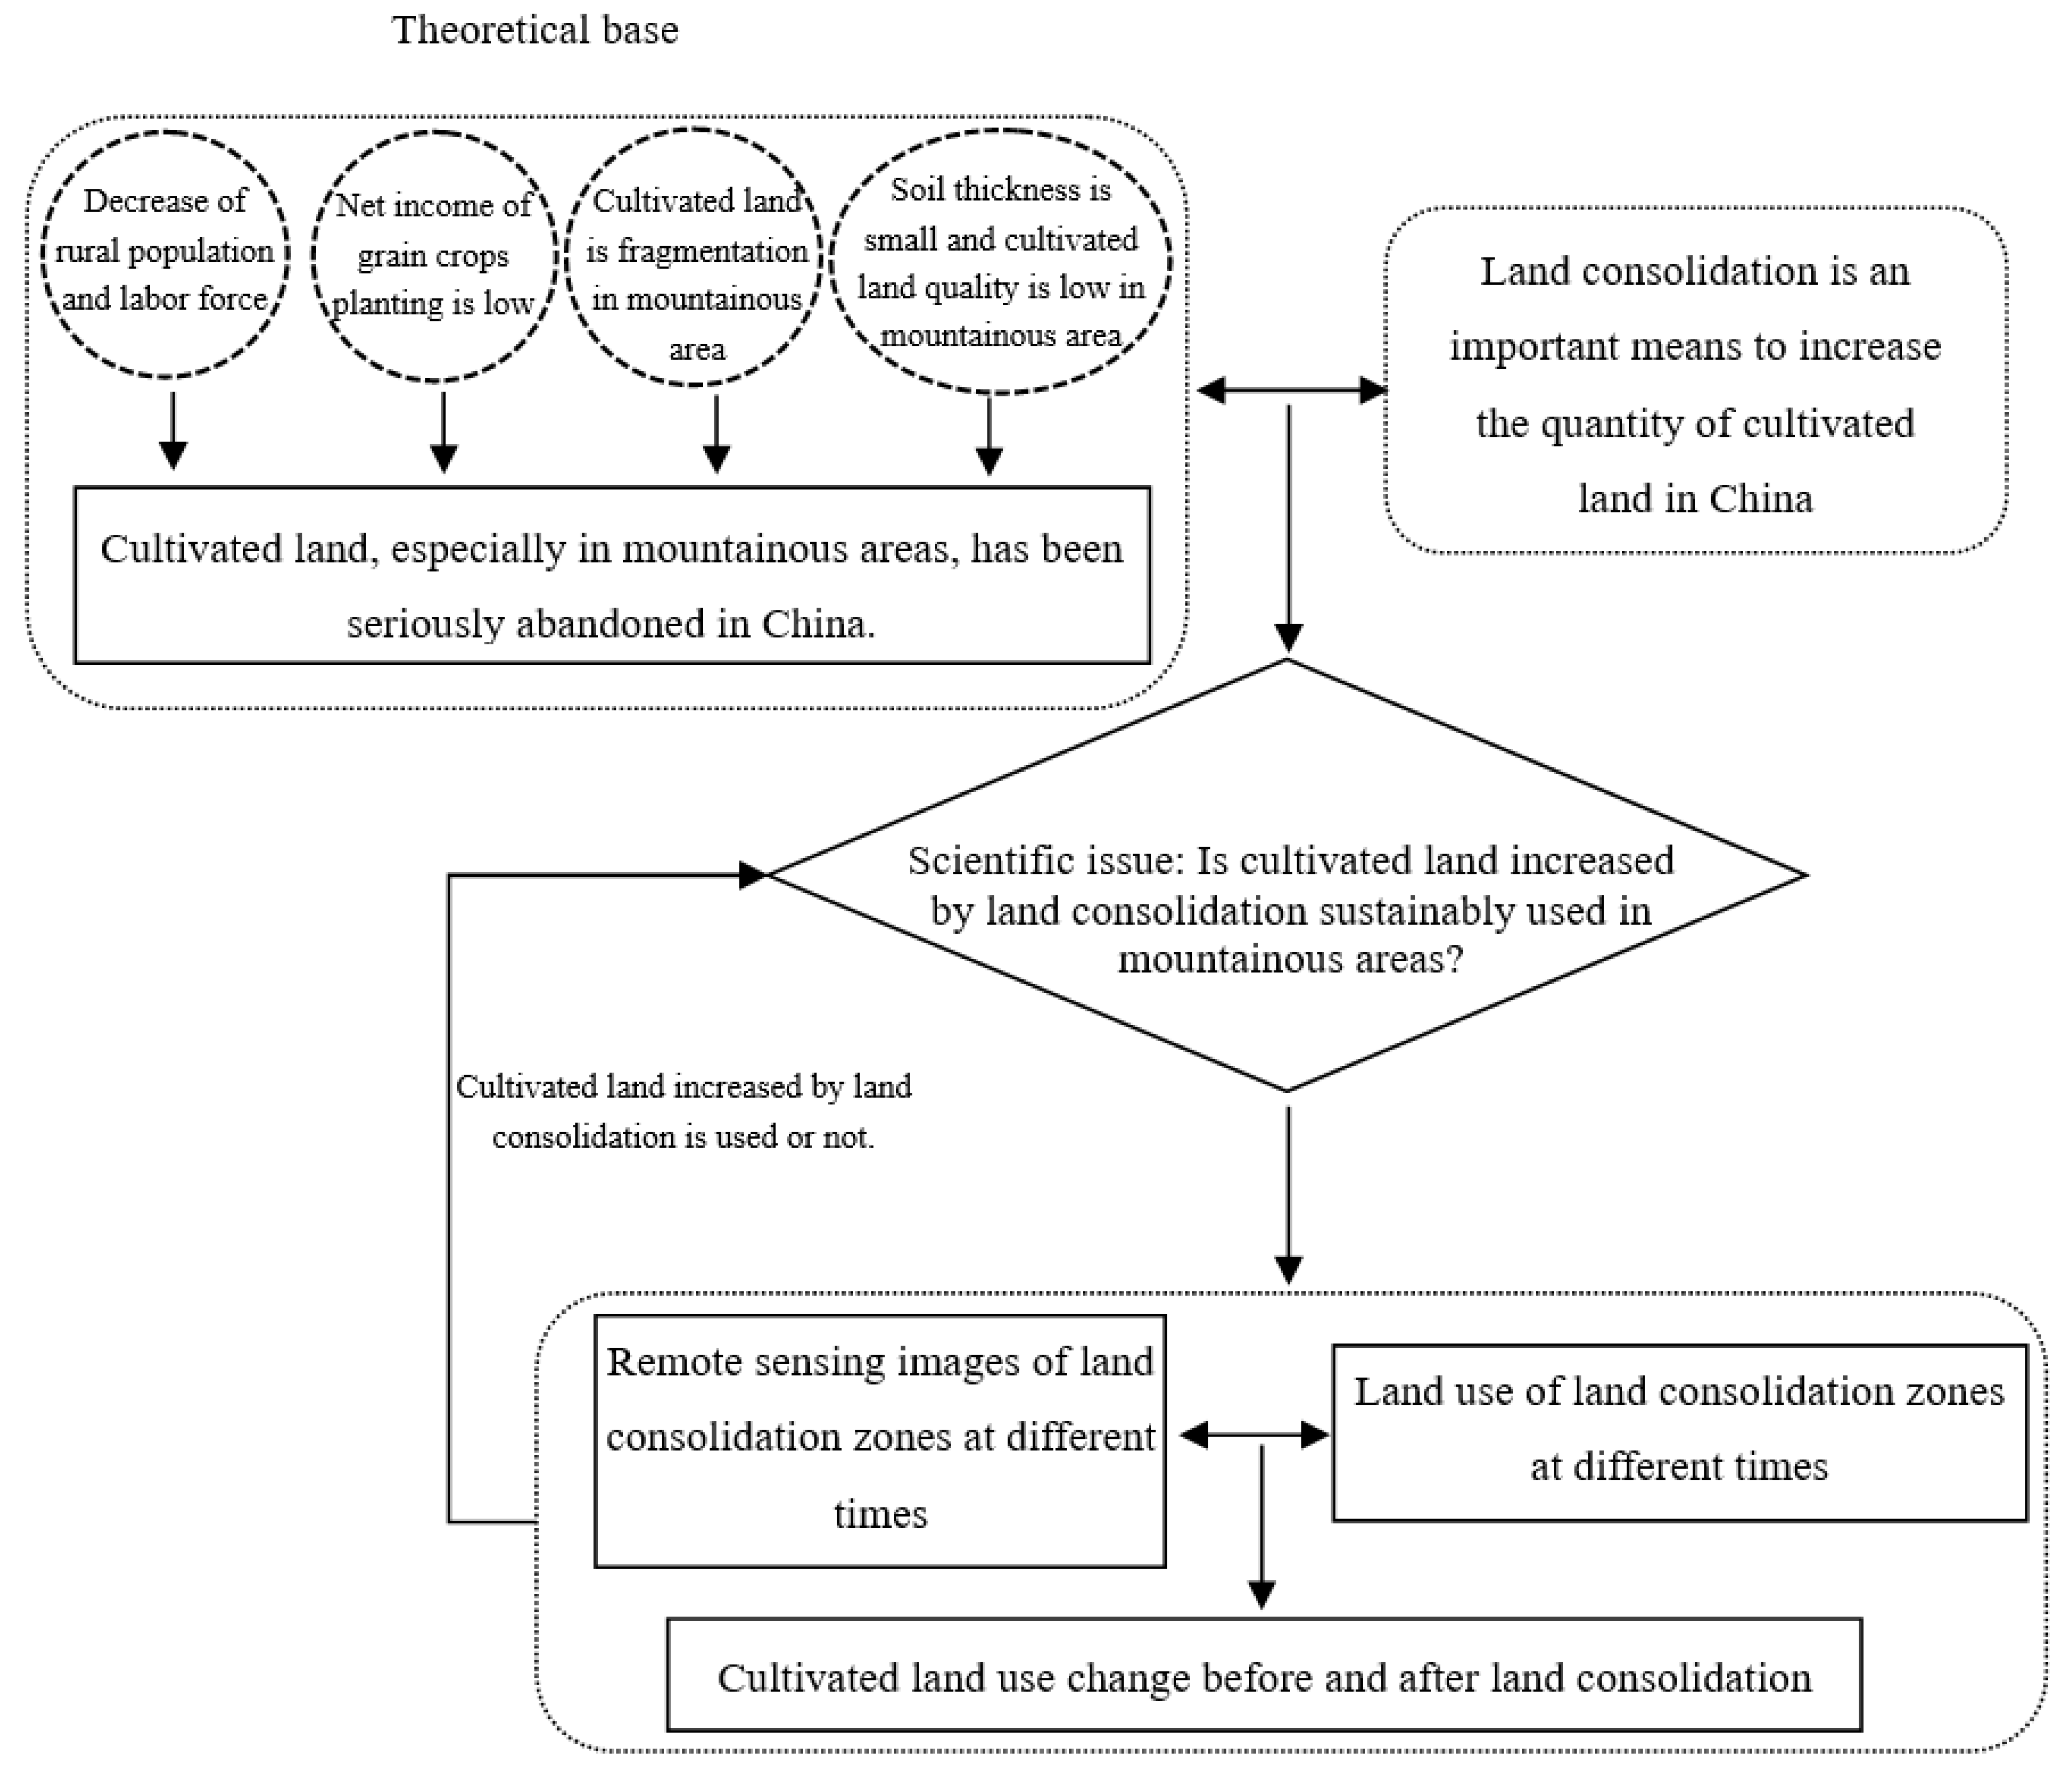
:1. Introduction
2. Materials and Methods
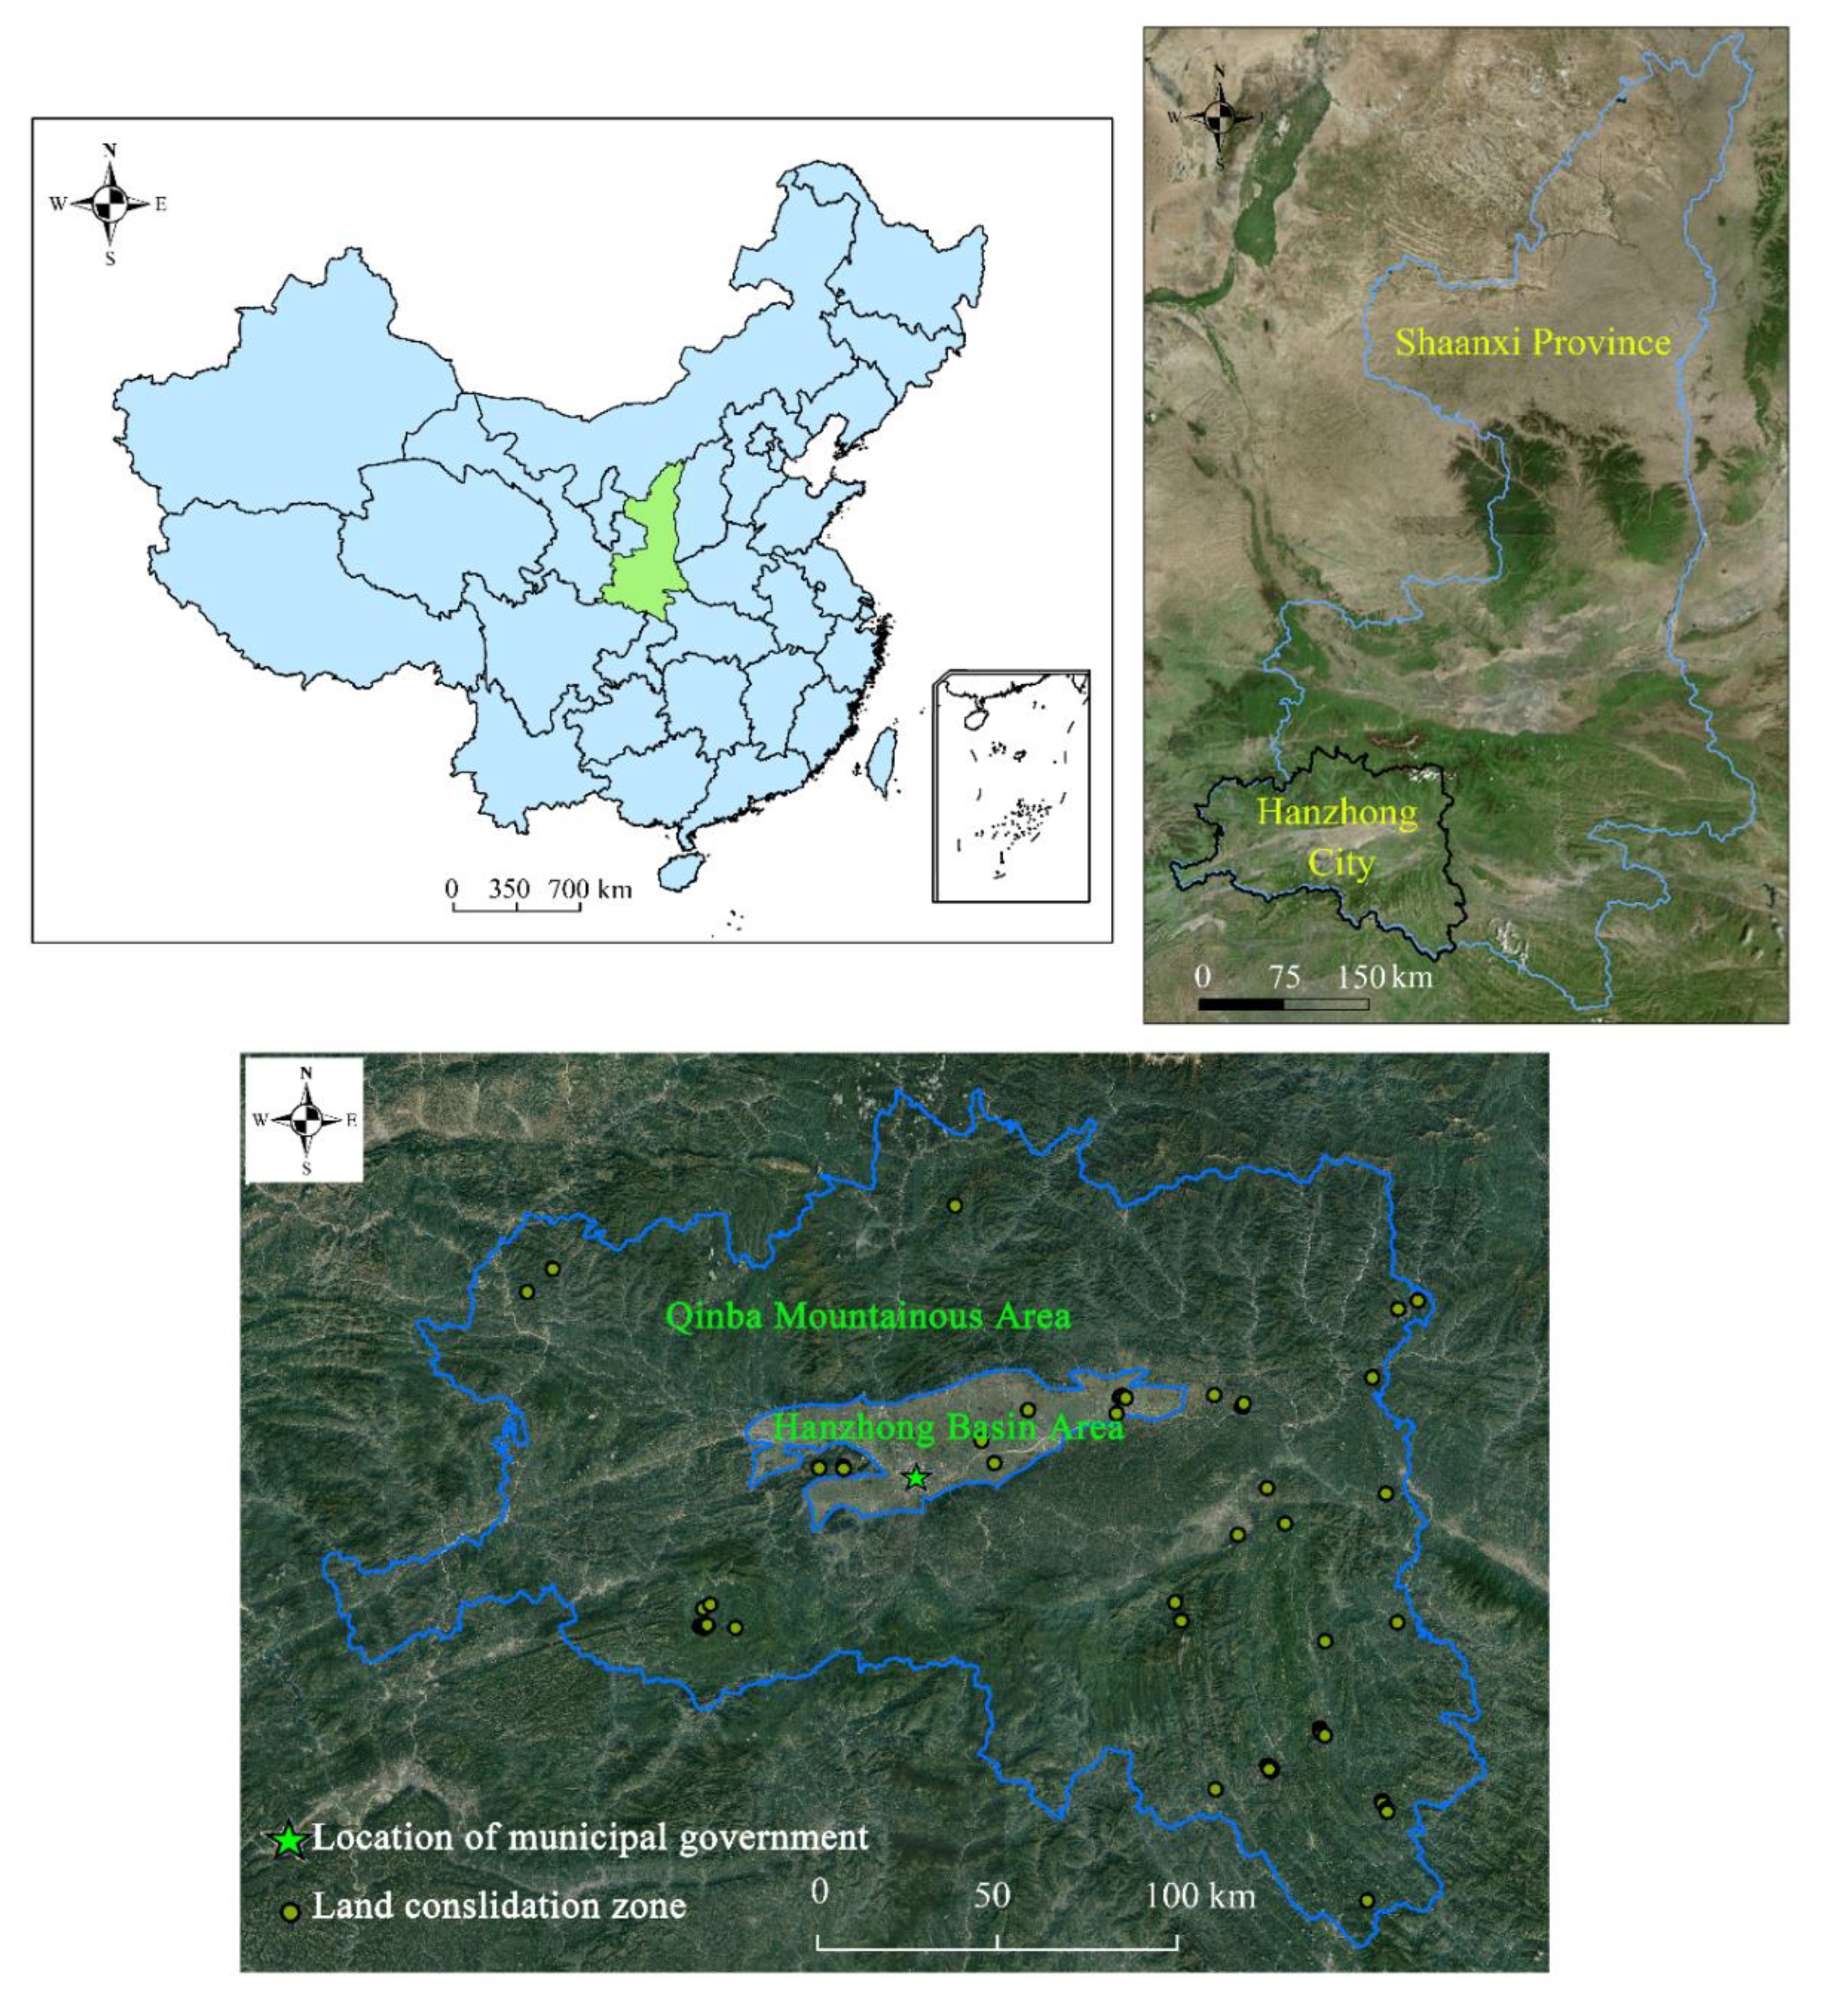
2.1. Study Area
2.2. Data and Methods
3. Results
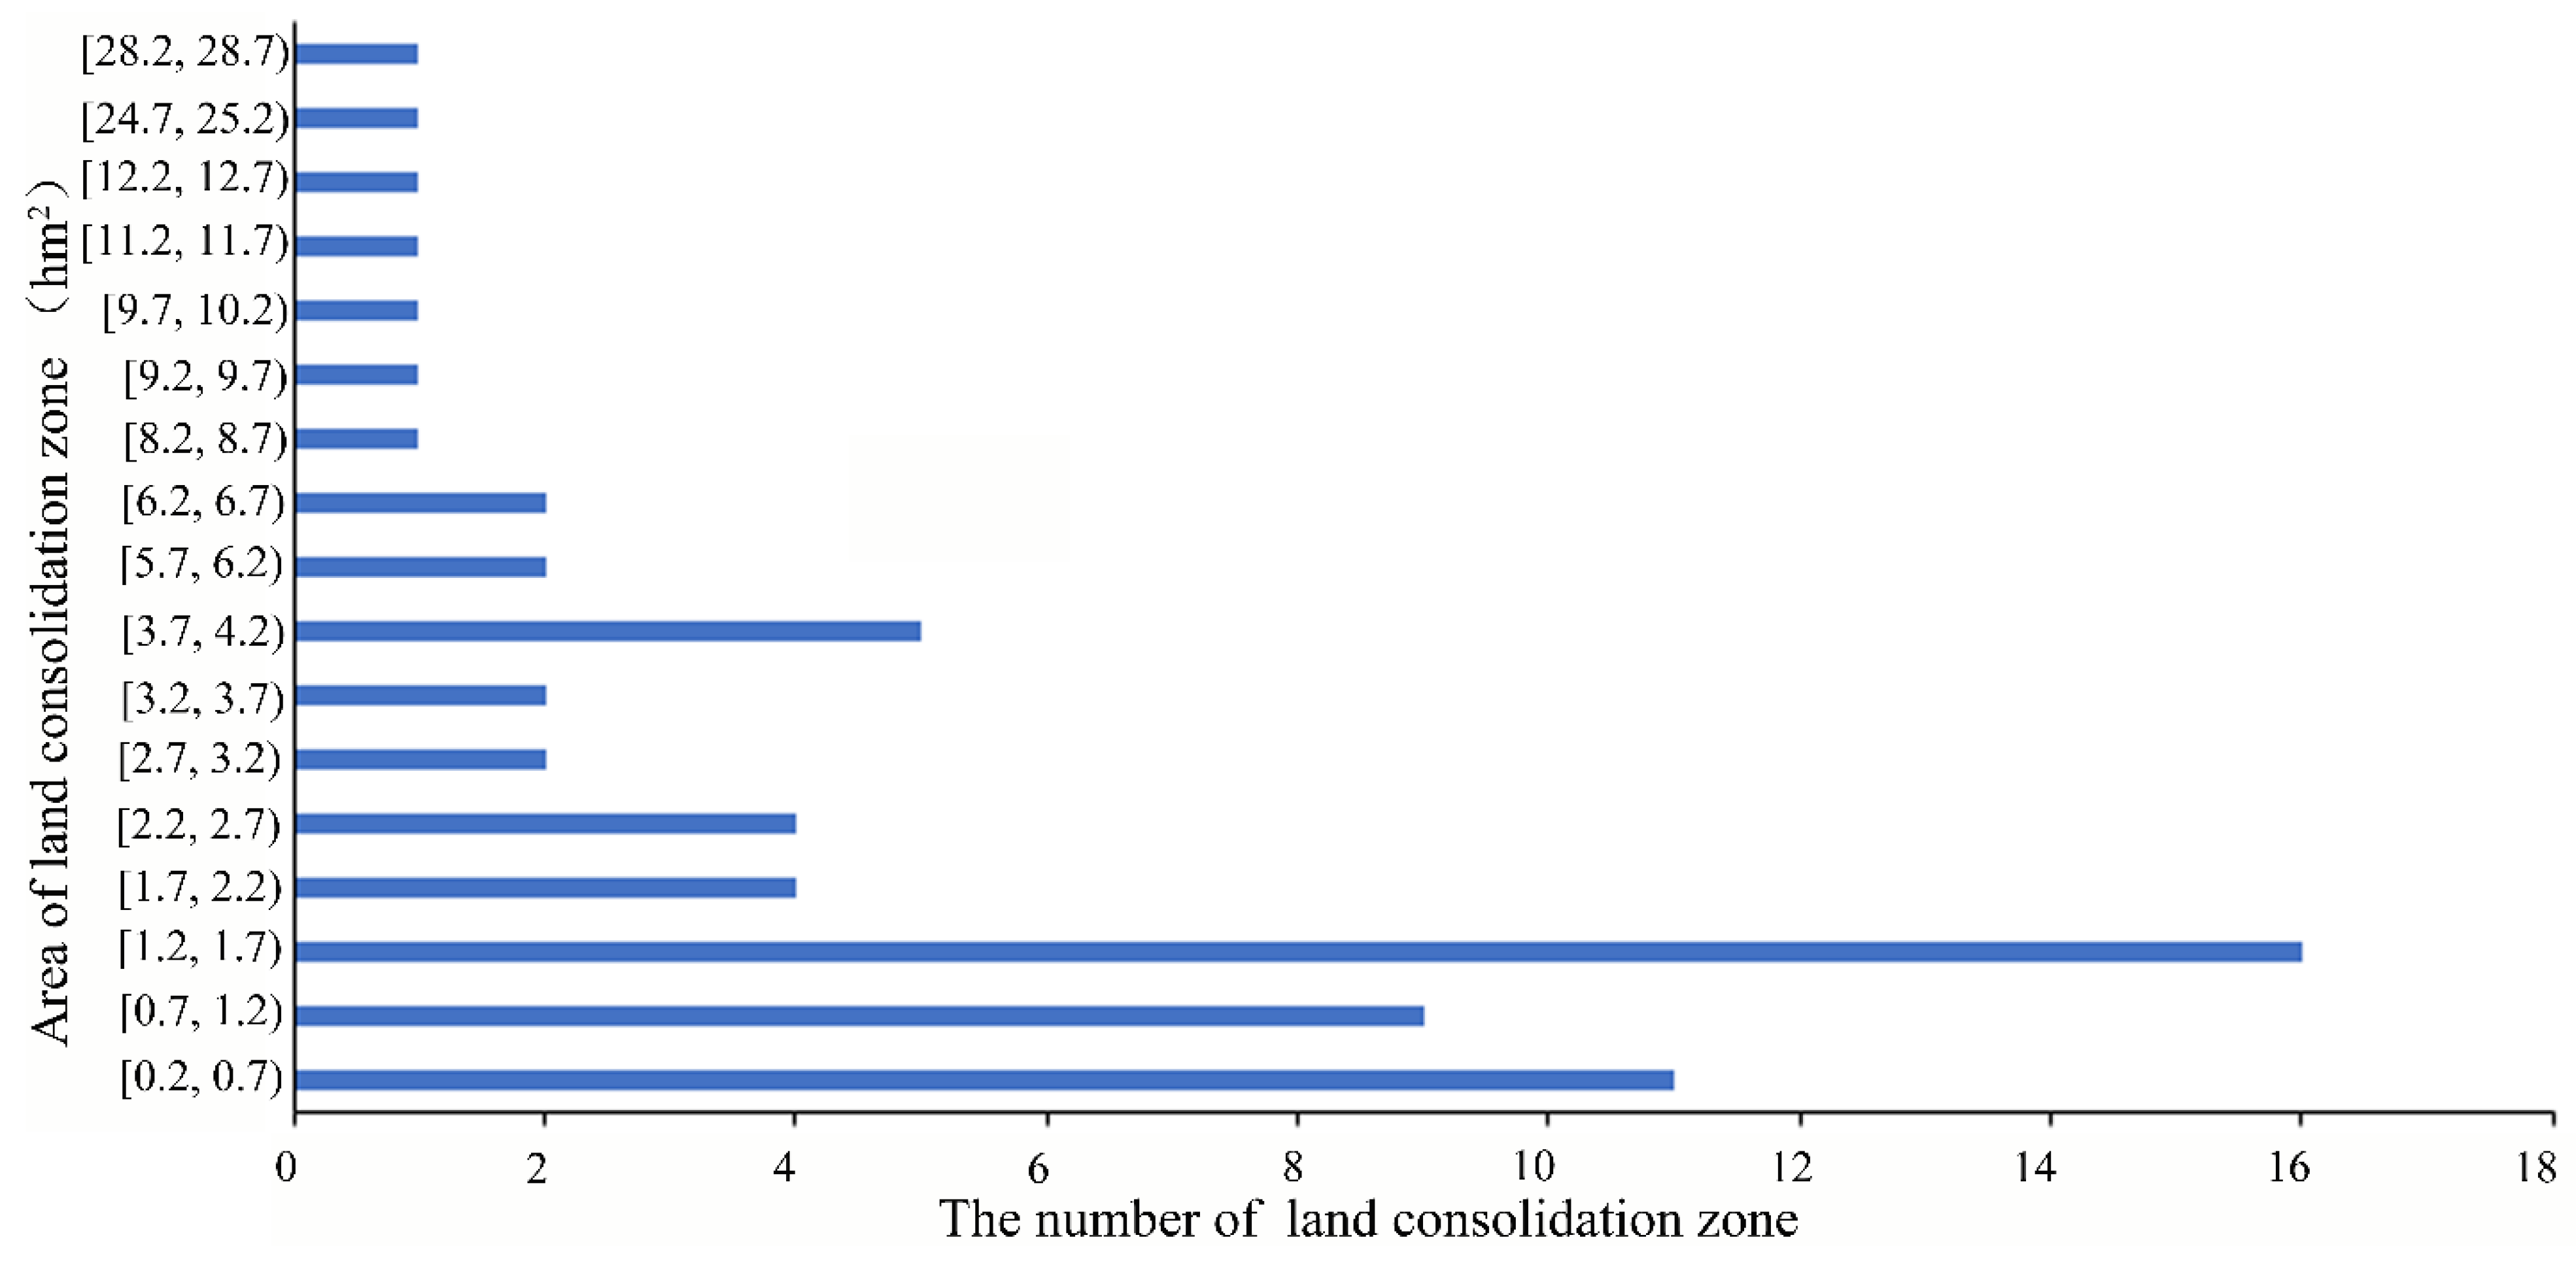
3.1. Scale of Land Consolidation Zone
3.2. Increased Cultivated Land by Land Consolidation
3.2.1. Type and Source of Increased Cultivated Land by Land Consolidation
3.2.2. Increased Cultivated Land by Land Consolidation in Different Geomorphic Regions
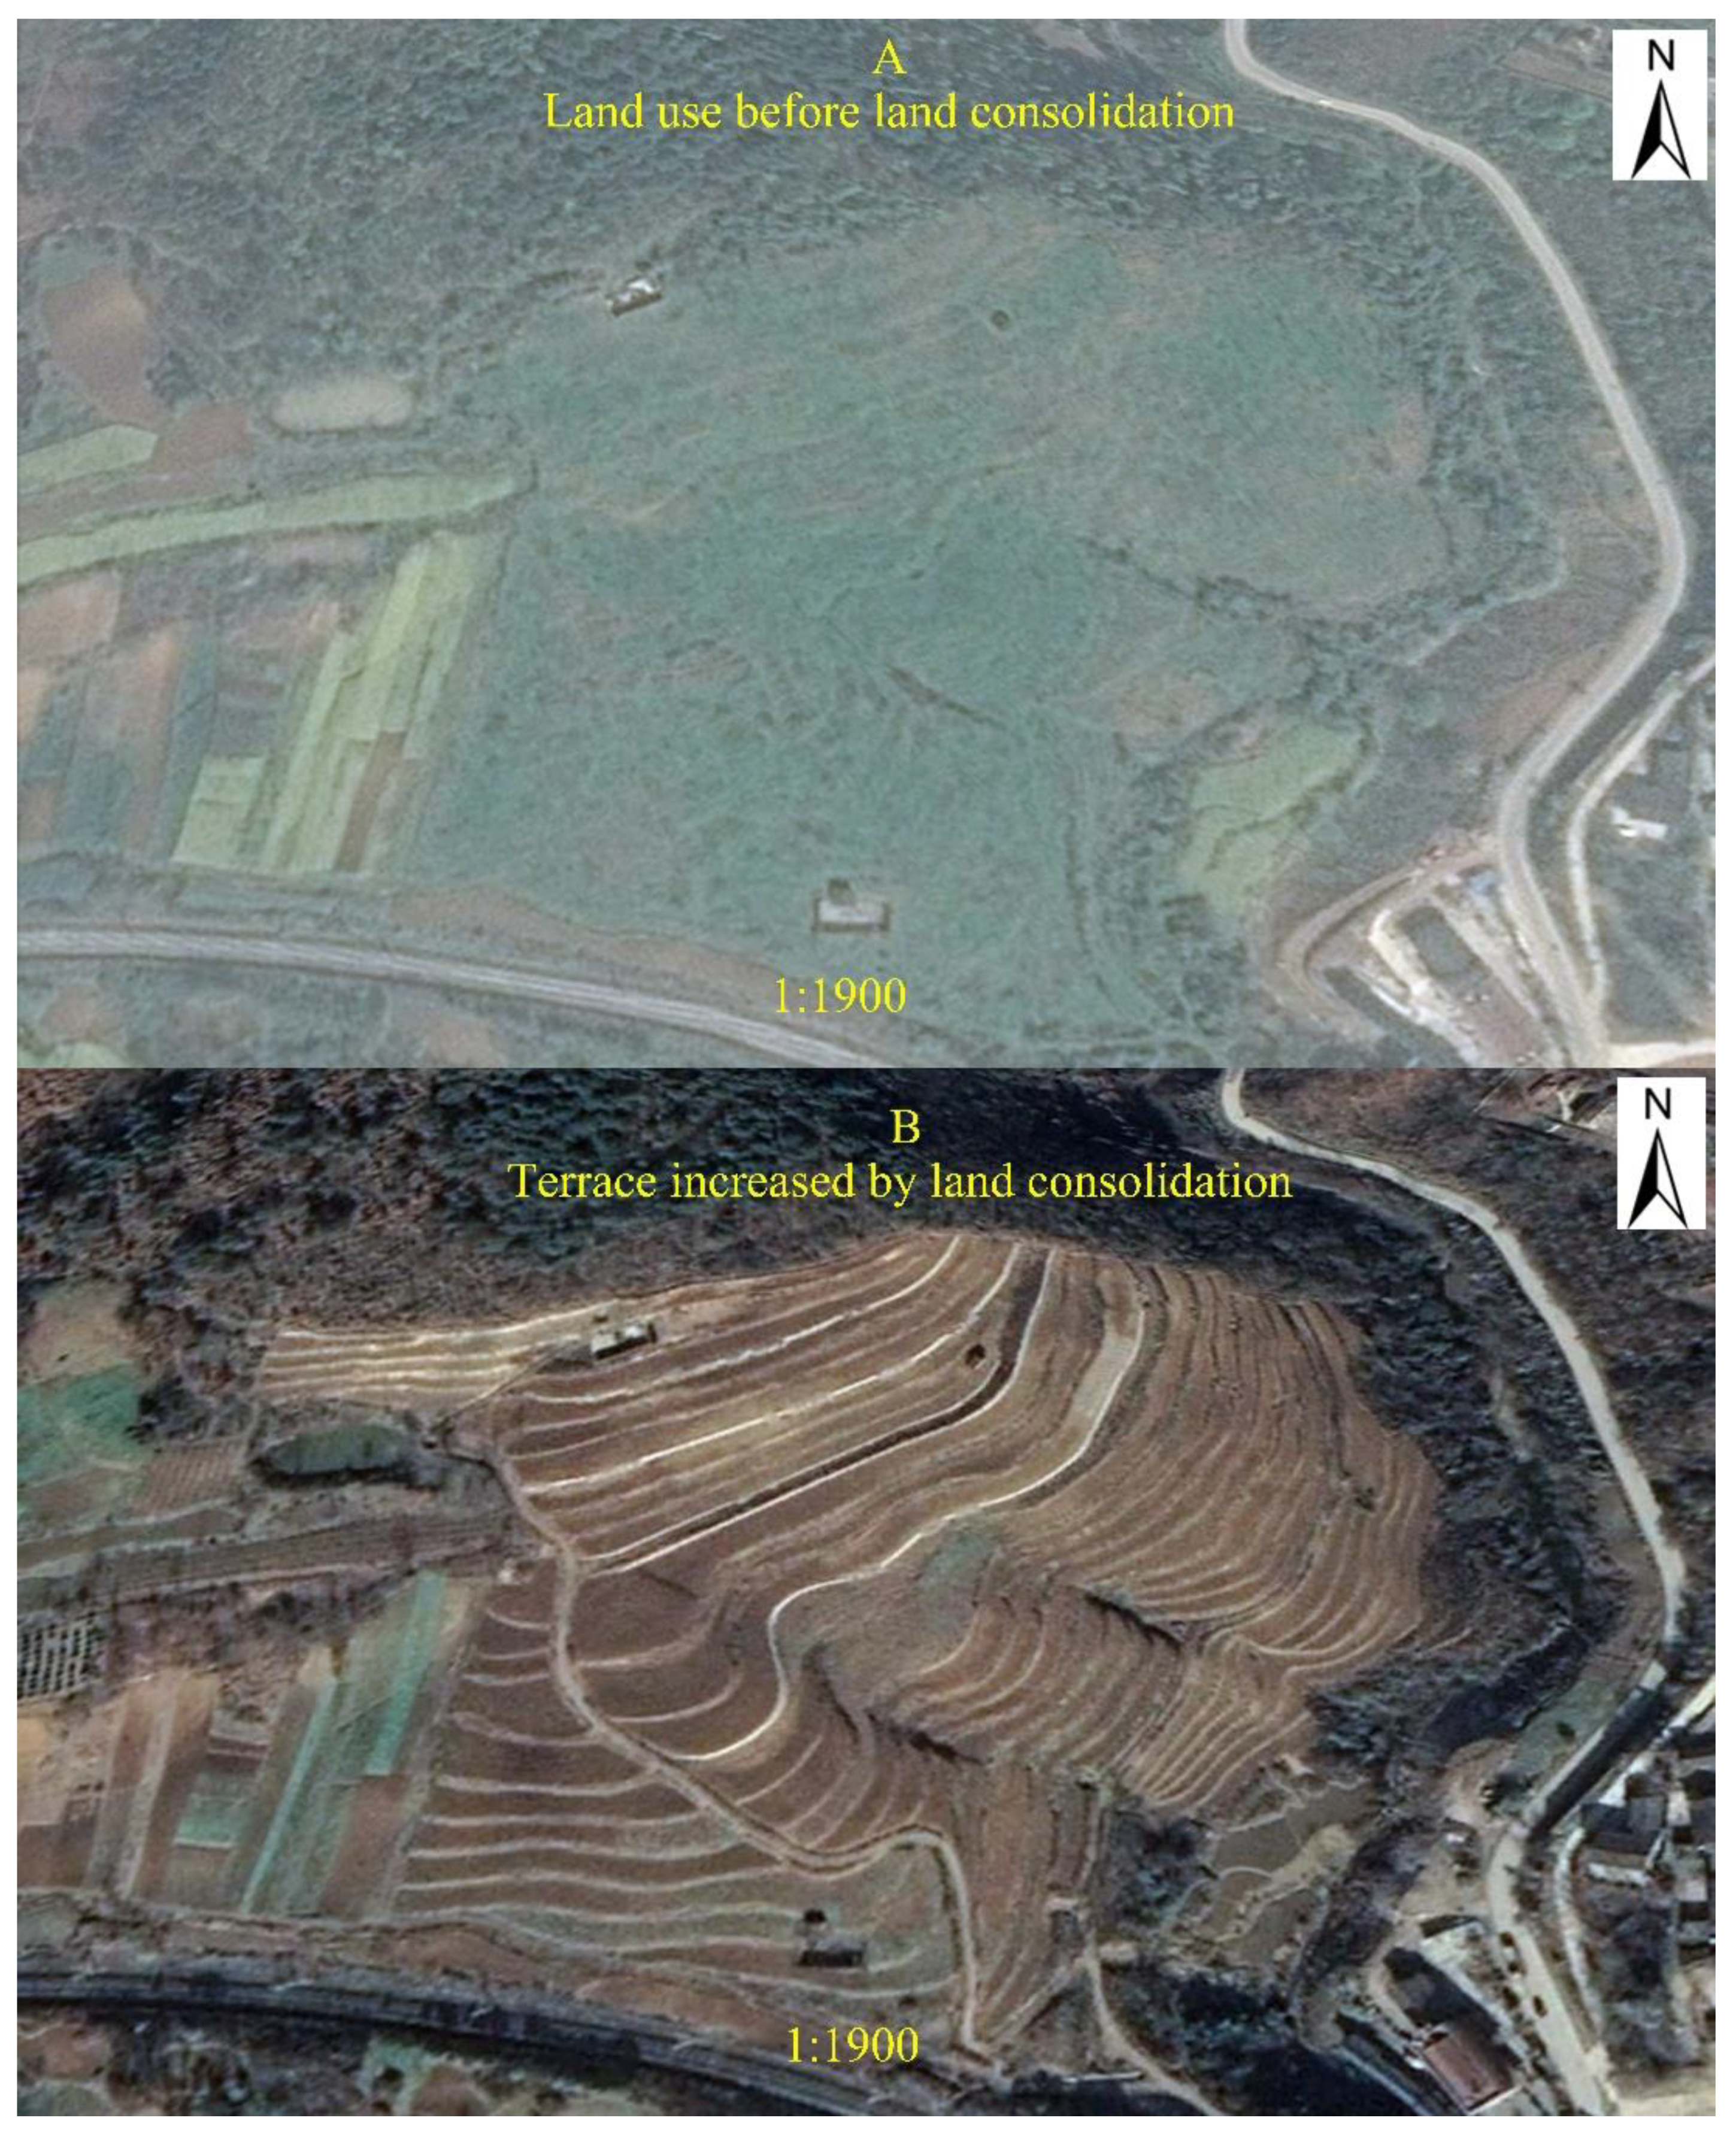
3.3. Transformation of Cultivated Land after Land Consolidation
4. Discussion
5. Conclusions
Author Contributions
Funding
Data Availability Statement
Acknowledgments
Conflicts of Interest
References
- Nguyen, H.Q.; Warr, P. Land consolidation as technical change: Economic impacts in rural Vietnam. World Dev. 2020, 127, 104750. [Google Scholar] [CrossRef]
- Janus, J.; Ertunç, E. Differences in the effectiveness of land consolidation projects in various countries and their causes: Examples of Poland and Turkey. Land Use Pol. 2021, 108, 105542. [Google Scholar] [CrossRef]
- Huylenbroeck, G.V.; Coelho, J.C.; Pinto, P.A. Evaluation of land consolidation projects (LCPs): A multidisciplinary approach. J. Rural Stud. 1996, 12, 297–310. [Google Scholar] [CrossRef]
- Zhou, J.; Cao, X. What is the policy improvement of China’s land consolidation? Evidence from completed land consolidation projects in Shaanxi Province. Land Use Pol. 2020, 99, 104847. [Google Scholar] [CrossRef]
- Du, X.; Zhang, X.; Jin, X. Assessing the effectiveness of land consolidation for improving agricultural productivity in China. Land Use Pol. 2018, 70, 360–367. [Google Scholar] [CrossRef]
- Zhou, Y.; Li, X.; Liu, Y. Cultivated land protection and rational use in China. Land Use Pol. 2021, 106, 105454. [Google Scholar] [CrossRef]
- Zhou, Y.; Guo, L.; Liu, Y. Land consolidation boosting poverty alleviation in China: Theory and practice. Land Use Pol. 2019, 82, 339–348. [Google Scholar] [CrossRef]
- Ying, L.; Dong, Z.; Wang, J.; Mei, Y.; Shen, Z.; Zhang, Y. Rural economic benefits of land consolidation in mountainous and hilly areas of southeast China: Implications for rural development. J. Rural Stud. 2020, 74, 142–159. [Google Scholar] [CrossRef]
- Luo, W.; Timothy, D.J. An assessment of farmers’ satisfaction with land consolidation performance in China. Land Use Pol. 2017, 61, 501–510. [Google Scholar] [CrossRef]
- Rao, J. Comprehensive land consolidation as a development policy for rural vitalisation: Rural In Situ Urbanisation through semi socio-economic restructuring in Huai Town. J. Rural Stud. 2022, 93, 386–397. [Google Scholar] [CrossRef]
- Jiang, Y.; Long, H.; Tang, Y.; Deng, W.; Chen, K.; Zheng, Y. The impact of land consolidation on rural vitalization at village level: A case study of a Chinese village. J. Rural Stud. 2021, 86, 485–496. [Google Scholar] [CrossRef]
- Basista, I.; Balawejder, M. Assessment of selected land consolidation in south-eastern Poland. Land Use Pol. 2020, 99, 105033. [Google Scholar] [CrossRef]
- Pašakarnis, G.; Maliene, V.; Dixon-Goughc, R.; Malys, N. Decision support framework to rank and prioritise the potential land areas for comprehensive land consolidation. Land Use Pol. 2021, 100, 104908. [Google Scholar] [CrossRef]
- Zhu, T.; Zhang, F.; Li, C.; Zhu, F.; Qu, Y.; Li, L.; Liu, J. Estimation and validation of rural residential land consolidation potential based on vegetation coverage rate. Trans. CSAE 2013, 29, 240–249. [Google Scholar]
- Zhou, J.; Zhang, F.; Wang, X.; Zhang, B. Spatial-temporal change and analysis of land consolidation’s newly increased cultivated land in China. Trans. CSAE 2014, 30, 282–289. [Google Scholar]
- Gao, Y.; Zhang, F.; Hao, J.; Zhang, B.; Zhou, J. Consolidation sequence of rural residential land based on consolidation potential and urgency degree. Resour. Sci. 2016, 38, 185–195. [Google Scholar]
- Janus, J.; Ertunç, E. Towards a full automation of land consolidation projects: Fast land partitioning algorithm using the land value map. Land Use Pol. 2022, 120, 106282. [Google Scholar] [CrossRef]
- Asiama, K.O.; Bennett, R.M.; Zevenbergen, J.A. Land consolidation on Ghana’s rural customary lands: Drawing from The Dutch, Lithuanian and Rwandan experiences. J. Rural Stud. 2017, 56, 87–99. [Google Scholar] [CrossRef]
- Chartin, C.; Evrard, O.; Salvador-Blanes, S.; Hinschberger, F.; Oost, K.V.; Lefèvre, I.; Daroussin, J.; Macaire, J.J. Quantifying and modelling the impact of land consolidation and field borders on soil redistribution in agricultural landscapes (1954–2009). Catena 2013, 110, 184–195. [Google Scholar] [CrossRef]
- Yuan, X.; Shao, Y.; Li, Y.; Liu, Y.; Wang, Y.; Wei, X.; Wang, X.; Zhao, Y. Cultivated land quality improvement to promote revitalization of sandy rural areas along the Great Wall in northern Shaanxi Province, China. J. Rural Stud. 2019, 93, 367–374. [Google Scholar] [CrossRef]
- Janus, J.; Taszakowski, J. Spatial differentiation of indicators presenting selected barriers in the productivity of agricultural areas: A regional approach to setting land consolidation priorities. Ecol. Indic. 2018, 93, 718–729. [Google Scholar] [CrossRef]
- Wu, C.; Huang, J.; Zhu, H.; Zhang, L.; Minasny, B.; Marchant, B.P. Spatial changes in soil chemical properties in an agricultural zone in southeastern China due to land consolidation. Soil Tillage Res. 2019, 187, 152–160. [Google Scholar] [CrossRef]
- Song, W.; Pijanowski, B.C. The effects of China’s cultivated land balance program on potential land productivity at a national scale. Appl. Geogr. 2014, 46, 158–170. [Google Scholar] [CrossRef]
- Harasimowicz, S.; Janus, J.; Bacior, S.; Gniadek, J. Shape and size of parcels and transport costs as a mixed integer programming problem in optimization of land consolidation. Comput. Electron. Agric. 2017, 140, 113–122. [Google Scholar] [CrossRef]
- Liu, J.; Jin, X.; Xu, W.; Sun, R.; Han, B.; Yang, X.; Gu, Z.; Xu, G.; Sui, X.; Zhou, Y. Influential factors and classification of cultivated land fragmentation, and implications for future land consolidation: A case study of Jiangsu Province in eastern China. Land Use Pol. 2019, 88, 104185. [Google Scholar] [CrossRef]
- Gong, Y.; Tan, R. Emergence of local collective action for land adjustment in land consolidation in China: An archetype analysis. Landsc. Urban Plan. 2021, 214, 104160. [Google Scholar] [CrossRef]
- Uyan, M.; Cay, T.; Inceyol, Y.; Hakli, H. Comparison of designed different land reallocation models in land consolidation: A case study in Konya/Turkey. Comput. Electron. Agric. 2015, 110, 249–258. [Google Scholar] [CrossRef]
- Tran, D.; Thu, V.H.; Goto, D. Agricultural land consolidation, labor allocation and land productivity: A case study of plot exchange policy in Vietnam. Econ. Anal. Policy 2022, 73, 455–473. [Google Scholar] [CrossRef]
- Bahar, S.K.; Kirmikil, M. The evaluation of agricultural landowner inputs before and after land consolidation: The Kesik Village example. Land Use Pol. 2021, 109, 105605. [Google Scholar] [CrossRef]
- Bizoza, A.R. Investigating the effectiveness of land use consolidation—A component of the crop intensification programme in Rwanda. J. Rural Stud. 2021, 87, 213–225. [Google Scholar] [CrossRef]
- Zhou, Y.; Li, Y.; Xu, C. Land consolidation and rural revitalization in China: Mechanisms and paths. Land Use Pol. 2020, 91, 104379. [Google Scholar] [CrossRef]
- Zhong, X. Strengthen research on mountain sciences as the core of man-mountain in a real system. J. Geogr. Sci. 2011, 29, 1–5. [Google Scholar]
- Liu, Y.; Li, Y. Revitalize the world’s countrysides. Nature 2017, 548, 275–277. [Google Scholar] [CrossRef] [Green Version]
- Zhang, H.; Zhang, S.; Liu, Z. Evolution and influencing factors of China’s rural population distribution patterns since 1990. PLoS ONE 2020, 15, e0233637. [Google Scholar] [CrossRef]
- Hua, X.; Yan, J.; Li, H.; He, W.; Li, X. Wildlife damage and cultivated land abandonment: Findings from the mountainous areas of Chongqing, China. Crop Prot. 2016, 84, 141–149. [Google Scholar] [CrossRef]
- Hou, D.; Meng, F.; Prishchepov, A.V. How is urbanization shaping agricultural land-use? Unraveling the nexus between farmland abandonment and urbanization in China. Landsc. Urban Plan. 2021, 214, 104170. [Google Scholar] [CrossRef]
- Cheng, X.; Zhou, H.; Liu, X.; Chen, X. Study on effect of farmers’ concurrent business degree on cropland abandonment in mountainous area: A case study in Wuling Mountain Area. Resour. Environ. Yangtze Basin 2021, 30, 246–256. [Google Scholar]
- Chen, Q.; Xie, H.; Zhai, Q. Management policy of farmers’ cultivated land abandonment behavior based on evolutionary game and simulation analysis. Land 2022, 11, 336. [Google Scholar] [CrossRef]
- Li, S.; Li, X. Progress and prospect on farmland abandonment. Acta Geogr. Sin. 2016, 71, 370–389. [Google Scholar]
- Li, S.; Li, X.; Xin, L.; Tan, M.; Wang, X.; Wang, R.; Jiang, M.; Wang, Y. Extent and distribution of cropland abandonment in Chinese mountainous areas. Resour. Sci. 2017, 39, 1801–1811. [Google Scholar]
- Shi, K.; Yang, Q.; Li, Y.; Sun, X. Mapping and evaluating cultivated land fallow in Southwest China using multisource data. Sci. Total Environ. 2019, 654, 987–999. [Google Scholar] [CrossRef]
- Zhang, Y.; Li, X.; Song, W.; Zhai, L. Land abandonment under rural restructuring in China explained from a cost-benefit perspective. J. Rural Stud. 2016, 47, 524–532. [Google Scholar] [CrossRef]
- Wang, Y.; Peng, P.; Li, Q.; Chen, Z.; Tang, W. Spatial heterogeneity of farmland abandonment in the Sichuan Province, China. Sustainability 2020, 12, 3356. [Google Scholar] [CrossRef] [Green Version]
- Ge, Y.; Zhao, Y.; Li, X. Farmland fragmentation and land use intensity in mountain areas: A case study of Yayu Village, Guizhou Province. Prog. Geogr. 2020, 39, 1095–1105. [Google Scholar] [CrossRef]
- Gellrich, M.; Zimmermann, N.E. Investigating the regional-scale pattern of agricultural land abandonment in the Swiss mountains: A spatial statistical modelling approach. Landsc. Urban Plan. 2007, 79, 65–76. [Google Scholar] [CrossRef]
- Castillo, C.P.; Jacobs-Crisioni, C.; Diogo, V.; Lavalle, C. Modelling agricultural land abandonment in a fine spatial resolution multi-level land-use model: An application for the EU. Environ. Modell. Softw. 2021, 136, 104946. [Google Scholar] [CrossRef]
- Ministry of Land and Resources of the People’s Republic of China. Acceptance Specification for Land Consolidation and Rehabilitation Projects (TD/T 1013–2013); Ministry of Land and Resources of the People’s Republic of China: Beijing, China, 2013. [Google Scholar]
- Zhang, F.; Xu, Y. Theory and Practice of Rural Land Consolidation; China Agricultural University Press: Beijing, China, 2012. [Google Scholar]
- Liu, J.; Zhang, C.; Hu, R.; Zhu, X.; Cai, J. Aging of agricultural labor force and technical efficiency in tea production: Evidence from Meitan county, China. Sustainability 2019, 11, 6246. [Google Scholar] [CrossRef]
- Shaanxi Provincial Bureau of Statistics; Shaanxi Survey Team of the National Bureau of Statistics. Shaanxi Statistical Yearbook 2020; China Statistics Press: Beijing, China, 2021. [Google Scholar]
- National Bureau of Statistics. China Statistical Yearbook 2020; China Statistics Press: Beijing, China, 2021. [Google Scholar]
- Bista, R.; Zhang, Q.; Parajuli, R.; Karki, R.; Chhetri, B.B.K.; Song, C. Cropland abandonment in the community-forestry landscape in the middle hills of Nepal. Earth Interact. 2021, 25, 136–150. [Google Scholar] [CrossRef]
- Su, G.; Okahashi, H.; Chen, L. Spatial pattern of farmland abandonment in Japan: Identification and determinants. Sustainability 2018, 10, 3676. [Google Scholar] [CrossRef] [Green Version]
- Nguyen, H.D.; Pham, V.D.; Vu, P.L.; Nguyen, T.H.T.; Nguyen, O.H.; Nguyen, T.G.; Dang, D.K.; Tran, V.T.; Bui, Q.T.; Lai, T.A.; et al. Cropland abandonment and flood risks: Spatial analysis of a case in North Central Vietnam. Anthropocene 2022, 38, 100341. [Google Scholar] [CrossRef]
- Estel, S.; Kuemmerle, T.; Alcántara, C.; Levers, C.; Prishchepov, A.; Hostert, P. Mapping farmland abandonment and recultivation across Europe using MODIS NDVI time series. Remote Sens. Environ. 2015, 163, 312–325. [Google Scholar] [CrossRef]


| Number of LCZ | Acquisition Time of Remote Sensing Image | Number of LCZ | Acquisition Time of Remote Sensing Image | ||||
|---|---|---|---|---|---|---|---|
| FPLU | MTLU | TPLU | FPLU | MTLU | TPLU | ||
| 1 | 14 January 2014 | 5 December 2017 | 10 February 2020 | 33 | 4 December 2013 | 17 December 2018 | 19 July 2020 |
| 2 | 6 August 2015 | 2 November 2018 | 20 December 2020 | 34 | 27 January 2013 | 19 January 2018 | 20 December 2020 |
| 3 | 6 August 2015 | 2 November 2018 | 20 December 2020 | 35 | 27 January 2013 | 19 January 2018 | 20 December 2020 |
| 4 | 6 May 2015 | 2 November 2018 | 20 December 2020 | 36 | 27 January 2013 | 19 January 2018 | 20 December 2020 |
| 5 | 31 August 2015 | 5 December 2017 | 20 December 2020 | 37 | 6 August 2015 | 9 January 2018 | 20 December 2020 |
| 6 | 22 January 2015 | 5 December 2017 | 20 December 2020 | 38 | 14 August 2014 | 17 May 2017 | 13 July 2019 |
| 7 | 28 June 2011 | 19 February 2016 | 25 February 2020 | 39 | 14 August 2014 | 17 May 2017 | 19 February 2020 |
| 8 | 21 December 2014 | 28 November 2017 | 11 March 2019 | 40 | 14 August 2014 | 17 May 2017 | 19 February 2020 |
| 9 | 21 December 2014 | 23 May 2017 | 11 March 2019 | 41 | 14 August 2014 | 17 May 2017 | 19 February 2020 |
| 10 | 24 July 2015 | 11 May 2018 | 9 December 2019 | 42 | 14 August 2014 | 17 May 2017 | 19 February 2020 |
| 11 | 16 December 2013 | 11 May 2018 | 22 January 2020 | 43 | 14 August 2014 | 17 May 2017 | 19 February 2020 |
| 12 | 16 December 2013 | 11 May 2018 | 22 January 2020 | 44 | 25 October 2013 | 1 March 2017 | 20 January 2018 |
| 13 | 12 October 2013 | 7 June 2016 | 2 November 2017 | 45 | 6 October 2013 | 1 March 2017 | 16 January 2018 |
| 14 | 12 October 2013 | 7 June 2016 | 2 November 2017 | 46 | 6 October 2013 | 1 March 2017 | 16 January 2018 |
| 15 | 12 October 2013 | 7 June 2016 | 2 November 2017 | 47 | 6 October 2013 | 1 March 2017 | 16 January 2018 |
| 16 | 12 October 2013 | 7 June 2016 | 2 November 2017 | 48 | 6 October 2013 | 1 March 2017 | 16 January 2018 |
| 17 | 12 October 2013 | 7 June 2016 | 2 November 2017 | 49 | 6 October 2013 | 1 March 2017 | 16 January 2018 |
| 18 | 12 October 2013 | 7 June 2016 | 2 November 2017 | 50 | 6 October 2013 | 1 March 2017 | 16 January 2018 |
| 19 | 12 October 2013 | 7 June 2016 | 2 November 2017 | 51 | 6 October 2013 | 1 March 2017 | 16 January 2018 |
| 20 | 12 October 2013 | 7 June 2016 | 2 November 2017 | 52 | 28 March 2015 | 1 March 2017 | 8 February 2021 |
| 21 | 12 October 2013 | 7 June 2016 | 2 November 2017 | 53 | 28 March 2015 | 1 March 2017 | 8 February 2021 |
| 22 | 12 October 2013 | 7 June 2016 | 2 November 2017 | 54 | 28 March 2015 | 1 March 2017 | 18 March 2019 |
| 23 | 12 October 2013 | 7 June 2016 | 2 November 2017 | 55 | 28 March 2015 | 1 March 2017 | 18 March 2019 |
| 24 | 12 October 2013 | 26 March 2016 | 14 August 2019 | 56 | 28 March 2015 | 1 March 2017 | 18 March 2019 |
| 25 | 12 October 2013 | 1 July 2016 | 2 November 2017 | 57 | 28 March 2015 | 1 March 2017 | 18 March 2019 |
| 26 | 27 January 2013 | 19 January 2018 | 26 October 2018 | 58 | 28 March 2015 | 11 March 2017 | 18 March 2019 |
| 27 | 28 March 2015 | 8 January 2018 | 26 October 2018 | 59 | 28 March 2015 | 11 March 2017 | 18 March 2019 |
| 28 | 14 August 2014 | 1 March 2017 | 26 October 2018 | 60 | 3 September 2014 | 12 May 2017 | 15 August 2019 |
| 29 | 3 September 2014 | 8 April 2018 | 15 August 2019 | 61 | 3 September 2014 | 12 May 2017 | 18 March 2019 |
| 30 | 7 February 2015 | 9 August 2017 | 8 March 2019 | 62 | 3 September 2014 | 12 May 2017 | 15 August 2019 |
| 31 | 18 December 2014 | 9 August 2017 | 26 October 2018 | 63 | 3 September 2014 | 12 May 2017 | 15 August 2019 |
| 32 | 6 October 2013 | 1 March 2017 | 26 October 2018 | 64 | 9 October 2013 | 1 March 2017 | 15 August 2019 |
| Land-Use Type | Area in FPLU (m2) | Area in MTLU (m2) | Area Change (m2) |
|---|---|---|---|
| Cultivated land | 546,069 | 1,498,596 | 952,527 |
| Forest land | 360,911 | 289,761 | −71,150 |
| Shrubland | 257,965 | 160,657 | −97,308 |
| Grassland | 928,548 | 172,013 | −756,535 |
| Inland beach | 41,159 | 1625 | −39,534 |
| Land for roads | 24,230 | 34,174 | 9944 |
| Land for ditches | 54 | 2097 | 2043 |
| Land for rural settlements | 6581 | 6581 | 0 |
| Water body | 1811 | 325 | −1486 |
| Spare land | 0 | 1499 | 1499 |
| Land-Use Type in FPLU | Increased Cultivated Land (m2) | Proportion (%) | Increased Terrace (m2) | Proportion (%) |
|---|---|---|---|---|
| Non-terraced cultivated land | 0 | 0 | 92,424 | 10.500 |
| Forest land | 102,749 | 10.656 | 98,343 | 11.172 |
| Shrubland | 136,703 | 14.177 | 114,472 | 13.005 |
| Grassland | 687,376 | 71.284 | 574,986 | 65.320 |
| Inland beach | 35,906 | 3.724 | 0 | 0.000 |
| Land for roads | 46 | 0.005 | 23 | 0.003 |
| Water body | 1486 | 0.154 | 0 | 0 |
| Land-Use Type in FPLU | HZBA | QBMA | ||
|---|---|---|---|---|
| Area (m2) | Proportion (%) | Area (m2) | Proportion (%) | |
| Forest land | 2769 | 3.364 | 99,980 | 11.336 |
| Shrubland | 10,885 | 13.222 | 125,818 | 14.266 |
| Grassland | 68,669 | 83.414 | 618,707 | 70.154 |
| Inland beach | 0 | 0 | 35,906 | 4.071 |
| Land for roads | 0 | 0 | 46 | 0.005 |
| Water body | 0 | 0 | 1486 | 0.168 |
| Total | 82,323 | 100 | 881,943 | 100 |
| Land-Use Type in FPLU | HZBA | QBMA | ||
|---|---|---|---|---|
| Area (m2) | Proportion (%) | Area (m2) | Proportion (%) | |
| Non-terraced cultivated land | 10,885 | 17.204 | 81,539 | 9.981 |
| Forest land | 2769 | 4.377 | 95,574 | 11.697 |
| Shrubland | 0 | 0 | 114,472 | 14.012 |
| Grassland | 49,615 | 78.419 | 525,371 | 64.307 |
| Land for roads | 0 | 0 | 23 | 0.003 |
| Total | 63,269 | 100 | 816,979 | 100 |
| Geomorphic Region | Land-Use Type in TPLU | Land-Use Type in MTLU | |
|---|---|---|---|
| Cultivated Land (m2) | Terrace (m2) | ||
| HZBA | Grassland (m2) | 23,215 | 0 |
| Land for roads (m2) | 225 | 225 | |
| Total | 23,440 | 225 | |
| QBMA | Grassland (m2) | 22,686 | 670 |
| Land for roads (m2) | 81 | 0 | |
| Total | 22,767 | 670 | |
Publisher’s Note: MDPI stays neutral with regard to jurisdictional claims in published maps and institutional affiliations. |
© 2022 by the authors. Licensee MDPI, Basel, Switzerland. This article is an open access article distributed under the terms and conditions of the Creative Commons Attribution (CC BY) license (https://creativecommons.org/licenses/by/4.0/).
Share and Cite
Zhou, J.; Li, C.; Chu, X.; Luo, C. Is Cultivated Land Increased by Land Consolidation Sustainably Used in Mountainous Areas? Land 2022, 11, 2236. https://doi.org/10.3390/land11122236
Zhou J, Li C, Chu X, Luo C. Is Cultivated Land Increased by Land Consolidation Sustainably Used in Mountainous Areas? Land. 2022; 11(12):2236. https://doi.org/10.3390/land11122236
Chicago/Turabian StyleZhou, Jian, Chao Li, Xiaotong Chu, and Chenying Luo. 2022. "Is Cultivated Land Increased by Land Consolidation Sustainably Used in Mountainous Areas?" Land 11, no. 12: 2236. https://doi.org/10.3390/land11122236