

Vegetation Growth Trends of Grasslands and Impact Factors in the Three Rivers Headwater Region
Abstract
:1. Introduction
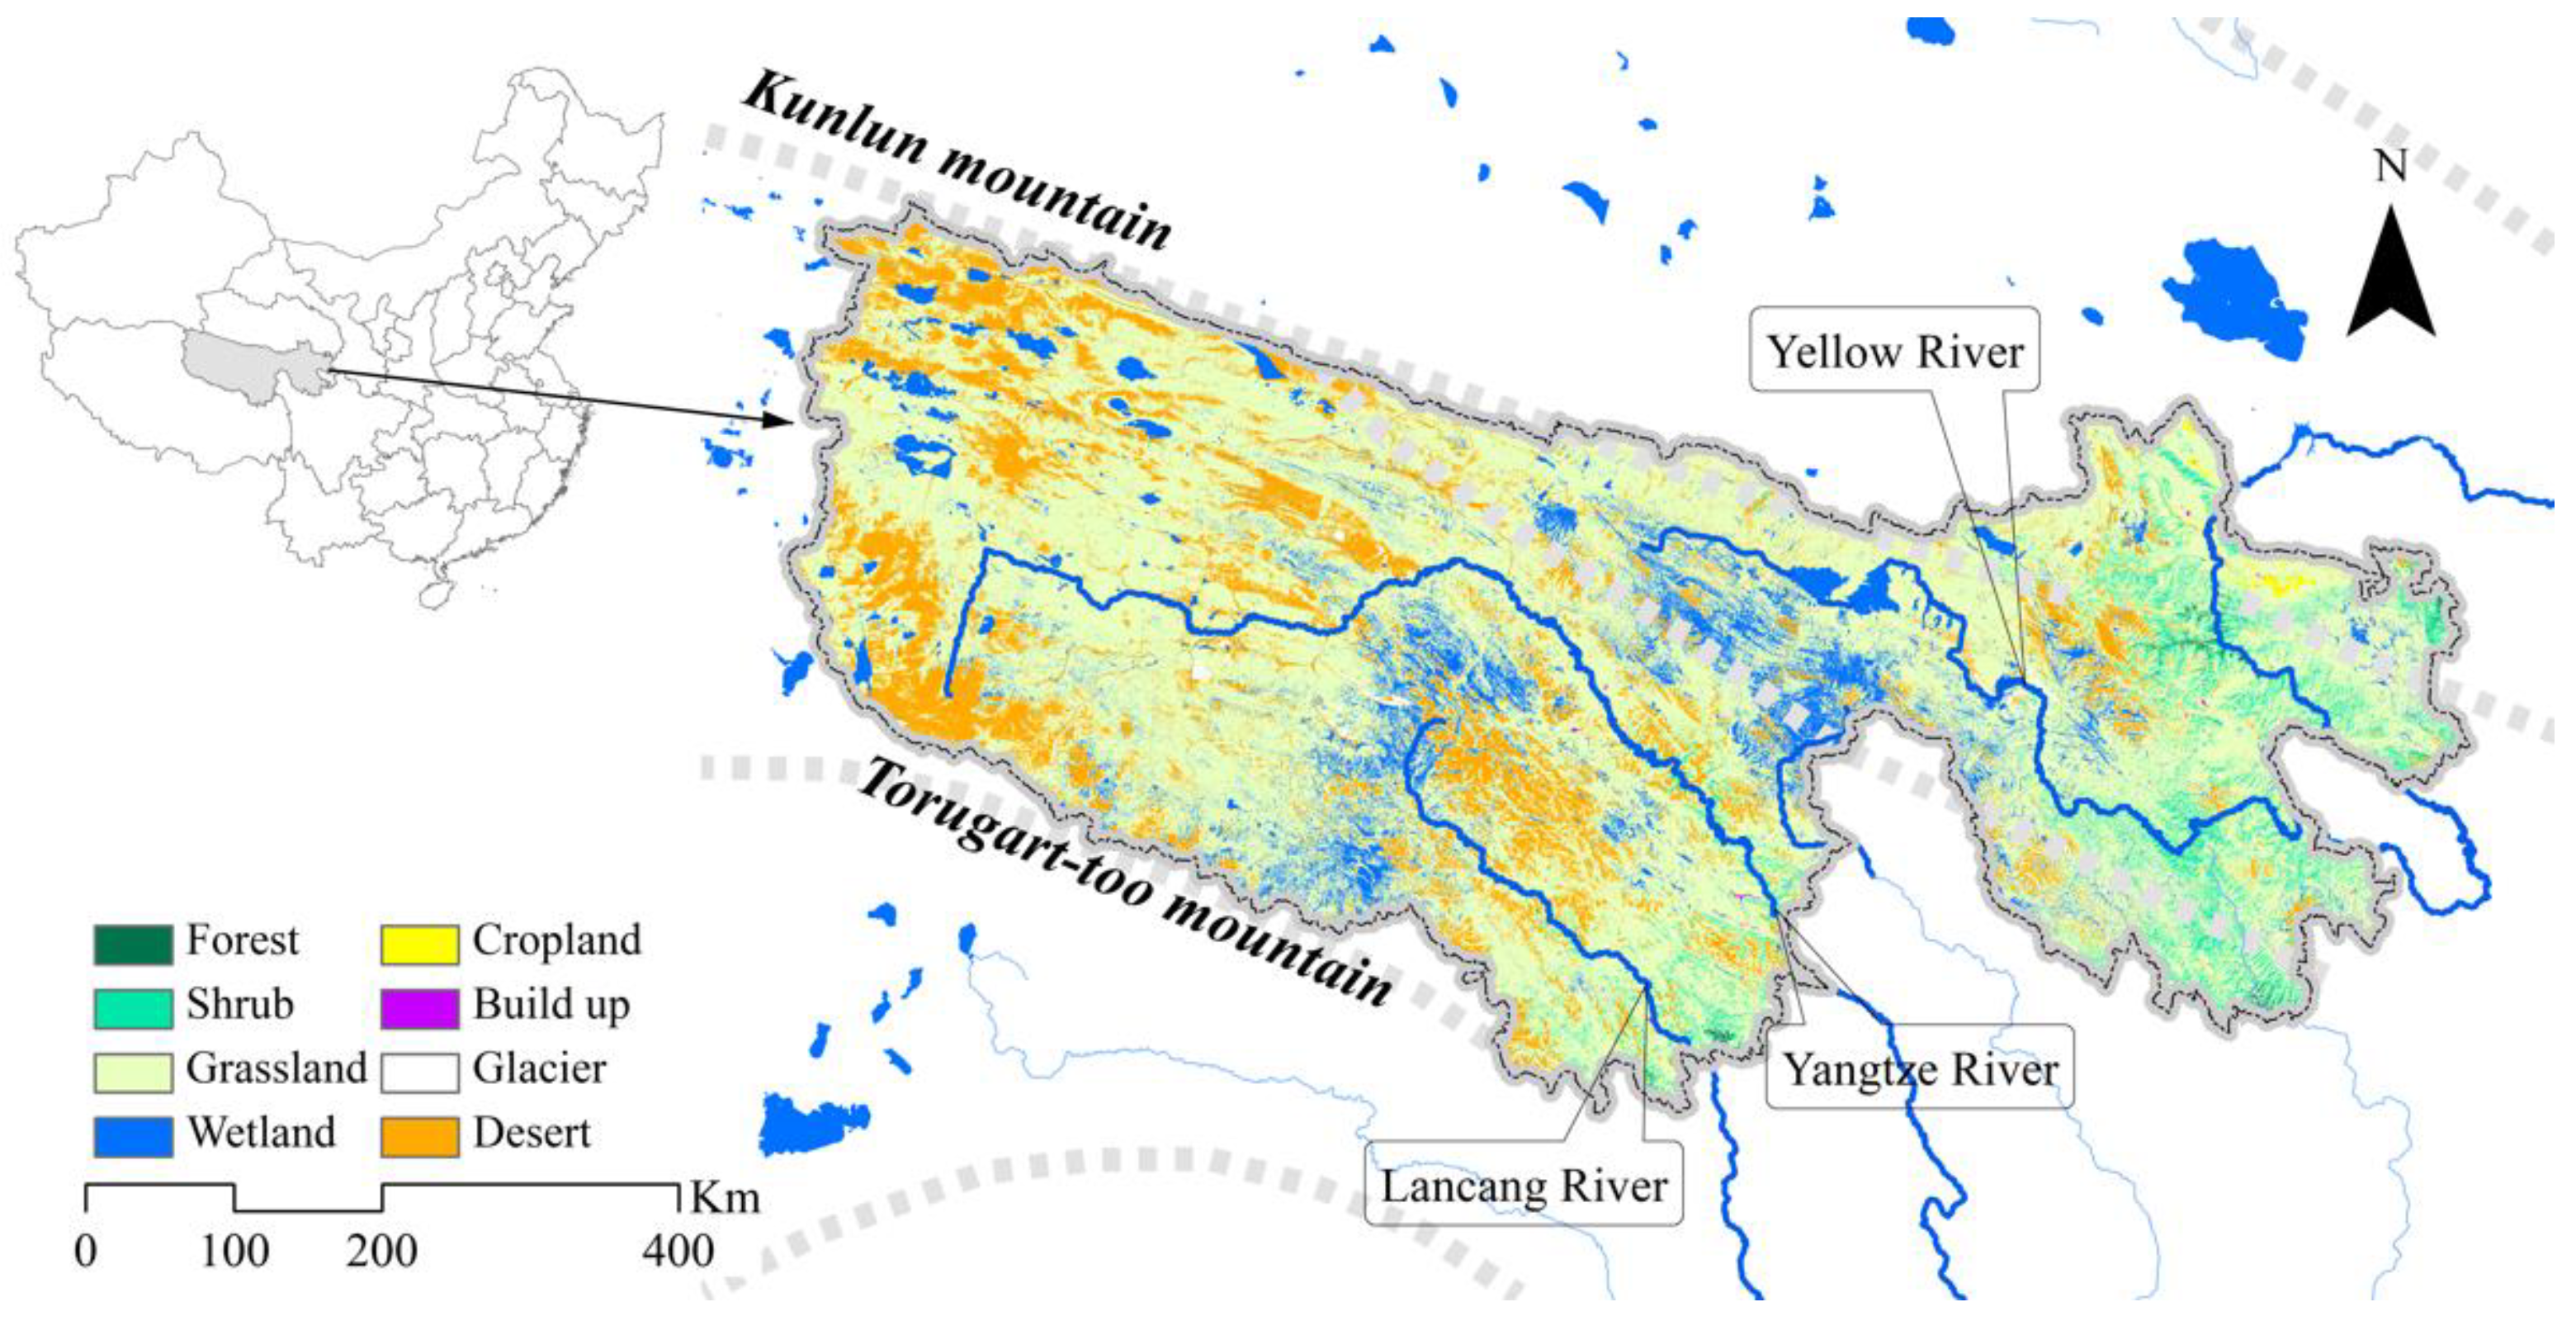
2. Study Area
3. Materials and Methods
3.1. Data Sets and Pre-Processing
3.2. Methods
- (1)
- Trend analysis
- (2)
- Correlation analysis
- (3)
- Residual analysis
4. Results
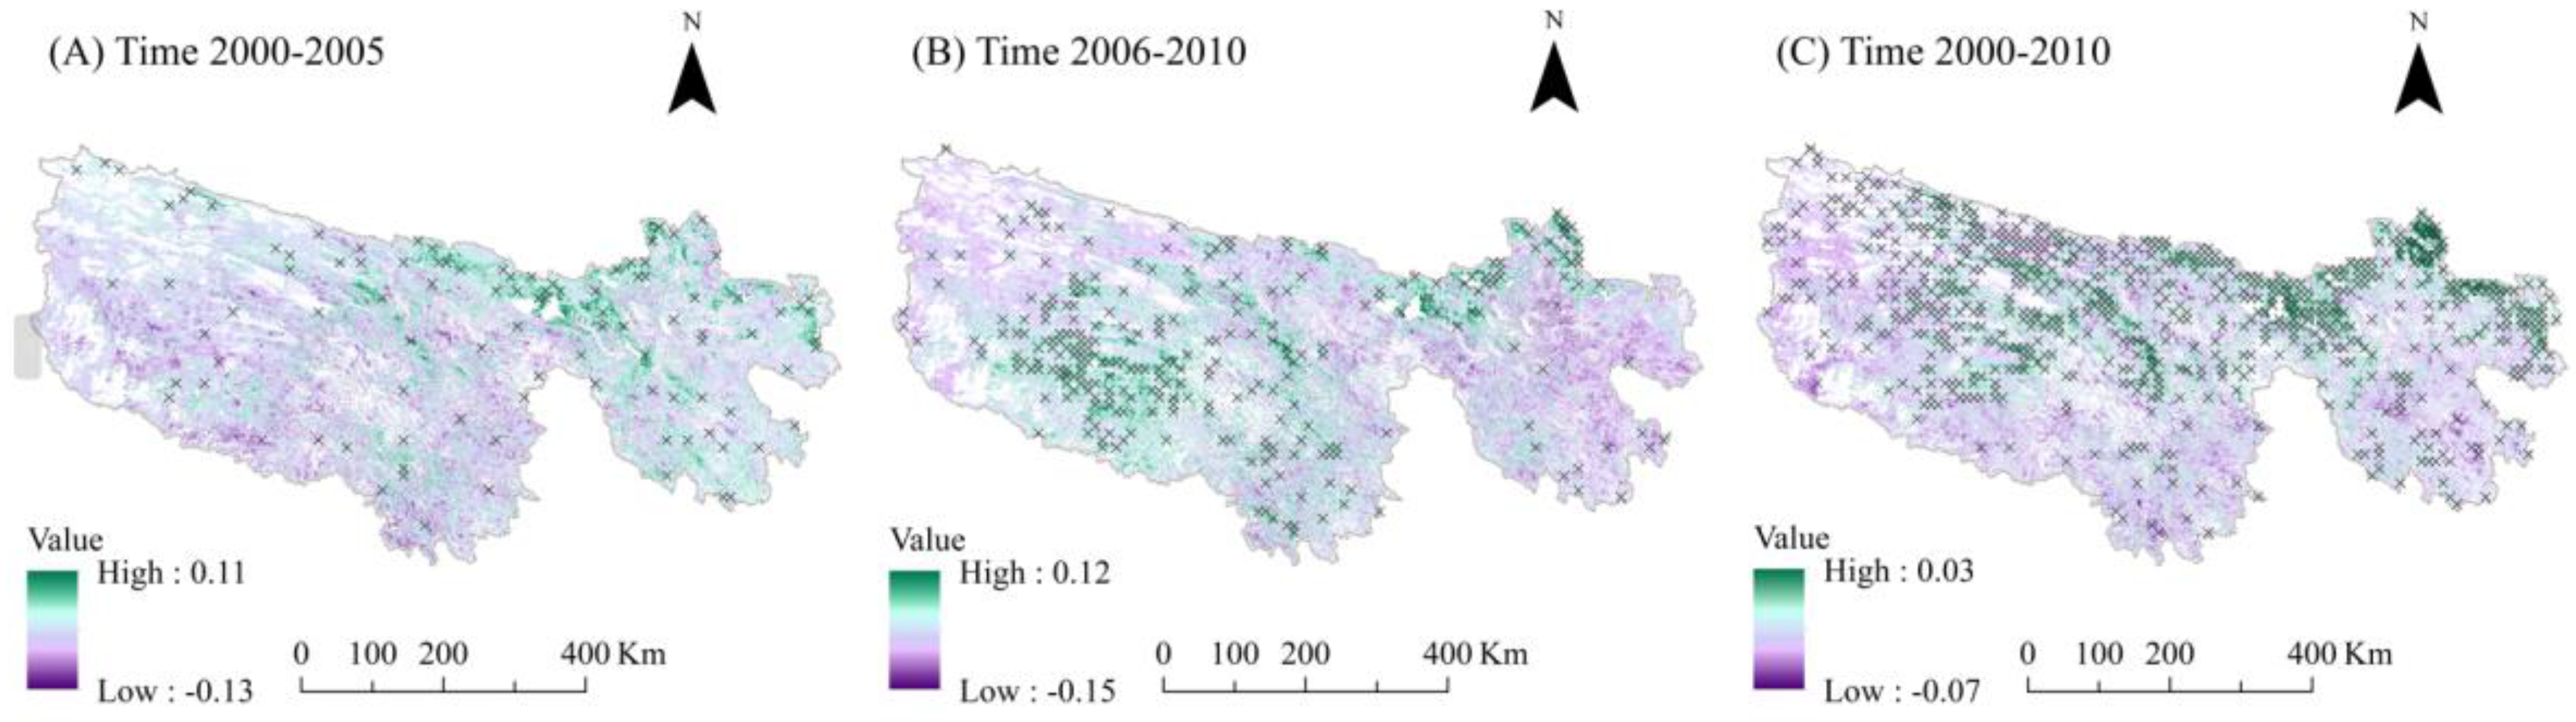
4.1. Spatial and Temporal Characteristics of Grassland Variation
4.2. Impacts of Human Activities on Grassland Degradation
5. Discussion
6. Conclusions
Author Contributions
Funding
Data Availability Statement
Conflicts of Interest
References
- Jiang, C.; Li, D.; Gao, Y.; Liu, W.; Zhang, L. Impact of climate variability and anthropogenic activity on streamflow in the Three Rivers Headwater Region, Tibetan Plateau, China. Theor. Appl. Climatol. 2017, 129, 667–681. [Google Scholar] [CrossRef]
- Alam, M.S.; Lamb, D.W.; Rahman, M.M. A refined method for rapidly determining the relationship between canopy NDVI and the pasture evapotranspiration coefficient. Comput. Electron. Agric. 2018, 147, 12–17. [Google Scholar] [CrossRef]
- Xiong, Q.; Xiao, Y.; Liang, P.; Li, L.; Zhang, L.; Li, T.; Pan, K.; Liu, C. Trends in climate change and human interventions indicate grassland productivity on the Qinghai–Tibetan Plateau from 1980 to 2015. Ecol. Indic. 2021, 129, 108010. [Google Scholar] [CrossRef]
- Miao, C.; Kong, D.; Wu, J.; Duan, Q. Functional degradation of the water–sediment regulation scheme in the lower Yellow River: Spatial and temporal analyses. Sci. Total Environ. 2016, 551, 16–22. [Google Scholar] [CrossRef] [PubMed]
- Gao, Y.; Wang, Y.; Zhang, G.; Xia, J.; Mao, L.; Tang, Z.; Zhou, P. An approach for assessing soil health: A practical guide for optimal ecological management. Environ. Earth Sci. 2011, 65, 153–159. [Google Scholar] [CrossRef]
- Cao, S.; Ma, H.; Yuan, W.; Wang, X. Interaction of ecological and social factors affects vegetation recovery in China. Biol. Conserv. 2014, 180, 270–277. [Google Scholar] [CrossRef]
- An, R.; Wang, H.-L.; Feng, X.-Z.; Wu, H.; Wang, Z.; Wang, Y.; Shen, X.-J.; Lu, C.-H.; Quaye-Ballard, J.A.; Chen, Y.-H.; et al. Monitoring rangeland degradation using a novel local NPP scaling based scheme over the “Three-River Headwaters” region, hinterland of the Qinghai-Tibetan Plateau. Quat. Int. 2017, 444, 97–114. [Google Scholar] [CrossRef] [Green Version]
- Chen, L.; Cao, S. Lack of integrated solutions hinders environmental recovery in China. Ecol. Eng. 2013, 54, 233–235. [Google Scholar] [CrossRef]
- Gao, Y.; He, N.; Yu, G.; Chen, W.; Wang, Q. Long-term effects of different land use types on C, N, and P stoichiometry and storage in subtropical ecosystems: A case study in China. Ecol. Eng. 2014, 67, 171–181. [Google Scholar] [CrossRef]
- Xiao, Y.; Xiong, Q.; Liang, P.; Xiao, Q. Potential Risk to Water Resources under Eco-restoration Policy and Global Change in the Tibetan Plateau. Environ. Res. Lett. 2021, 16, 094004. [Google Scholar] [CrossRef]
- Khan, Z.; Rahimi-Eichi, V.; Haefele, S.; Garnett, T.; Miklavcic, S.J. Estimation of vegetation indices for high-throughput phenotyping of wheat using aerial imaging. Plant Methods 2018, 14, 20. [Google Scholar] [CrossRef] [PubMed] [Green Version]
- Trueman, I.; Mitchell, D.; Besenyei, L. The effects of turf translocation and other environmental variables on the vegetation of a large species-rich mesotrophic grassland. Ecol. Eng. 2007, 31, 79–91. [Google Scholar] [CrossRef]
- Pradhan, S.; Sehgal, V.K.; Bandyopadhyay, K.K.; Sahoo, R.N.; Panigrahi, P.; Parihar, C.M.; Jat, S.L. Comparison of Vegetation Indices from Two Ground Based Sensors. J. Indian Soc. Remote Sens. 2017, 46, 321–326. [Google Scholar] [CrossRef]
- Xiao, Q.; Xiao, Y. Impact of artificial afforestation on the regional water supply balance in Southwest China. J. Sustain. For. 2019, 38, 427–441. [Google Scholar] [CrossRef]
- Patel, N.R.; Padalia, H.; Devadas, R.; Huete, A.; Kumar, A.S.; Murthy, Y.V.N.K. Estimating Net Primary Productivity of Croplands in Indo-Gangetic Plains Using GOME-2 Sun-Induced Fluorescence and MODIS NDVI. Curr. Sci. 2018, 114, 1333–1337. [Google Scholar] [CrossRef]
- Fan, J.-W.; Shao, Q.-Q.; Liu, J.-Y.; Wang, J.-B.; Harris, W.; Chen, Z.-Q.; Zhong, H.-P.; Xu, X.-L.; Liu, R.-G. Assessment of effects of climate change and grazing activity on grassland yield in the Three Rivers Headwaters Region of Qinghai–Tibet Plateau, China. Environ. Monit. Assess. 2009, 170, 571–584. [Google Scholar] [CrossRef]
- Orusa, T.; Mondino, E.B. Exploring Short-Term Climate Change Effects on Rangelands and Broad-Leaved Forests by Free Satellite Data in Aosta Valley (Northwest Italy). Climate 2021, 9, 47. [Google Scholar] [CrossRef]
- Osunmadewa, B.A.; Gebrehiwot, W.Z.; Csaplovics, E.; Adeofun, O.C. Spatio-temporal monitoring of vegetation phenology in the dry sub-humid region of Nigeria using time series of AVHRR NDVI and TAMSAT datasets. Open Geosci. 2018, 10, 1–11. [Google Scholar] [CrossRef]
- Konda, V.G.R.K.; Chejarla, V.R.; Mandla, V.R.; Voleti, V.; Chokkavarapu, N. Correction to: Vegetation damage assessment due to Hudhud cyclone based on NDVI using Landsat-8 satellite imagery. Arab. J. Geosci. 2018, 11, 67. [Google Scholar] [CrossRef] [Green Version]
- Geerken, R.; Ilaiwi, M. Assessment of rangeland degradation and development of a strategy for rehabilitation. Remote Sens. Environ. 2004, 90, 490–504. [Google Scholar] [CrossRef]
- Paudel, K.P.; Andersen, P. Assessing rangeland degradation using multi temporal satellite images and grazing pressure surface model in Upper Mustang, Trans Himalaya, Nepal. Remote Sens. Environ. 2010, 114, 1845–1855. [Google Scholar] [CrossRef]
- Jönsson, P.; Eklundh, L. TIMESAT—A program for analyzing time-series of satellite sensor data. Comput. Geosci. 2004, 30, 833–845. [Google Scholar] [CrossRef] [Green Version]
- Xiao, Y.; Xiao, Q.; Xiong, Q.; Yang, Z. Effects of Ecological Restoration Measures on Soil Erosion Risk in the Three Gorges Reservoir Area Since the 1980s. Geohealth 2020, 4, e2020GH000274. [Google Scholar] [CrossRef]
- Hoagland, S.J.; Beier, P.; Lee, D. Using MODIS NDVI phenoclasses and phenoclusters to characterize wildlife habitat: Mexican spotted owl as a case study. For. Ecol. Manag. 2018, 412, 80–93. [Google Scholar] [CrossRef]
- Xiao, Y.; Xiao, Q. Identifying key areas of ecosystem services potential to improve ecological management in Chongqing City, southwest China. Environ. Monit. Assess. 2018, 190, 258. [Google Scholar] [CrossRef] [PubMed]
- Mondal, S.; Jeganathan, C. Mountain agriculture extraction from time-series MODIS NDVI using dynamic time warping technique. Int. J. Remote Sens. 2018, 39, 3679–3704. [Google Scholar] [CrossRef]
- Evans, J.; Geerken, R. Discrimination between climate and human-induced dryland degradation. J. Arid Environ. 2004, 57, 535–554. [Google Scholar] [CrossRef]
- Xiao, Y.; Xiao, Q.; Sun, X. Ecological Risks Arising from the Impact of Large-scale Afforestation on the Regional Water Supply Balance in Southwest China. Sci. Rep. 2020, 10, 4150. [Google Scholar] [CrossRef] [Green Version]
- Chen, H.; Shao, L.; Zhao, M.; Zhang, X.; Zhang, D. Grassland conservation programs, vegetation rehabilitation and spatial dependency in Inner Mongolia, China. Land Use Policy 2017, 64, 429–439. [Google Scholar] [CrossRef]
- Miao, C.Y.; Ni, J.R.; Borthwick, A.G.L. Recent changes of water discharge and sediment load in the Yellow River basin, China. Prog. Phys. Geogr. 2010, 34, 541–561. [Google Scholar] [CrossRef]
- Xiao, Y.; Xiong, Q.; Pan, K. What Is Left for Our Next Generation? Integrating Ecosystem Services into Regional Policy Planning in the Three Gorges Reservoir Area of China. Sustainability 2019, 11, 3. [Google Scholar] [CrossRef] [Green Version]
- Xiao, Q.; Tao, J.; Xiao, Y.; Qian, F. Monitoring vegetation cover in Chongqing between 2001 and 2010 using remote sensing data. Environ. Monit. Assess. 2017, 189, 493. [Google Scholar] [CrossRef] [PubMed]
- Madonsela, S.; Cho, M.A.; Ramoelo, A.; Mutanga, O.; Naidoo, L. Estimating tree species diversity in the savannah using NDVI and woody canopy cover. Int. J. Appl. Earth Obs. Geoinf. 2018, 66, 106–115. [Google Scholar] [CrossRef] [Green Version]
- Miao, C.; Ni, J.; Borthwick, A.G.; Yang, L. A preliminary estimate of human and natural contributions to the changes in water discharge and sediment load in the Yellow River. Glob. Planet. Chang. 2011, 76, 196–205. [Google Scholar] [CrossRef]


| Data Name | Data Resolution | Data Source |
|---|---|---|
| MODIS-NDVI | 250 m (monthly) | Land Processes Distributed Active Archive Center (https://lpdaac.usgs.gov, 30 November 2022) |
| SRTM | 90 m | CGIAR Consortium for Spatial Information (http://srtm.csi.cgiar.org/, 30 November 2022) |
| Precipitation, temperature | 146 points (monthly) | Chinese National Metrological Information Center/China Meteorological Administration (http://data.cma.cn, 30 November 2022) |
| Ecosystem map | 90 m (yearly) | Resource and Environment Science and Data Center, Chinese Academy of Sciences (https://www.resdc.cn/, 30 November 2022) |
| Variation Trend | b Value Range | p Value Range |
|---|---|---|
| Significant decrease | b < 0 | p ≤ 0.05 |
| Significant increase | b > 0 | p ≤ 0.05 |
| No significant change | p > 0.05 |
| Degradation Trends of Observed NDVI | Trends of Predicted NDVI | Slope of Residual | Definition Description |
|---|---|---|---|
| <0 | >0 | <0 | Human-induced vegetation degradation |
| <0 | >0 | Climate-induced vegetation degradation | |
| <0 | <0 | Both climate- and human-induced vegetation degradation | |
| >0 | >0 | Uncertainty error |
| 2000–2010 | 2000–2005 | 2006–2010 | |
|---|---|---|---|
| Non-climate degradation area (%) | 25.85 | 35.72 | 17.66 |
| Mean of residual slope | –27.35 | –88.51 | –62.10 |
Publisher’s Note: MDPI stays neutral with regard to jurisdictional claims in published maps and institutional affiliations. |
© 2022 by the authors. Licensee MDPI, Basel, Switzerland. This article is an open access article distributed under the terms and conditions of the Creative Commons Attribution (CC BY) license (https://creativecommons.org/licenses/by/4.0/).
Share and Cite
Sun, X.; Xiao, Y. Vegetation Growth Trends of Grasslands and Impact Factors in the Three Rivers Headwater Region. Land 2022, 11, 2201. https://doi.org/10.3390/land11122201
Sun X, Xiao Y. Vegetation Growth Trends of Grasslands and Impact Factors in the Three Rivers Headwater Region. Land. 2022; 11(12):2201. https://doi.org/10.3390/land11122201
Chicago/Turabian StyleSun, Xiaoping, and Yang Xiao. 2022. "Vegetation Growth Trends of Grasslands and Impact Factors in the Three Rivers Headwater Region" Land 11, no. 12: 2201. https://doi.org/10.3390/land11122201