Article

Evaluating Biophysical Conservation Practices with Dynamic Land Use and Land Cover in the Highlands of Ethiopia

1
Guna Tana Integrated Field Research and Development Center, Debre Tabor University, Debre Tabor P.O.Box 272, Ethiopia
2
Department of Geography and Environmental Studies, Bahir Dar University, Bahir Dar P.O.Box 79, Ethiopia
3
Department of Geography and Environmental Studies, Debre Tabor University, Debre Tabor P.O.Box 272, Ethiopia
4
Australian Rivers Institute, School of Engineering and Built Environment, Griffith University, Nathan, QLD 4111, Australia
*
Author to whom correspondence should be addressed.
Land 2022, 11(12), 2187; https://doi.org/10.3390/land11122187
Submission received: 3 November 2022 / Revised: 26 November 2022 / Accepted: 30 November 2022 / Published: 2 December 2022

Abstract

:
Ethiopia is one of the sub-Saharan countries affected by land degradation, notably by soil erosion. The government of Ethiopia has launched an extensive biophysical soil and water conservation (SWC) effort each year to address the problem. These practices were installed on varying land use and land cover (LULC) systems. Despite the fact that the interventions covered the majority of the landmasses, there were no quantitative data on the scale of biophysical measures with the change in land use and land cover. Therefore, the objective of this study was to evaluate biophysical conservation practices with dynamic land use and land cover in the highlands of Ethiopia. The study focused on districts of the Amhara regional state’s South Gondar zone. A mixed research methodology was employed to gather pertinent data for the study. The dynamics of LULC were analyzed using satellite images acquired between 1990 and 2020. Biophysical conservation measures’ data and qualitative information were collected from the zonal office of agriculture. Twelve years’ worth of biophysical SWC measures data were used for the study. The results indicate that cultivated land makes up the majority of land use and land cover. Bunds built on cultivated land account for 93% of conservation practices. During the study period, there was a significant decline of biophysical conservation practices implementation in each district. Although plantation was used on a wider scale, it was unable to sustain physical SWC practices or expand forest cover in the region. In addition, lack of integrated maintenance for early installed structures decreases the effectiveness of SWC measures. In conclusion, the dynamics of LULC have a significant impact on the magnitude of biophysical conservation measures. Therefore, watershed managers shall consider the spatio-temporal variation of LULC while planning conservation practices.

1. Introduction

Land degradation is the most serious problem in sub-Saharan African countries, including Ethiopia. Land degradation in the form of soil erosion and soil fertility depletion has profound implications for agricultural gross domestic productivity for low-income countries [1,2,3]. People have been harming the environment for short-term gain despite the long-term benefits of sustainable management of natural resources. This goes against the idea of sustainable development goals, which guarantee that future generations will be able to utilize the same resources. For the vast majority of Ethiopians, natural resources (soil, water, and forests) are their primary means of subsistence. Natural resources are frequently degraded at the expense of being used to supply the rising demand for food. The deterioration of these resources has resulted in reduced agricultural productivity, poor environmental condition, and a subsequent decline in quality of life. The largest share of the land use is under agriculture. The cumulative actions on cultivated land have eventually resulted in land degradation [4]. Uncontrolled population growth, inappropriate farming systems, and poor land management practices exert pressure on the existing natural resource base [5,6].
Land degradation is largely associated with land use and land cover (LULC) changes. Studies have been reported to demonstrate the occurrences, causes, and effects of land degradation in various regions of Ethiopia [7,8,9]. Ethiopia relies on a variety of biological resources for its socioeconomic development, particularly its forests. However, there is currently an enormous strain on these resources. As the population is dependent on agricultural expansion and the clearing of forests and vegetated areas, deforestation is a key cause of land use change. Research findings indicated that factors contributing to unsustainable resource management are clearance of forests for agricultural expansion and the absence of energy-saving alternative technologies. In addition, free grazing practices are also a major source of land degradation. Both clearance of vegetated areas and poor livestock management resulted in accelerated run-off, decreased groundwater recharge, increased sediment load on rivers, siltation of reservoirs, increased flood frequency, and damage to the aquatic environment. Out of the 60 million ha of fertile agricultural land in the Amhara regional state, the assessment in [10] states that around 27 million ha are severely eroded, 14 million ha are seriously degraded, and more than 2 million ha are beyond reclamation. In order to prevent problems, a thorough degraded area restoration practice was required.
In the 1970s and 1980s, the Ethiopian government began implementing natural resource conservation measures in the highlands as a reaction to the issue of land degradation (Shiferaw and Holden, 1998). At this time, physical construction was the primary focus of the soil and water conservation (SWC) efforts. Hurni [11] set up experimental watersheds all over Ethiopia and observed soil erosion and discharge before and after implementation to determine the efficacy of these techniques. The research revealed that hillside SWC methods were successful in reducing soil losses in the first five years following implementation [12,13]. After following the construction of conservation structures for ten years, Guzman [14] conducted a new analysis of their efficacy and discovered that SWC measures had become ineffective. Physical measures being ineffectual, a strong recommendation is made for integration with biological measures. Hence, biophysical techniques are essential for land rehabilitation operations in a sustainable manner.
The South Gondar zone (SGZ) is one of the most degraded areas in the Amhara regional state. This zone has experienced rapid land use and land cover change. In contrast to other parts of Ethiopia, SGZ has a number of unproductive areas and degraded lands. The main reasons for the degradation of natural resources include soil erosion, poor grazing management, and deforestation. To address these problems, the zonal agricultural office has been practicing different land reclamation interventions using biophysical measures. The zone utilizes an integrated approach that is implemented at a watershed scale. The interventions aimed to improve social and environmental protection, decrease runoff and soil erosion, boost land production, and sustainably restore damaged ecosystems. The community-based participation that was used in the development interventions supports the empowerment of the community to manage shared resources. However, the link between such efforts and the changes in LULC has not been well-studied in the past. Therefore, the main objective of this paper is to document the spatial and temporal dynamics of development interventions in the South Gondar zone from 2011 to 2022. The study area was selected because it is an appropriate location where different biophysical conservation efforts have been made for a long time.

2. Materials and Methods
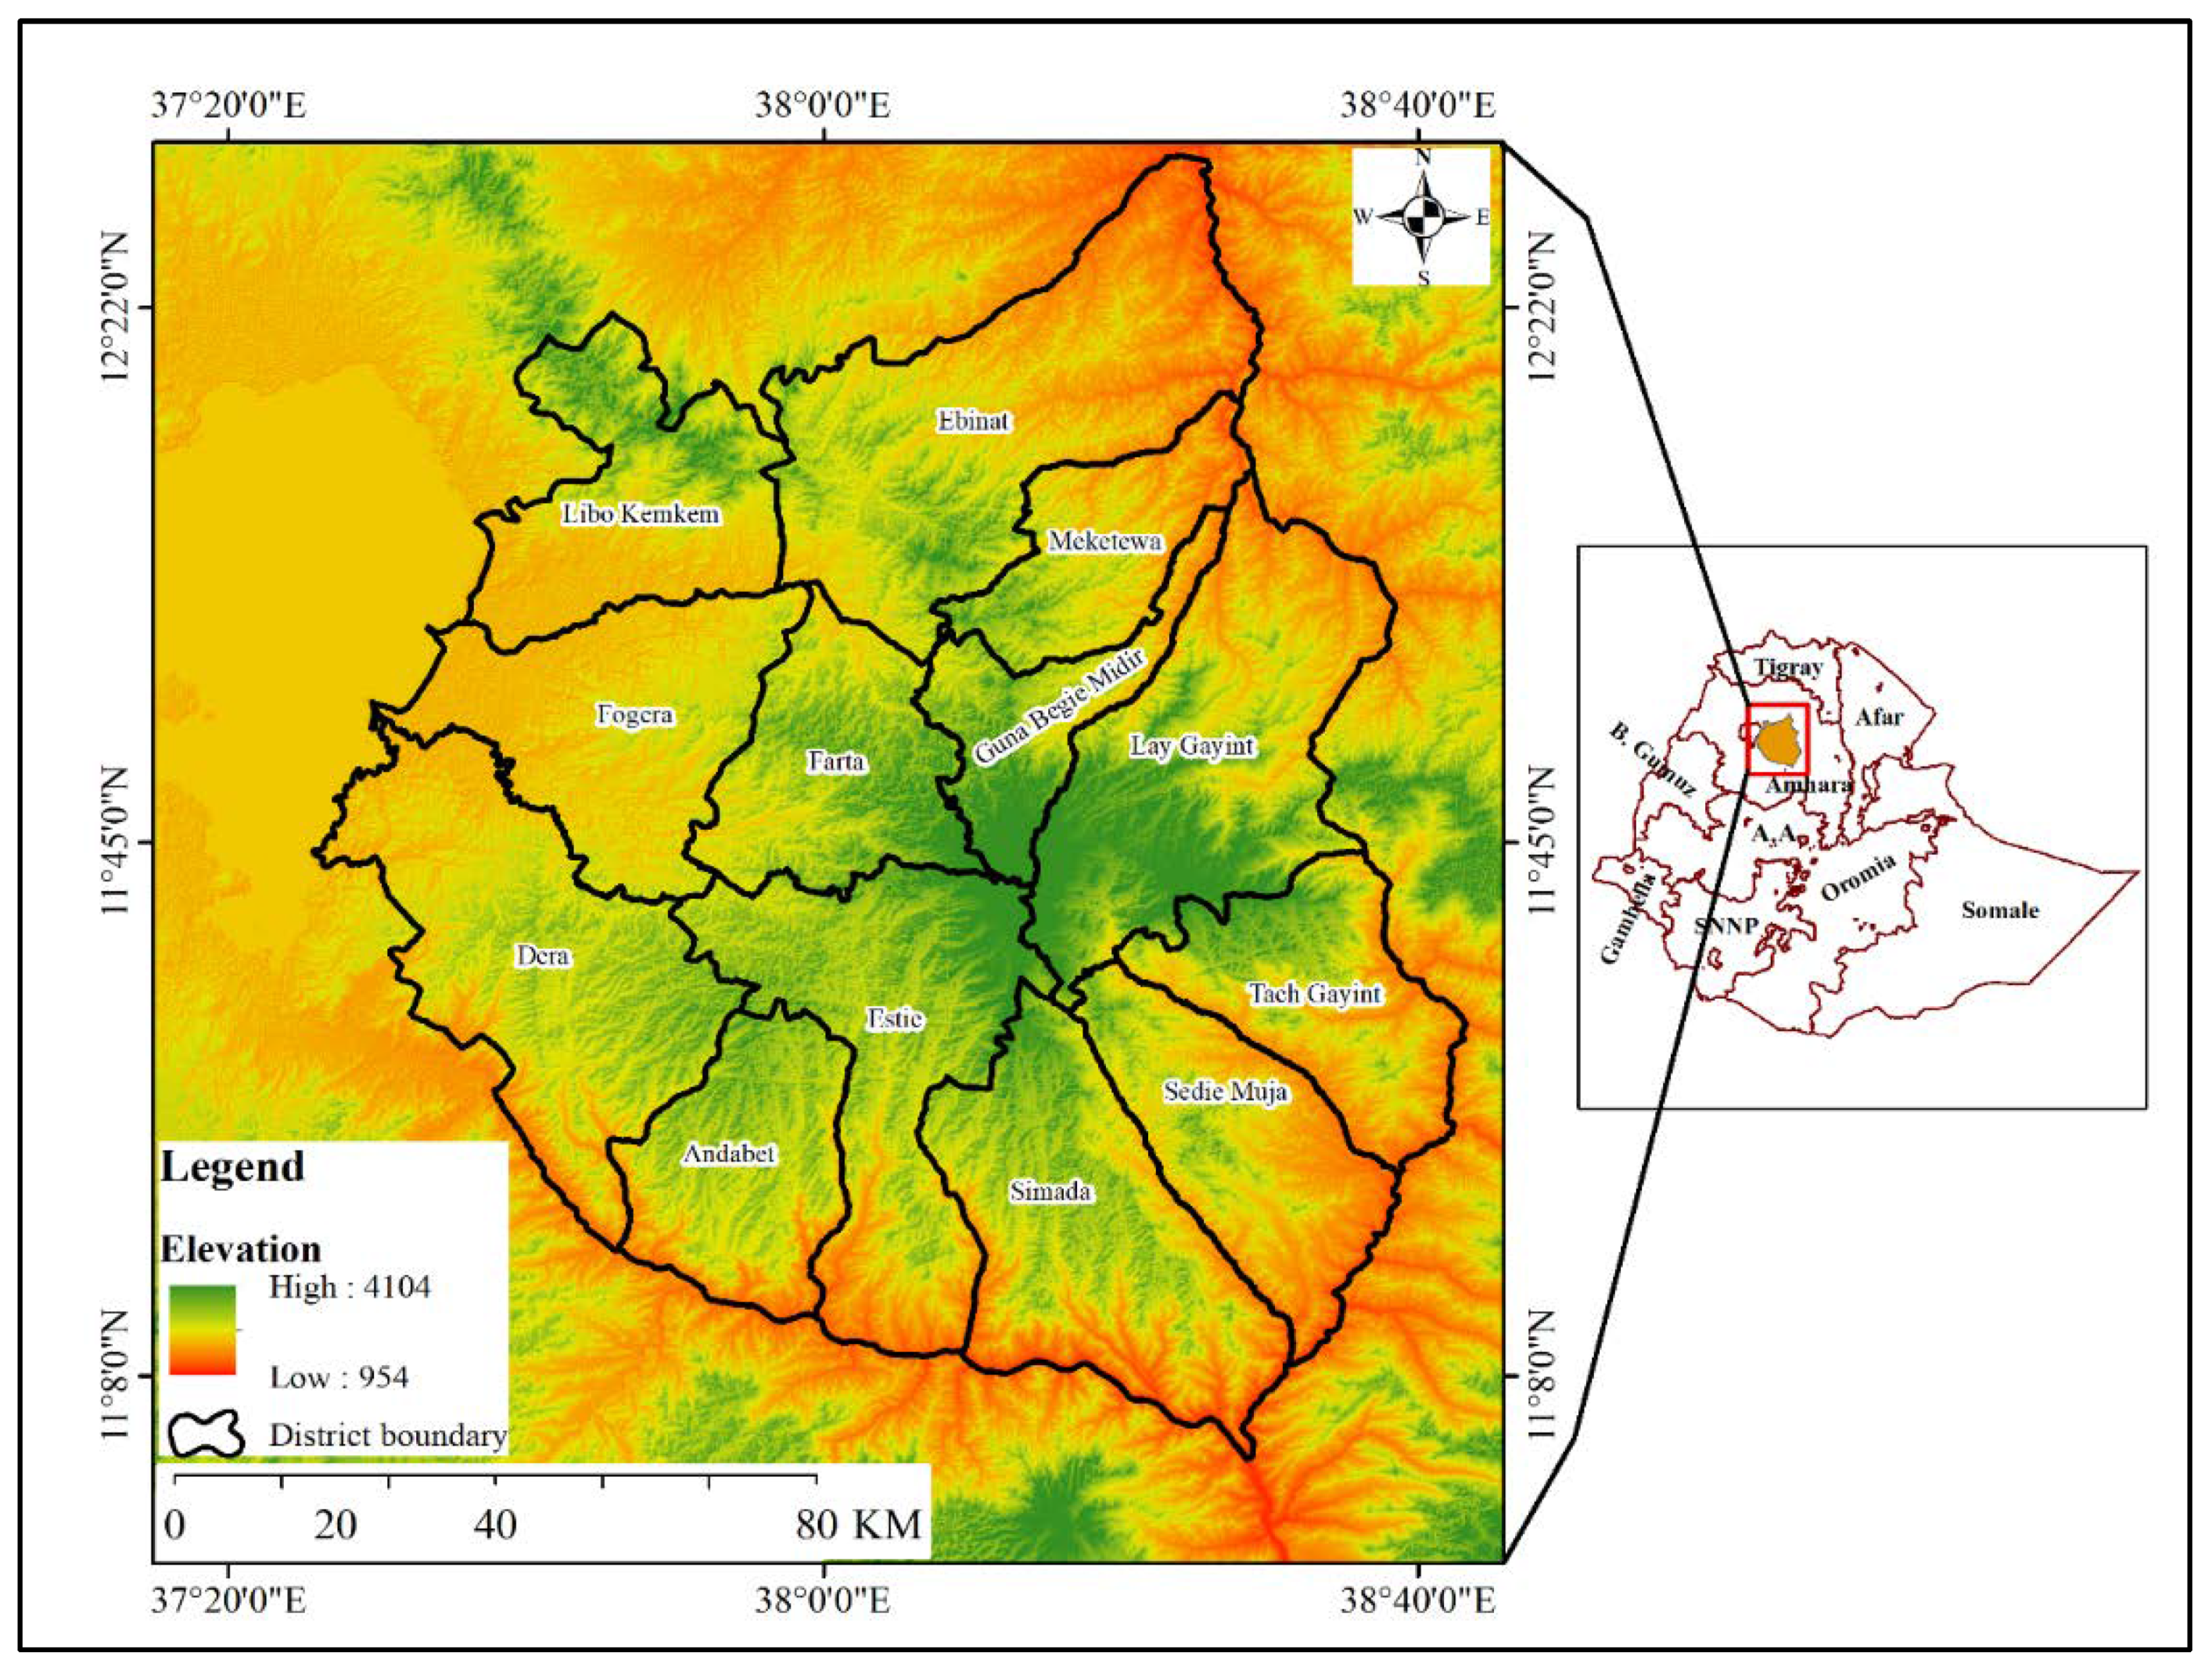
2.1. Study Area

Geographically, South Gondar zone is situated between 11°02′16″ and 12°32′22″ N latitude and 37°25′35″ and 38°43′50″ E longitude (Figure 1). The zone covers a total area of 14,064 km2. South Gondar is bordered by zones in the Amhara regional state, including Gondar on the north, East Gojjam on the south, North Wollo on the east, Lake Tana on the west, West Gojjam on the southwest, Wag Hemra on the northeast, and South Wollo on the southeast. The major rainy season lasts between June and September in the study area, with July and August being the wettest months. The rainfall varies between 900 mm and 1599 mm, with an average annual rainfall of 1300 mm. The dominant soil types are Eutric nitisols, followed by Orthic luvisols and Haplic xerosols [9]. Mixed farming practices, including crop production and animal husbandry, are the dominant livelihood options of the people. The farming system is characterized by smallholder subsistence farming that depends on rain-fed traditional oxen-driven agriculture. The zone is characterized by high soil erosion; hence, large-scale soil and water conservation practices have been implemented since 2011 through government-sponsored campaigns.

2.2. Data Collection and Analysis

2.2.1. Land Use Land Cover

Five LULC types were extracted from Landsat Images of the United States Geological Survey (USGS) in the study landscape with three reference years, i.e., 1990, 2005, and 2020. The years were selected by taking into account the years of the new regime change and land redistribution, the years of conservation measures practiced, and the availability of satellite images. In order to avoid seasonal variability, the classified images were acquired after crop harvesting, which is the time the dry season started, namely February and March. In this season, the cloud cover is minimal, in order to assure similar phenology (Table S1). Three types of imagery were used for image classification, i.e., Landsat 8 Operational Land Imager/Thermal Infrared Sensor (OLI/TIRS) (30 m), Landsat-7 Enhanced Thematic Mapper Plus (ETM+) (30 m), and Landsat 5 Enhanced Thematic Mapper (ETM) derived from the USGS Landsat Archive (http://earthexplorer.usgs.gov/ accessed on 31 August 2020) for the years 2020, 2005, and 1990, respectively (Table S1). Preprocessing of the images was performed before the actual image classification. Supervised classification with a maximum likelihood algorithm was applied to obtain land use/cover information, using ERDAS IMAGINE 2015 software. This method uses selected training samples to categorize pixels of an image into predefined land use/cover classes. Accuracy assessment was used to check the compatibility of classified images with the real land cover. Hence, producer’s accuracy, user’s accuracy, overall accuracy, and kappa coefficient measuring techniques were used to measure the accuracies of classified images. For accuracy evaluation assessment, a total of 157, 175, and 209 ground-truth points (GCP) were used for 2020, 2005, and 1990, respectively. All images were projected to the Universal Transverse Mercator (UTM, zone 37) and the World Geodetic System 84 (WGS84) datum. Based on the field observation of the study area, five different types of land use and land cover classes were identified for this zone. The descriptions of these land use and land cover classes are shown in Table 1.
A systematic way of analysis for land use change is first to have the total area for the different land use classes for the different durations and then compare the two maps. Using ERDAS IMAGINE 2015 software, we compared areas of different land uses cell by cell by overlaying the two maps. This can provide some basic quantitative information about the land use change that has occurred. A cross-table showing the changes from one class to another can be produced. A map of these changes can also be obtained using ERDAS IMAGINE 2015 software.
Change analysis was conducted using a post-classification image comparison technique. Images of different reference years were first independently classified, and then change detection processes were performed. The percentage of land use and land cover change detection was obtained using the formula used by Kindu [15].

2.2.2. Biophysical Conservation Measures

Experts of the agricultural development office of the South Gondar zone were interviewed as key informants because of their adequate knowledge of the study under investigation. Moreover, the study included exploring secondary data sources, such as technical reports, published works, and public statistics, to document the scale of the major interventions and their implementation.
The Zonal Agricultural Office provided the annual biophysical conservation measures’ data for the South Gondar zone for the twelve-year period (2011–2022). Bunds, terraces, gully rehabilitation, drainage structures, and moisture conservation are among the physical measures gathered. Biological measures include plantation activities and area closure. Plantation is a tree planting practice used as a biophysical degraded area rehabilitation mechanism. The major types of tree species planted include Acacia Decurrence, Grevillea Robusta, Acacia Saligna, and others. The information is a part of the catalog kept by the agriculture office of the South Gondar zone. The implementation of these measures dates back to the 1970s and 1980s. This study considers only twelve years of data, with varying scales of implementation over time. Therefore, evaluating the trend of the conservation efforts made so far with large-scale community mobilization is crucial. The Mann–Kendall trend test, a non-parametric statistical analysis, was used to assess the trend. The Mann–Kendall test is used to examine the existence of monotonously increasing and decreasing trends. The test is used on the data sets to find out whether there are any trends, either positive or negative, in the time series data. Given that, the test’s results are based on less of an impact from outliers.
S = i = 1 n 1 k = i + 1 n s i g ( x k + x i )
where S is the Mann–Kendall test value, x k   and x i   are the sequential data values, and i, k, and n are the lengths of the data. The S value is assumed to be zero and indicates no trend; if the value of S shows a positive value, it indicates an increasing trend, whereas a negative value of S shows a decreasing trend.
Sen [16] created the Sen Slope estimator algorithm, a straightforward non-parametric test for determining the actual slope of the Mann–Kendall trend analysis. It determines the size of any significant trend that the Mann–Kendall S test reveals. In time series data, when the trend is considered to be linear, the Sen Slope estimator test is used after the Mann–Kendall test. The Sen method is not significantly impacted by outliers or single data problems. The following equation is utilized to calculate the Sen Slope estimator.
E = x k j x i i
where E is the value of Sen Slope estimator; x k and x i   are data values at time j and i.

3. Results

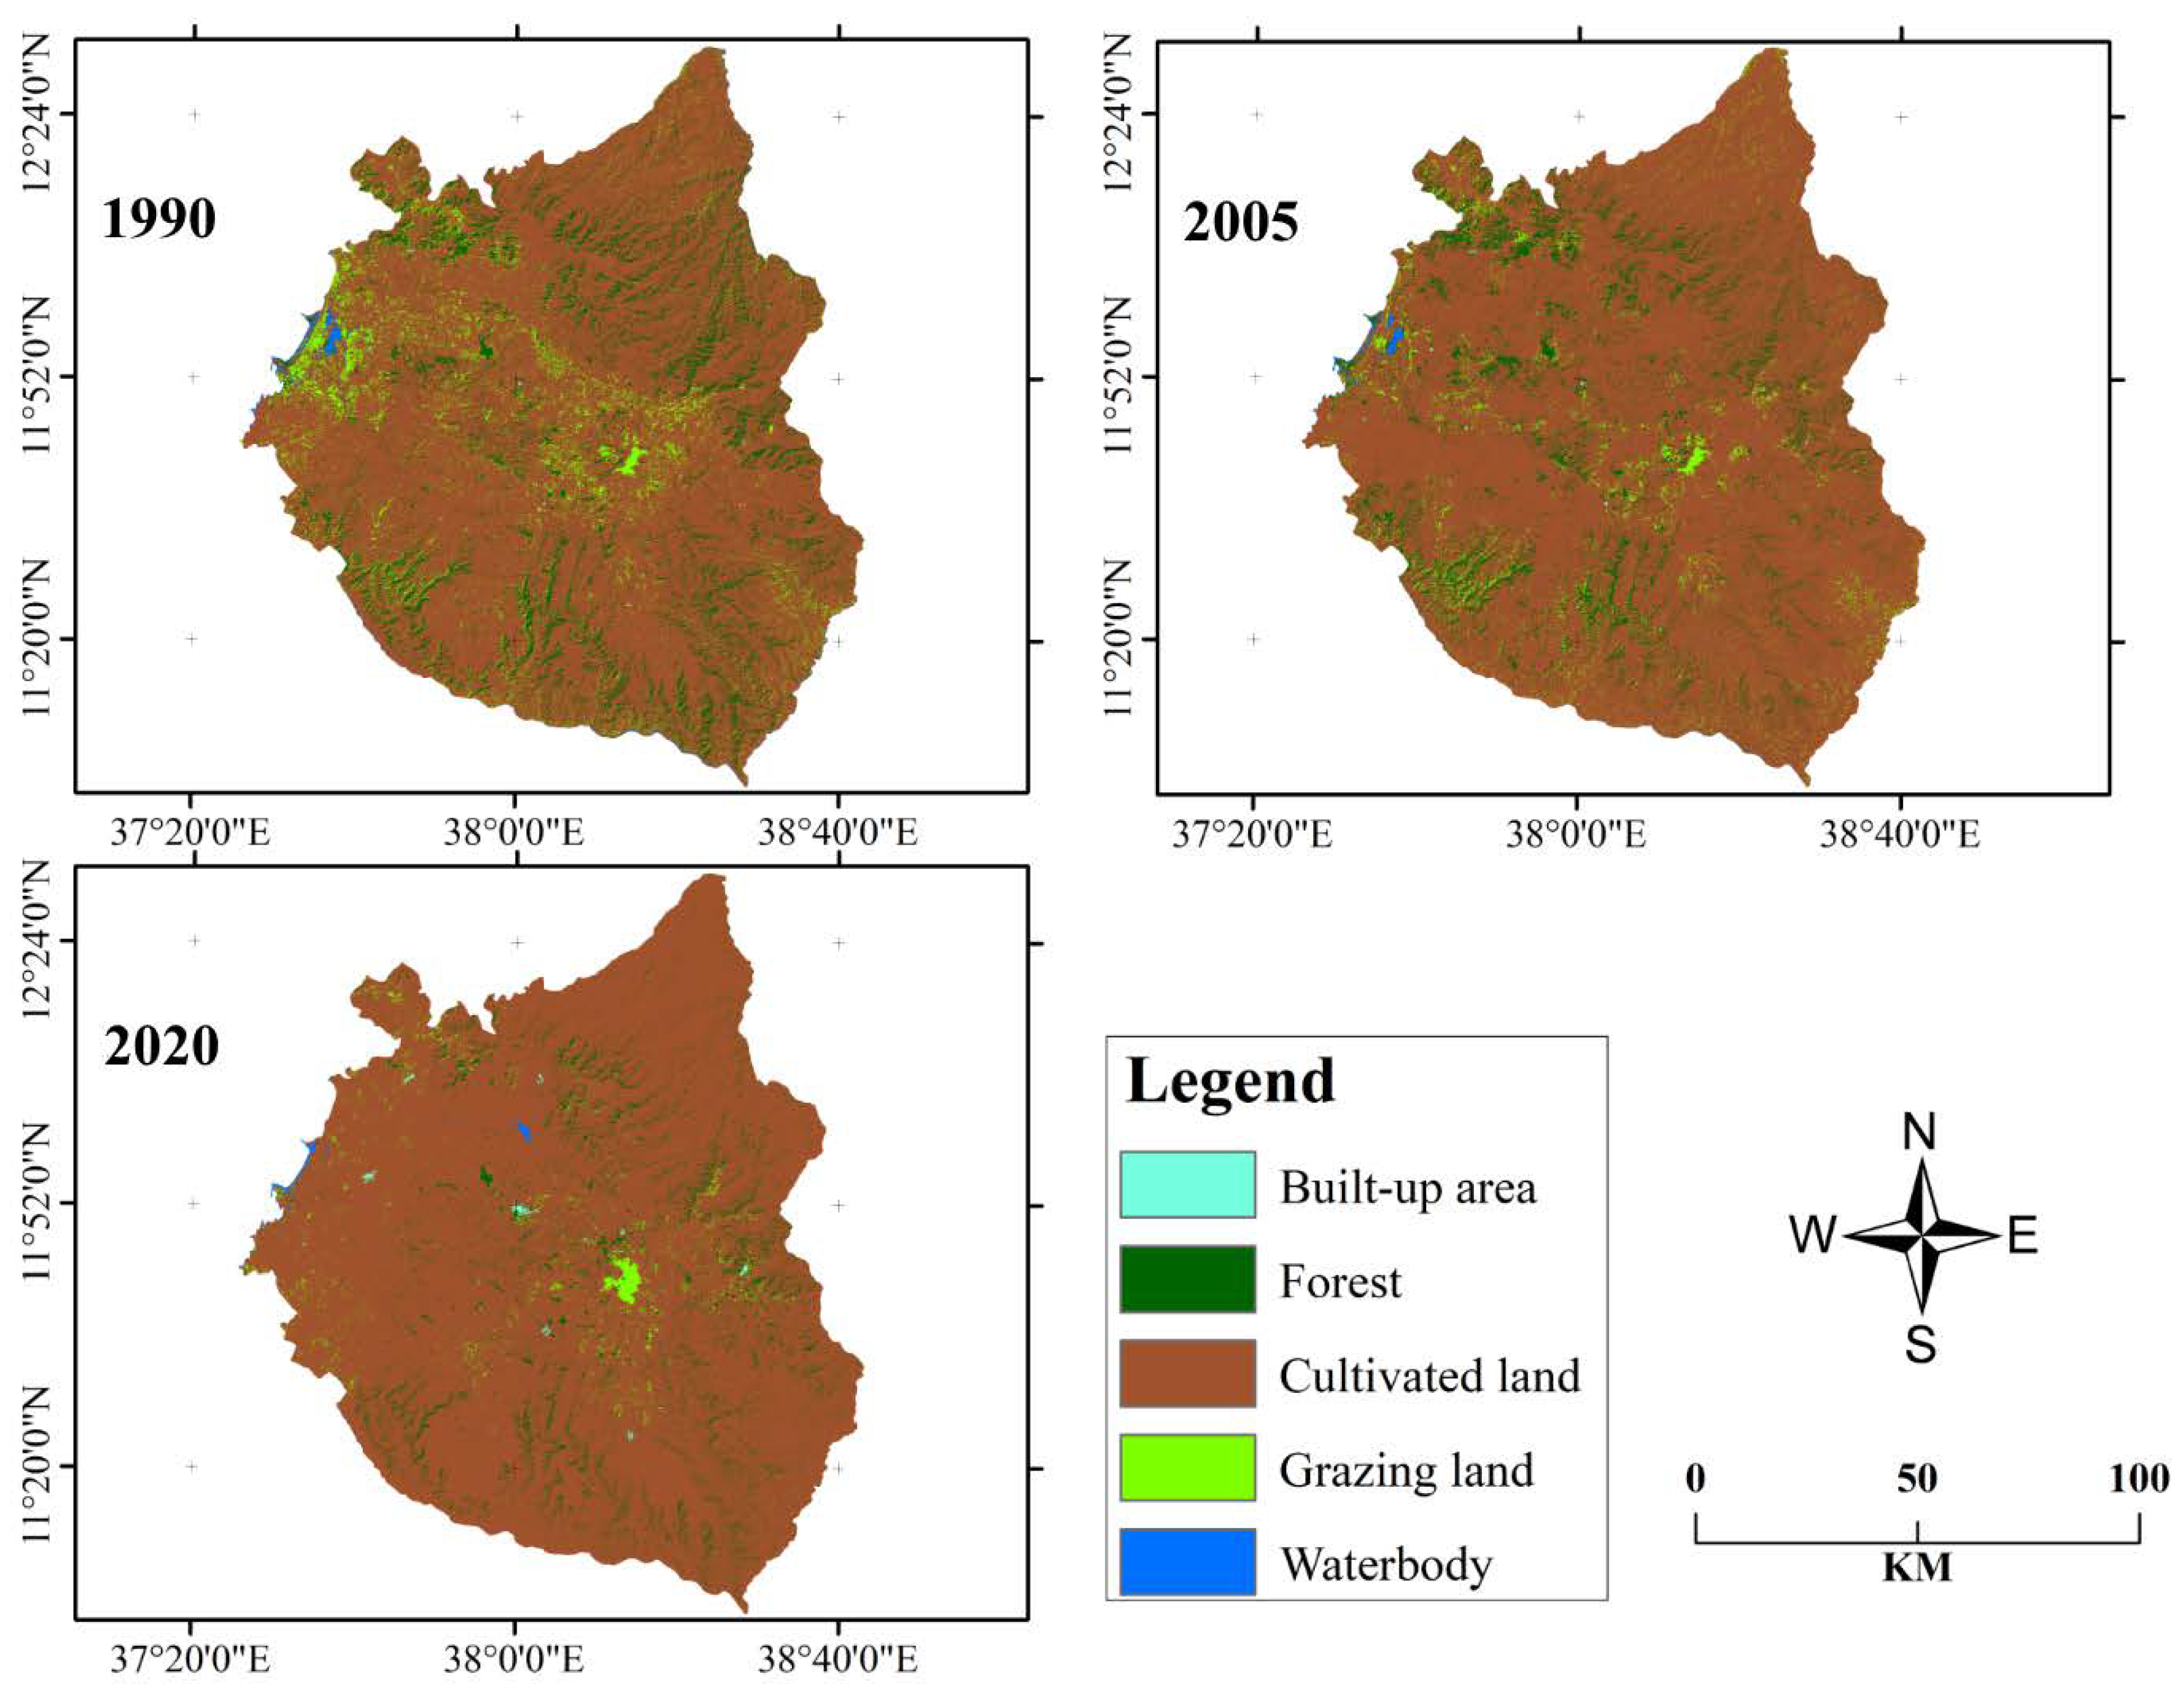
3.1. Land Use/Land Cover Changes

The accuracy assessment result shows the overall kappa coefficients of 0.97, 0.95, and 0.98 and overall accuracies of 98.1%, 96%, and 97.6% for the years 1990, 2005, and 2020, respectively. The accuracy result confirmed that there is high agreement between GCP and the real land use/cover (Table S2). The results reveal that there have been considerable land use and land cover changes in the last three decades (1990–2020) in the South Gondar zone. The result indicates most of the areas are covered by agricultural land (93.07%), which confirms the livelihood of the zonal community largely depends on agricultural activities. The expansion of cultivated land at the expense of other land use types is greater. Among the different LULC types, cultivated land covered areas of 83.33% (1,171,999.44 ha), 87.68% (1,233,130.32 ha), and 93.07% (1,308,910.74 ha), followed by forest covers of 10.63% (149,435 ha), 8.82% (124,015.5 ha), and 5.21% (73,293.91 ha) in the years 1990, 2005, and 2020, respectively (Table 2). This result shows that cultivated land increased by 10% in the last three decades, which is a very fast change as compared with other land use types. However, there are significant declines in forest cover by half, which are 10.63% in 1990 and 5.21% in 2020. The same is true for the grazing land use, which decreased from 5.7% in 1990 to 1.4% in 2020 (Table 2). The change in the land use and land cover in the study area was attributed to the expansion of cultivated land from 83.33% in 1999 to 93.1% in 2020.
Table 3 shows that during the past 30 years, the majority of the study area has seen a continuous change in land use and land cover. The changes were observed mainly on cultivated, forest, and grazing land cover. The rate of change in cultivated land between 2005 and 2020 is greater as compared with 1990 and 2005. However, the forest cover change was greater from 1990 to 2005 than from 2005 to 2020. The reason is that the government owned most of the forests in that period. Since 1991, with the downfall of the Derge regime, the people have aggressively cleared a significant amount of forest cover [15]). During the last 30 years, 91,423.2 ha (6.5%) of forest land was changed into agricultural land. Therefore, the forest cover of the study area decreased by 5.4% during this period (Table 2). Similarly, the grazing land cover also dramatically decreased by 4.22%, as the land use changed into cultivated land use by 3% (Table 2 and Table 3).
Built-up areas have been growing as the population grows at an alarming rate. The increase in built-up areas from 0.01% in 1990 to 0.13% in 2020 indicates the demand for residential areas and food. This created a concomitant pressure for cultivated land expansion at the expense of depleting untapped resources. The growing demand for agricultural land and built-up areas is decreasing the amount and size of forest cover and grazing land throughout the zone (Figure 2).

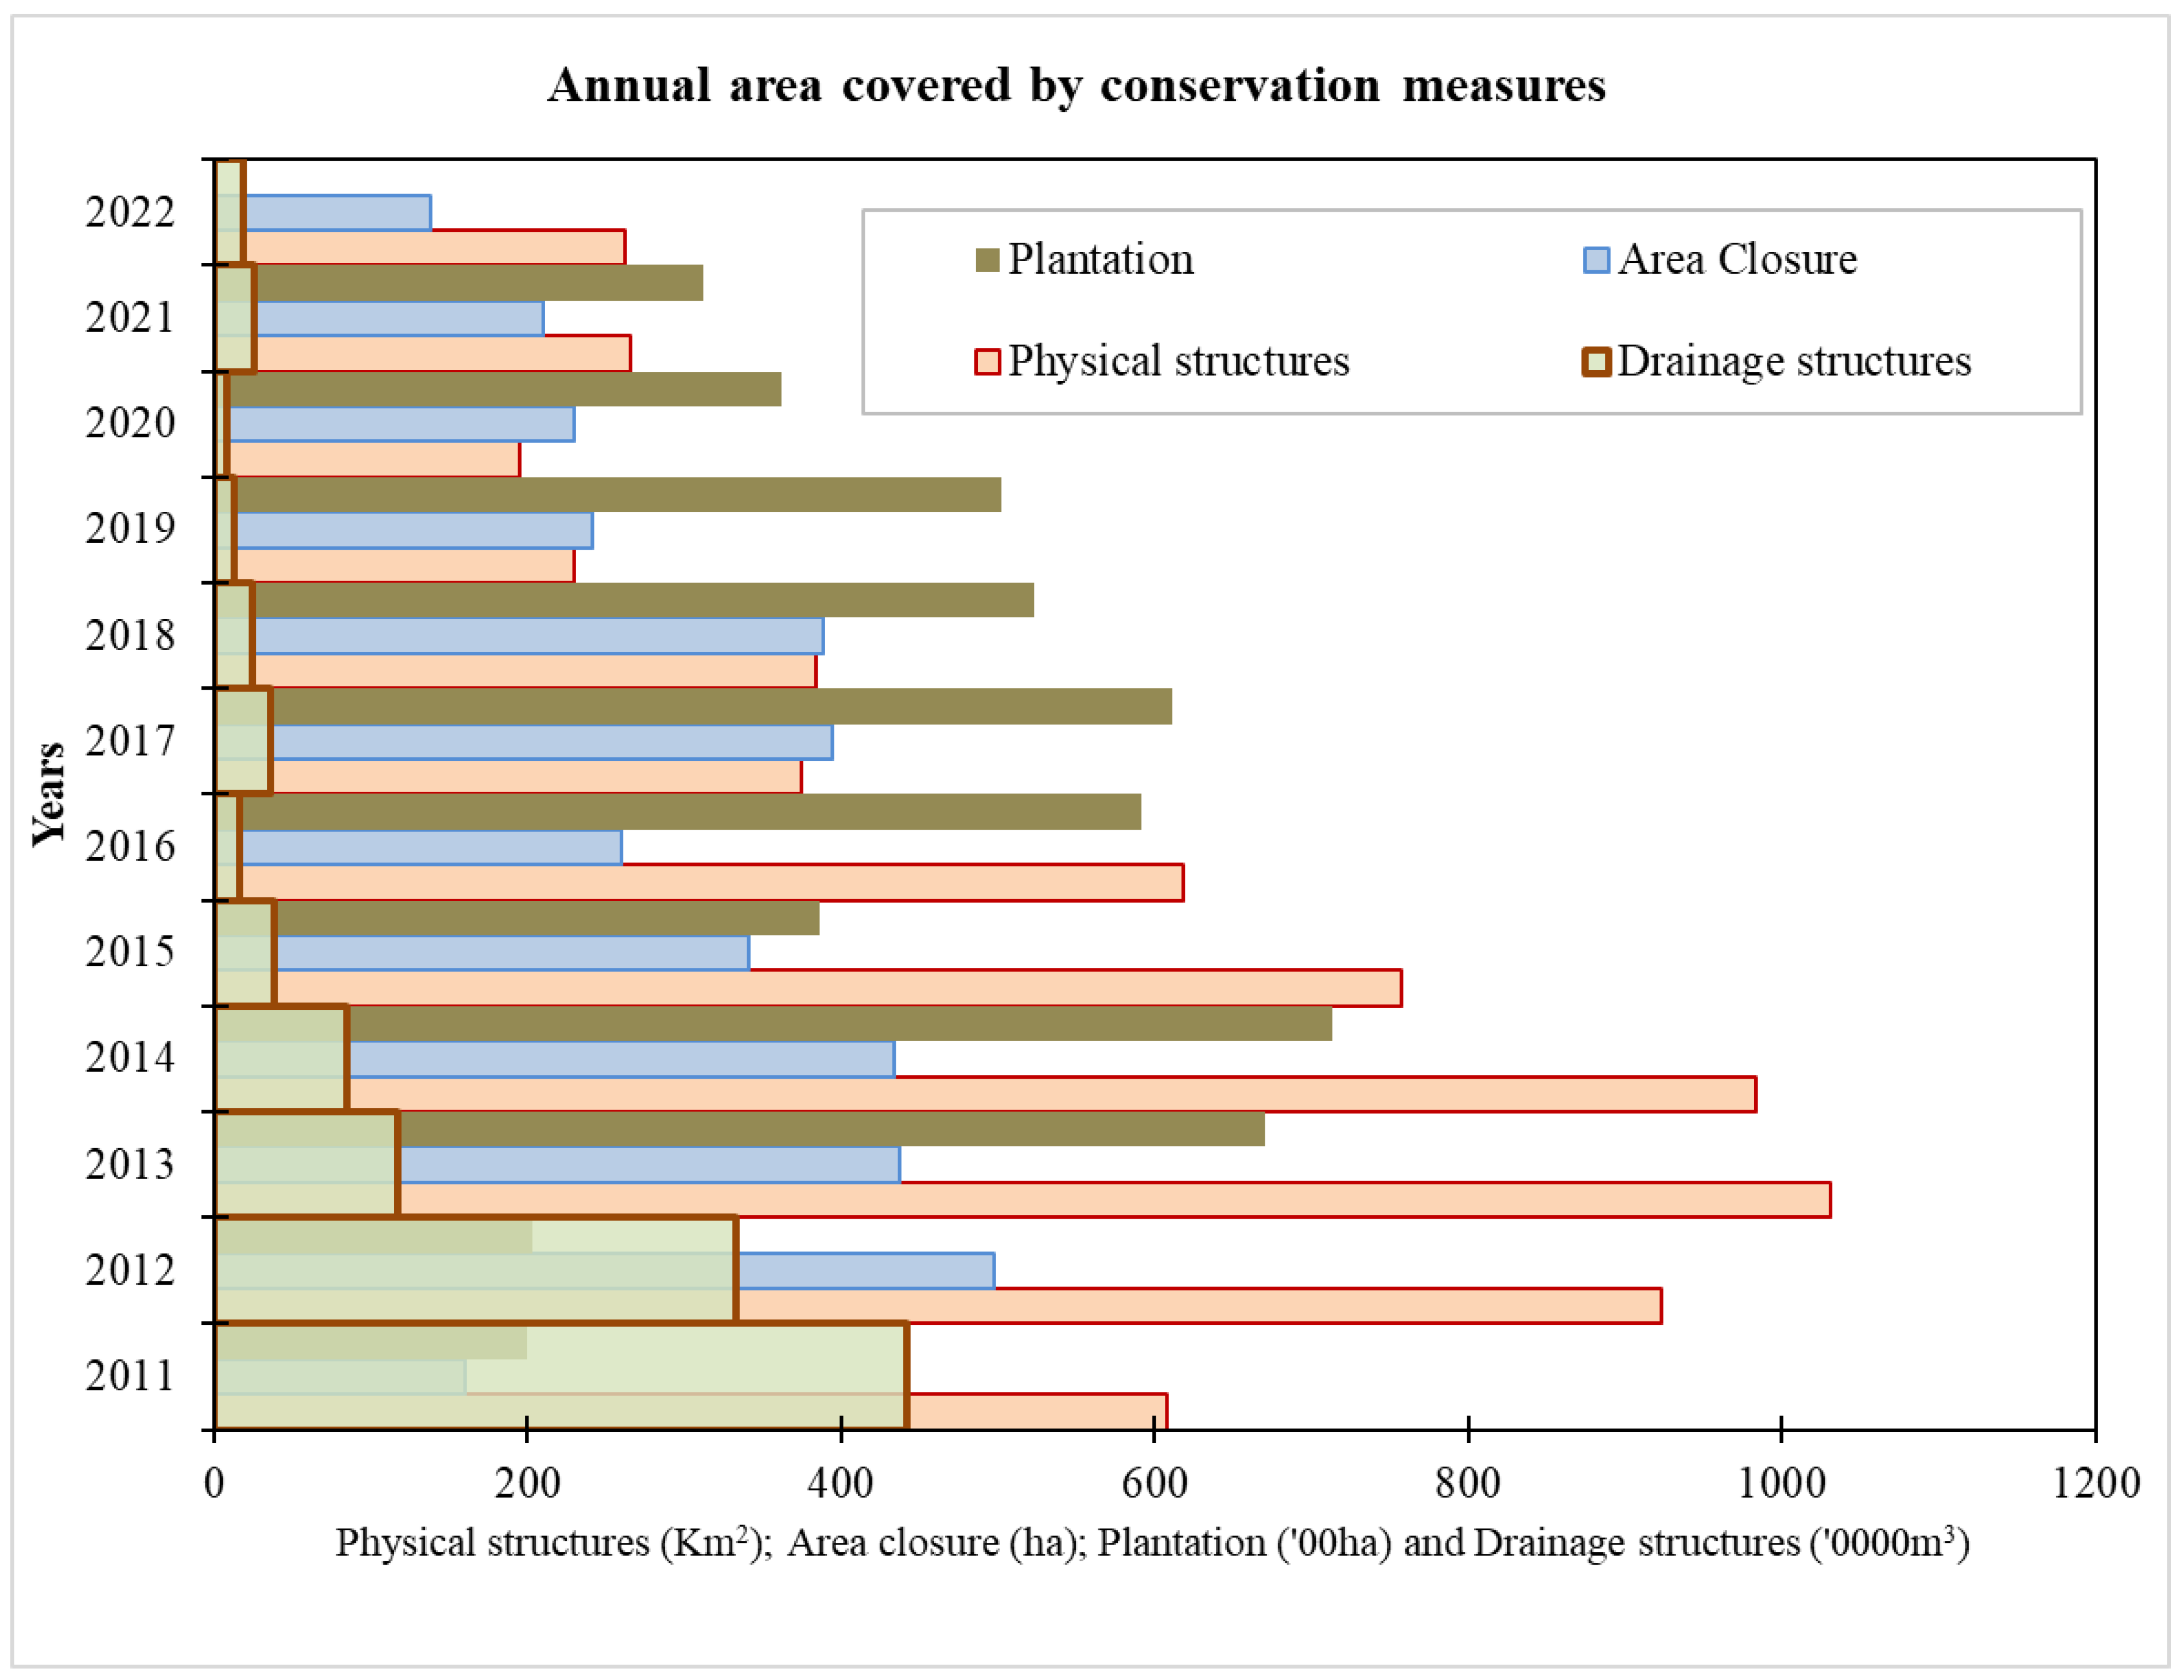
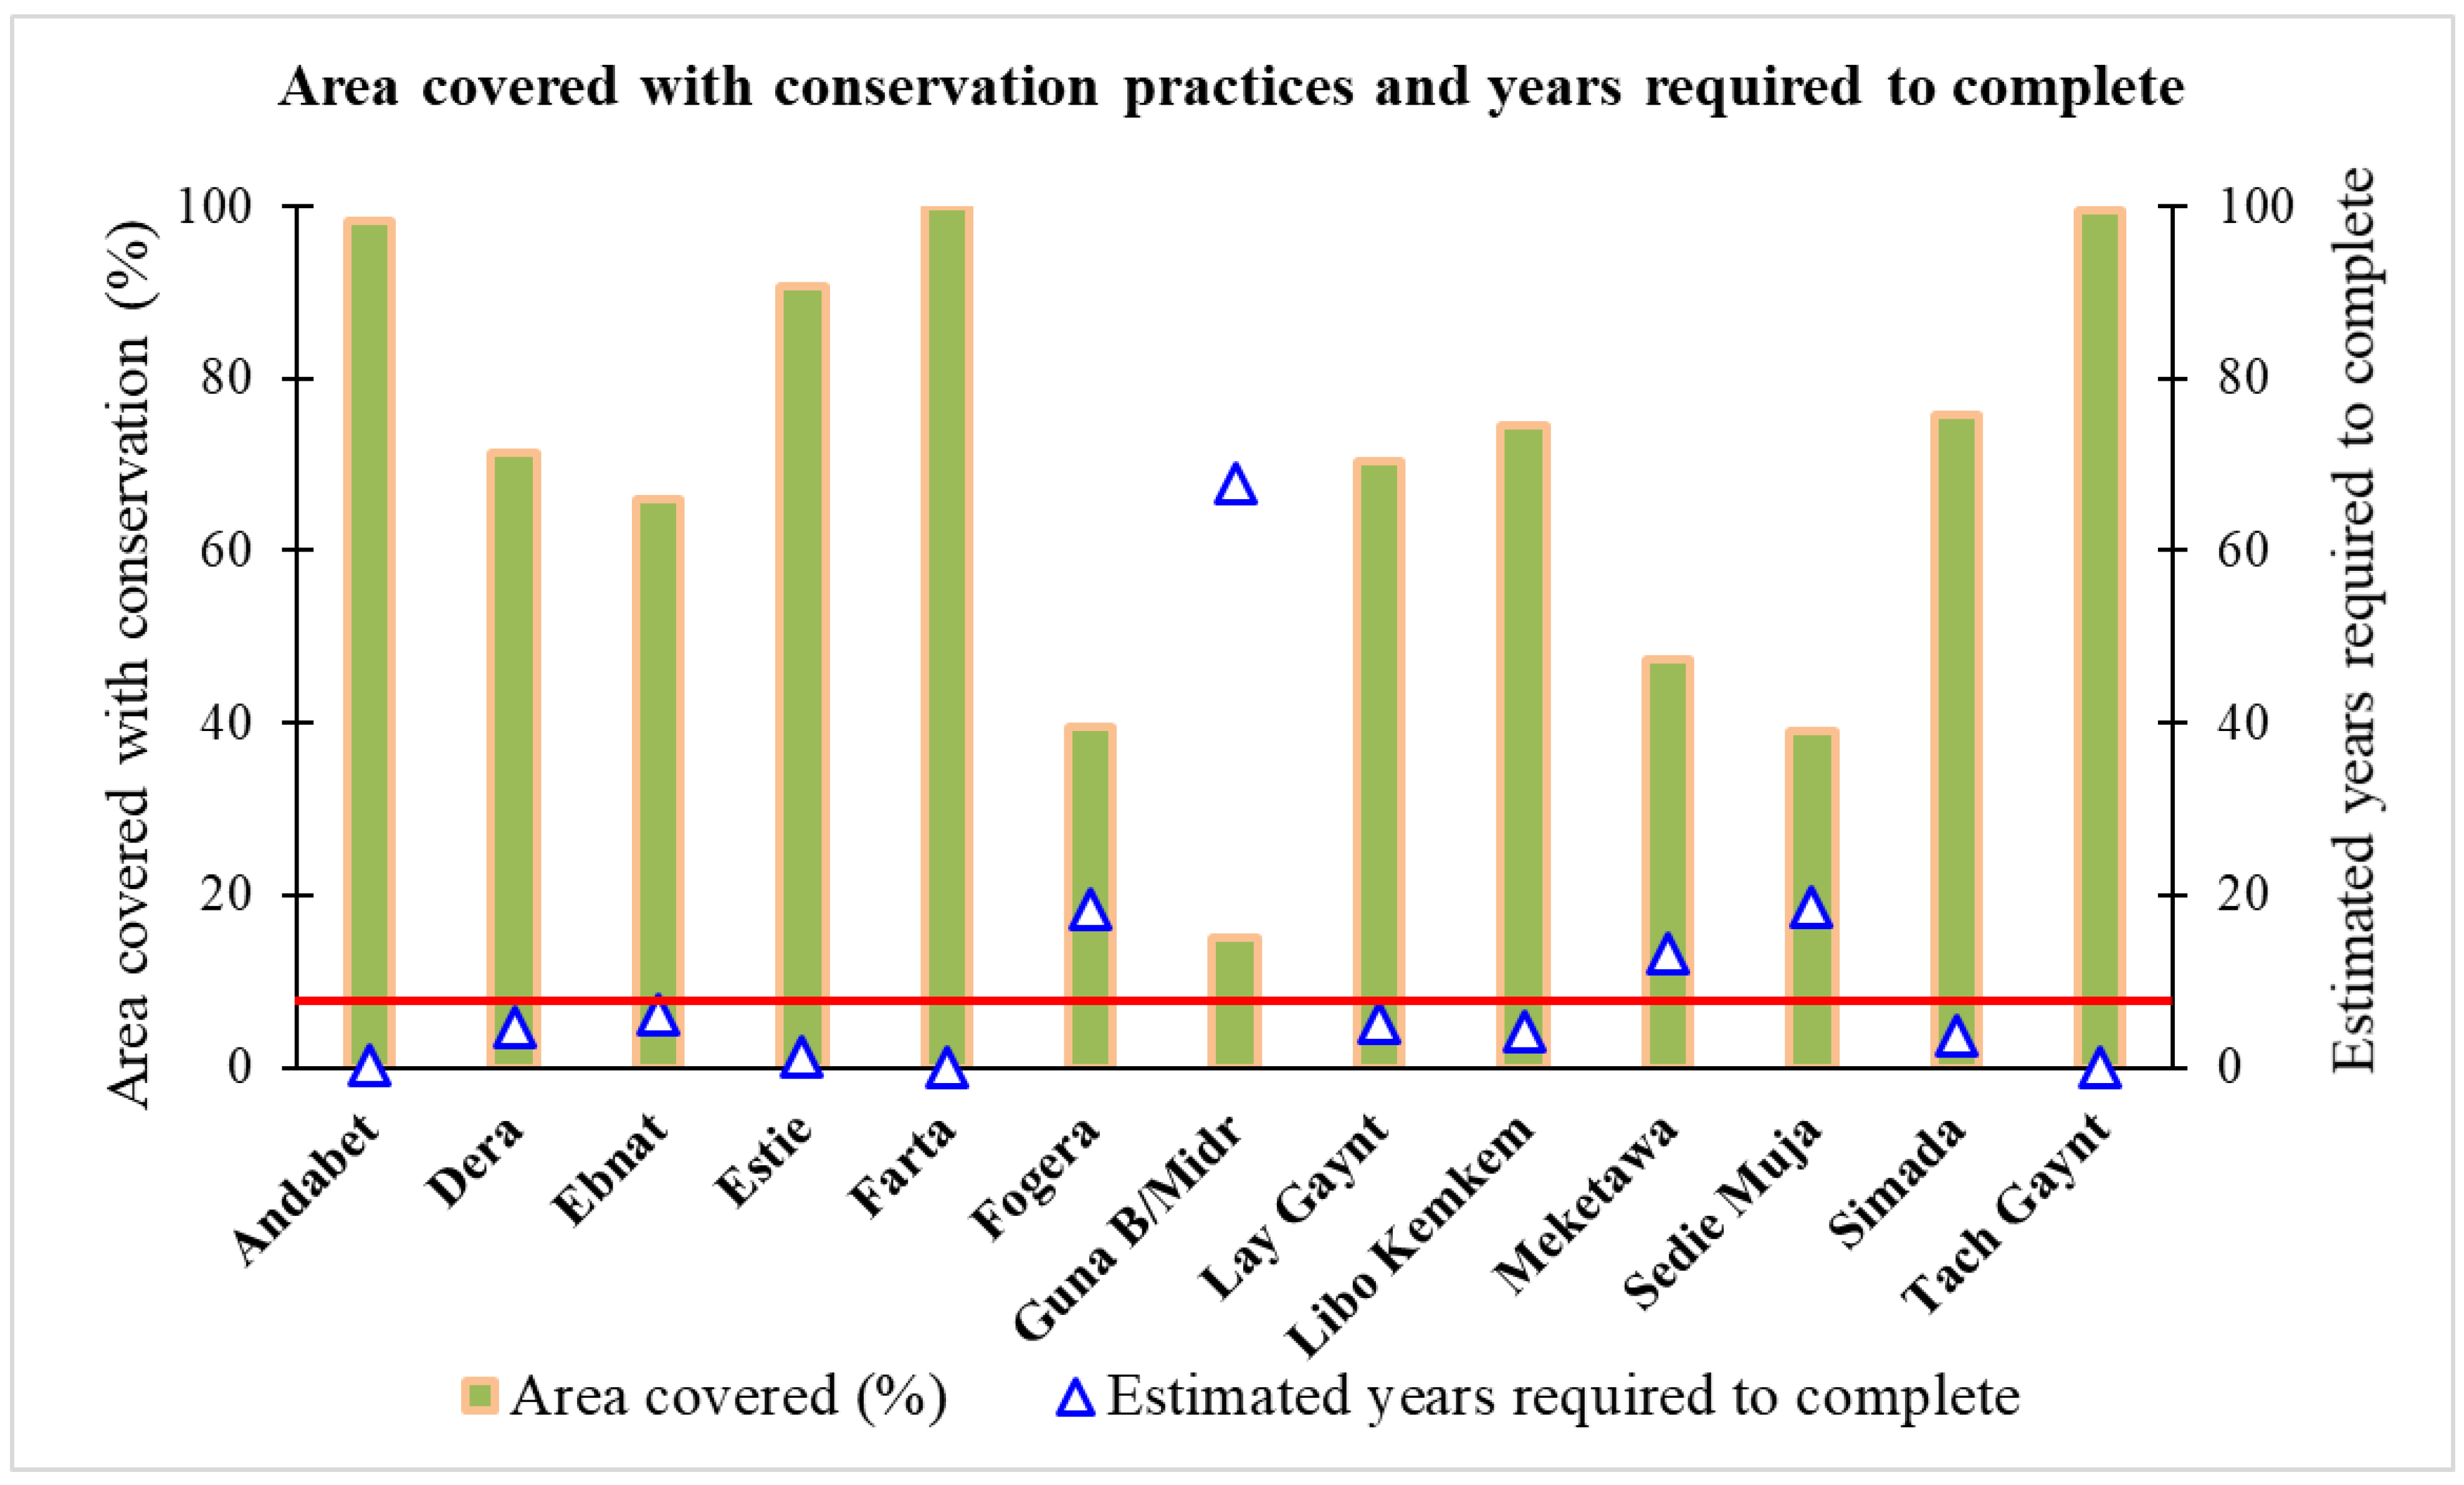
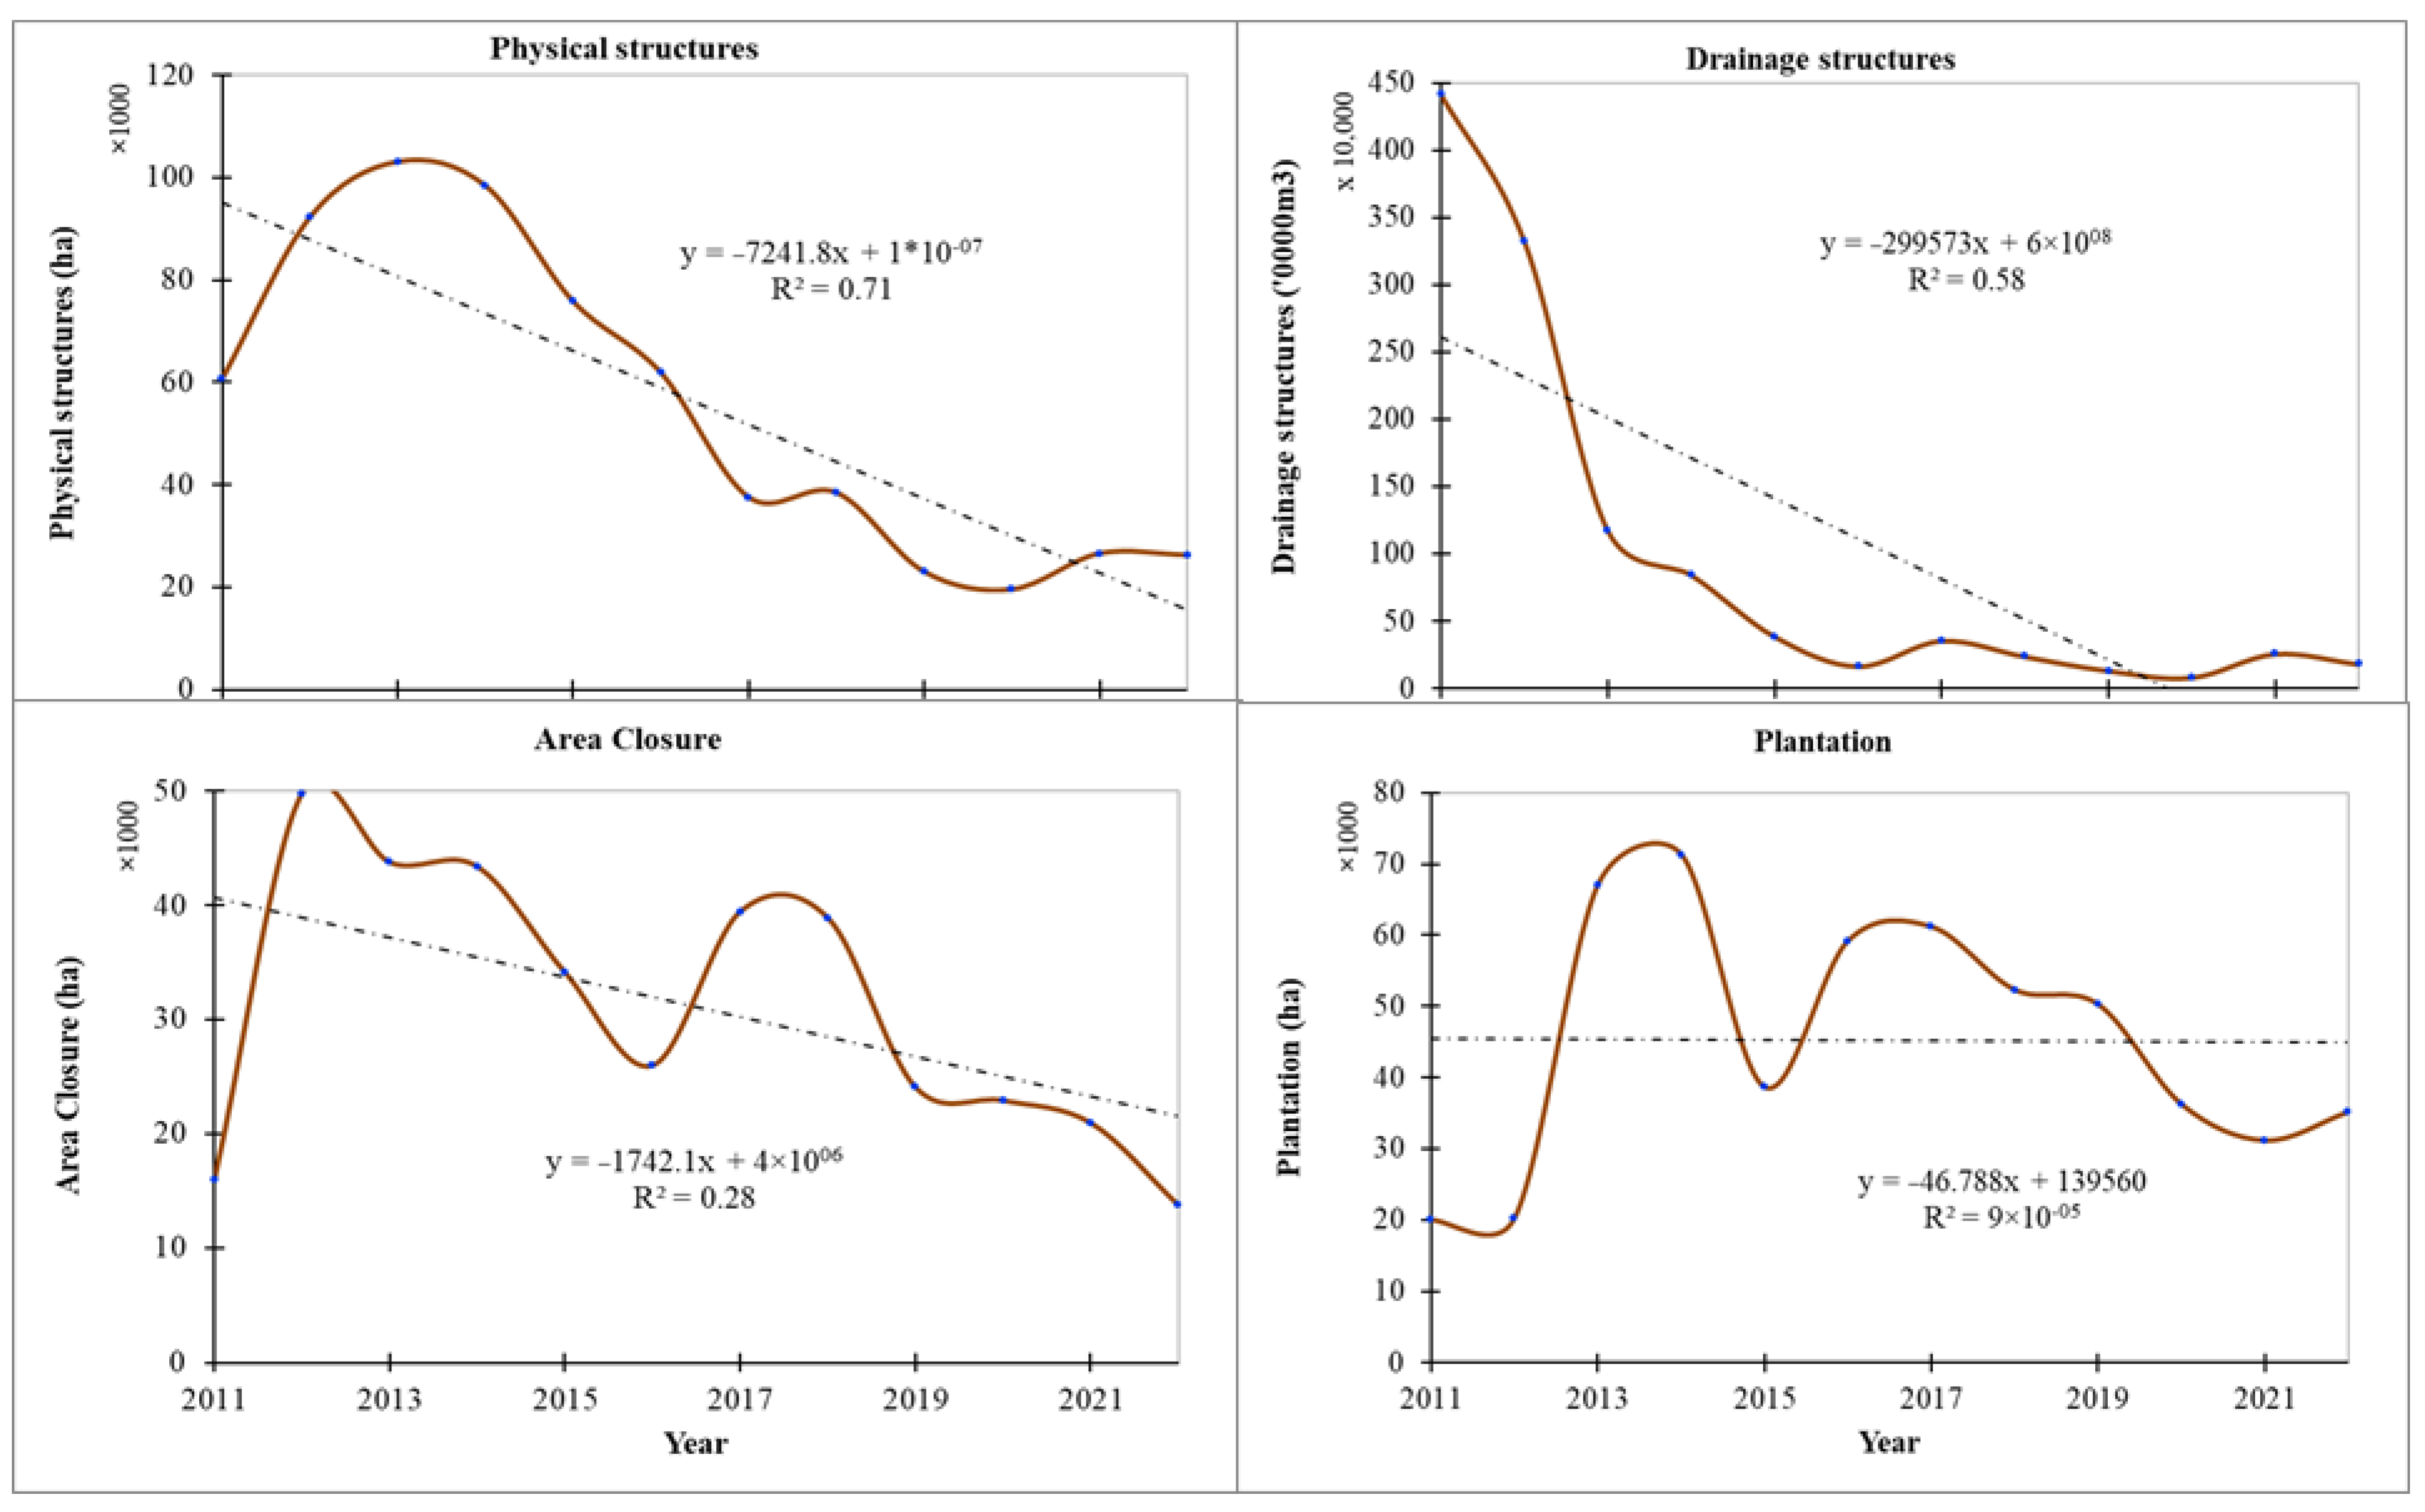
3.2. Biophysical Conservation Practices

Biophysical soil and water conservation practices have been implemented in the Amhara regional state, including the South Gondar zone (SGZ), to rehabilitate degraded areas. This study presents efforts made to treat degraded areas from 2011 to 2022. Annually, these conservation practices are implemented from January to March through large-scale government-sponsored campaigns. Conservation practices can be grouped into three major categories: (1) physical structures (bunds, terraces, gully rehabilitation, and drainage structures, including cut-off drains and waterways); (2) area closures; and (3) plantations. The implementation of these practices depends on the level of landscape degradation and available resources. For example, cut-off drains and waterways can be constructed in farmlands, hillsides, and homesteads. In addition, bench terraces may be implemented on cultivated fields or on hillslopes with deep soil.
As indicated in Table 4 and Figure 3, different biophysical measures were implemented, including soil and stone bunds; hillside and bench terraces; cutoff drains and waterways; soil moisture structures such as trenches, infiltration ditches, and others; gully rehabilitation; area closures; and plantations. The total number of these structures implemented per year is indicated in Table 4. In general, 685 thousand ha of physical structures; 13.5 thousand m3 of drainage lines; 386 thousand ha of area closure; and 587.6 thousand ha of area are covered with plantation, using 2.5 billion seedlings (excluding 2022 plantation). Of the physical structures, more than 80% are bunds. Bunds could be soil, stone, or stone-faced soil depending on the availability of the resource. The majority of these are soil bunds.
The magnitude of implementing these conservation measures varies from one district to the other. This is linked with the experts’ inspiration to mobilize the community during the campaign. Figure 4 shows the total area of the districts covered by biophysical conservation measures. Some of the districts, such as Meketawa, Guna B/Midr, and Sedie Muja, are newly established districts showing a limited effort, whereas Fogera is an old district with low coverage that may be related to its plain landscape. Farmers in this area build on-plot moisture conservation structures for rice production. However, the Farta district completely covers its land mass with conservation measures. In addition, Tach Gayint, Andabet, and Estie left about 10% of the land to be covered with conservation measures (Figure 4).

4. Discussion

4.1. Linking LULC with Biophysical Conservation Efforts

Natural and anthropogenic LULC change has a significant impact and characterizes the level of land degradation. The type and distribution of surface cover affects surface runoff and sedimentation in the watershed [17]. Poor surface cover results in high soil erosion due to a quick response to rainfall. Biophysical soil and water conservation measures are linked with the type of land use and land cover in the area. For example, bunds are constructed on cultivated fields based on the available soil or rock resources. Hillside terraces are built on bushes and shrub land with medium soil depth; bench terraces are constructed on soils that are about 50 cm deep and hillslopes planned for cultivated land. Drainage structures are built on any land use type affected by upstream runoff. Gully control practices are implemented on land uses that are prone to gully erosion. The level of degradation in the land use reflects the suitable intervention proposed in the area. Biophysical conservation measures cover 73 percent of the zone’s total land mass. Cultivated land accounts for 93 percent of the land use in the zone and is proportional to the magnitude of bunds constructed. Bund construction covers approximately 80% of cultivated fields (Table 4). A significant number of hillside terraces has been constructed along the contour, as a majority of the districts are characterized by steep slopes [18], except Fogera and Libo Kemkem. Lastly, meager bench terraces have been implemented in areas with thicker soil. Current land use may be suited for a certain conservation measure. Regrettably, the type of conservation measure has changed over time due to changes in land use. Over time, conservation planners have been challenged with this dilemma. This could be demonstrated by the predicted years required to cover the district’s landscape with biophysical measures (Figure 4). For example, 61 percent of districts require fewer than five years to completely cover their landscape. However, as the land use system has changed, this may no longer be the case. Cultivated lands gradually expanded from gently sloping land into steeper slopes in the highlands with the subsequent clearing of forests and other vegetation. Despite this, the Watershed Development Guidelines advise against building stone bunds on slopes steeper than 35%; instead, terraces and bunds are built on hillslopes [19]. This finding is in agreement with the findings of Tsegaye [20], who state that land degradation, particularly soil erosion, was exacerbated by the influence of land use and land cover change because of agricultural land expansion on accessible steep slopes of forest, shrub, and grazing land.
Plantation is one of the biophysical measures where seedlings are planted on degraded areas, physical structures, and homesteads. The purpose of plantation as a conservation measure is sought in two ways. The planted materials reinforce constructed physical structures to prevent soil erosion and tree roots bind soil particles in situ. The study result shows biological measures cover approximately 92% of the bunds. However, it is challenging to find a bund covered with vegetation on the ground from each district for evidence. Reinforcing bunds with planation has the capacity to reduce runoff in cultivated fields by 49 percent [21]. According to Teshome [22], the profitability of SWC structures is greater for bunds with grasses than bunds without grasses. Integrated management of land resources requires both physical structures and multipurpose plantations for sustainable use of the resource. Furthermore, the plantation contributes to the area’s forest cover. Forest coverage discrepancy was observed between the zonal report and satellite images. For example, the forest cover reported by the zone in 2020 is about 12 percent, whereas using the satellite images in the same year, it is only 5.1 percent. The reason may be the satellite images include artificial forests such as Eucalyptus at individual farm fields. Eucalyptus is a multipurpose fast-growing tree and has greater socio-economic benefits. Zonal experts define forest as two meters height, 20 percent canopy, and half a hectare of area coverage. More than 587 thousand hectares of land has been covered with more than 2.5 billion seedlings in the last eleven years, except 2022. This suggests that the area that the forest covers is expanding faster than before. However, as indicated in Figure 3, the rate of plantation is decreasing gradually, and the land cover expansion was not found as expected due to poor survival rate of seedlings, prolonged dry season, water scarcity, and unsustainable management of plantations [23,24,25]. Forest cover increased in some areas after watershed management programs launched in 2011 along with the establishment of eucalyptus plantations [26]. Farmers shift from cultivated land use to artificial forest land based on the income difference from crop and tree. This has a positive impact on the forest cover dynamics in the area. However, the overall trend of the forest cover is still declining over time, coupled with the increasing demand for firewood, construction, and other services [26,27,28].
Area closure is a land use practice essential to restore degraded areas, replace open grazing by a cut-and-carry system, and increase the source of income from the sale of grass and forest products [29]. The practice is difficult because it contradicts the widely used free grazing. Areas selected for closure are usually communal lands used for livestock grazing. The shortage of grazing land discourages the local people from practicing area closure. The free-grazing animals graze on crop residues, especially after crop harvest, and grazing lands, bushes, and shrub land. The free-grazing practice damages the land resources, and the livestock may destroy naturally regenerated and artificially planted seedlings. The advantage of practicing area closure is that it requires limited investment as compared with the other biophysical measures. However, the sustainability of the area closures can only be guaranteed if and only if the community has taken full responsibility for protection [30].

4.2. Trends of Conservation Measures

In the South Gondar zone, about 73% of the landscape is treated with biophysical conservation measures (Table 4). During the large-scale SWC campaign, between 2011 and 2016, large areas of cultivated fields were covered with bunds (Figure 4). Relatively, the investment on hillslopes and area closures in this period was also enormous. After 2016, the implementation of physical structures began to decrease, whereas the construction of area enclosures continued steadily in 2017 and 2018 (Figure 4). Table 5 and Figure 5 show the results of Mann–Kendall test and Sen Slope estimator for the four conservation measures, with statistical significance at the 5% level with increasing or decreasing trends. According to the Mann–Kendall trend test, a significant decreasing trend was observed from physical structures, drainage structures, and area closures (for the Sen Slope estimator, the same significant negative trend was detected). Plantation shows a negative non-significant decreasing trend (p < 0.05). The major reason for the decrement may be related to the limited participation of the community in physical structures, and experts focused on enclosures. In addition, as explained in Section 4.1, both natural and man-made factors contribute to its gradual reduction. The decreasing trend may also be more related with maintaining existing ones than constructing new structures. A maintenance report is not included in this study, though it is part of the annual action plan in some districts. According to Addisie and Molla [31] in the Gumara watershed, the local people are reluctant to participate in conservation campaigns, unlike in previous times. The reason is the success rate of efforts were below expectation, as farmers always hope to see immediate results [32]. Furthermore, zonal natural resource management experts explain that some of the farmers would prefer to stay on their farm fields rather than participate in watersheds outside their vicinity. This led to a decrease in the number of participating workers and area covered with conservation measures. The trend of plantation shows a decreasing trend; however, it is not a significant decrease (Figure 5). This could be related to the government’s ambitious tree-planting target, which is a green legacy initiative that started in 2019 [33].
The sustainability of rehabilitation practices is fundamental and shall be taken in to account throughout the implementation period, particularly at the end of all efforts [34,35]. This could be achieved by incorporating maintenance as a planning element. As observed at selected fields, there is meager implementation of maintenance. Maintenance is an overlooked area of implementation [31]. Therefore, each district must continue to engage in maintenance in order for efforts to be used sustainability. A lack of maintenance activities for the installed conservation measures makes the land degradation problem worse, despite factors such as inadequate quality standards for installed physical structures [35,36] and poor livestock management systems that cause physical structures to be destroyed [37].

5. Conclusions

Evaluating the trends of biophysical soil and water conservation measures in relation to dynamic land use and land cover change is critical for the sustainable use of natural resources. Ethiopia has been implementing SWC practices on a watershed scale for the last five decades. However, the program maintains its current course, devoting vast amounts of both human and financial capital. As land use and land cover change affects the areas covered by specific controlling mechanisms, the implemented practices have yet to be completed. Data from satellite images and official reports show a discrepancy in the findings of the study. The study is intended to produce baseline information that helps conservation planners to monitor and evaluate real-time conditions in biophysical conservation measures, as well as changing land use and land cover in the future. The coverage of biophysical conservation measures in the majority of the districts in the zone indicates better achievement. However, the trend was significantly decreasing. The landscape experiences rapid land use and land cover change, hence it will require more structures in the future. Plantation was implemented at a larger scale, though it is unable to attribute it to the sustainability of physical soil, water conservation practices, and climate change anomalies. The findings of this study will contribute to developing interventions in the manner in which future watershed development programs are planned in response to sustainable natural resource management. Finally, the research recommends that, despite considerable investments in biophysical erosion control measures, integrated management efforts should be maintained.

Supplementary Materials

The following supporting information can be downloaded at: https://www.mdpi.com/article/10.3390/land11122187/s1, Table S1: Types of sensor used, acquisition date and percent cloud cover; Table S2: Land use classes and accuracy assessment results (1999–2020).

Author Contributions

M.B.A. and G.M. conceptualization, data analyses, and writing and editing the draft; M.T. and G.T.A. reviewing and editing; M.B.A., G.M., M.T. and G.T.A. writing and reviewing and editing the methodology; G.M. mapping. All authors have read and agreed to the published version of the manuscript.

Funding

Gebiaw T. Ayele covered the APC and received funding from Griffith Graduate Research School, the Australian Rivers Institute and School of Engineering, Griffith University, Queensland, Australia.

Data Availability Statement

All the data are presented in tables and figures in the manuscript.

Acknowledgments

Gebiaw T. Ayele acknowledges Griffith Graduate Research School, the Australian Rivers Institute and School of Engineering, Griffith University, Queensland, Australia.

Conflicts of Interest

The authors declare no conflict of interest.

References

  1. Berry, L. Land Degradation in Ethiopia: Its Extent and Impact; Commissioned by the GM with WB Support; 2003; pp. 2–7. Available online: https://rmportal.net/library/content/frame/land-degradation-case-studies-03-ethiopia/at_download/file (accessed on 1 November 2022).
  2. Yitbarek, T.; Belliethathan, S.; Stringer, L. The onsite cost of gully erosion and cost-benefit of gully rehabilitation: A case study in Ethiopia. Land Degrad. Dev. 2012, 23, 157–166. [Google Scholar] [CrossRef]
  3. Erkossa, T.; Wudneh, A.; Desalegn, B.; Taye, G. Linking soil erosion to on-site financial cost: Lessons from watersheds in the Blue Nile basin. Solid Earth 2015, 6, 765–774. [Google Scholar] [CrossRef] [Green Version]
  4. Sop, T.; Oldeland., J. Local perceptions of woody vegetation dynamics in the context of a ‘greening Sahel’: A case study from Burkina Faso. Land Degrad. Dev. 2013, 24, 511–527. [Google Scholar] [CrossRef]
  5. Meshesha, D.T.; Tsunekawa, A.; Tsubo, M.; Ali, S.A.; Haregeweyn, N. Land-use change and its socio-environmental impact in Eastern Ethiopia’s highland. Reg. Environ. Chang. 2014, 14, 757–768. [Google Scholar] [CrossRef]
  6. Pech, S.; Sunada, K. Population growth and natural resources pressures in the Mekong River Basin. AMBIO A J. Hum. Environ. Stud. 2008, 37, 219–224. [Google Scholar] [CrossRef]
  7. Desalegn, T.; Cruz, F.; Kindu, M.; Turrión, M.; Gonzalo, J. Land-use/land-cover (LULC) change and socioeconomic conditions of local community in the central highlands of Ethiopia. Int. J. Sustain. Dev. World 2014, 21, 406–413. [Google Scholar] [CrossRef]
  8. Yesuf, H.M.; Assen, M.; Alamirew, T.; Melesse, A.M. Modeling of sediment yield in Maybar gauged watershed using SWAT, northeast Ethiopia. Catena 2015, 127, 191–205. [Google Scholar] [CrossRef]
  9. Teshome, A.; Halefom, A. Mapping of soil erosion hotspot areas using GIS based-MCDA techniques in South Gondar Zone, Amhara Region, Ethiopia. World News Nat. Sci. 2019, 24, 218–238. [Google Scholar]
  10. Selassie, Y.G. Problems, efforts and future directions of natural resources management in western amhara region of the Blue Nile basin, Ethiopia. In Social and Ecological System Dynamics; Springer: Berlin/Heidelberg, Germany, 2017; pp. 597–613. [Google Scholar]
  11. Hurni, H. Degradation and conservation of the resources in the Ethiopian highlands. Mt. Res. Dev. 1988, 123–130. [Google Scholar] [CrossRef]
  12. Grunder, M. Soil conservation research in Ethiopia. Mt. Res. Dev. 1988, 8, 145–151. [Google Scholar] [CrossRef]
  13. Herweg, K.; Ludi, E. The performance of selected soil and water conservation measures-case studies from Ethiopia and Eritrea. Catena 1999, 36, 99–114. [Google Scholar] [CrossRef]
  14. Guzman, C.D.; Zimale, F.A.; Tebebu, T.Y.; Bayabil, H.K.; Tilahun, S.A.; Yitaferu, B.; Rientjes, T.H.; Steenhuis, T.S. Modeling discharge and sediment concentrations after landscape interventions in a humid monsoon climate: The Anjeni watershed in the highlands of Ethiopia. Hydrol. Process. 2017, 31, 1239–1257. [Google Scholar] [CrossRef]
  15. Kindu, M.; Schneider, T.; Teketay, D.; Knoke, T. Land use/land cover change analysis using object-based classification approach in Munessa-Shashemene landscape of the Ethiopian highlands. Remote Sens. 2013, 5, 2411–2435. [Google Scholar] [CrossRef] [Green Version]
  16. Sen, P.K. Estimates of the regression coefficient based on Kendall’s tau. J. Am. Stat. Assoc. 1968, 63, 1379–1389. [Google Scholar] [CrossRef]
  17. Alkharabsheh, M.M.; Alexandridis, T.; Bilas, G.; Misopolinos, N.; Silleos, N. Impact of land cover change on soil erosion hazard in northern Jordan using remote sensing and GIS. Procedia. Environ. Sci. 2013, 19, 912–921. [Google Scholar] [CrossRef] [Green Version]
  18. Deng, C.; Zhang, G.; Liu, Y.; Nie, X.; Li, Z.; Liu, J.; Zhu, D. Advantages and disadvantages of terracing: A comprehensive review. Int. Soil Water Conserv. Res. 2021, 9, 344–359. [Google Scholar] [CrossRef]
  19. Desta, L.; Carucci, V.; Wendem-Agenehu, A.; Abebe, Y. Community Based Participatory Watershed Development; A Guideline; Ministry of Agriculture and Rural Development: Addis Ababa, Ethiopia, 2005. [Google Scholar]
  20. Tsegaye, B. Effect of land use and land cover changes on soil erosion in Ethiopia. Int. J. Agric. Sci. 2019, 5, 26–34. [Google Scholar]
  21. Sultan, D.; Tsunekawa, A.; Haregeweyn, N.; Adgo, E.; Tsubo, M.; Meshesha, D.T.; Masunaga, T.; Aklog, D.; Ebabu, K. Analyzing the runoff response to soil and water conservation measures in a tropical humid Ethiopian highland. Phys. Geogr. 2017, 38, 423–447. [Google Scholar] [CrossRef]
  22. Teshome, A.; Rolker, D.; de Graaff, J. Financial viability of soil and water conservation technologies in northwestern Ethiopian highlands. Appl. Geogr. 2013, 37, 139–149. [Google Scholar] [CrossRef]
  23. Petros, W.; Tesfahunegn, G.B.; Berihu, M.; Meinderts, J. Effectiveness of water-saving techniques on growth performance of mango (Mangifera indica L.) seedlings in Mihitsab-Azmati watershed, Rama Area, northern Ethiopia. Agric. Water Manag. 2021, 243, 106476. [Google Scholar] [CrossRef]
  24. Abrha, G.; Hintsa, S.; Gebremedhin, G. Screening of tree seedling survival rate under field condition in Tanqua Abergelle and Weri-Leke Weredas, Tigray, Ethiopia. J. Hortic. For. 2020, 12, 20–26. [Google Scholar] [CrossRef] [Green Version]
  25. Demisachew, T.; Awdenegest, M.; Mihret, D. Impact evaluation on survival of tree seedling using selected in situ rainwater harvesting methods in Gerduba Watershed, Borana Zone, Ethiopia. J. Hortic. For. 2018, 10, 43–51. [Google Scholar] [CrossRef]
  26. Alemayehu, A.; Melka, Y. small-scale eucalyptus cultivation and its socio-economic impacts in ethiopia: A review of practices and conditions. Trees For. People 2022, 8, 100269. [Google Scholar] [CrossRef]
  27. Hailu, A.; Mammo, S.; Kidane, M. Dynamics of land use, land cover change trend and its drivers in Jimma Geneti District, Western Ethiopia. Land Use Policy 2020, 99, 105011. [Google Scholar] [CrossRef]
  28. Alemu, B.; Garedew, E.; Eshetu, Z.; Kassa, H. Land use and land cover changes and associated driving forces in north western lowlands of Ethiopia. Int. Res. J. Agric. Sci. Soil Sci. 2015, 5, 28–44. [Google Scholar]
  29. Aerts, R.; Nyssen, J.; Haile, M. On the difference between “exclosures” and “enclosures” in ecology and the environment. J. Arid Environ. 2009, 73, 762. [Google Scholar] [CrossRef] [Green Version]
  30. Mulugeta, G.; Achenef, A. Socio-economic challenges of area exclosure practices: A case of Gonder Zuria Woreda, Amhara region, Ethiopia. J. Nat. Sci. Res. 2015, 5, 123–132. [Google Scholar]
  31. Addisie, M.B.; Molla, G. Trends of community-based interventions on sustainable watershed development in the Ethiopian highlands, the Gumara watershed. Sustain. Water Resour. Manag. 2021, 7, 87. [Google Scholar] [CrossRef]
  32. Mekuriaw, A.; Heinimann, A.; Zeleke, G.; Hurni, H. Factors influencing the adoption of physical soil and water conservation practices in the Ethiopian highlands. Int. Soil Water Conserv. Res. 2018, 6, 23–30. [Google Scholar] [CrossRef]
  33. Jalleta, A.K. The Legal Protection of Forests: Ethiopian Green Legacy vs. International Environmental Regimes. Beijing Law Rev. 2021, 12, 725. [Google Scholar] [CrossRef]
  34. Pretty, J.N.; Shah, P. Making soil and water conservation sustainable: From coercion and control to partnerships and participation. Land Degrad. Dev. 1997, 8, 39–58. [Google Scholar] [CrossRef]
  35. Mitiku, H.; Herweg, K.G.; Stillhardt, B. Sustainable Land Management: A New Approach to Soil and Water Conservation in Ethiopia. Land Resources Management and Environmental Protection Department Mekelle University, Ethiopia, and Centre for Development and Environment (CDE), Swiss National Centre of Competence in Research (NCCR) North-South University of Bern, Switzerland. 2006. Available online: https://boris.unibe.ch/19217/1/e308_slm_teachingbook_complete.pdf (accessed on 1 November 2022).
  36. Addisie, M.B.; Langendoen, E.J.; Aynalem, D.W.; Ayele, G.K.; Tilahun, S.A.; Schmitter, P.; Mekuria, W.; Moges, M.M.; Steenhuis, T.S. Assessment of practices for controlling shallow valley-bottom gullies in the sub-Humid Ethiopian Highlands. Water 2018, 10, 389. [Google Scholar] [CrossRef] [Green Version]
  37. Belachew, A.; Mekuria, W.; Nachimuthu, K. Factors influencing adoption of soil and water conservation practices in the northwest Ethiopian highlands. Int. Soil Water Conserv. Res. 2020, 8, 80–89. [Google Scholar] [CrossRef]
Figure 1. Location map of the study area.
Land 11 02187 g001
Figure 2. LULC map of South Gondar zone for the years 1990, 2005, and 2020.
Land 11 02187 g002
Figure 3. Annual biophysical conservation measures over the twelve-year period in the zone.
Land 11 02187 g003
Figure 4. Area covered with biophysical conservation measures (%) at each district in the SGZ and years required to complete the remaining area. The pink color line indicates districts requiring fewer than 5 years.
Land 11 02187 g004
Figure 5. Trends of biophysical conservation measures over twelve years using the Mann–Kendall trend test graph and the regression. The dot lines are trend lines or lines of best fit indicating the general direction of points.
Land 11 02187 g005
Table 1. Description of land use and land cover types in the study area.
LULC TypesGeneral Description
Water bodyIt consists of both natural and artificial water features such as streams, lakes, canals, ponds, and reservoirs.
ForestAreas covered by both mixed trees and natural and plantation forests
Cultivated landAreas of land prepared for growing agricultural crops. This category includes areas currently under crop and land under preparation.
Grazing landAll areas of bare lands, natural grass, and small shrubs mixed with grass used for grazing purpose.
Built-up AreasUrban areas and permanent residential areas of varied patterns, for example, cities, towns, villages, and strip developments along highways
Table 2. The extent of area covered with the five land use types (1990–2020).
LULC Types199020052020
Area (ha)(%)Area (ha)(%)Area (ha)(%)
Water Body5347.980.382881.710.202255.240.16
Forest149,435.8210.63124,015.58.8273,293.915.21
Cultivated Land1,171,999.4483.331,233,130.3287.681,308,910.7493.07
Grazing Land79,434.635.6546,143.723.2820,153.051.43
Built-Up Areas191.790.01238.410.021796.720.13
Total1,406,405.131001,406,405.131,406,405.131,406,405.13100
Table 3. Change in land use and land cover from 1990 to 2005, 2005 to 2020, and 1990 to 2020.
2005
LULC ClassesWater Body%Forest %Cultivated %Grazing Land %Built-Up %Total (ha)%
1990Water26460.278.0302572.70.251.100053480.4
Forest 119.4070,281.1578,408.95.6624.801.60149,43611
Cultivated 77.3052,861.83.81,096,7307822,2521.673.801,171,99583
Grazing38.90789.840.155,383.93.923,2151.77.2079,434.65.6
Built-up004.77030.2010155.80191.80
2020
2005Water745.50.176.501924.20.183.90002830.10.2
Forest387.7031,588.82.290,804.96.51617.70.11550124,554.18.9
Cultivated1078.40.141,008.72.91,174,20083.514,955.21.11430.60.11,232,672.987.6
Grazing 29.90612.4041,952.533488.30.226.5046,109.63.3
Built-up000.4047.705.80184.60238.40
2020
1990Water745.50.176.501924.20.183.90002830.10.2
Forest387.7031,588.82.290,804.96.51617.70.11550124,554.18.9
Cultivated10780.141,008.72.91,174,20083.514,955.21.11430.601,232,672.987.6
Grazing29.90612.4041,952.533488.30.226.5046,109.63.3
Built-up000.4047.705.760184.60238.410
Table 4. Types of biophysical conservation measures implemented in the SGZ from 2011 to 2022.
SNActivitiesUnit (‘000)Year
201120122013201420152016201720182019202020212022
1BundsHa51.465.774.678.867.254.531.632.620.316.721.920.5
2Hillside terr.Ha6.015.715.29.85.15.43.64.62.31.83.62.6
3Bench terraceHa0.00.00.00.00.10.00.10.20.10.00.12.3
4Moisture cons. Ha2.710.012.99.32.10.60.60.60.00.80.70.6
5Gully rehab.Ha0.70.90.40.61.21.31.50.40.20.20.30.2
6Cut of drainsm3 3.92.60.70.60.20.10.20.10.10.00.20.1
7Waterwaysm3 0.50.80.50.30.20.10.20.10.10.00.10.1
8Area closureHa16.049.843.843.434.126.039.438.924.122.921.013.8
9Plantation Ha20.020.367.071.338.659.261.152.350.236.231.20.0
Table 5. Mann–Kendall trend and Sen Slope test summary results.
Series\TestKendall’s Taup-ValueSen Slope
Physical structures (ha)−0.6360.005−7465.550
Drainage structures (‘0000 m3)−0.7270.001−147,084.386
Area closure (ha)−0.5760.011−2682.763
Plantation (ha)−0.1520.537−1762.672
Alpha = 0.05
Publisher’s Note: MDPI stays neutral with regard to jurisdictional claims in published maps and institutional affiliations.

