Article

Evaluation of Mehlich-3 as a Multi-Element Extractant of Micronutrients and Sulfur in a Soil–Ryegrass System Amended with Varying Biochar Rates from Two Feedstocks

by
Joao Arthur Antonangelo
1,*,
Joao Luis Bigatao Souza
2,
Andrew Whitaker
2,
Brian Arnall
2 and
Hailin Zhang
2
1
Department of Agriculture, Austin Peay State University, Clarksville, TN 37044, USA
2
Department of Plant and Soil Sciences, Oklahoma State University, Stillwater, OK 74078, USA
*
Author to whom correspondence should be addressed.
Land 2022, 11(11), 1979; https://doi.org/10.3390/land11111979
Submission received: 11 October 2022 / Revised: 27 October 2022 / Accepted: 2 November 2022 / Published: 4 November 2022
(This article belongs to the Section Soil-Sediment-Water Systems)

Abstract

:
Mehlich-3 (M-3) is used as a universal nutrient extractant due to its ability to simultaneously extract multiple elements. This study aimed to assess M-3 for the simultaneous determination of plant-available zinc (Zn), copper (Cu), iron (Fe), manganese (Mn), boron (B), and sulfate (SO4-S) in a soil amended with switchgrass- (SGB) and poultry litter-derived biochars (PLB), which were used to vary soil pH values (5.7–7.6) and organic carbon (OC) content (2.0–5.5%) in the short-term. Soil and ryegrass (Lolium perenne) were sampled from a growth chamber experiment and analyzed for plant-available and tissue phosphorus (P), potassium (K), calcium (Ca), magnesium (Mg), micronutrients (B, Cu, Fe, Mn, and Zn), and sulfur contents. The commonly accepted extractants diethylenetriaminepentaacetic acid (DTPA), for micronutrients, and 0.008 M monocalcium phosphate (MCP), for SO4-S, were used for the evaluation. Relationships between M-3 and DTPA were not reliable for micronutrient availability, although highly significant relationships for Zn and Cu were found. However, M-3-extractable S was highly correlated with S contents in ryegrass tissues regardless of the treatments and provided a 1:1 relationship between MCP and M-3. This offers the potential to eliminate MCP by simply adding S determination after extraction with M-3. Although this research evaluated the d-index for an easier linear relationship between the traditional and proposed methods, more research using several soil samples is needed to establish models and find conversion equations for micronutrients and SO4-S between DTPA-sorbitol, MCP, and M-3.

1. Introduction

Micronutrients, including boron (B), copper (Cu), zinc (Zn), iron (Fe), and manganese (Mn), are essential for plant growth, although they are needed in minute quantities [1,2]. The availability of micronutrients in soils varies depending on parent materials, soil pH, and organic matter [3,4]. Sulfur (S) is also an essential nutrient for plant growth; however, it is utilized by plants in relatively large amounts, as much as phosphorus (P) [3]. Organic S accounts for the majority of soil S from partially decomposed organic matter and is unavailable for plant uptake without further decomposition. Hence, the availability of inorganic sulfate is highly affected by soil pH, moisture, and temperature. To date, there is still no single multi-element method to estimate both plant-available macro- and micronutrients.
Numerous extractants, including reducing agents, neutral salts, acids, and chelating agents, such as diethylenetriaminepentaacetic acid (DTPA) [5] and Mehlich-3 (M-3) [6], have been used to estimate the available content of macro- and micronutrients in soils. The M-3 method has been widely used to extract plant-available phosphorus (P), calcium (Ca), magnesium (Mg), and potassium (K). DTPA is commonly used for micronutrient extraction, B is either extracted with hot water or DTPA-sorbitol, and sulfate-S is typically determined by 0.008 M monocalcium phosphate (MCP) extraction. Those are considered “standard” (traditional) methods, but it takes several extractions for the same sample. It would be economical and efficient if there were a universal extractant to cover all these major plant nutrients, diminishing the amount of labor and reagents in soil labs. Some laboratories use M-3 for both micro- and macronutrients without adequate evaluation. This can either over- or under-recommend fertilizers because the nutrient recommendations were based on the individual methods mentioned earlier. In addition, several studies have shown contrasting results. Schmisek et al. [7] extracted Zn, Cu, Fe, and Mn from 100 neutral-to-alkaline soils from the Northern Great Plains using M-3 and DTPA and found that M-3 was correlated with DTPA-extractable Zn and Cu but weakly correlated with DTPA-extractable Fe and Mn. However, correlations between M-3- and DTPA-extractable Zn, Cu, Fe, and Mn were significant on acid and non-acid soils separately, but they were not significant when both soils were combined [8]. Thus, the extractability of Zn, Cu, and Fe was significantly affected by soil pH, organic matter content, and cation exchange capacity (CEC) [8]. In a study by Monterroso et al. [9], significantly higher concentrations of Zn, Fe, and Cu were extracted with M-3 than DTPA in mine soils with a wide pH range.
Vidal Vazquez et al. [10] found that M-3 extracted lower Zn, Cu, and Fe concentrations than DTPA from soil without compost additions but extracted more micronutrients than DTPA from compost-amended soil. Wang et al. [11] reported that soil-extractable Zn and Cu were highly correlated between M-3 and DTPA in a range of acid-to-alkaline soil pH, but Fe and Mn were less correlated. For pH < 6.5 soils, high correlations were found between the methods for extractable Fe and Mn; therefore, the DTPA test method could be used to extract plant-available Zn, Cu, Fe, and Mn in acid soils [11]. Brennan et al. [12] found significant correlations between concentrations of Zn and Cu extracted by the two methods (M-3 and DTPA), and both extractants had the same ability to predict herbage Zn and Cu content.
Zbiral and Nemec [13] found linear relationships between DTPA-sorbitol and M-3-extractable B and reported that M-3 can be used to determine soil-exchangeable B without modification. However, Redd et al. [14] observed no significant correlation between M-3-extractable B and alfalfa yield in a field experiment; thus, they concluded that M-3 could not be used as a universal extractant to include B. Although several contrasting papers have reported the relationship between M-3 and DTPA for micronutrient extraction, the relationship between M-3 and DTPA-sorbitol has not yet been documented.
The 0.008 M monocalcium phosphate (MCP) extractant ([Ca(H2PO4)2.H2O]) is the most commonly used by many laboratories to estimate available sulfate (SO4-S) [15]. Rao and Sharma [16] and Matula [17] evaluated M-3-extractable SO4-S in comparison with MCP in acid soils (pH 4.2–6.3) and observed a significant correlation between extractable SO4-S from those extractants. Unfortunately, the relationship between M-3 and MCP for the extraction of SO4-S in a circumneutral pH range of soils has not been documented. Besides the need to correlate the different extraction methods for calibration purposes, the validation of the extraction methods by relating soil exchangeable nutrients with their concentration in plant tissue is lacking. Thus, this research is unique, as it fills the knowledge gap that arises due to the lacking “plant” factor (shoots and root nutrient concentrations), in addition to trying to establish a universal extraction method for plant essential nutrients in soils presenting a reasonable and practicable range of OC and pH. This is of interest to public and commercial laboratories and crop consultants since two traditional extraction methods, one for micronutrients and another for S, can be replaced by a single extraction method (M3) that is already widely used to predict macronutrient availability, such as P, K, Ca, and Mg. The objectives of this study were to evaluate (i) M-3 as a universal soil extractant to include plant-available micronutrients (B, Cu, Fe, Mn, Mo, and Zn) and SO4-S; (ii) the relationship between nutrients extracted with M-3, DTPA-sorbitol, and MCP; and (iii) the relationship between extractants with nutrient contents in the tissues of perennial ryegrass growing in soil containing a wide range of pH and OC due to biochar additions from different feedstocks, switchgrasses, and poultry litters.

2. Materials and Methods

2.1. Biochar Preparation and Characterization

A description of biochars production can be found in [18]. The biochars studied were derived from switchgrass and poultry litter. Switchgrass (SG; Panicum virgatum) was harvested from an established field at Clemson University Pee Dee Research and Education Center in Darlington County, SC. The switchgrass was hammer-milled to an approximately 6 mm particle size. The moisture content of milled switchgrass before pyrolysis was measured to be 6.45 ± 0.21 wt%. Poultry litter was collected from the top 5.0–7.5 cm depth at 10 locations in a commercial poultry house in Orangeburg County, SC. Poultry litter was ground (Wiley Mill equipped) to 2 mm particle size and oven-dried overnight at 105 °C. The moisture content of PL was determined to be 6.49%. Switchgrass- and poultry litter-derived biochars (SGB and PLB, respectively) were produced at 700 °C using slow pyrolysis. The feedstock samples were pyrolyzed as follows: 1 h equilibration held at 200 °C under an industrial-grade N2 flowrate at 15 L min−1; the temperature was increased to the desired temperature within 1 h at 8.33 °C min−1. The maximum temperature (700 °C) was held for 2 h under N2 flow at 1 L min−1. The samples were cooled down to 100 °C (4.25 °C min−1). The resulting biochars were allowed to cool to room temperature in an inert atmosphere of N2 [19]. Biochar coarse materials were ground with a mortar and pestle gently before being sieved through a 1 mm sieve for further analyses and 0.25 mm for the potting experiment, as described in [18]. The physicochemical properties of biochars are shown in Table 1.

2.2. Potting Experiment

Ryegrass was grown in biochar-amended soils in an environmentally controlled growth chamber using a potting experiment [20]. Plastic pots were filled with 1200 g of 2 mm sieved soils and amended with 0.0 (control), 0.5, 1.0, 2.0, and 4.0% (w/w) 0.25 mm-sieved SGB and PLB. The increased rates of applied biochars ensured the proportional nutrients would increase, as well as a wide range of other soil chemical properties such as OC and pH. The biochar-amended soils were incubated for ~30 days at 75% of field capacity before ryegrass seeds were sown in each pot at 30 kg ha−1 (assuming ~80% germination). The grass grew from 8 April 2018 (planting) to 22 June 2018 (harvesting) in a growth chamber using a completely randomized design with three replications (n = 3). Pots were rotated weekly to eliminate spatial variability in the chamber. The humidity was kept in a range of 75 to 95%. The temperature was set at 20 °C for the first 2 weeks; in the following weeks, daily conditions were switched to 14 °C with 14 h of light to simulate daytime and 10 °C with 10 h of dark to simulate nighttime. Daytime and nighttime simulations continued until harvest. On 3 May 2018, each pot was supplied with the same amount of N based on soil test results for grass production, subtracting N supplied by biochars. Since biochars provided adequate P and K, only the control received additional P and K. After harvesting plants, the shoots and roots were separated, washed with deionized water, oven-dried to a constant weight at 105 °C, and their weight was recorded. Dried plant materials were ground using a mechanical grinder for further analyses.

2.3. Soil Sampling and Analyses

The soil used for this potting experiment was collected with a shovel (0–15 cm) from a residential yard near chat piles located in Picher, Ottawa County, Oklahoma. The sampling area is located on an EPA superfund site and is known to be contaminated with heavy metals and/or micronutrients, which makes it ideal soil for micronutrient extraction studies and biochar addition as a soil amendment. The collected soil samples were homogenized, air-dried for 1 week, sieved with a 10 mm screen, and stored in polyethylene containers before being oven-dried at 65 °C for 24 h and passed through a 2 mm sieve. Soil chemical properties before the potting experiment can be found in [20]. After the potting experiment, dried and 2 mm sieved soil samples were analyzed for pH; soil organic carbon (OC); and extractable P, K, Ca, Mg, S, Zn, Cu, Fe, Mn, and B. The soil pH was determined in deionized water with a 1:1 soil-to-water ratio [21]. The OC was determined with dry combustion using a LECO Truspec carbon and nitrogen analyzer (St. Joseph, MI). Plant-available P, K, Ca, and Mg were extracted by shaking 2 g of soil in 20 mL of M-3 solution (0.001 M EDTA, 0.015 M NH4F, 0.2 M CH3COOH, 0.25 M NH4NO3, 0.013 M HNO3; pH buffered to 2.5) for 5 min [6] and quantified by an inductively coupled plasma atomic emission spectroscopy (ICP-AES). Plant-available S was extracted by shaking 10 g of soil in 25 mL of 0.008 M MCP ([Ca(H2PO4)2.H2O]) for 30 min [15] and determined with an ICP-AES. Bioaccessible micronutrients were analyzed by adding 20 mL of DTPA-sorbitol (0.005 M DTPA, 0.01 M CaCl2·2H2O, 0.2 M Sorbitol, 0.11 M triethanolamine, 0.05 M HCl; pH buffered to 7.3) to 10 g of soil, shaken for 2 h, and quantified with ICP-AES (a modification of the DTPA method was made via the addition of 0.2 M sorbitol for the simultaneous extraction and determination of plant-available B, as well as Zn, Cu, Fe, and Mn). Plant-available micronutrients (Zn, Cu, Fe, Mn, and B) and S in M-3-filtered extracts were also determined by an ICP-AES.

2.4. Nutrient Analysis in Plants

Ground plant materials were analyzed for plant nutrients via nitric acid digestion, in which 0.5 g of ground plant materials were predigested for 1 h with 10 mL of concentrated trace metal grade HNO3 in the HotBlockTM Environmental Express block digester. The digestion products were then heated to 115 °C for 2 h and diluted with deionized water to 50 mL [22]. The digested samples were analyzed for P, K, Ca, Mg, S, Cu, Fe, Mn, Zn, and B with an ICP-AES.

2.5. Data Analysis

Boxplot analysis was plotted after normalizing the whole dataset of measurements to show the differences between the traditional (DTPA and MCP) and proposed (M-3) methods for the nutrients studied. Analysis of variance (ANOVA) was performed to verify the effect of the addition of two different feedstock derived-biochars, their application rates, and their effect on soil nutrients extracted from the traditional (DTPA and MCP) and M-3 solutions. The standard deviation from triplicates (n = 3) was plotted to show significant differences between treatments.
Simple linear regression models between DTPA- and M-3-extractable Zn, Fe, Cu, Mn, and B and between MCP- and M-3-extractable S were carried out to test the relationship between the traditional (DTPA and MCP) and proposed methods (M-3). For this, the model and equation coefficients’ significances were tested along with the root mean square error (Equation (1)), normalized root mean square error (Equation (2)), and d-index (Equation (3)).
Root mean square error:
R M S E = i = 1 n P i O i 2 n
where Pi is the ith predicted value, Oi is the ith observed value, and n is the sample size.
Normalized root mean square error:
N R M S E = R M S E / Ō
where Ō = is the mean of observed values. If the value of NRMSE is less than 10%, the degree of fitness is considered excellent; if 10% ≤ NRMSE < 20%, the degree of fitness is considered good; when 20% ≤ NRMSE < 30%, the degree of the fitness is considered common; and if the value NRMSE is larger than 30%, the degree of the fitness is considered poor [23,24].
d-index = 1 i = 1 n P i O i 2 i = 1 n P i + O i 2   0 d 1
where n is the sample size, Pi is the proposed method value, Oi is the traditional method value, and Ō = the overall mean of the proposed method value. Pi’ is PiŌ, and Oi’ is OiŌ, where the overall mean of the proposed method (Ō) is deducted from every single value of the traditional method (Oi). The d-index varies between 0 and 1, with a value of 1 indicating perfect agreement between the proposed (M-3) and traditional methods [25].
Pearson simple correlations were performed between nutrients extracted by all methods and their concentrations in plant tissues using the whole dataset of measurements. Graphs were created in Microsoft Excel 2016.

3. Results and Discussion

3.1. Physiochemical Properties of Biochars and Soils

The main physicochemical properties of the SGB and PLB biochars are listed in Table 1. A detailed breakdown of each biochar can be found in [18]. Briefly, the ash contents of SGB and PLB were substantially different at 4.4% and 45.9%, respectively, whereas the moisture % (1.7 and 3.9), TC% (31.4 and 27.8), and pH (10.1 and 10.2) values for SGB and PLB, respectively, were similar. The specific surface area (SSA) for SGB was 22.9 m2 g−1 and roughly double that of PLB, which was 9.28 m2 g−1. Large differences in biochar EC were seen for SGB (240 µS cm−1) and PLB (9150 µS cm−1), which is common when comparing biochars derived from switchgrass and manure [19]. Like SSA, the CEC for SGB was greater at 309.6 cmol kg−1, whereas the CEC for PLB was 235.9 cmol kg−1. The CEC and SSA values for the biochars were likely controlled by the pyrolysis temperature, TC%, and the type and amount of organic surface functional groups [18]. Overall, the biochar parameters listed in Table 1 are in the ranges of other biochars produced from the same feedstock and pyrolysis temperatures [19,26].
Biochar nutrient contents (P, K, Ca, Mg, S, Zn, Fe, Cu, Mn, and B) are listed in Table 1. SGB nutrients were all significantly lower than nutrients found in the PLB. The high nutrient content within the PLB is common among biochars derived from manure [19] and has been positively correlated with ash % [18]. In general, the SGB and PLB nutrient values are similar to other biochars produced in similar manners.
The mean pH, OC%, and nutrient contents from the traditional (DTPA and MCP) and M-3 extractions from the biochar-amended soils (and unamended soils) are listed in Table 2. The soil pH varied from 5.7 (control soil) to 7.6 (4% biochar rate) with a mean of 6.8 for all soils. Increases in soil pH with amended biochars are common when high pyrolysis temperatures (~700 °C) are used, which can lead to an abundance of NaOH, KOH, CaCO3, and MgCO3 [27]. The mean OC% was 3.0, but it ranged from 2.0% to 5.5%. The mean nutrient contents and pH were sufficient for ryegrass production [28]. In general, mean nutrient contents extracted with M-3 were larger when compared with the same nutrient extracted with the traditional extractants. For instance, M-3 extracted around double the amount of Zn, Cu, and Mn; fivefold Fe; and >40× more B than DTPA did. Conversely, M-3 only extracted ~1.4× more S than the MCP extractant. These results agree with [29], who observed an overall increment of M3-micronutrient availability when compared with DTPA, although such increments were not at the same magnitude as in our study and varied from one element to another. Therefore, these inconsistencies must be stressed, and any estimation of micronutrient availability should be improved for individual crops and soils concerning both field and potting experiments [29]. This becomes even more important when M3 is used for micronutrient extraction since it can access available fractions that are inaccessible with DTPA, as stated in the works of [30,31]. The increased extracted mean nutrient content for M-3 may arise due to the combination of low pH (2.5) and the presence of 1 mM EDTA in the M-3 solution, which leads to enhanced mineral dissolution and potential release and or the complexation of more micronutrients (Zn, Fe, Cu, Mn, and B) and S [6].

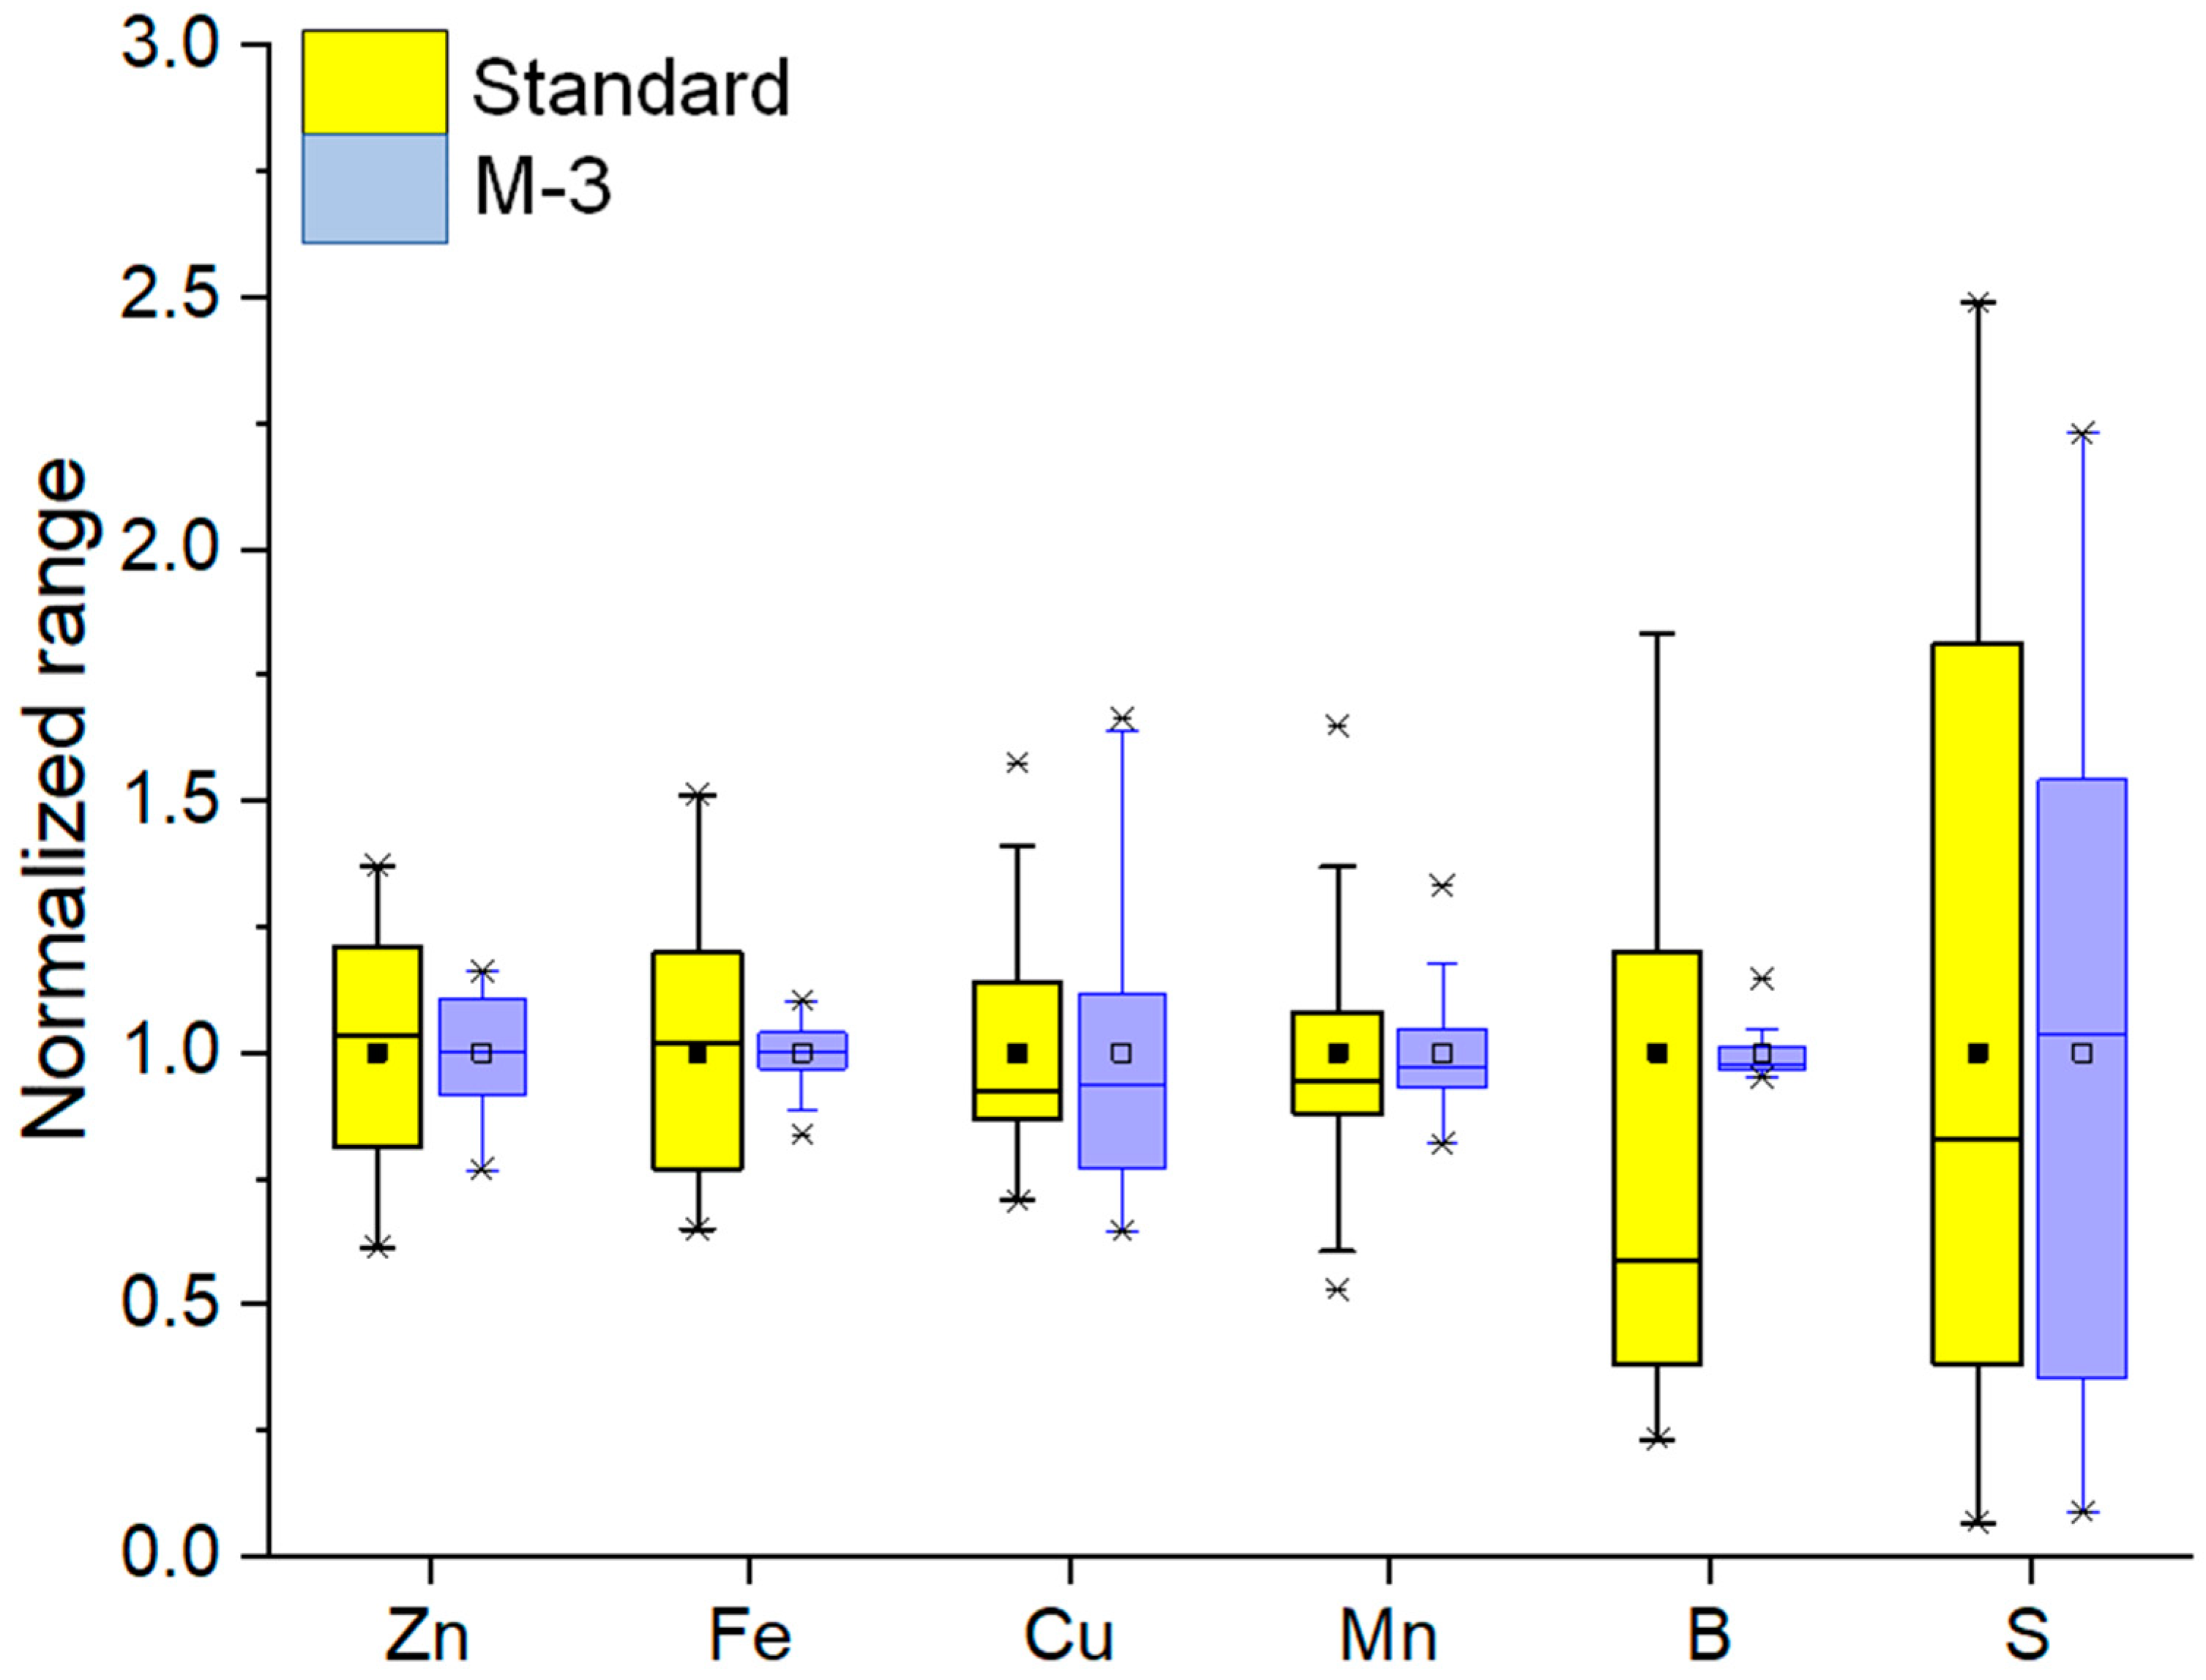
3.2. Normalized Range of Soil Extractable Nutrients

The normalized soil-extractable nutrients from the two “standard” methods and M-3 solutions are shown in boxplots in Figure 1. For all nutrients, except for Cu, the distribution of normalized soil-extractable nutrient content was smaller and more normally distributed for M-3 when compared with DTPA and MCP, which were positively skewed for DTPA-extracted Cu, Mn, and B, and MCP-extracted S.

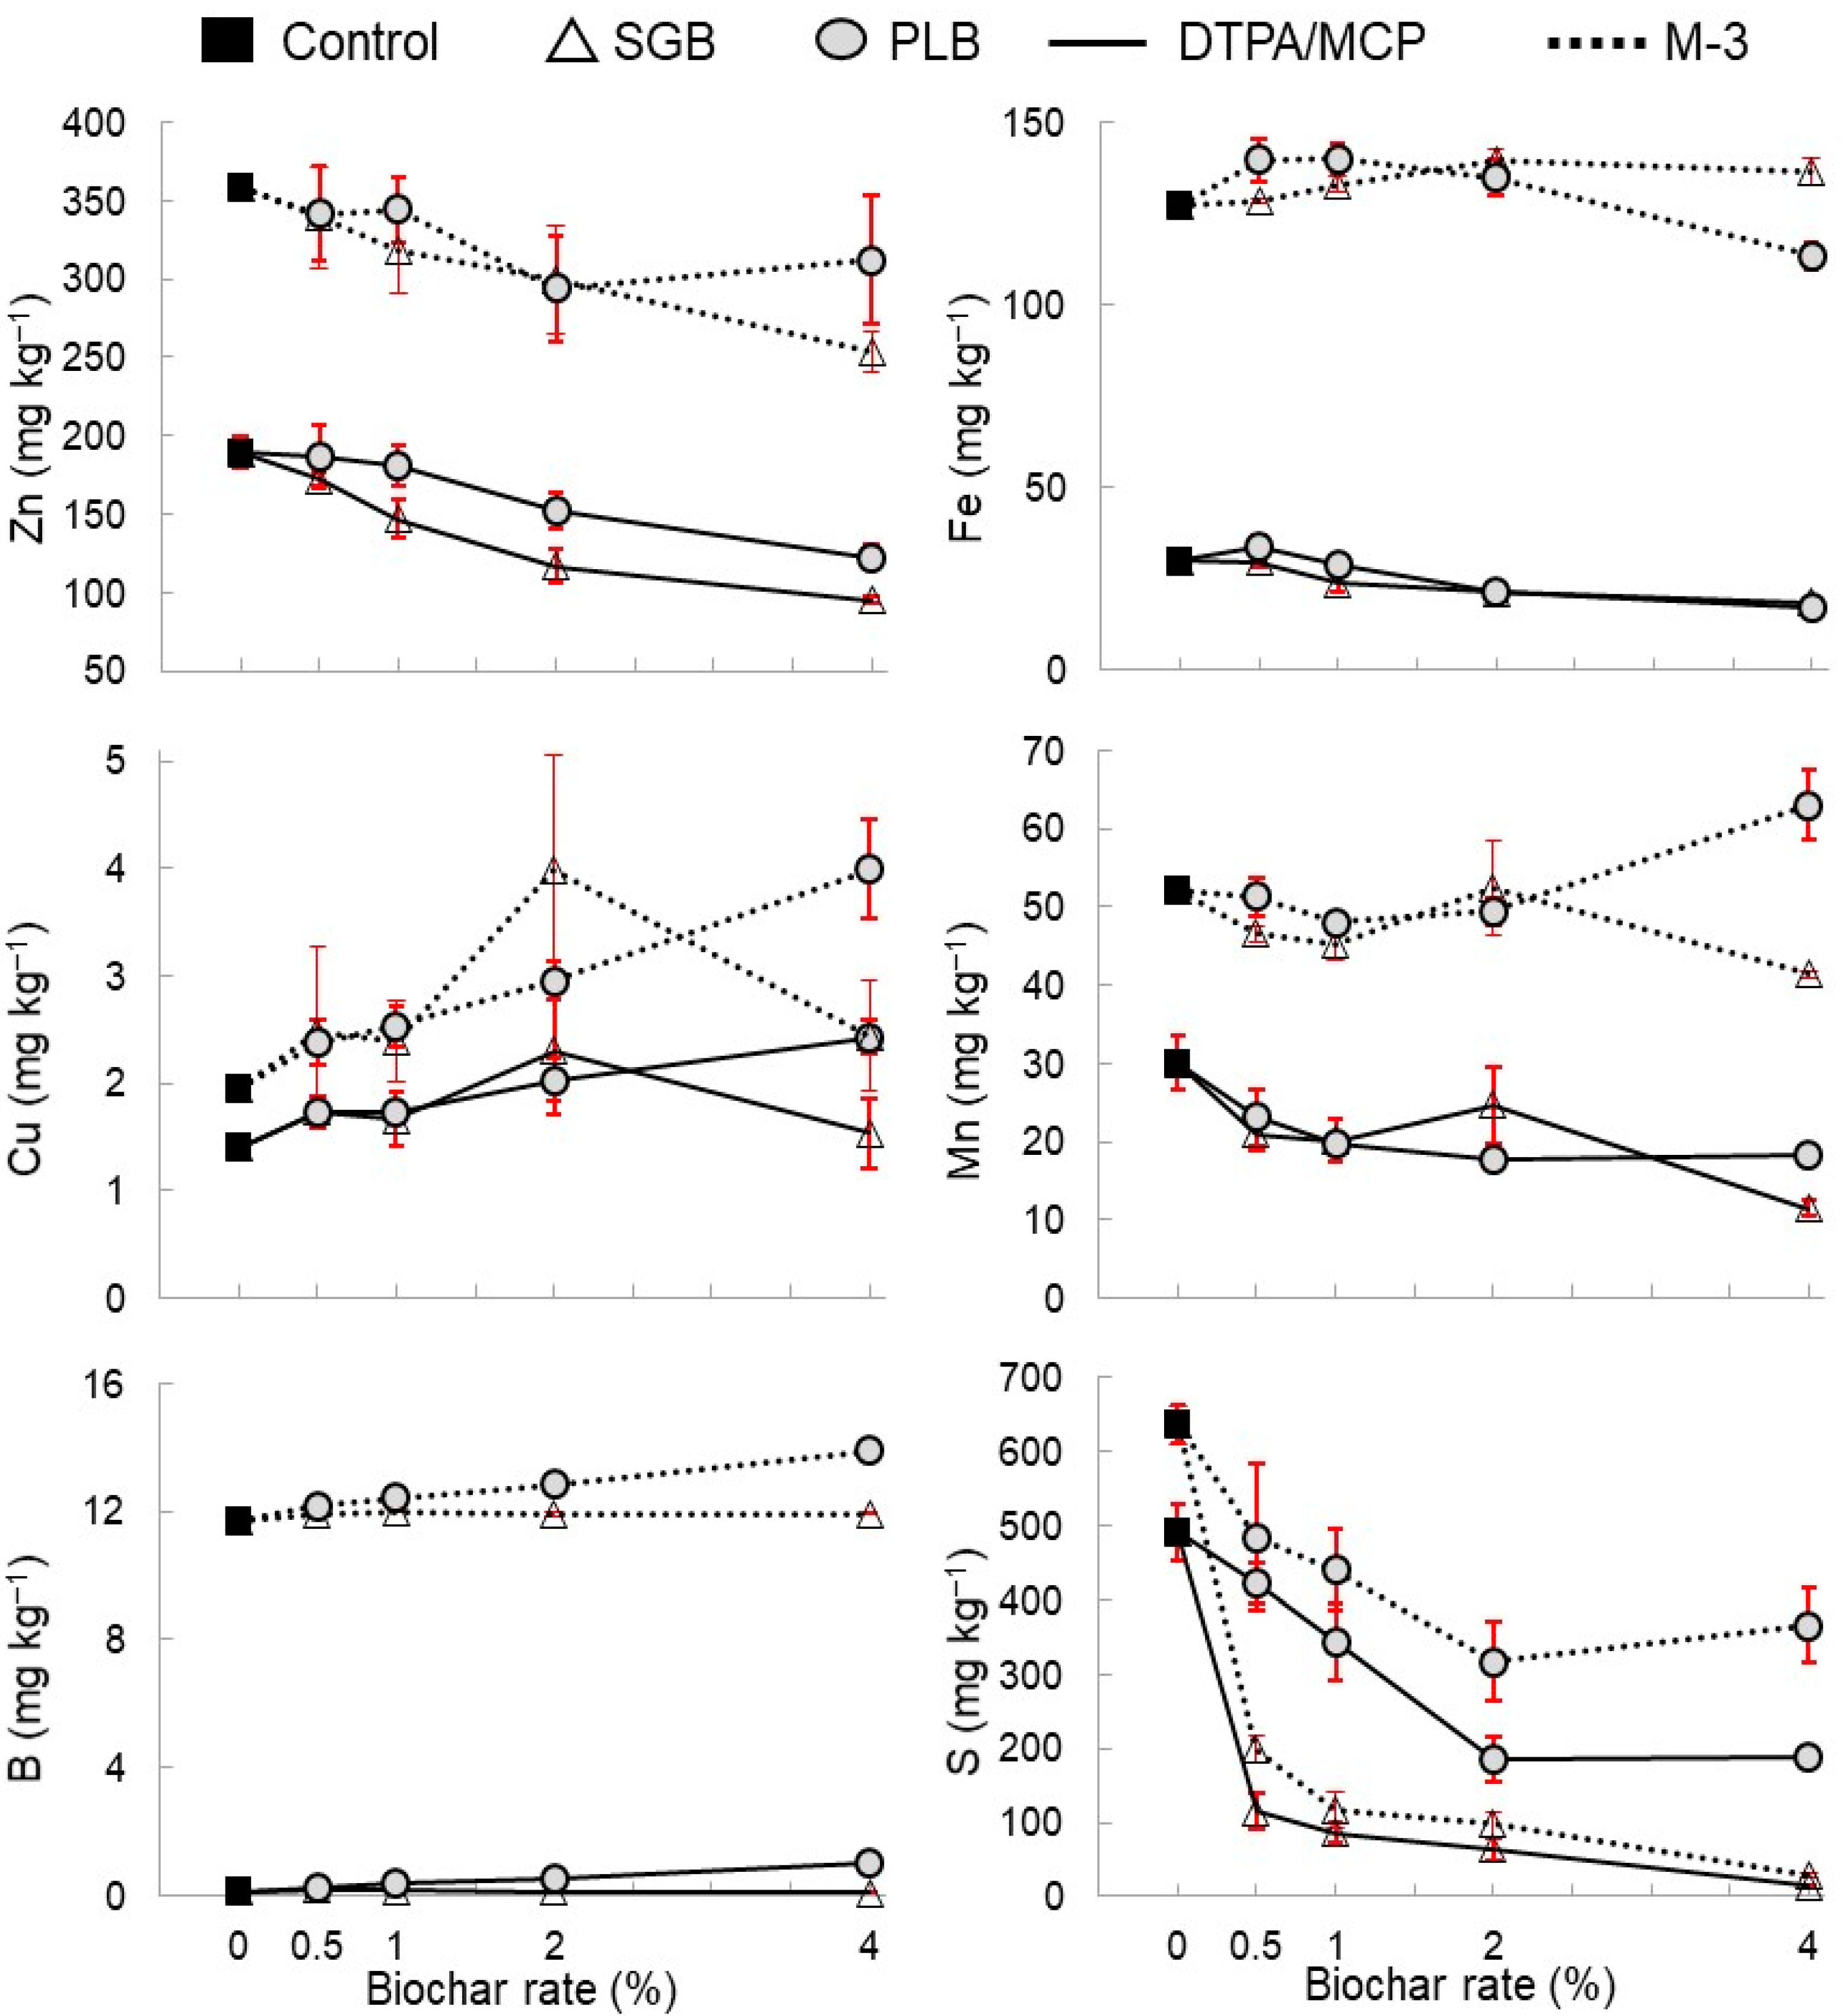
3.3. Impact of Biochar Addition on Extracted Soil Nutrients

The effect of SGB and PLB addition and rates on extracted soil nutrients is shown in Table 3. Biochar feedstock had a significant effect on DTPA-extracted Zn (p < 0.001), Fe (p < 0.05), and B (p < 0.001) and MCP-extracted S (p < 0.001). For M-3, biochar feedstock had significant effects on extracted Mn (p < 0.001), B (p < 0.001), and S (p < 0.001). All nutrients extracted by DTPA, MCP, and M-3 were significantly influenced (p < 0.001) by the biochar application rate except for M-3 Mn (p < 0.01). The interaction between the biochar and the rate had a significant effect on all extracted nutrients except Zn extracted by both the DTPA and M-3 solutions. Similar results were seen by [10], where increased compost applications led to reduced trace metal extraction efficiencies for both M-3 and DTPA. Likewise, Cancela et al. [8] showed that increased soil organic matter led to significant decreases in DTPA- and M-3-extracted Zn, Cu, and Fe.
The effect of the biochar application rate and feedstock type on extractable nutrients is shown in Figure 2. In general, extracted nutrient concentrations were higher for soils amended with PLB than the SGB-amended soils when comparing the same extractant used on the different biochars.
This trend of higher PLB-extracted nutrients is likely due to the increased concentration of nutrients found in the poultry litter-derived biochar (Table 1) and is a common occurrence when comparing nutrient content between manure-based biochars and plant-based biochars [19]. In nearly all cases, M-3-extracted nutrient contents for the control and SGB- and PLB-amended soils were significantly higher than the nutrient concentrations extracted with the traditional solutions (MCP and DTPA). Variations in this trend can be seen with extracted Cu and S. M-3 Cu is all higher than that of DTPA, although most is not significantly different. For MCP S, a biochar feedstock effect is seen where the MCP and M-3 S concentrations from PLB-amended soils were both significantly higher than the MCP and M-3-extracted S concentrations from the SGB-amended soils. The high concentrations of S (13,500 mg kg−1) within PLB, compared with SGB S (367 mg kg−1), explains this result (Table 1). Similar patterns of extracted nutrient concentrations can be seen between SGB-amended soils and PLB-amended soils extracted with both the traditional solutions and M-3. This further supports the theory that the difference between extracted nutrient contents for all soils is truly due to the difference between physiochemical properties and the nutrient content of the biochars (Table 1), as well as the chemical makeup of the extracting solutions. Lastly, several trends appear when comparing the extracted nutrient contents of the control with the biochar-amended soils. In general, when compared with the control soil, decreases in M-3- and DTPA-extracted Zn, Fe, Mn, and S concentrations can be seen for both SGB- and PLB-amended soils as the biochar rate % increased. Minor variations in this trend occurred with M-3-extracted Fe at SGB rates of 2% and 4% and with M-3-extracted Mn at a PLB rate of 4%, which were both higher than the control soil Fe and Mn concentrations. These trends in decreasing extractable nutrients with increasing biochar application rates can likely be explained by an increase in organic surface functional groups, especially carboxylic acids [18], which have a high affinity for Fe, Zn, and Mn and likely lower the extraction efficiency of the M-3 and “standard” extracting solutions [20].
The decrease in extracted Zn, Fe, and Mn might be also due to the metal oxide precipitation occurring at the higher soil pH values caused by an increased biochar rate % [20]. Similar decreases in DTPA and M-3 Zn, Cu, and Fe extraction efficiencies with increasing pH values and organic matter % in compost-amended soils have also been shown by [8,10]. Metal oxide formation in the higher pH soils may also help explain the sharp decreases in extracted S concentrations seen with an increased biochar application rate. As the pH increases and more metal oxides form, an increase in sulfate adsorption, as well as precipitation, may occur, leading to significantly lower amounts of extracted S. Interestingly, all extracted Cu concentrations for the biochar-amended soils were higher than the background concentrations from the control, and this is due to the relatively high concentrations of Cu within SGB (23 mg Cu kg−1) and PLB (253 mg kg−1) (Table 1) compared with the total amount of Cu (12.8 mg kg−1) within the control soil [20]. Curiously, M-3- and DTPA-extracted Cu and Mn concentrations for SGB-amended soils had substantial decreases due to the 2 to 4% biochar rate applications, which may be due to the increase in organic C surface functional groups, especially carboxylic acids, and higher organic matter present within the SGB when compared with the PLB [18]. Like Cu, similar trends in increased DTPA- and M-3-extracted B could be seen as the PLB application rate increased, and this can be attributed to the higher amount of B present within the PLB (Table 1), whereas the DTPA- and M-3-extracted B from the SGB amendments stayed relatively flat over all biochar rates and had similar concentrations to the soil control due to a lack of B within the SGB (Table 1).

3.4. The Relationship between M-3- and “Standard” Solution-Extractable Nutrients

Simple linear regression and model parameters for the relationships between DTPA- and M-3-extractable micronutrients and MCP- and M-3-extractable S for the SGB-, PLB-, and SGB + PLB-amended soils (the soils treated with SGB and the soils treated with PLB are compiled together in the analyses) are shown in Table 4. Generally, there was a positive and significant relationship between the traditional extractants (DTPA and MCP) and M-3 for the individual biochars and the sum. Variations in this trend can be seen for Fe and B for the SGB-amended soils, Mn for the PLB-amended soils, and Fe in the SGB + PLB-amended soils. The reasons for deviation from the significant and positive trend are primarily due to physicochemical differences between the biochar feedstocks (Table 1) and the soil pH increases at a high application rate (Table 2 and Figure 2). Out of all of the nutrients, the near 1:1 relationship between MCP and M-3 S had the highest d-index values, ranging from 0.77 to 0.96 with highly significant (p < 0.001) R2 values that ranged from 0.81–0.98 for individually and SGB + PLB-amended soil. A near 1:1 relationship between these solutions was also found by [32] after evaluating several extraction methods for available S in soils. It must be pointed out that even a 1:1 relationship is not enough to simply replace one extraction method with another unless the intercept of the relationship is equal to or close to zero. Therefore, it is still important to use and establish conversion factors obtained from such relationships because of the absolute values that the S fertilizer recommendation is based on when using the traditional MCP.
Interestingly, the slopes and intercepts for Zn and Cu for the combined SGB- and PLB-amended soils were fairly consistent with the individual biochar-amended soils and had d-indices of 0.28 and 0.53, respectively. Although the relationship is not a perfect 1:1, there is potential for the M-3 Zn and Cu concentrations to be corrected to DTPA values. Lastly, it is important to note that the RMSE showed low values near zero and the NRMSE showed excellent (<0.1) and good (0.1 ≤ NRMSE < 0.2) model fits even for nonsignificant relationships, which likely indicates that, for this dataset, the d-index is better for model validation than RMSE or NRMSE.

3.5. Correlations between Soil Extractable Nutrients and Ryegrass Biomass

Pearson correlations between M-3-extractable micronutrients and S and nutrient concentrations in ryegrass shoots and roots are shown in Table 5. Significant positive correlations were seen for M-3 Zn, Mn, B, and S with their concentrations in ryegrass shoots and roots in soils treated with SGB and the soils treated with PLB when both were compiled together in the analyses (SGB + PLB), whereas M-3 Fe and Cu were not significant. Intriguingly, similar correlations were seen with the commonly accepted DTPA-extracted nutrients and ryegrass shoot and root nutrient concentrations (Supplementary Table S1), which suggests that biochar-amended soils may negatively affect the extraction efficiency of both M-3 and DTPA due to changes in soil physicochemical properties brought about by biochar amendment (Table 1 and Table 2). This is consistent with Farrel et al. [33] who showed that soil-based methods to determine the plant availability of heavy metals from biochars can be quite challenging due to the variable physicochemical properties of biochars. The correlations between M-3-extracted S and S concentrations in ryegrass shoots and roots in soils treated with SGB and the soils treated with PLB are very similar to those determined from MCP-extracted S (Supplementary Table S1) when both were compiled together in the analyses (SGB + PLB). This further corroborates our linear regression and model data (Table 4), which support the use of the M-3 solution as an extractant for plant-available S in soils amended with biochars under similar conditions to those studied.

4. Conclusions

We conducted a ryegrass potting experiment where soil OC and pH were altered by applying two different feedstock (switchgrass and poultry litter)-derived biochars to probe their effects on soil-extractable Zn, Fe, Cu, Mn, B, and S using M-3 (a potential universal nutrient extractant) and traditional extracting solutions (DTPA and MCP) and evaluated their correlations to ryegrass root and shoot nutrient contents. Relationships between M-3 and DTPA were not reliable for micronutrient availability, although highly significant relationships for Zn and Cu were found. Nevertheless, we have shown that the M-3 solution can be used to extract soil S and provide a 1:1 relationship with that of MCP in soils amended with biochars produced from two different feedstocks, as well as significant and positive correlations between M-3-extracted S and S concentrations in ryegrass shoots and roots. For this study, the d-index was a better indicator of model validation than the RMSE and NRMSE. Future studies need to focus on soils with similar pH values and ranges in OC% from natural organic matter to see if soils amended with biochar truly possess unique physicochemical properties that affect nutrient extractions compared with non-biochar-amended soils. These results may help environmental testing laboratories increase their efficiency, improve sample processing time, and save money on nutrient extractants when testing for soil-extractable S, especially soils amended with biochars under similar conditions to those tested.

Supplementary Materials

The following supporting information can be downloaded at: https://www.mdpi.com/article/10.3390/land11111979/s1, Table S1: Pearson correlations between DTPA-extractable Zn, Fe, Cu, Mn, B, and monocalcium phosphate (MCP)-extractable S with nutrient concentrations in ryegrass shoots and roots.

Author Contributions

Conceptualization, J.A.A.; methodology, J.A.A. and J.L.B.S.; software, J.A.A.; validation, J.A.A., J.L.B.S. and A.W.; formal analysis, J.A.A. and J.L.B.S.; investigation, J.A.A.; resources, B.A. and H.Z.; data curation, J.A.A. and J.L.B.S.; writing—original draft preparation, J.A.A. and A.W.; writing—review and editing, all authors; visualization, J.A.A.; supervision, B.A. and H.Z.; project administration, J.A.A., B.A. and H.Z.; funding acquisition, B.A. and H.Z. All authors have read and agreed to the published version of the manuscript.

Funding

This research was funded by Oklahoma Agriculture Experimental Station.

Data Availability Statement

Data are available upon request from the corresponding author.

Acknowledgments

The biochars used for this study were supplied by Keri B. Cantrell, a former Agricultural Engineer with USDA-ARS. The authors appreciate her support.

Conflicts of Interest

The authors declare no conflict of interest.

References

  1. Sposito, G. The chemistry of Soils; Oxford University Press: New York, NY, USA, 2020. [Google Scholar]
  2. Mortvedt, J.J.; Cox, F.R.; Shuman, L.M.; Welch, R.M. Micronutrients in Agriculture; Soil Science Society of America: Madison, WI, USA, 1991. [Google Scholar]
  3. Tisdale, S.L.; Nelson, W.L.; Beaton, J.D. Soil Fertility and Fertilizers; Macmillan: New York, NY, USA, 1985. [Google Scholar]
  4. McLaren, R.G.; Cameron, K.C. Soil Science: Sustainable Production and Environmental Protection; Oxford University Press: Auckland, New Zealand, 1996. [Google Scholar]
  5. Lindsay, W.L.; Norvell, W.A. Development of a DTPA soil test for zinc, iron, manganese, and copper. Soil Sci. Soc. Am. J. 1978, 42, 421–428. [Google Scholar] [CrossRef]
  6. Mehlich, A. Mehlich 3 soil test extractant: A modification of Mehlich 2 extractant. Commun. Soil Sci. Plant Anal. 1984, 15, 1409–1416. [Google Scholar] [CrossRef]
  7. Schmisek, M.E.; Cihacek, L.J.; Swenson, L.J. Relationships between the mehlich-iii soil test extraction procedure and standard soil test methods in North Dakota. Commun. Soil Sci. Plant Anal. 1998, 29, 1719–1729. [Google Scholar] [CrossRef]
  8. Cancela, R.C.; de Abreu, C.A.; Paz-González, A. DTPA and mehlich-3 micronutrient extractability in natural soils. Commun. Soil Sci. Plant Anal. 2002, 33, 2879–2893. [Google Scholar] [CrossRef]
  9. Monterroso, C.; Alvarez, E.; Fernández Marcos, M.L. Evaluation of mehlich 3 reagent as a multielement extractant in mine soils. Land Degrad. Dev. 1999, 10, 35–47. [Google Scholar] [CrossRef]
  10. Vidal-Vázquez, E.; Caridad-Cancela, R.; Taboada-Castro, M.M.; Paz-González, A.; de Abreu, C.A. Trace elements extracted by DTPA and Mehlich-3 from agricultural soils with and without compost additions. Commun. Soil Sci. Plant Anal. 2005, 36, 717–727. [Google Scholar] [CrossRef]
  11. Wang, J.J.; Harrell, D.L.; Henderson, R.E.; Bell, P.F. Comparison of soil-test extractants for phosphorus, potassium, calcium, magnesium, sodium, zinc, copper, manganese, and iron in Louisiana soils. Commun. Soil Sci. Plant Anal. 2004, 35, 145–160. [Google Scholar]
  12. Brennan, D.; Coulter, B.; Mullen, G.; Courtney, R. Evaluation of mehlich 3 for extraction of copper and zinc from Irish grassland soils and for prediction of Herbage Content. Commun. Soil Sci. Plant Anal. 2008, 39, 1943–1962. [Google Scholar] [CrossRef]
  13. Zbíral, J.; Němec, P. Comparison of some soil extractants for determination of Boron. Commun. Soil Sci. Plant Anal. 2009, 40, 96–105. [Google Scholar] [CrossRef]
  14. Redd, S.A.; Shiffler, A.K.; Jolley, V.D.; Webb, B.L.; Haby, V.A. Mehlich 3 extraction of boron in boron treated soils as compared to other extractants. Commun. Soil Sci. Plant Anal. 2008, 39, 1245–1259. [Google Scholar] [CrossRef]
  15. Brown, J.R. Recommended Chemical Soil Test Procedures for the North Central Region; Missouri Agricultural Experiment Station, University of Missouri–Columbia: Columbia, MO, USA, 1998. [Google Scholar]
  16. Rao, T.N.; Sharma, P.K. Evaluation of mehlich III as an extractant for available soil sulfur. Commun. Soil Sci. Plant Anal. 1997, 28, 1033–1046. [Google Scholar] [CrossRef]
  17. Matula, J. Use of multinutrient soil tests for sulphur determination. Commun. Soil Sci. Plant Anal. 1999, 30, 1733–1746. [Google Scholar] [CrossRef]
  18. Antonangelo, J.A.; Zhang, H.; Sun, X.; Kumar, A. Physicochemical properties and morphology of biochars as affected by feedstock sources and pyrolysis temperatures. Biochar 2019, 1, 325–336. [Google Scholar] [CrossRef] [Green Version]
  19. Cantrell, K.B.; Hunt, P.G.; Uchimiya, M.; Novak, J.M.; Ro, K.S. Impact of pyrolysis temperature and manure source on physicochemical characteristics of biochar. Bioresour. Technol. 2012, 107, 419–428. [Google Scholar] [CrossRef] [PubMed]
  20. Antonangelo, J.A.; Zhang, H. Heavy Metal phytoavailability in a contaminated soil of northeastern Oklahoma as affected by Biochar Amendment. Environ. Sci. Pollut. Res. 2019, 26, 33582–33593. [Google Scholar] [CrossRef]
  21. Ahmad, M.; Soo Lee, S.; Yang, J.E.; Ro, H.-M.; Han Lee, Y.; Sik Ok, Y. Effects of soil dilution and amendments (Mussel Shell, Cow Bone, and biochar) on PB availability and phytotoxicity in military shooting range soil. Ecotoxicol. Environ. Saf. 2012, 79, 225–231. [Google Scholar] [CrossRef]
  22. Jones, J.B.; Case, V.W. Sampling, handling, and analyzing plant tissue samples. SSSA Book Ser. 1990, 389–427. [Google Scholar] [CrossRef]
  23. Peng, J.-L.; Kim, M.-J.; Jo, M.-H.; Min, D.-H.; Kim, K.-D.; Lee, B.-H.; Kim, B.-W.; Sung, K.-I. Accuracy evaluation of the crop-weather yield predictive models of Italian ryegrass and forage rye using cross-validation. J. Crop Sci. Biotechnol. 2017, 20, 327–334. [Google Scholar] [CrossRef]
  24. Rinaldi, M.; Losavio, N.; Flagella, Z. Evaluation and application of the OILCROP—Sun model for sunflower in southern Italy. Agric. Syst. 2003, 78, 17–30. [Google Scholar] [CrossRef]
  25. Willmott, C.J.; Ackleson, S.G.; Davis, R.E.; Feddema, J.J.; Klink, K.M.; Legates, D.R.; O’Donnell, J.; Rowe, C.M. Statistics for the evaluation and comparison of Models. J. Geophys. Res. 1985, 90, 8995. [Google Scholar] [CrossRef] [Green Version]
  26. Cao, X.; Harris, W. Properties of dairy-manure-derived biochar pertinent to its potential use in remediation. Bioresour. Technol. 2010, 101, 5222–5228. [Google Scholar] [CrossRef] [PubMed]
  27. Ippolito, J.A.; Ducey, T.F.; Cantrell, K.B.; Novak, J.M.; Lentz, R.D. Designer, acidic biochar influences calcareous soil characteristics. Chemosphere 2016, 142, 184–191. [Google Scholar] [CrossRef] [PubMed]
  28. Zhang, H.; Raun, W.; Arnall, D.B. OSU Soil Test Interpretations; Oklahoma State Univ. Ext. Facts PSS-2225; Oklahoma State University: Stillwater, OK, USA, 2017; Available online: https://extension.okstate.edu/fact-sheets/osu-soil-test-interpretations.html (accessed on 25 September 2022).
  29. Zbíral, J. Determination of plant-available micronutrients by the Mehlich 3 soil extractant—A proposal of critical values. Plant Soil Environ. 2016, 62, 527–531. [Google Scholar] [CrossRef] [Green Version]
  30. Lévesque, V.; Gagnon, B.; Ziadi, N. Soil mehlich-3-extractable elements as affected by the addition of biochars to a clay soil co-amended with or without a compost. Can. J. Soil Sci. 2022, 102, 97–107. [Google Scholar] [CrossRef]
  31. Majaule, U.; Dikinya, O.; Glaser, B. Interactive effects of biochar and sewage sludge on bioavailability and plant uptake of Cu, Fe, and Zn, and spinach (Spinacia oleracea L.) yields under wastewater irrigation. Agronomy 2020, 10, 1901. [Google Scholar] [CrossRef]
  32. Ketterings, Q.; Miyamoto, C.; Mathur, R.R.; Dietzel, K.; Gami, S. A comparison of soil sulfur extraction methods. Soil Sci. Soc. Am. J. 2011, 75, 1578–1583. [Google Scholar] [CrossRef]
  33. Farrell, M.; Rangott, G.; Krull, E. Difficulties in using soil-based methods to assess plant availability of potentially toxic elements in biochars and their feedstocks. J. Hazard. Mater. 2013, 250–251, 29–36. [Google Scholar] [CrossRef]
Figure 1. Boxplots of traditional and Mehlich-3 (M-3) soil-extractable nutrients. Single results were divided by the average to normalize data and plot variables in the same range. Boxes span the 25th to 75th data percentile, whiskers represent 1.5 × the interquartile range, horizontal lines denote the median, boxes denote the mean, and × denotes the extreme value.
Land 11 01979 g001
Figure 2. Effect of biochars on traditional (DTPA and MCP) and Mehlich-3-extractable nutrients at rates of 0, 0.5, 1, 2, and 4% after ~74 d of ryegrass cultivation. Red bars show the standard deviation (±SD) of means (n = 3). DTPA: Diethylenetriaminepentaacetic acid. MCP: Monocalcium phosphate (Ca(H₂PO₄)₂·H₂O). M-3: Mehlich-3.
Land 11 01979 g002
Table 1. Main physicochemical properties of biochars used in the study (adapted from [18]).
ParameterSGBPLB
Ash (%)4.445.9
Moisture (%)1.73.9
TC (%)31.427.8
pH10.110.2
SSA (m2 g−1)22.99.28
EC (µS cm−1)2409150
CEC a (cmol kg−1)309.6235.9
Nutrients
P (mg kg−1)1633 ± 15338,700 ± 819
K (mg kg−1)3967 ± 40478,033 ± 603
Ca (mg kg−1)7867 ± 96154,167 ± 2409
Mg (mg kg−1)3367 ± 32115,967 ± 115
S (mg kg−1)367 ± 11513,500 ± 608
Zn (mg kg−1)54 ± 61477 ± 43
Fe (mg kg−1)111 ± 206903 ± 1295
Cu (mg kg−1)23 ± 3253 ± 4
Mn (mg kg−1)144 ± 111108 ± 2
B (mg kg−1)<1.0 b103 ± 2
TC: Total carbon. SSA: Specific surface area. EC: Electrical conductivity. SGB and PLB are, respectively, switchgrass- and poultry litter-derived biochars pyrolyzed at 700 °C. ±: standard deviation (±SD) of triplicates (n = 3). a Cation Exchange Capacity. b <DL = Detection limit.
Table 2. Mean pH, organic carbon (OC), and nutrient contents of the soils treated (and untreated) with biochars.
DTPAMCPM-3
pH6.8 (5.7–7.6)---
OC (%)3.0 (2.0–5.5)---
P (mg kg−1)---143 (17–723)
K (mg kg−1)---268 (38.5–1483)
Ca (mg kg−1)---2216 (1648–2717)
Mg (mg kg−1)---238 (123–529)
S (mg kg−1)--212 (14.3–529)298 (26.2–665)
Zn (mg kg−1)-151 (93–208)-318 (244–369)
Fe (mg kg−1)-25 (16.2–37.7)-133 (111–146)
Cu (mg kg−1)-1.8 (1.3–2.9)-2.8 (1.8–4.6)
Mn (mg kg−1)-20 (11–34)-50 (40.9–66.5)
B (mg kg−1)-0.3 (0.07–1.1)-12.3 (11.7–14.1)
Values in parentheses represent the minimum-to-maximum range of the whole dataset of measurements. DTPA: Diethylenetriaminepentaacetic acid. MCP: Monocalcium phosphate (Ca(H₂PO₄)₂·H₂O). M-3: Mehlich-3.
Table 3. Analysis of variance for the effect of the addition of two different feedstock-derived biochars and their application rates on soil nutrients extracted with traditional (DTPA and MCP) and Mehlich-3 solutions.
Effect (Pr ˃ F)ZnFeCuMnBS
DTPA---MCP---
Biochar****0.15 NS0.79 NS******
Rate******************
Biochar × rate0.06 NS***********
M-3---
Biochar0.12 NS0.15 NS0.55 NS*********
Rate*****************
Biochar × rate0.27 NS**************
DTPA: Diethylenetriaminepentaacetic acid. MCP: Monocalcium phosphate (Ca(H₂PO₄)₂·H₂O). M-3: Mehlich-3. ***: p < 0.001; **: p < 0.01; *: p < 0.05; NS: nonsignificant (p > 0.05).
Table 4. Parameters of simple linear regression models between DTPA- and M-3-extractable Zn, Fe, Cu, Mn, and B and between MCP- and M-3-extractable SO4-S.
NutrientnExtractantInterceptSlopeR2RMSENRMSEd-index
GB
Zn15DTPA vs. M-3162 ± 221.1 ± 0.10.80 ***19.80.060.31
FeDTPA vs. M-3153 ± 5−0.8 ± 0.20.56 **3.670.030.07
CuDTPA vs. M-3−0.43 ± 0.61.8 ± 0.30.68 ***0.530.200.54
MnDTPA vs. M-334 ± 20.62 ± 0.10.74 ***2.640.060.32
BDTPA vs. M-311.9 ± 0.10.2 ± 0.70.01 NS0.110.010.01
SMCP vs. M-323 ± 121.24 ± 0.050.98 ***33.50.160.96
PLB
Zn15DTPA vs. M-3212 ± 450.7 ± 0.30.35 *28.80.090.23
FeDTPA vs. M-3103 ± 101.1 ± 0.40.40 *8.820.070.10
CuDTPA vs. M-3−0.7 ± 0.41.8 ± 0.20.87 ***0.280.100.55
MnDTPA vs. M-354 ± 7−0.1 ± 0.30.00 NS6.080.120.20
BDTPA vs. M-311.5 ± 0.052.4 ± 0.10.98 ***0.100.010.04
SMCP vs. M-3166 ± 410.87 ± 0.110.81 ***56.50.130.77
SGB + PLB
Zn27DTPA vs. M-3185 ± 230.9 ± 0.20.58 ***25.80.080.28
FeDTPA vs. M-3121 ± 80.5 ± 0.30.09 NS8.590.060.09
CuDTPA vs. M-3−0.5 ± 0.41.8 ± 0.20.73 ***0.440.160.53
MnDTPA vs. M-341 ± 50.44 ± 0.210.15 *5.90.120.22
BDTPA vs. M-312 ± 0.02.3 ± 0.10.97 ***0.110.010.04
SMCP vs. M-350.1 ± 18.21.17 ± 0.070.92 ***57.20.190.92
DTPA: Diethylenetriaminepentaacetic acid. MCP: Monocalcium phosphate (Ca(H₂PO₄)₂·H₂O). M-3: Mehlich-3. n: Sample size. ±: Standard deviation (±SD). SGB + PLB: The soils treated with SGB and the soils treated with PLB are compiled together in the analyses. ***: p < 0.001; **: p < 0.01; *: p < 0.05; NS: nonsignificant (p > 0.05).
Table 5. Pearson correlations between Mehlich-3-extractable Zn, Fe, Cu, Mn, B, and S and those nutrient concentrations in ryegrass shoots and roots.
BiocharShootsRootsShoots + Roots
Zn
SGB0.61 *0.59 *0.65 *
PLB0.44 NS0.27 NS0.37 NS
SGB + PLB0.42 *0.36 NS0.45 *
Fe
SGB−0.51 NS−0.50 NS−0.43 NS
PLB−0.17 NS0.50 NS0.50 NS
SGB + PLB−0.19 NS0.33 NS0.37 NS
Cu
SGB−0.33 NS−0.34 NS−0.24 NS
PLB−0.47 NS−0.40 NS−0.35 NS
SGB + PLB−0.30 NS−0.29 NS−0.22 NS
Mn
SGB−0.16 NS0.42 NS0.32 NS
PLB0.54 *0.37 NS0.47 NS
SGB + PLB0.56 *0.57 **0.60 **
B
SGB−0.49 NS−0.11 NS−0.31 NS
PLB0.03 NS0.89 ***0.90 ***
SGB + PLB0.44 *0.76 ***0.82 ***
S
SGB0.94 ***0.92 ***0.95 ***
PLB0.69 **0.10 NS0.61 *
SGB + PLB0.57 **0.73 ***0.67 ***
***: p < 0.001; **: p < 0.01; *: p < 0.05; NS: nonsignificant (p > 0.05). SGB + PLB: The soils treated with SGB and the soils treated with PLB are compiled together in the analyses.
Publisher’s Note: MDPI stays neutral with regard to jurisdictional claims in published maps and institutional affiliations.

