


Density, Diversity, and Design: Evaluating the Equity of the Elderly Communities in Three Measures of the Built Environment
Abstract
:1. Introduction
2. Materials and Methods
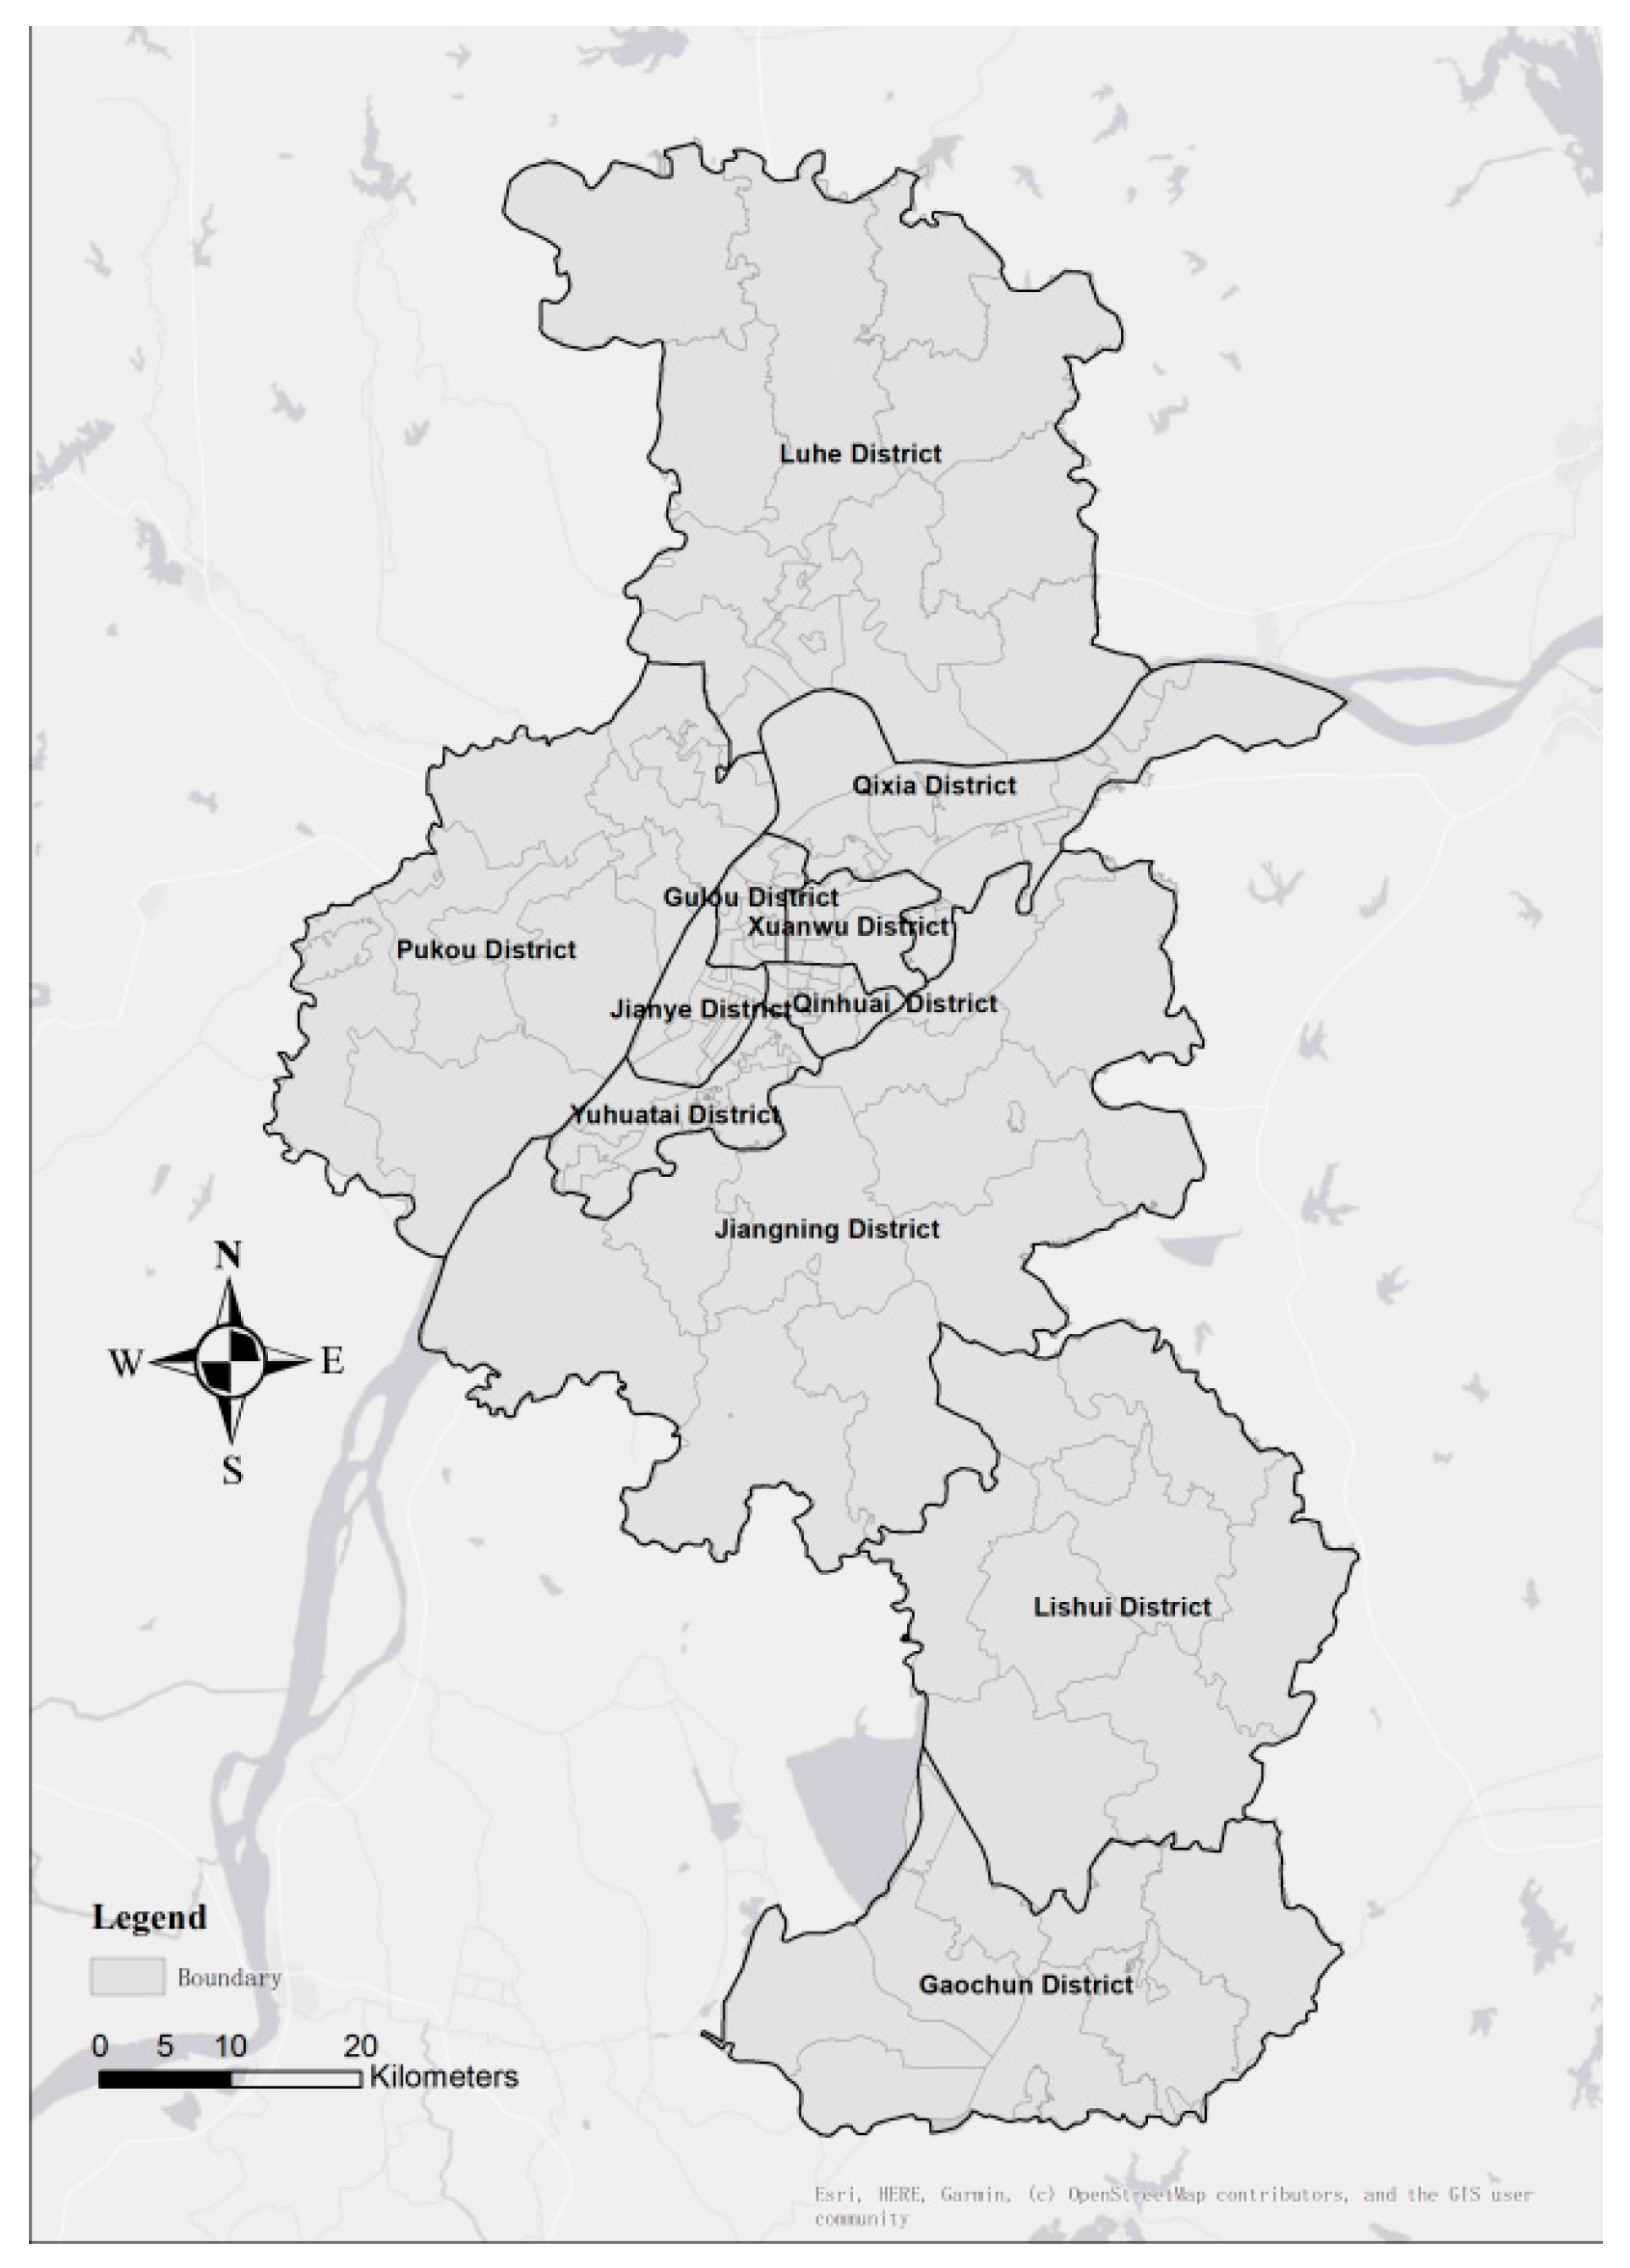
2.1. Study Area
2.2. Data
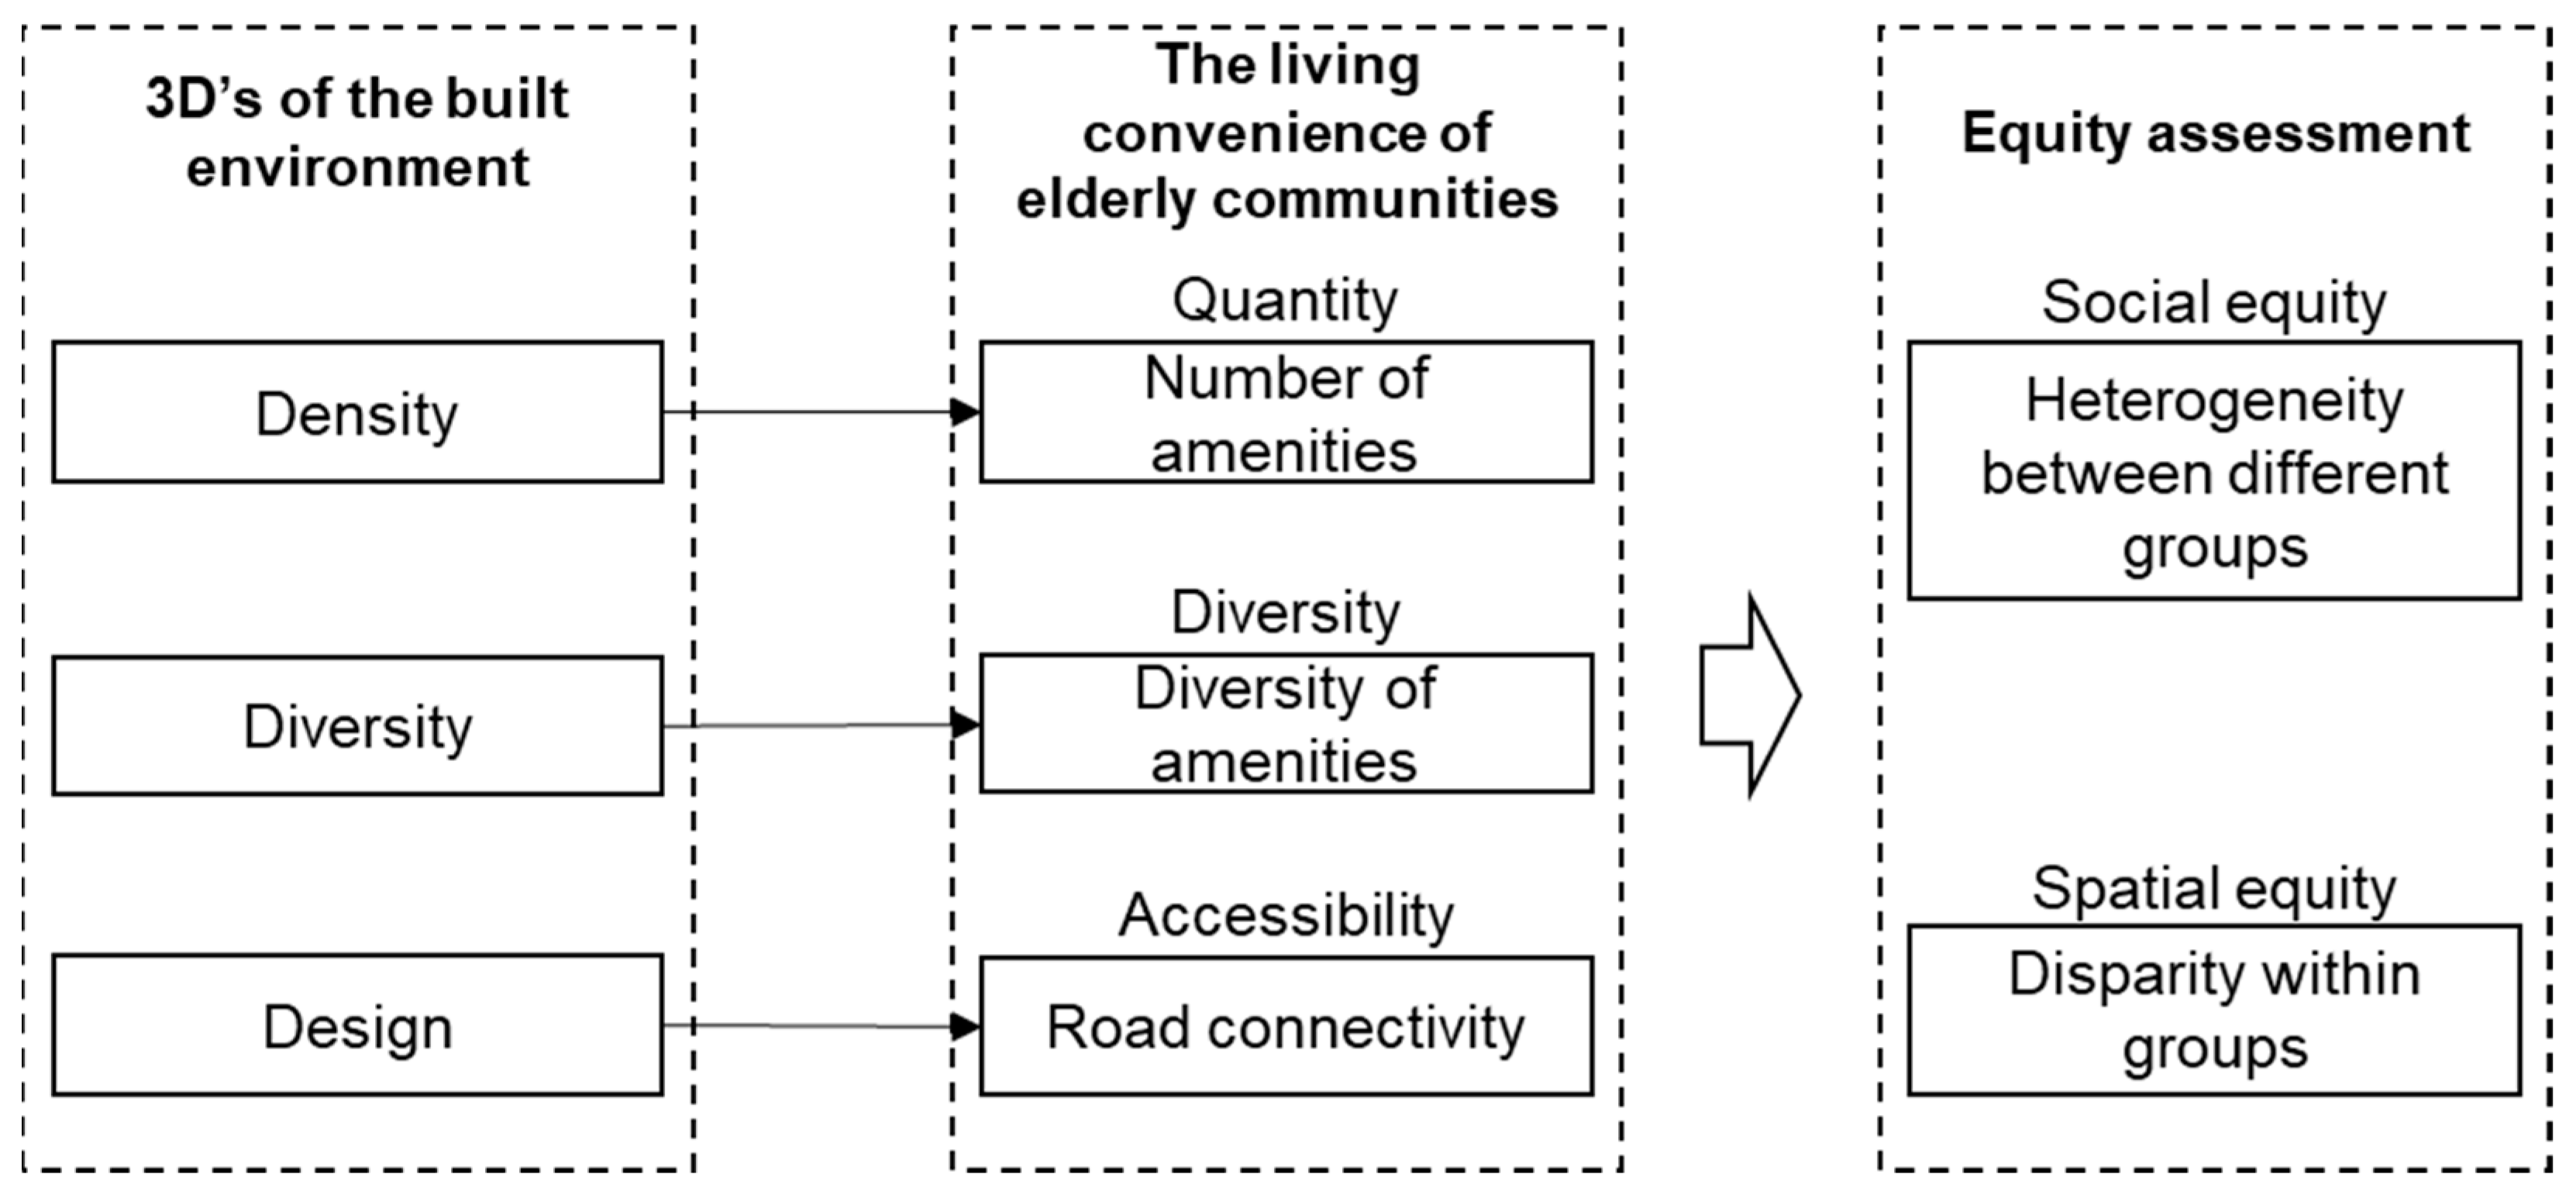
2.3. Measures of Density, Diversity, and Design
2.4. Assessing Social and Spatial Equities
3. Results
3.1. Measurements of Density, Diversity, and Design
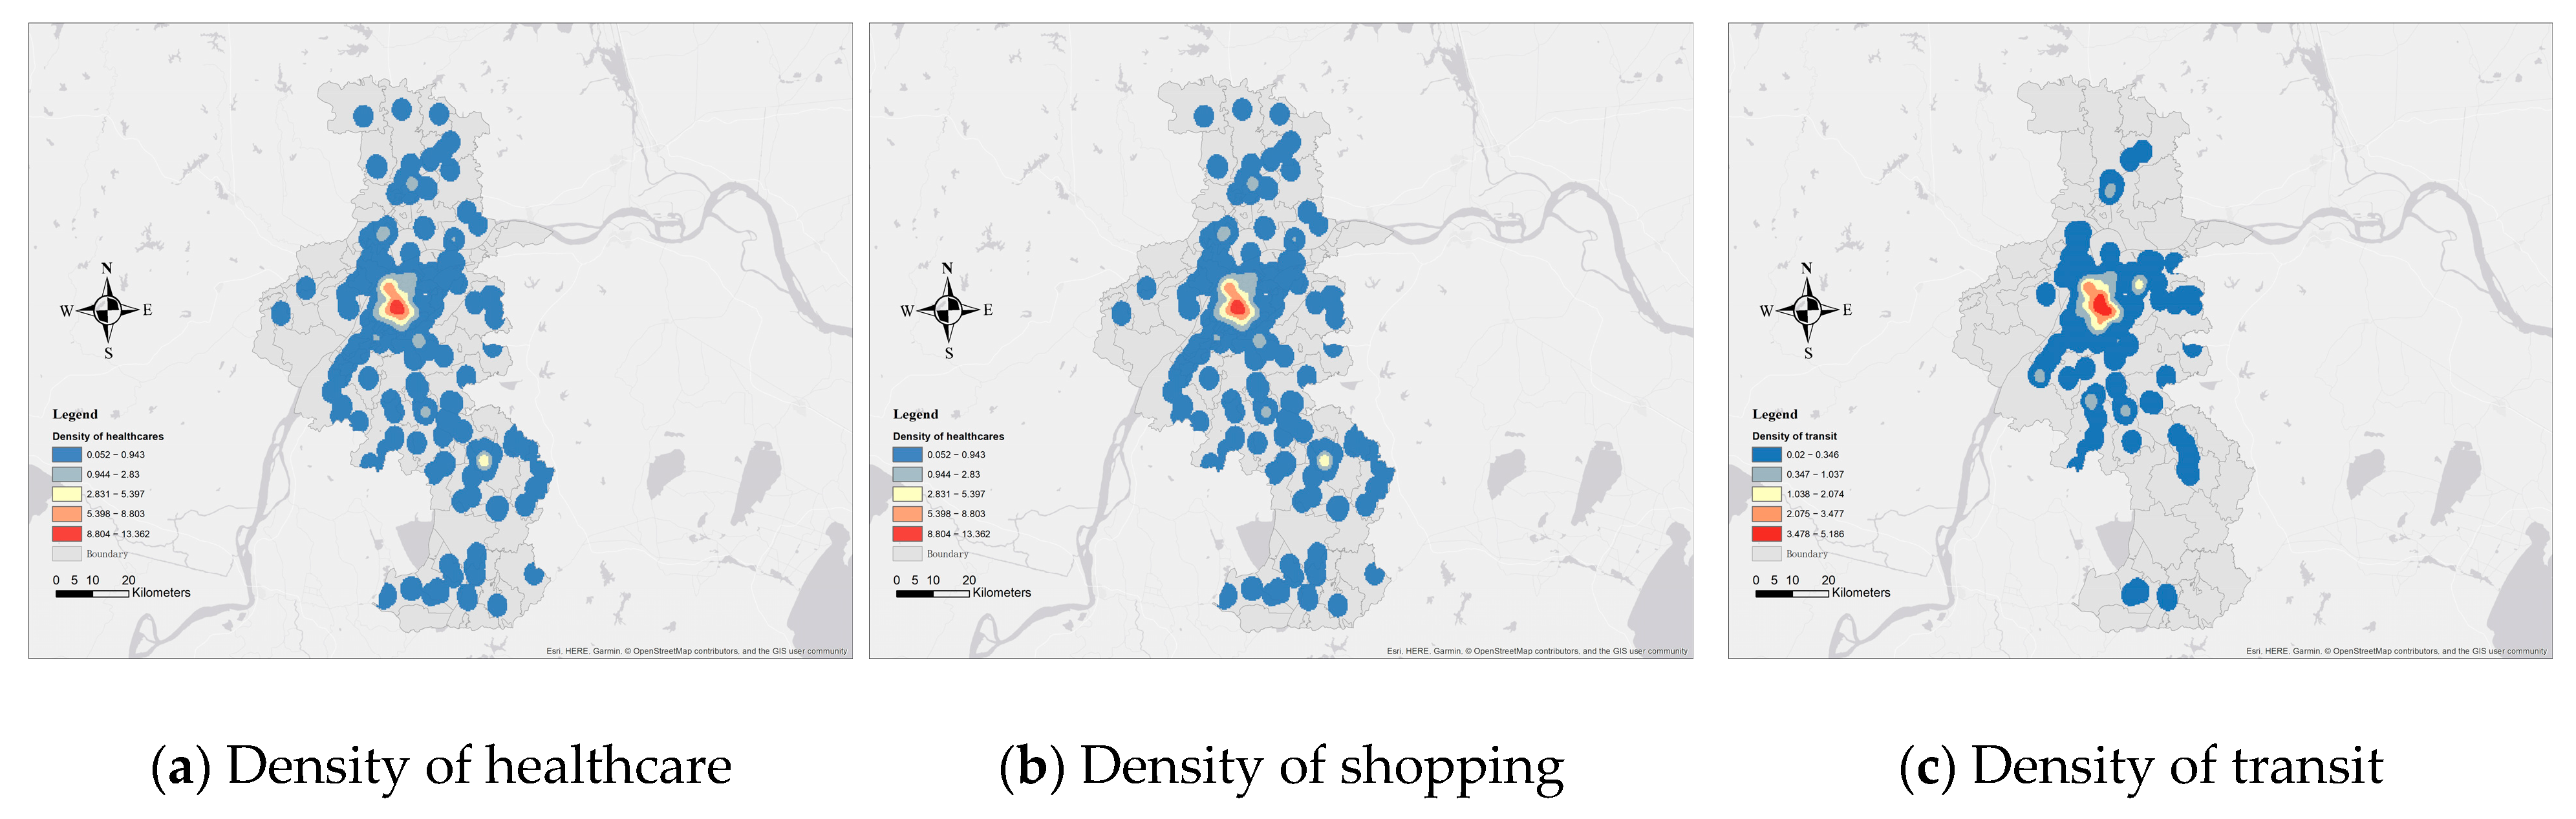
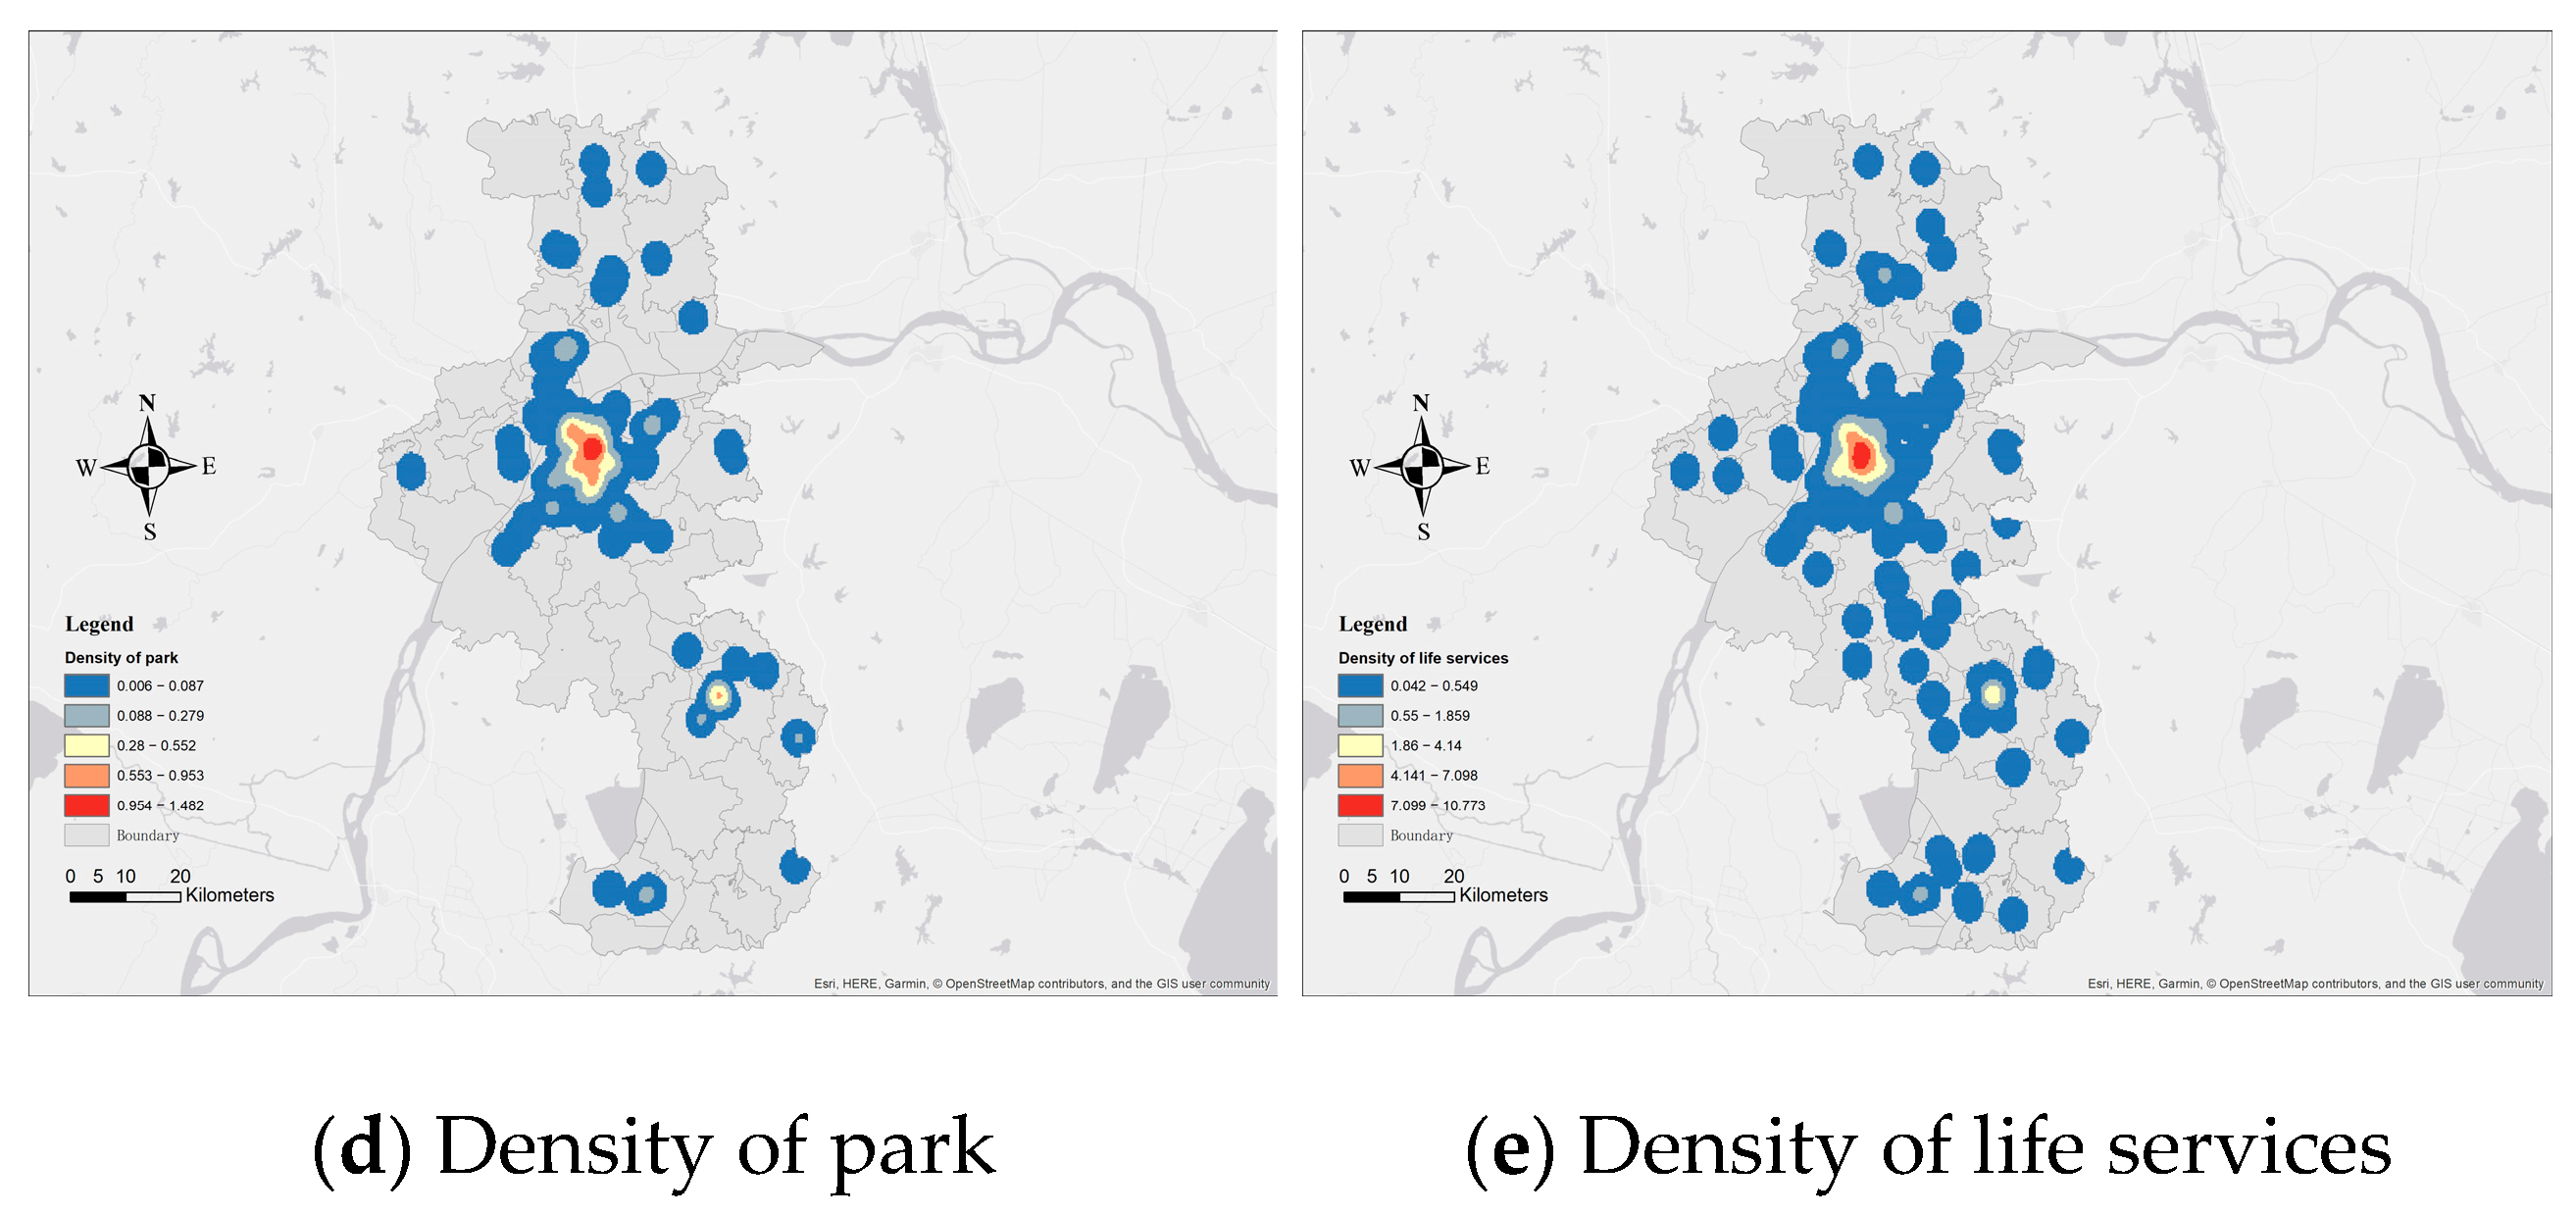
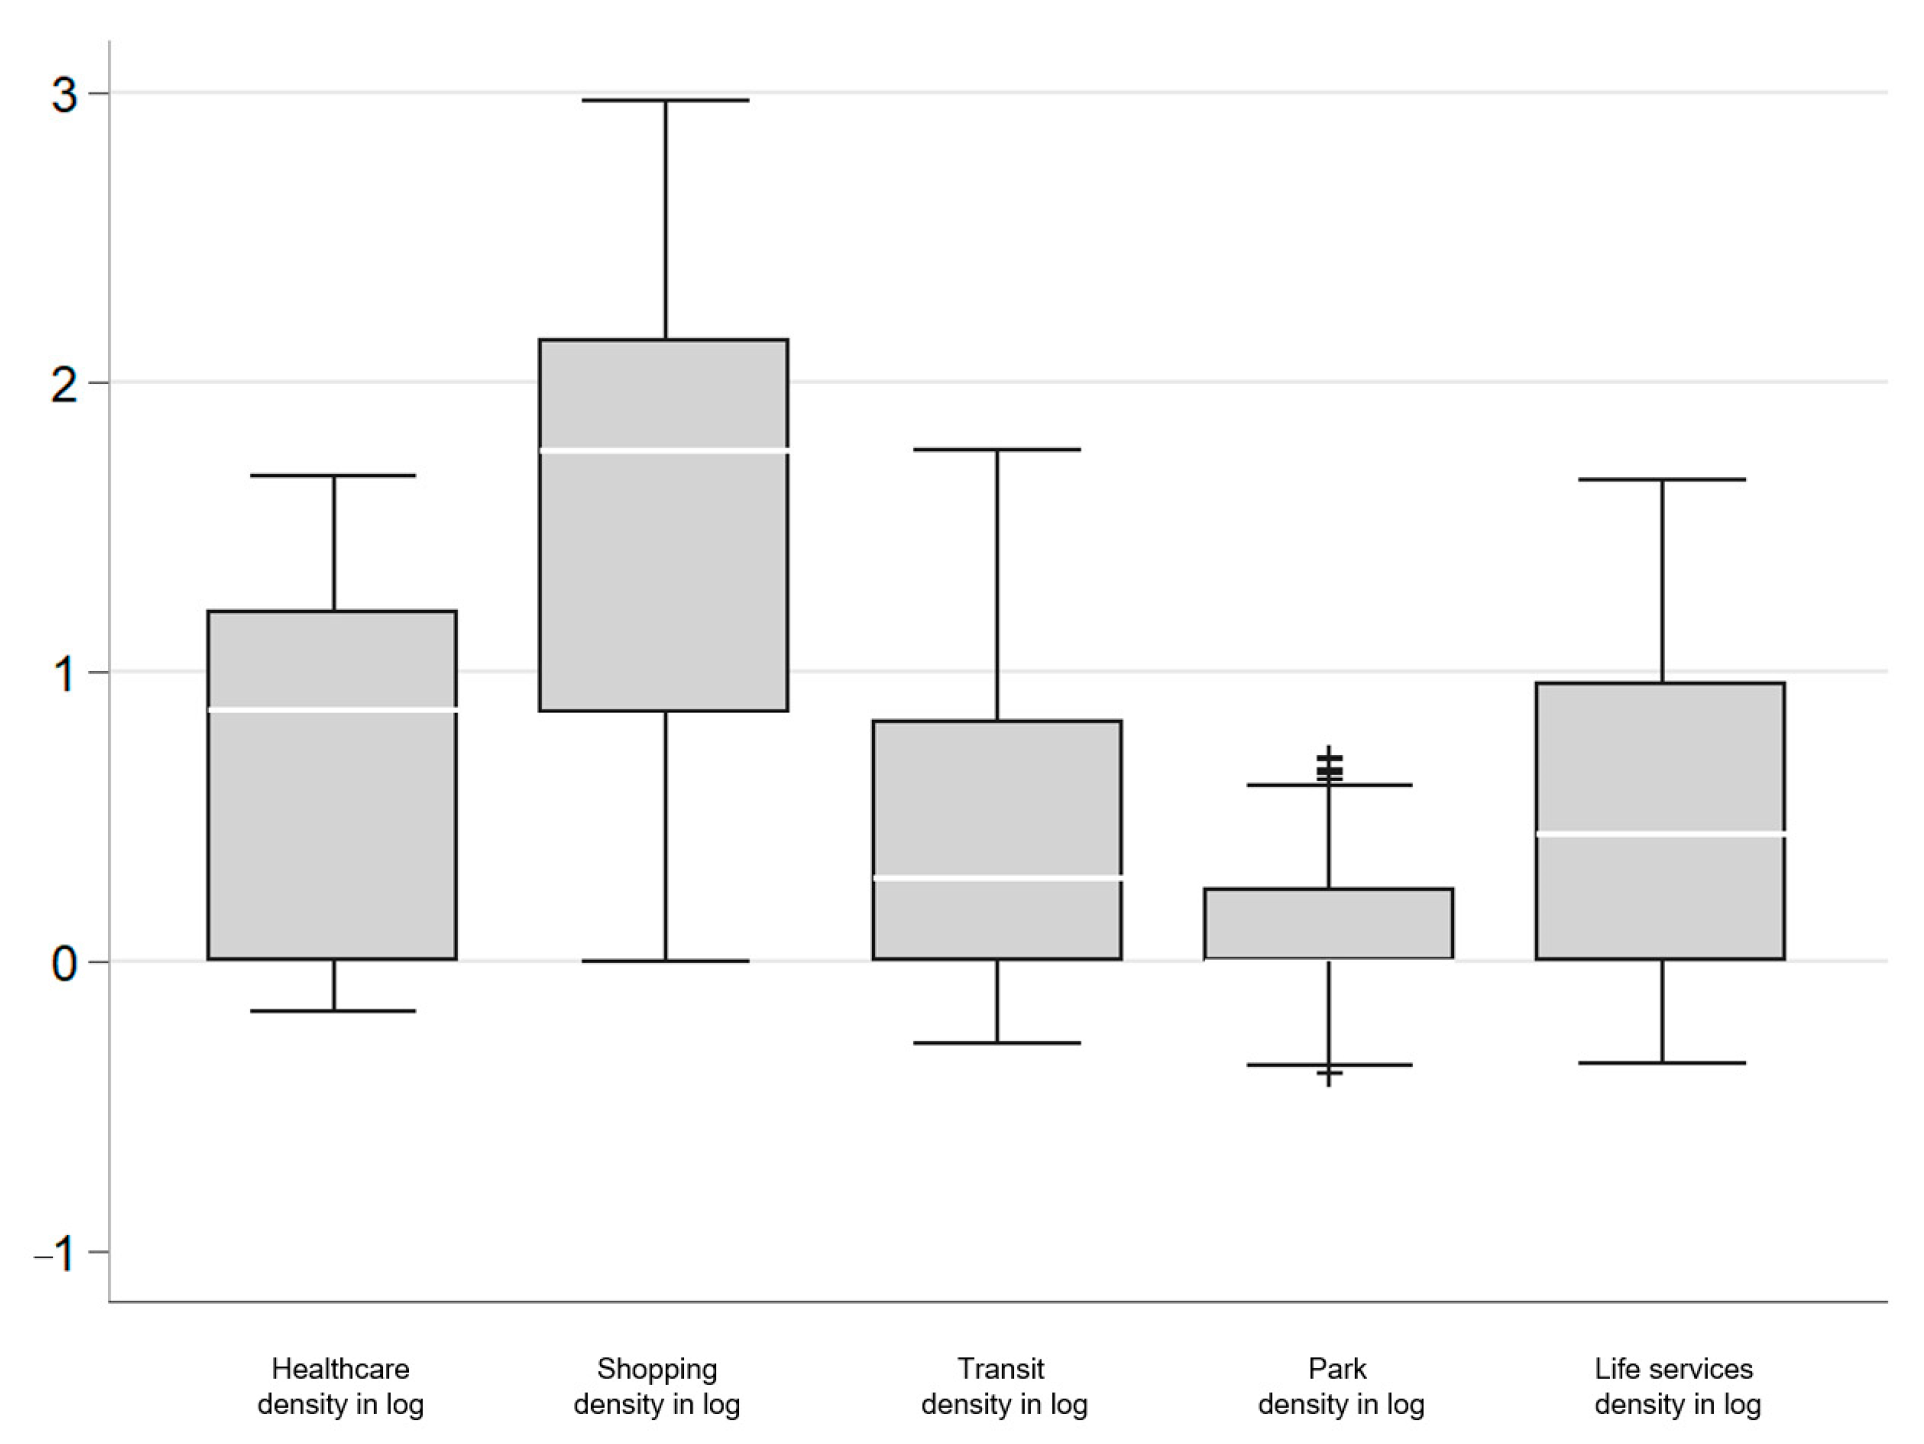
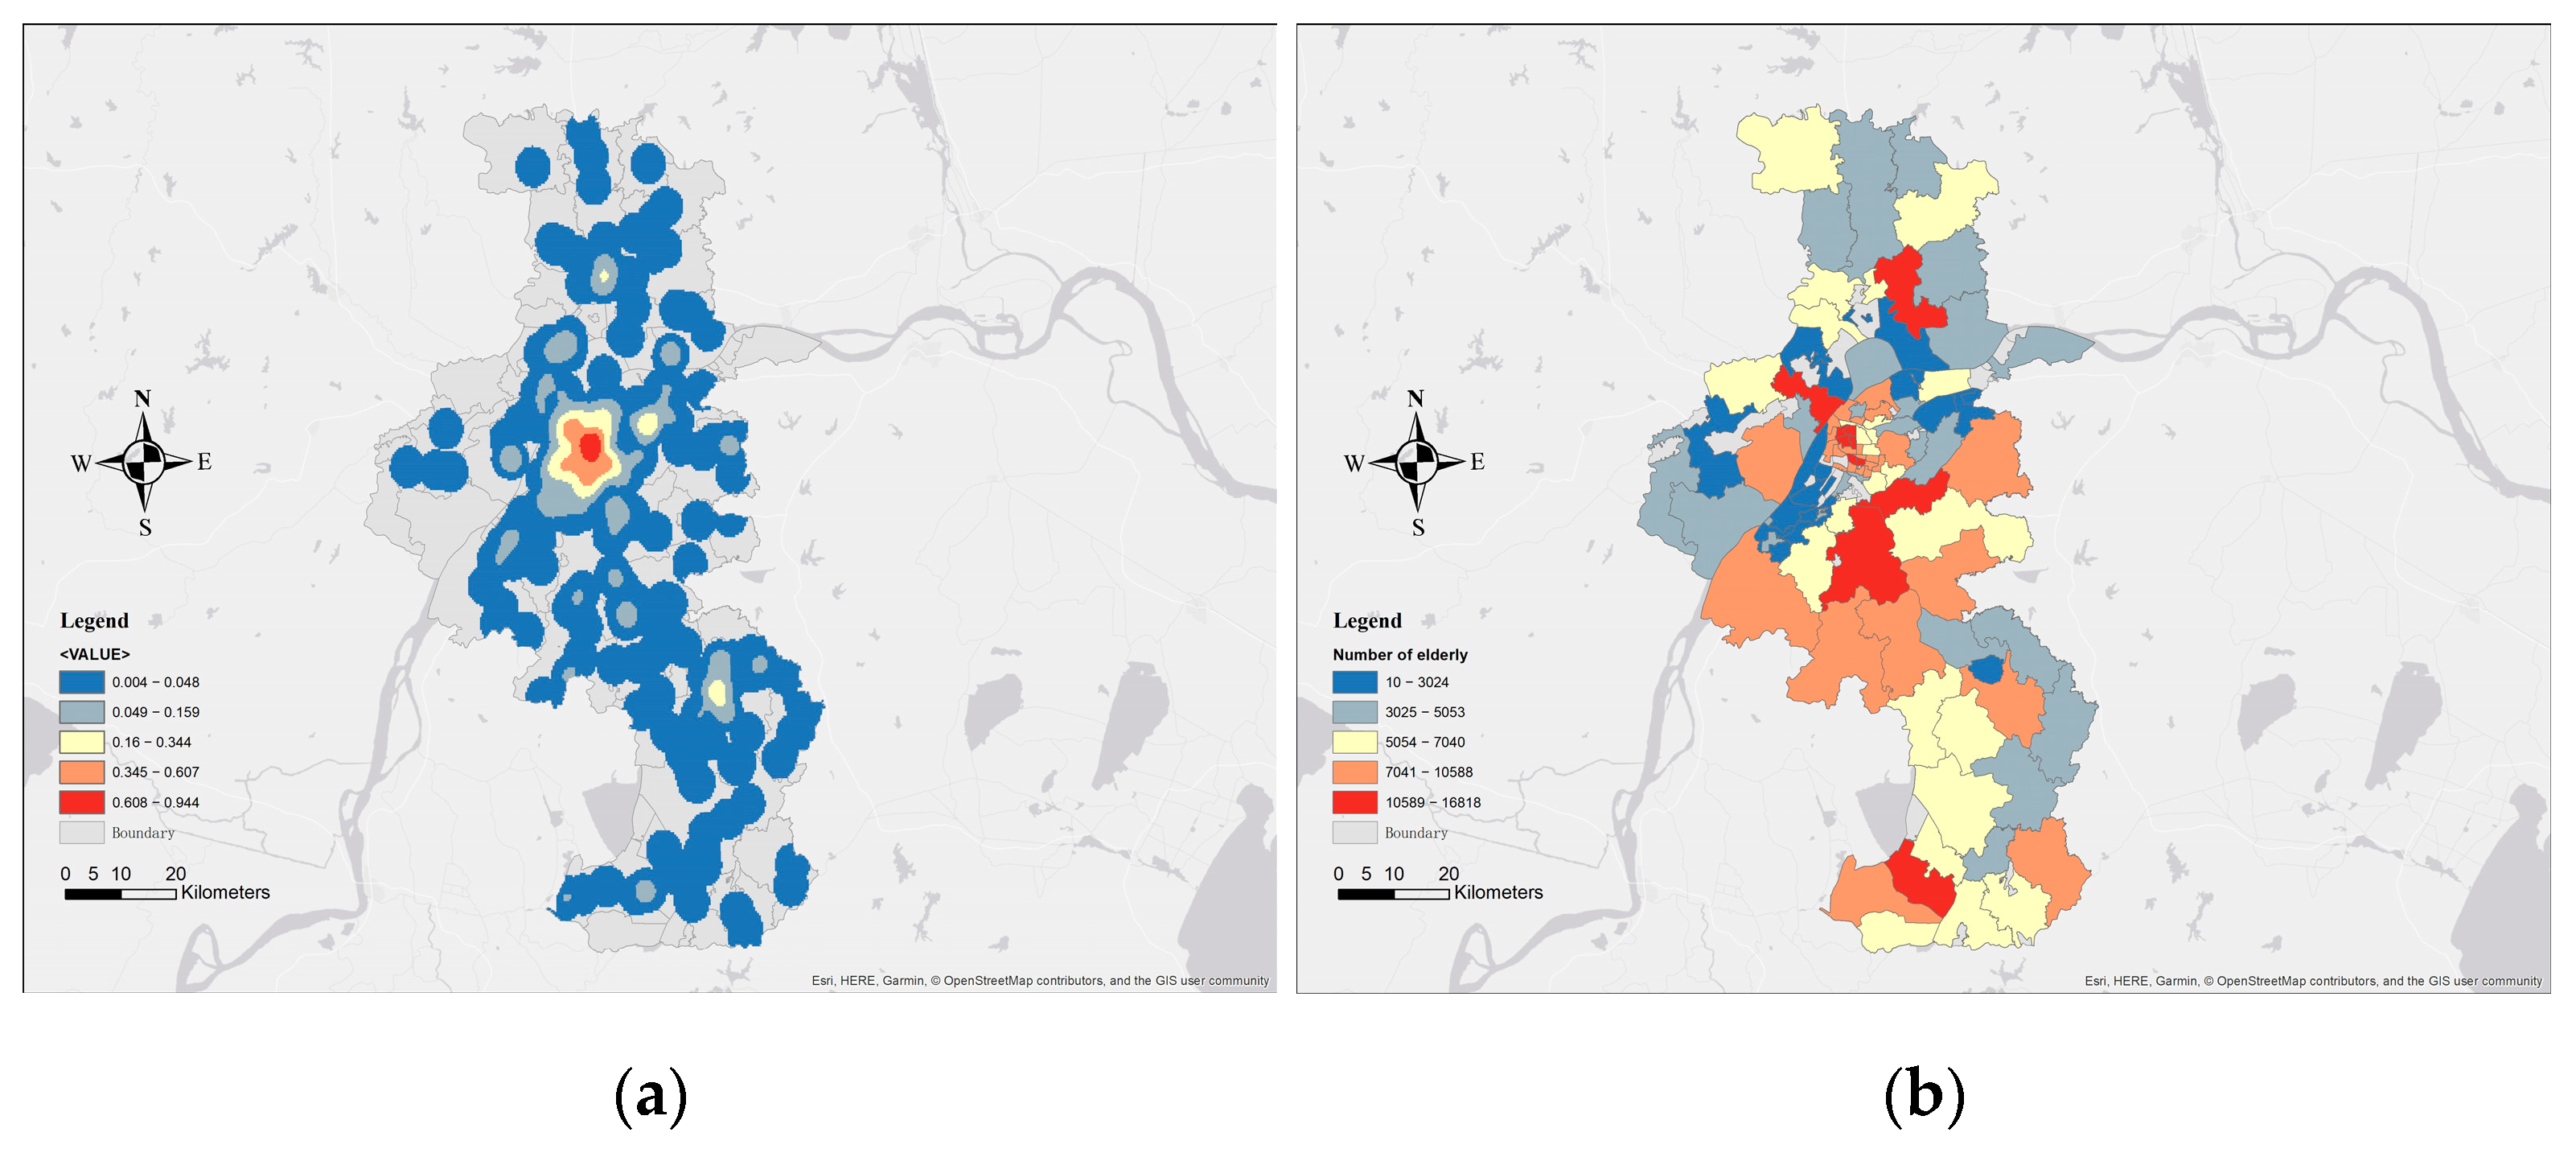
3.1.1. Density
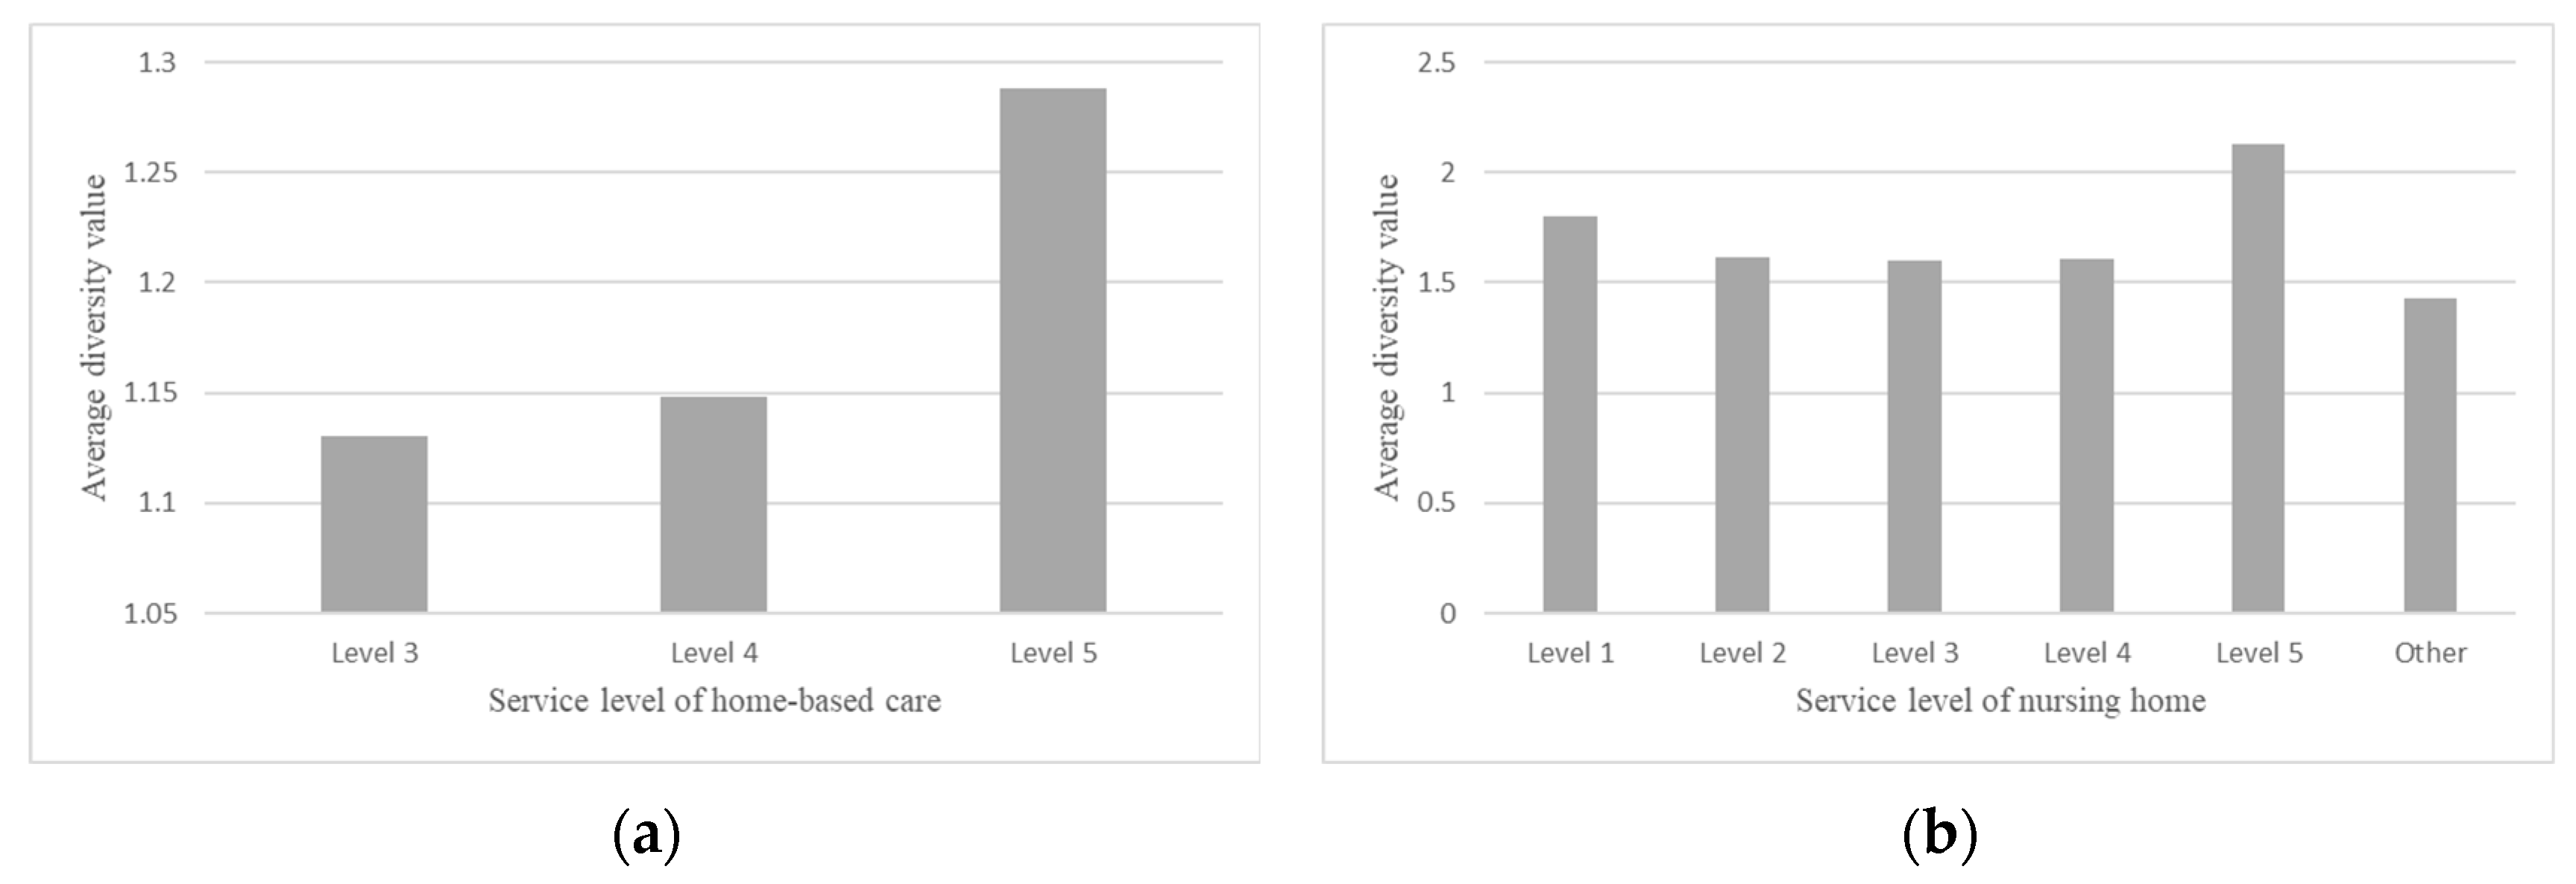
3.1.2. Diversity
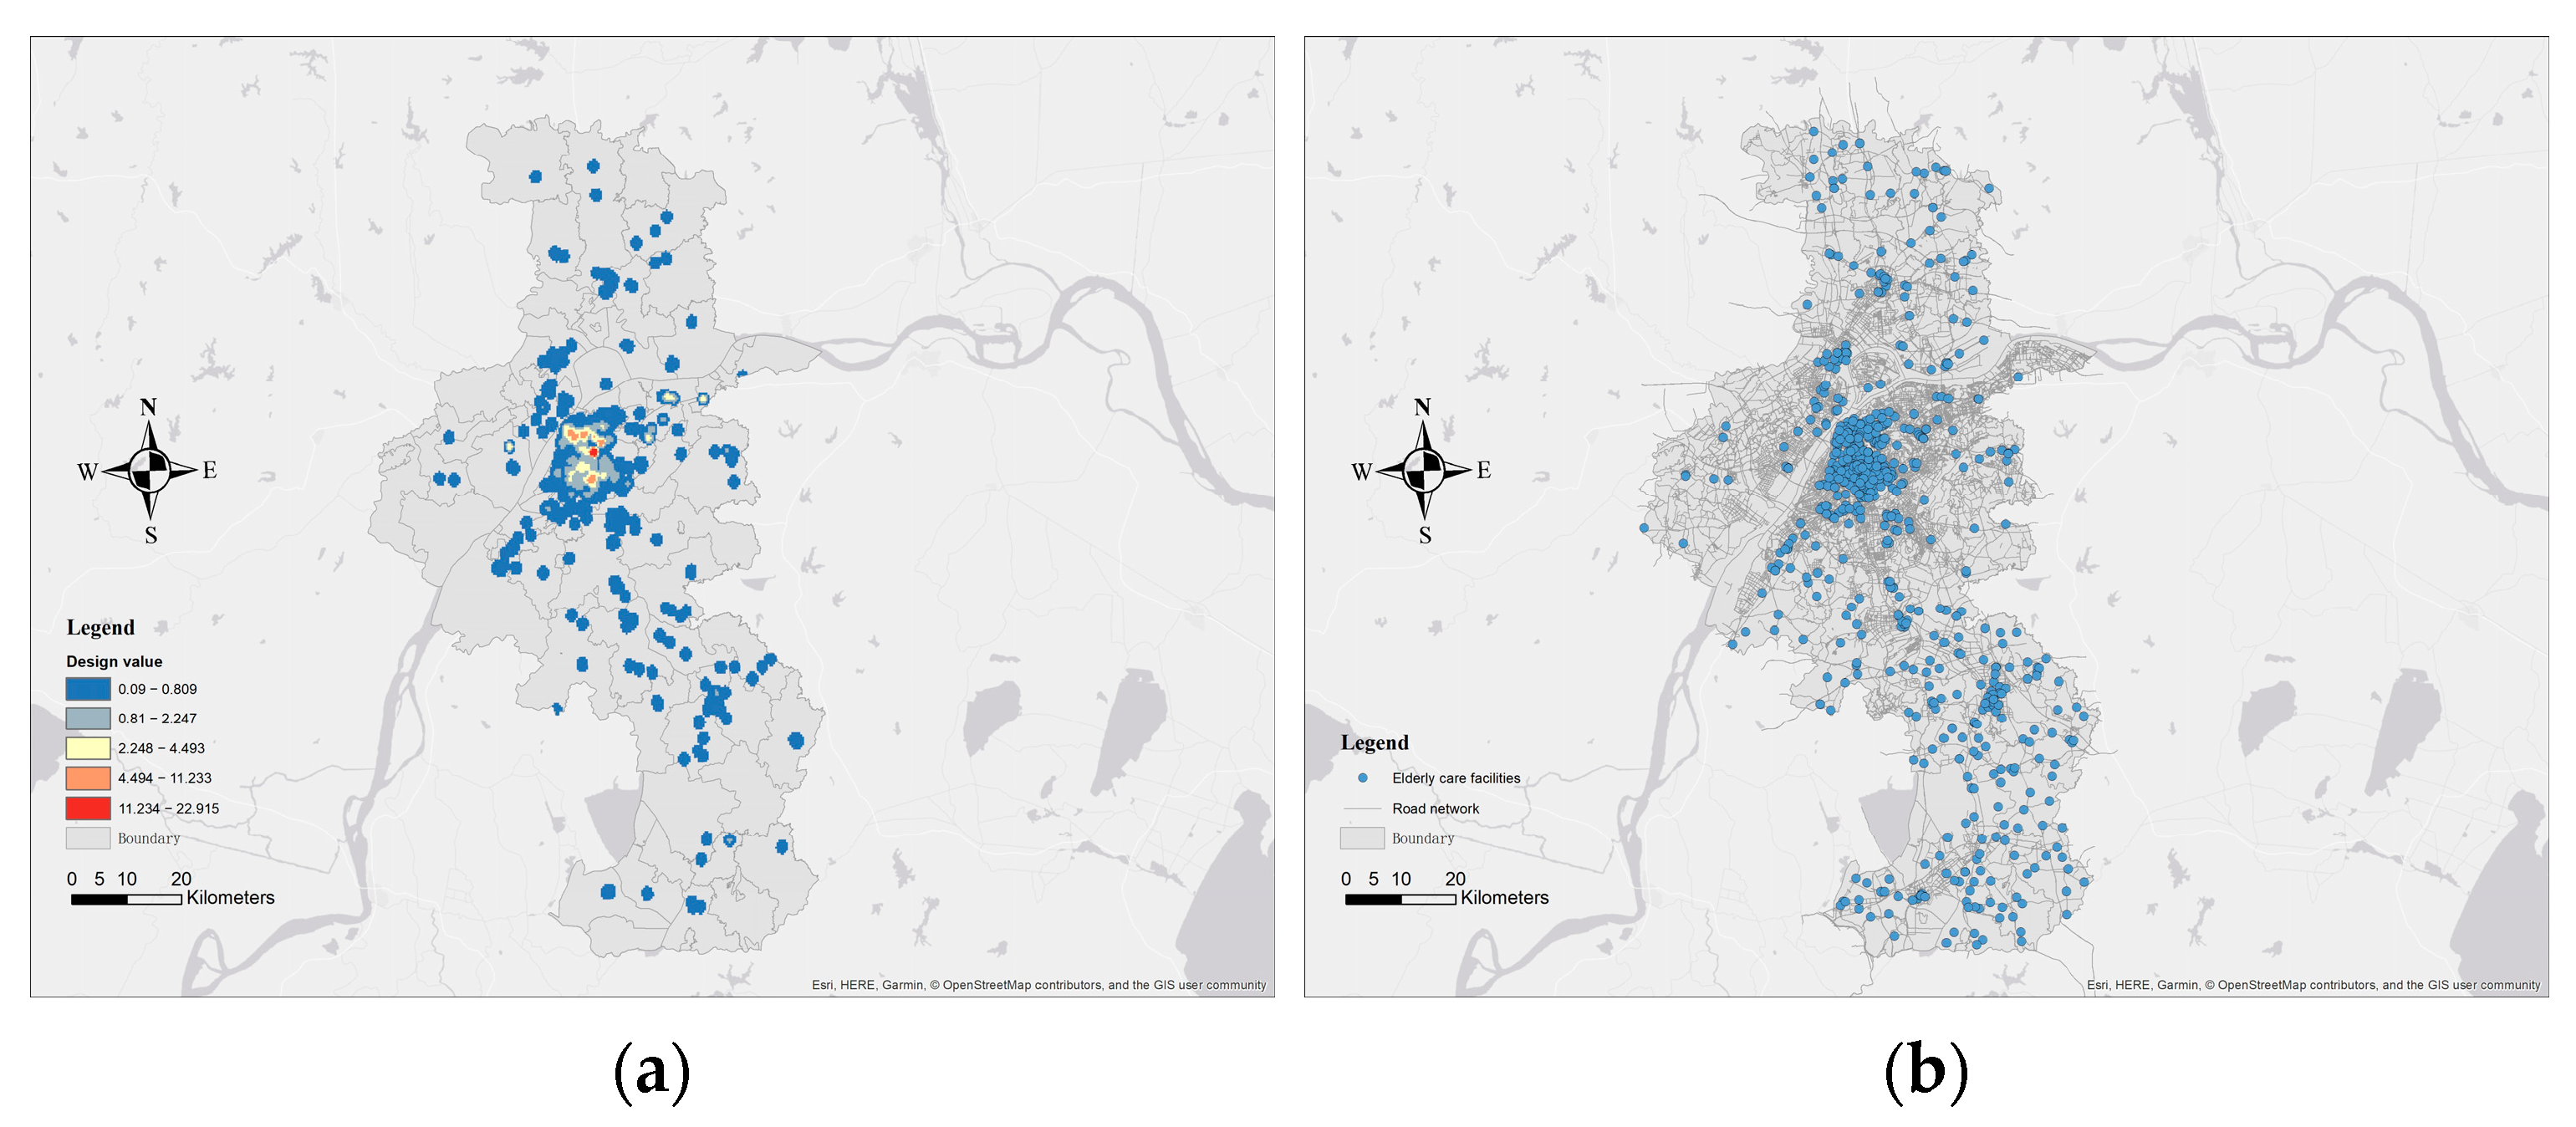
3.1.3. Design
3.2. Social and Spatial Equity Analysis
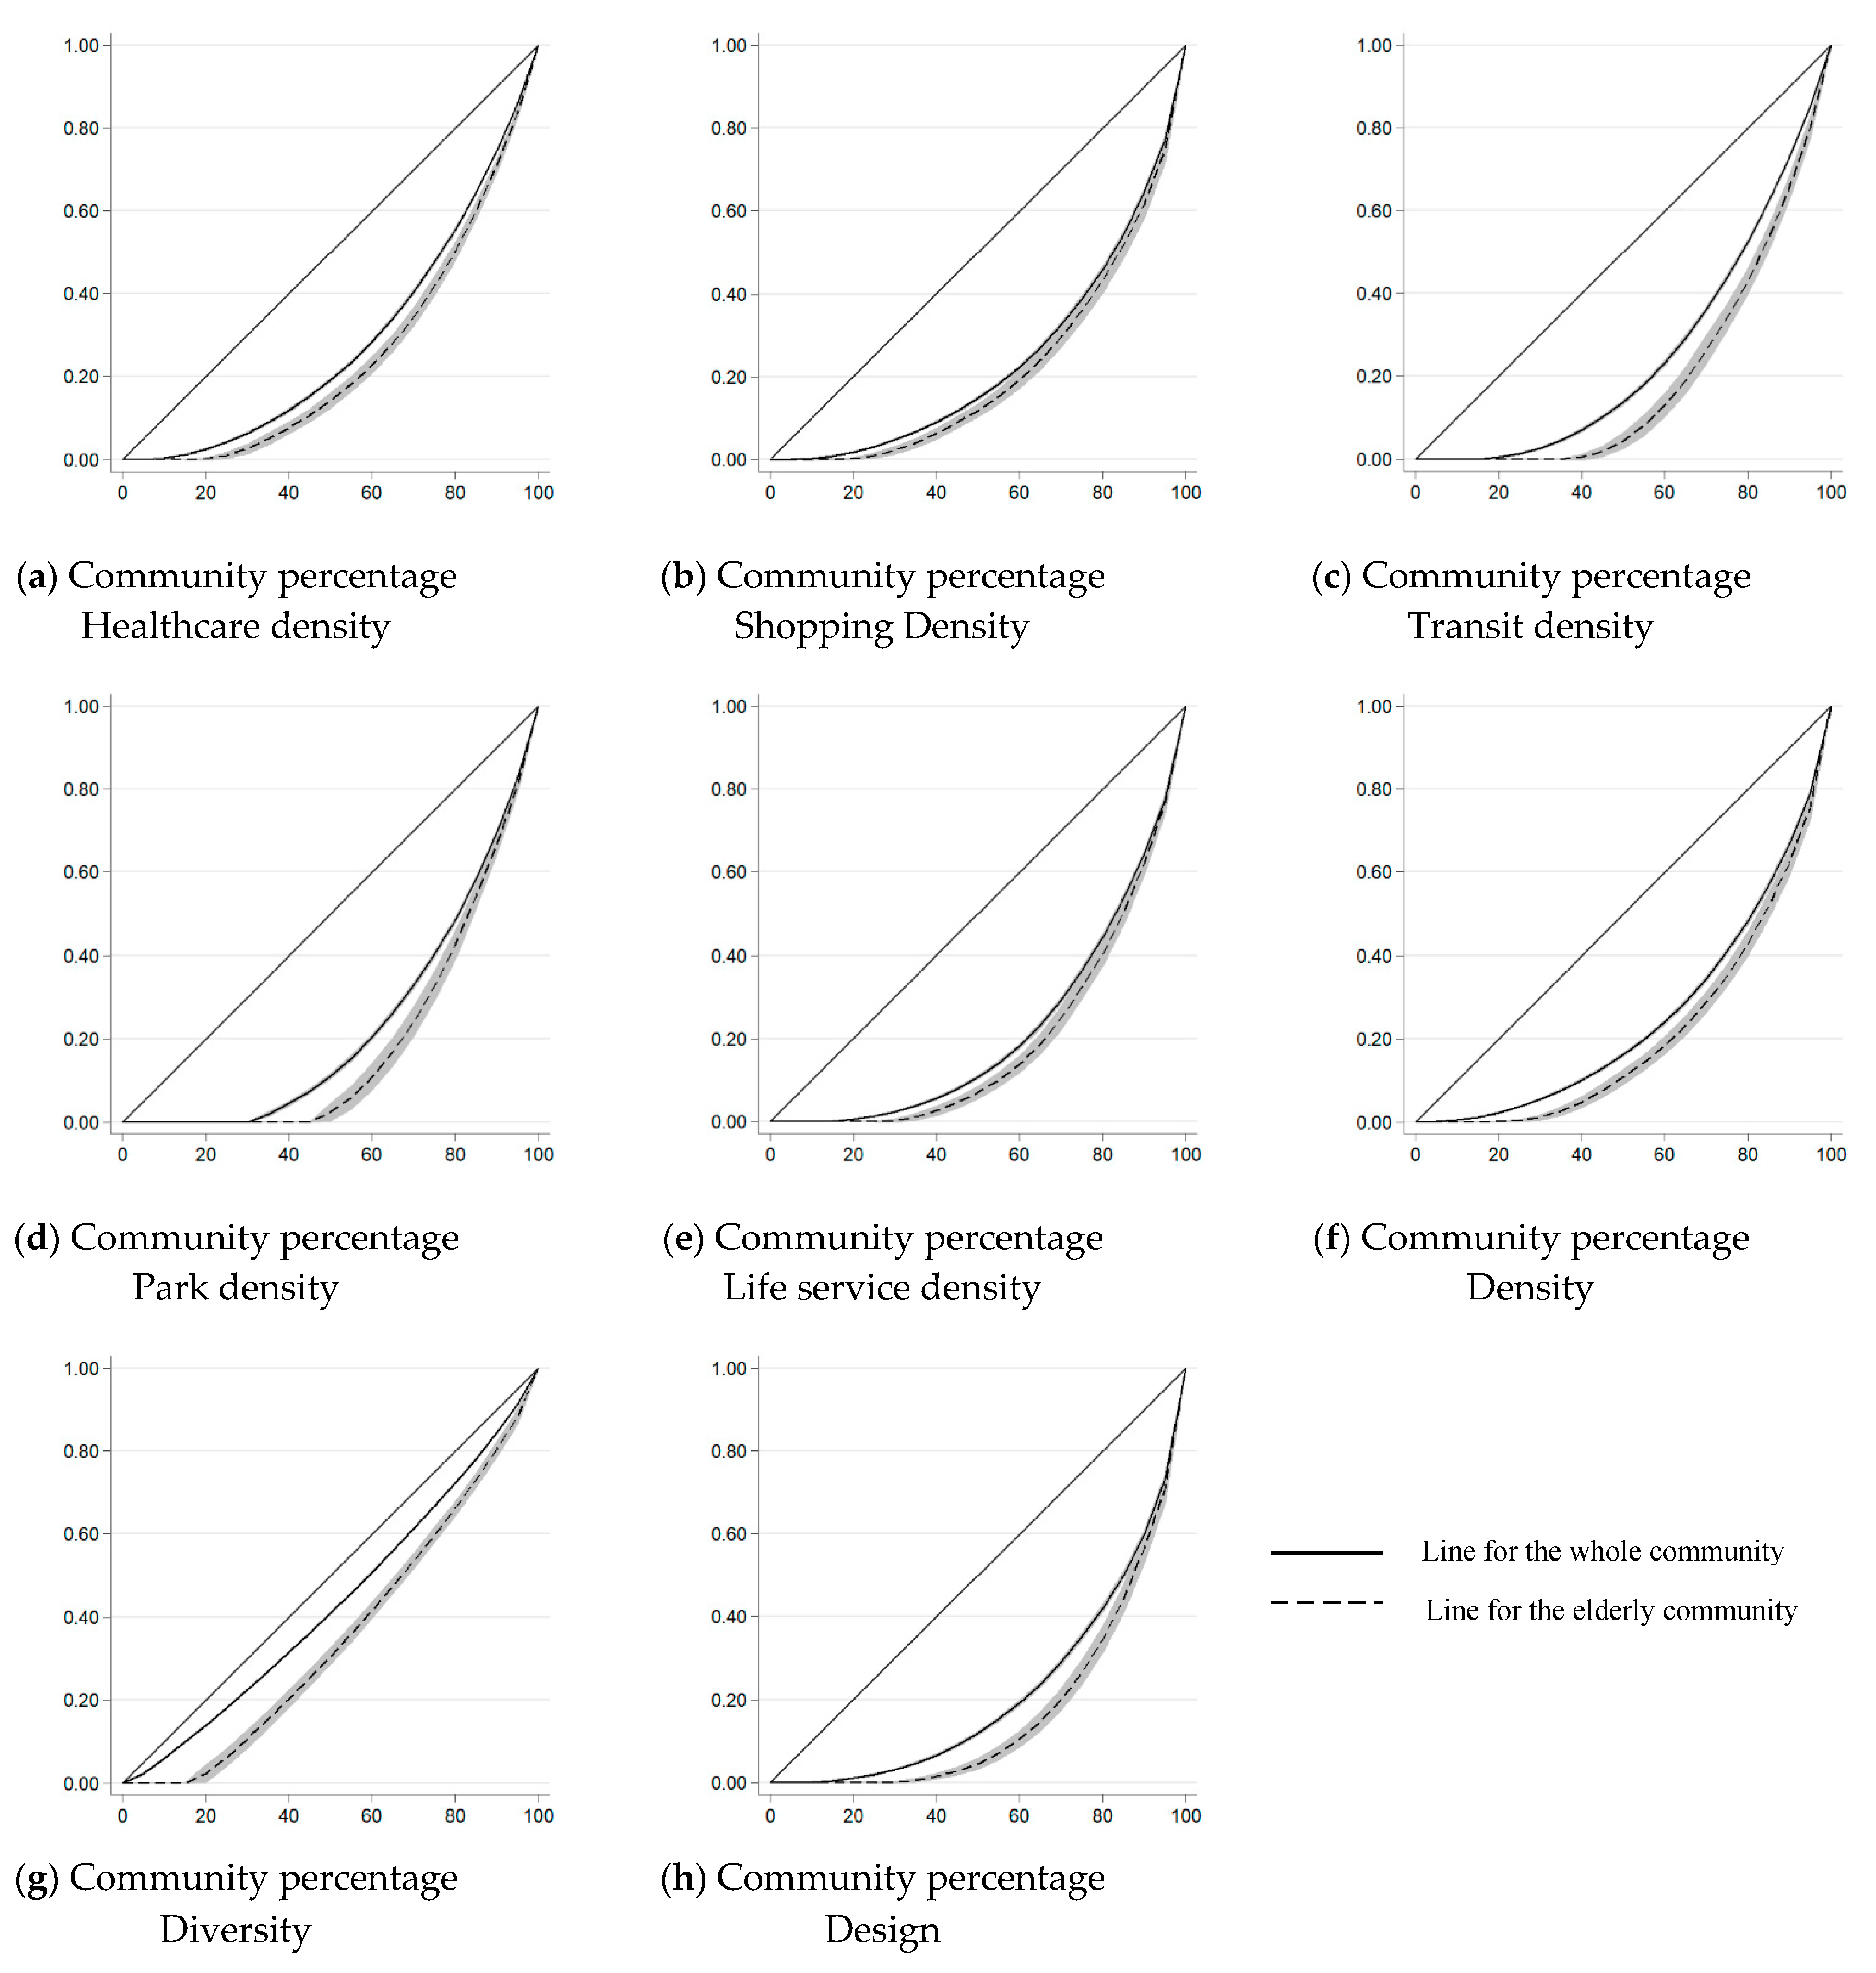
3.2.1. Social Equity Analysis
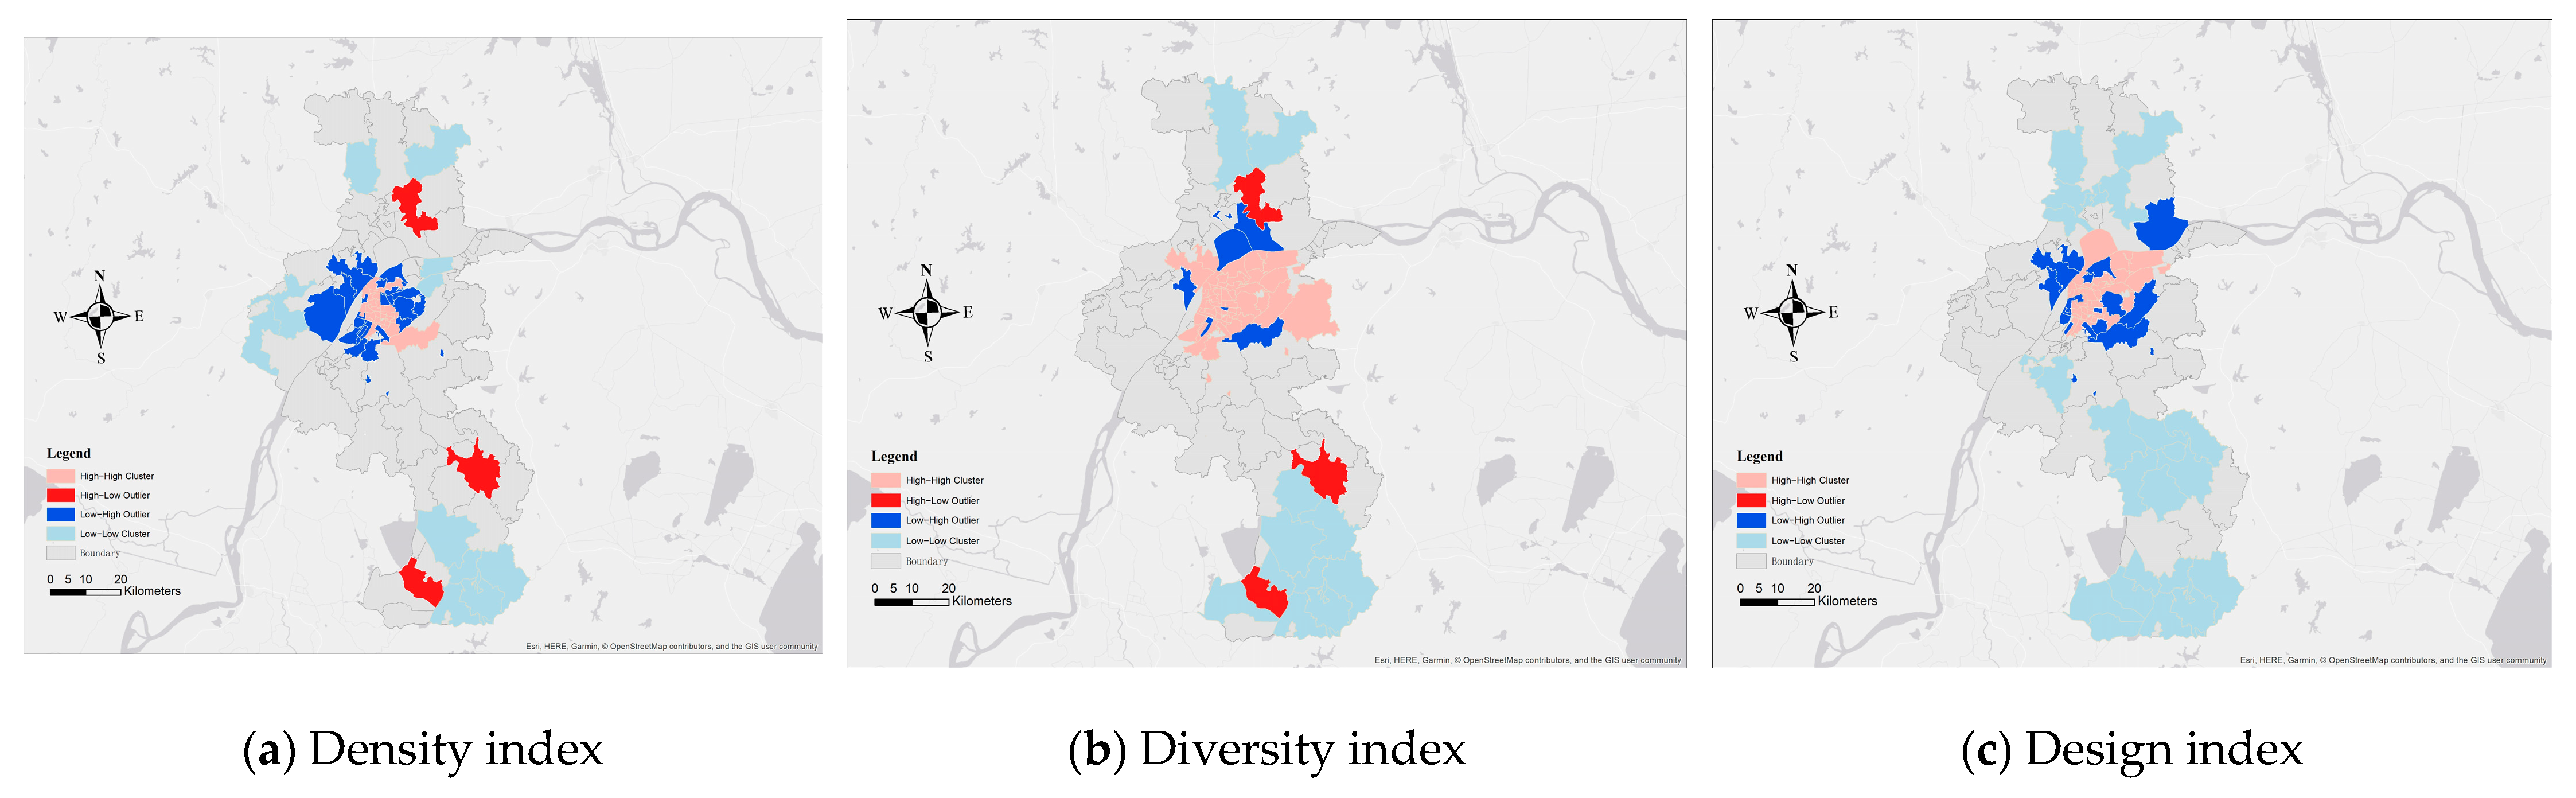
3.2.2. Spatial Equity Analysis
4. Discussion
5. Conclusions
- (1)
- The spatial patterns of the 3D features around elderly communities follow the “center-periphery” rules. The built environments of the elderly communities in the urban center are better than those in the periphery areas.
- (2)
- The social disparity exists between the elderly communities and the whole community. The built environments of the elderly communities are significantly different from those of the whole community, and the density, diversity, and design index are lower.
- (3)
- There is a spatial mismatch between the diversity of facilities, road connections, and the number of elderly. Towns located in the fringe area are with a high number of elderly, but with a low diversity and road connections.
Author Contributions
Funding
Institutional Review Board Statement
Informed Consent Statement
Data Availability Statement
Conflicts of Interest
References
- United Nations Department of Economic and Social Affairs, Population Division. World Population Prospects 2022: Summary of Results. UN DESA/POP/2022/TR/NO. 3. Available online: https://www.un.org/development/desa/pd/sites/www.un.org.development.desa.pd/files/wpp2022_summary_of_results.pdf (accessed on 24 October 2022).
- United Nations. The Sustainable Development Goals Report 2022; UN: New York, NY, USA, 2022; Available online: https://unstats.un.org/sdgs/report/2022/The-Sustainable-Development-Goals-Report-2022.pdf (accessed on 24 October 2022).
- Sweasey, R.; Skitmore, M. The use of formal project management processes in the procurement of Queensland aged care facilities. Int. J. Constr. Manag. 2007, 7, 43–56. [Google Scholar] [CrossRef]
- Glass, T.A.; Balfour, J.L. Neighborhoods, aging, and functional limitations. Neighborhoods Health 2003, 1, 303–334. [Google Scholar]
- Bhuyan, M.R.; Yuen, B. Older adults’ views of the connections between neighbourhood built environment and health in Singapore. J. Popul. Ageing 2022, 15, 279–299. [Google Scholar] [CrossRef]
- Lai, T.F.; Chang, C.S.; Liao, Y.; Hsueh, M.C.; Koohsari, M.J.; Shibata, A.; Oka, K. Does neighborhood built environment support older adults’ daily steps differ by time of day? J. Transp. Health 2021, 22, 101234. [Google Scholar] [CrossRef]
- Wong, P.H.; Kourtit, K.; Nijkamp, P. The ideal neighbourhoods of successful ageing: A machine learning approach. Health Place 2021, 72, 102704. [Google Scholar] [CrossRef]
- Stephens, C.; Szabó, Á.; Allen, J.; Alpass, F. Livable environments and the quality of life of older people: An ecological perspective. Gerontol. 2019, 59, 675–685. [Google Scholar] [CrossRef]
- Woolrych, R.; Sixsmith, J.; Duvvuru, J.; Portella, A.; Fang, M.L.; Menezes, D.; Henderson, J.; Fisher, J.; Lawthom, R. Cross-national perspectives on aging and place: Implications for age-friendly cities and communities. Gerontol. 2022, 62, 119–129. [Google Scholar] [CrossRef]
- Sixsmith, A.; Sixsmith, J. Ageing in place in the United Kingdom. Ageing Int. 2008, 32, 219–235. [Google Scholar] [CrossRef]
- Saelens, B.E.; Sallis, J.F.; Frank, L.D. Environmental correlates of walking and cycling: Findings from the transportation, urban design, and planning literatures. Ann. Behav. Med. 2003, 25, 80–91. [Google Scholar] [CrossRef]
- Handy, S.L.; Boarnet, M.G.; Ewing, R.; Killingsworth, R.E. How the built environment affects physical activity: Views from urban planning. Am. J. Prev. Med. 2002, 23, 64–73. [Google Scholar] [CrossRef]
- Michael, Y.L.; Green, M.K.; Farquhar, S.A. Neighborhood design and active aging. Health Place 2006, 12, 734–740. [Google Scholar] [CrossRef] [PubMed]
- Sugiyama, T.; Thompson, C.W.; Alves, S. Associations between neighborhood open space attributes and quality of life for older people in Britain. Environ. Behav. 2009, 41, 3–21. [Google Scholar] [CrossRef]
- World Health Organization. The Global Network for AgeFriendly Cities and Communities: Looking Back Over the Last Decade, Looking Forward to the Next. Available online: https://www.who.int/ageing/gnafcc-report-2018.pdf (accessed on 24 October 2022).
- Ryser, L.; Halseth, G. Resolving mobility constraints impeding rural seniors’ access to regionalized services. J. Aging Soc. Policy 2012, 24, 328–344. [Google Scholar] [CrossRef] [PubMed]
- He, S.Y.; Thøgersen, J.; Cheung, Y.H.; Alesia, H.Y. Ageing in a transit-oriented city: Satisfaction with transport, social inclusion and well-being. Transp. Policy 2020, 97, 85–94. [Google Scholar] [CrossRef]
- Finlay, J.; Franke, T.; McKay, H.; Sims-Gould, J. Therapeutic landscapes and wellbeing in later life: Impacts of blue and green spaces for older adults. Health Place 2015, 34, 97–106. [Google Scholar] [CrossRef] [PubMed]
- Gariepy, G.; Thombs, B.D.; Kestens, Y.; Kaufman, J.S.; Blair, A.; Schmitz, N. The neighbourhood built environment and trajectories of depression symptom episodes in adults: A latent class growth analysis. PLoS ONE 2015, 10, e0133603. [Google Scholar] [CrossRef]
- Liu, J.; Wei, W.; Peng, Q.; Xue, C.; Yang, S. The roles of life satisfaction and community recreational facilities in the relationship between loneliness and depression in older adults. Clin. Gerontol. 2022, 45, 376–389. [Google Scholar] [CrossRef]
- Lang, I.A.; Llewellyn, D.J.; Langa, K.M.; Wallace, R.B.; Melzer, D. Neighbourhood deprivation and incident mobility disability in older adults. Age Ageing 2008, 37, 403–410. [Google Scholar] [CrossRef] [Green Version]
- Cao, X.; Mokhtarian, P.L.; Handy, S.L. Neighborhood design and the accessibility of the elderly: An empirical analysis in Northern California. Int. J. Sustain. Transp. 2010, 4, 347–371. [Google Scholar] [CrossRef]
- Marois, G.; Lord, S.; Morency, C. A mixed logit model analysis of residential choices of the young-elderly in the Montreal metropolitan area. J. Hous. Econ. 2019, 44, 141–149. [Google Scholar] [CrossRef]
- Rosso, A.L.; Grubesic, T.H.; Auchincloss, A.H.; Tabb, L.P.; Michael, Y.L. Neighborhood amenities and mobility in older adults. Am. J. Epidemiol. 2013, 178, 761–769. [Google Scholar] [CrossRef] [PubMed]
- Clark, D.E.; Knapp, T.A.; White, N.E. Personal and location-specific characteristics and elderly interstate migration. Growth Chang. 1996, 27, 327–351. [Google Scholar] [CrossRef] [PubMed]
- Levasseur, M.; Généreux, M.; Bruneau, J.F.; Vanasse, A.; Chabot, É.; Beaulac, C.; Bédard, M.M. Importance of proximity to resources, social support, transportation and neighborhood security for mobility and social participation in older adults: Results from a scoping study. BMC Public Health 2015, 15, 503. [Google Scholar] [CrossRef] [PubMed] [Green Version]
- Damron-Rodriguez, J.; Wallace, S.; Kington, R. Service utilization and minority elderly: Appropriateness, accessibility and acceptability. Gerontol. Geriatr. Educ. 1995, 15, 45–64. [Google Scholar] [CrossRef]
- Somenahalli, S.; Shipton, M. Examining the distribution of the elderly and accessibility to essential services. Procedia Soc. Behav. Sci. 2013, 104, 942–951. [Google Scholar] [CrossRef] [Green Version]
- Guida, C.; Carpentieri, G. Quality of life in the urban environment and primary health services for the elderly during the COVID-19 pandemic: An application to the city of Milan (Italy). Cities 2021, 110, 103038. [Google Scholar] [CrossRef]
- Wu, H.C.; Tseng, M.H. Evaluating disparities in elderly community care resources: Using a geographic accessibility and inequality index. Int. J. Environ. Res. Public Health 2018, 15, 1353. [Google Scholar] [CrossRef] [Green Version]
- Cheng, L.; Yang, M.; De Vos, J.; Witlox, F. Examining geographical accessibility to multi-tier hospital care services for the elderly: A focus on spatial equity. J. Transp. Health 2020, 19, 100926. [Google Scholar] [CrossRef]
- Du, M.; Zhao, S. An Equity Evaluation on Accessibility of Primary Healthcare Facilities by Using V2SFCA Method: Taking Fukuoka City, Japan, as a Case Study. Land 2022, 11, 640. [Google Scholar] [CrossRef]
- Huang, X.; Gong, P.; White, M. Study on Spatial Distribution Equilibrium of Elderly Care Facilities in Downtown Shanghai. Int. J. Environ. Res. Public Health 2022, 19, 7929. [Google Scholar] [CrossRef]
- Yin, C.; He, Q.; Liu, Y.; Chen, W.; Gao, Y. Inequality of public health and its role in spatial accessibility to medical facilities in China. Appl. Geogr. 2018, 92, 50–62. [Google Scholar] [CrossRef]
- Litman, T. Evaluating Transportation Equity; Victoria, B.C., Ed.; Victoria Transport Policy Institute: Victoria, BC, Canada, 1999. [Google Scholar]
- Arranz-López, A.; Soria-Lara, J.A.; Pueyo-Campos, Á. Social and spatial equity effects of non-motorised accessibility to retail. Cities 2019, 86, 71–82. [Google Scholar] [CrossRef] [Green Version]
- Cheng, T.; Liu, C.; Yang, H.; Wang, N.; Liu, Y. From service capacity to spatial equity: Exploring a multi-stage decision-making approach for optimizing elderly-care facility distribution in the city centre of Tianjin, China. Sustain. Cities Soc. 2022, 85, 104076. [Google Scholar] [CrossRef]
- Kim, D.; Park, J. Assessing Social and Spatial Equity of Neighborhood Retail and Service Access in Seoul, South Korea. Sustainability 2020, 12, 8537. [Google Scholar] [CrossRef]
- Cervero, R.; Kockelman, K. Travel demand and the 3Ds: Density, diversity, and design. Transp. Res. Part D Transp. Environ. 1997, 2, 199–219. [Google Scholar] [CrossRef]
- 2021 National Old-Age Development Bulletin. Available online: http://www.nhc.gov.cn/lljks/pqt/202110/c794a6b1a2084964a7ef45f69bef5423.shtml (accessed on 24 October 2022).
- Liu, J.E.; Tian, J.Y.; Yue, P.; Wang, Y.L.; Du, X.P.; Chen, S.Q. Living experience and care needs of Chinese empty-nest elderly people in urban communities in Beijing, China: A qualitative study. Int. J. Nurs. Sci. 2015, 2, 15–22. [Google Scholar] [CrossRef] [Green Version]
- Guy Olivier Faure. Chinese Society and its New Emerging Culture. J. Contemp. China 2008, 17, 469–491. [Google Scholar] [CrossRef]
- Yi, J.; Lu, D.; Deng, Y. The future of social elderly care in China: From the perspective of service-oriented government. J. Serv. Sci. Manag. 2016, 9, 211. [Google Scholar] [CrossRef] [Green Version]
- Jiangsu Provincial Bureau of Statistics. Available online: http://tj.jiangsu.gov.cn/art/2021/5/18/art_85767_10520838.html (accessed on 24 October 2022).
- Information on Elderly Care Institutions in 2021. Available online: http://mzj.nanjing.gov.cn/njsmzj/ztzl/njylfw/yljgxx/202112/t20211229_3245914.html (accessed on 24 October 2022).
- Kim, Y.A.; Hipp, J.R. Density, diversity, and design: Three measures of the built environment and the spatial patterns of crime in street segments. J. Crim. Justice 2021, 77, 101864. [Google Scholar] [CrossRef]
- Prins, R.G.; Pierik, F.; Etman, A.; Sterkenburg, R.P.; Kamphuis, C.B.; Van Lenthe, F.J. How many walking and cycling trips made by elderly are beyond commonly used buffer sizes: Results from a GPS study. Health Place 2014, 27, 127–133. [Google Scholar] [CrossRef] [Green Version]
- Sevtsuk, A.; Mekonnen, M. Urban network analysis. Rev. Int. Géomatiquen 2012, 287, 305. [Google Scholar]
- Ho, R. Handbook of Univariate and Multivariate Data Analysis and Interpretation with SPSS; Chapman and Hall/CRC: New York, NY, USA, 2006. [Google Scholar]
- Lorenz, M.O. Methods of measuring the concentration of wealth. Publ. Am. Stat. Assoc. 1905, 9, 209–219. [Google Scholar] [CrossRef]
- Gini, C. Variabilità e mutabilità: Contributo Allo Studio Delle Distribuzioni e Delle Relazioni Statistiche; Tipogr. di P. Cuppini: Bologna, Italy; Harvard University: Cambridge, MA, USA, 1912. [Google Scholar]
- Delbosc, A.; Currie, G. Using Lorenz curves to assess public transport equity. J. Transp. Geogr. 2011, 19, 1252–1259. [Google Scholar] [CrossRef]
- Guzman, L.A.; Oviedo, D.; Rivera, C. Assessing equity in transport accessibility to work and study: The Bogotá region. J. Transp. Geogr. 2017, 58, 236–246. [Google Scholar] [CrossRef]
- Lucas, K.; Van Wee, B.; Maat, K. A method to evaluate equitable accessibility: Combining ethical theories and accessibility-based approaches. Transportation 2016, 43, 473–490. [Google Scholar] [CrossRef] [Green Version]
- Neutens, T.; Schwanen, T.; Witlox, F.; De Maeyer, P. Equity of urban service delivery: A comparison of different accessibility measures. Environ. Plan. A 2010, 42, 1613–1635. [Google Scholar] [CrossRef]
- Anselin, L. Local indicators of spatial association—LISA. Geogr. Anal. 1995, 27, 93–115. [Google Scholar] [CrossRef]
- Nachar, N. The Mann-Whitney U: A test for assessing whether two independent samples come from the same distribution. Tutor. Quant. Methods Psychol. 2008, 4, 13–20. [Google Scholar] [CrossRef] [Green Version]
- Patterson, P.K.; Chapman, N.J. Urban form and older residents’ service use, walking, driving, quality of life, and neighborhood satisfaction. Am. J. Health Promot. 2004, 19, 45–52. [Google Scholar] [CrossRef]
- Papa, E.; Carpentieri, G.; Guida, C. Measuring walking accessibility to public transport for the elderly: The case of Naples. TeMA-J. Land Use Mobil. Environ. 2018, 105–116. [Google Scholar] [CrossRef]
- Zhang, F.; Li, D.; Ahrentzen, S.; Zhang, J. Assessing spatial disparities of accessibility to community-based service resources for Chinese older adults based on travel behavior: A city-wide study of Nanjing, China. Habitat Int. 2019, 88, 101984. [Google Scholar] [CrossRef]
- Bauman, A.; Merom, D.; Bull, F.C.; Buchner, D.M.; Fiatarone Singh, M.A. Updating the evidence for physical activity: Summative reviews of the epidemiological evidence, prevalence, and interventions to promote “active aging”. Gerontol. 2016, 56 (Suppl. S2), S268–S280. [Google Scholar] [CrossRef] [PubMed] [Green Version]
- Evenson, K.R.; Jones, S.A.; Holliday, K.M.; Cohen, D.A.; McKenzie, T.L. Park characteristics, use, and physical activity: A review of studies using SOPARC (System for Observing Play and Recreation in Communities). Prev. Med. 2016, 86, 153–166. [Google Scholar] [CrossRef] [PubMed] [Green Version]
- Richard, L.; Gauvin, L.; Gosselin, C.; Laforest, S. Staying Connected: Neighbourhood Correlates of Social Participation among Older Adults Living in an Urban Environmental in Montreal, Quebec. Health Promot. Int. 2009, 24, 46–57. [Google Scholar] [CrossRef] [Green Version]
- Yıldız, S.; Kıvrak, S.; Gültekin, A.B.; Arslan, G. Built environment design-social sustainability relation in urban renewal. Sustain. Cities Soc. 2020, 60, 102173. [Google Scholar] [CrossRef]
- Shirazi, M.R. Mapping neighbourhood outdoor activities: Space, time, gender and age. J. Urban Des. 2019, 24, 715–737. [Google Scholar] [CrossRef]
- Kerr, J.; Rosenberg, D.; Frank, L. The role of the built environment in healthy aging: Community design, physical activity, and health among older adults. J. Plan. Lit. 2012, 27, 43–60. [Google Scholar] [CrossRef]
- Marois, G.; Lord, S.; Negron-Poblete, P. The residential mobility of seniors among different residential forms: Analysis of metropolitan and rural issues for six contrasted regions in Québec, Canada. J. Hous. Elder. 2018, 32, 73–98. [Google Scholar] [CrossRef]
- Patterson, Z.; Saddier, S.; Rezaei, A.; Manaugh, K. Use of the urban core index to analyze residential mobility: The case of seniors in Canadian metropolitan regions. J. Transp. Geogr. 2014, 41, 116–125. [Google Scholar] [CrossRef]


| Category | Description | |
|---|---|---|
| Elderly community | Community-based care and nursing home | |
| Public amenity | Healthcare facilities | Hospital, clinic, pharmacy |
| Shopping facilities | Shopping mall, supermarket | |
| Transit facilities | Bus station, metro station | |
| Park facilities | Park | |
| Life service facilities | Library, museum, bank, restaurant | |
| Road data | Road network from Open Street Map | |
| Census data | From the 6th national census of population dataset |
| 3Ds Features | Average Value | Mean Difference to Value of the Whole Community (%) | F | |
|---|---|---|---|---|
| Density | Healthcare facility | 10.587 | −21.810 | 36.14 *** |
| Shopping facility | 107.281 | −18.871 | 13.34 *** | |
| Transit facility | 4.279 | −20.355 | 24.35 *** | |
| Park facility | 1.026 | −12.866 | 8.88 *** | |
| Life service facility | 5.971 | −29.493 | 27.55 *** | |
| All facilities | 120.204 | −27.577 | 31.6 *** | |
| Diversity | 1.296 | −21.373 | 246.65 *** | |
| Design | 3.346 | −22.534 | 14.01 *** | |
| Variable | Number of Elderly | Mann–Whitney U Test | ||
|---|---|---|---|---|
| Cluster of High Value | Cluster of Low Value | Z | p Value | |
| Density | 9194.813 | 4244.158 | −5.358 | 0.000 *** |
| Diversity | 6702.758 | 5065.315 | −1.626 | 0.104 |
| Design | 6774.462 | 5827.619 | −1.315 | 0.189 |
| Healthcare facilities | 8419.658 | 4386.378 | −4.655 | 0.000 *** |
| Shopping facilities | 9257.871 | 4484.030 | −5.046 | 0.000 *** |
| Transit facilities | 7048.465 | 5473.257 | −1.945 | 0.052 ** |
| Park facilities | 7832.108 | 4787.793 | −3.052 | 0.002 *** |
| Life service facilities | 8418.313 | 4834.683 | −3.983 | 0.000 *** |
Publisher’s Note: MDPI stays neutral with regard to jurisdictional claims in published maps and institutional affiliations. |
© 2022 by the authors. Licensee MDPI, Basel, Switzerland. This article is an open access article distributed under the terms and conditions of the Creative Commons Attribution (CC BY) license (https://creativecommons.org/licenses/by/4.0/).
Share and Cite
Gu, Z.; Luo, X.; Chen, Y.; Liu, X.; Xiao, C.; Liang, Y. Density, Diversity, and Design: Evaluating the Equity of the Elderly Communities in Three Measures of the Built Environment. Land 2022, 11, 1976. https://doi.org/10.3390/land11111976
Gu Z, Luo X, Chen Y, Liu X, Xiao C, Liang Y. Density, Diversity, and Design: Evaluating the Equity of the Elderly Communities in Three Measures of the Built Environment. Land. 2022; 11(11):1976. https://doi.org/10.3390/land11111976
Chicago/Turabian StyleGu, Zongni, Xiaolong Luo, Yanru Chen, Xiaoman Liu, Chenrui Xiao, and Yifan Liang. 2022. "Density, Diversity, and Design: Evaluating the Equity of the Elderly Communities in Three Measures of the Built Environment" Land 11, no. 11: 1976. https://doi.org/10.3390/land11111976