


Ecological Sustainability at the Forest Landscape Level: A Bird Assemblage Perspective

Institute of Ecology and Earth Sciences, University of Tartu, J. Liivi 2, 50409 Tartu, Estonia
Land 2022, 11(11), 1965; https://doi.org/10.3390/land11111965
Submission received: 14 October 2022
/
Revised: 28 October 2022
/
Accepted: 31 October 2022
/
Published: 3 November 2022
(This article belongs to the Special Issue Diversifying Forest Landscape Management Approaches)
Abstract
:Maintaining landscape integrity in terms of ecological functions is a key principle of sustainable forest management. Bird assemblages use all parts of forest landscapes and provide an opportunity to analyze their broad-scale integrity in those regions where bird census data are of sufficient quality and detail. In this study, I modelled likely landscape-composition consequences of different scenarios of even-aged (clear-cutting-based) silviculture on breeding-bird assemblages. The models were parameterized using high-quality territory-mapping data from Estonia. I considered three approaches for obtaining the model parameters. Of these, (i) a formal analysis of rank-abundance curves was rejected due to the inconsistency of the curve shapes among habitat types. Two other approaches were used and complemented each other: (ii) smoothed forest-type specific functions of total assemblage densities along post-clear-cut succession, and (iii) empirical average densities of each species by forest type and age class (for species composition analyses). The modelling revealed a parallel loss of bird densities and, to a lesser extent, of species at shorter rotations; currently, this effect is disproportionately large on productive soils. For conserving the productive hotspots, the 30% protection target of the EU Biodiversity Strategy overperformed other scenarios. In all landscape settings, typologically representative old-forest reserves (even artificially drained stands) helped to mitigate rotational forestry. The potential of even-aged production forestry to host early-successional species was already realized at much longer rotations than currently (given uniform stand-age structure). Comparing potential and realized bird assemblages provides a tool for assessing ecological integrity at the landscape scale, and the results can be used for elaborating regional management goals of ecologically sustainable forestry.
1. Introduction
The central problem of sustainable forest management is how to maintain the integrity of ecological functions in landscapes where humans use forests for multiple goods and services [1,2]. Biodiversity plays a triple role in such a setting; it can be seen as an indicator, a provider of the landscape functions, or an integrity target on its own [3,4]. A common task for understanding and monitoring any of those roles is to measure biodiversity in a way that can be linked to the landscape integrity goals [5,6]. This is not a simple task, however, due to a general lack of representative and detailed biodiversity data at the landscape scale.
The assemblages of breeding land birds have several desirable characteristics for obtaining landscape perspectives on the ecological sustainability and integrity of forests (e.g., [7,8,9,10,11]). These ecological characteristics include (i) birds forming multispecies assemblages all over terrestrial landscapes, including the adjacent nonforest ecosystems; these assemblages use diverse resources and participate in many ecological relationships; (ii) during nesting, most adult birds become sedentary, so the distribution of whole assemblages can be mapped by human observers as individual pairs, nesting territories, or their equivalents; (iii) birds have a generally high mobility across the landscape, and larger species can integrate multiple patches in a single home range; (iv) bird species differ in their habitat specificity but most forest birds use multiple forest types. For landscape analysis, the characteristics (iii) and (iv) simplify the presentation of the densities of most bird species; these become primarily functions of landscape composition, since nonlinear patch-isolation effects are relaxed until the habitat becomes extremely rare ([12,13], but see [14] for criticism). For a human perspective, it is also important that (v) threatened species and threats to birds are better understood than in most other taxon groups, and (vi) protecting birds and their habitats for perceived intrinsic values is a common phenomenon across many cultures and countries. As a result, regional population trends of breeding forest birds are increasingly used for assessing the sustainability of forest management [15,16,17].
At the landscape scale, however, ‘bird perspectives’ on ecological sustainability and integrity have not been fully realized. First, such analyses mostly focus on selected subsets or individual species [11], rather than on understanding the transformation of whole assemblages in relation to forestry scenarios. A background reason for such focus appears to be a scarcity of quantitative (breeding density) data for all species across landscapes, which partly results from a current predominance of relative census methods. Although estimating absolute densities of forest-bird assemblages is indeed laborious and involves specific methodological problems, such data are invaluable for ecosystem-level research [18]. Secondly, the analysis should consider biodiversity and ecological integrity issues beyond forests. For example, extensive afforestation or intensifying agriculture can reduce the ecological functioning of grasslands on the landscape, while forest clear-cuts might create a shifting mosaic of temporary habitats for some grassland species [19,20].
In this study, I investigate landscape-scale consequences of different scenarios of even-aged (clear-cutting-based) silviculture combined with forest protection and (in wetlands) with forestry drainage. This is a management setting typical of, for example, North Europe and the Baltic region, where tension with ecological integrity is mostly driven by a developed timber and wood industry [21]. Aimed at increased wood use, this driver pressures biodiversity through multiple forest management decisions, of which my focus is on rotation length (which shifts the age structure of stands) and on site-type transforming drainage systems to promote tree growth (e.g., [22,23]). Bird census data have documented some large assemblage-scale declines that followed forest management intensification, notably in Finland [24] and in Estonia [25]. The progress in establishing protected areas has apparently been insufficient for reversing those biodiversity declines [26,27,28]. However, new conservation measures are under consideration in the frame of the EU Bio-diversity Strategy for 2030, which envisions protecting at least 30% of the land area, including at least 10% strictly [29]. I thus include an examination of potential broad-scale consequences of that strategy among the scenarios.
My main question is what is the expected landscape-scale change in bird densities and the turnover of species in response to forest management scenarios, and how does it depend on forest type? I specifically address forestry drainage and the current economic adjustment of rotation lengths to tree growth rates, i.e., shorter rotations in more productive forests (Section 2.1). The ecological integrity issue is whether wet-forest transformation and shorter rotations may selectively remove avian hotspots, and how this is mitigated by protected areas. To investigate those questions, I use nonspatial models of bird assemblages in simulated landscape mixtures of forest age and forest type. The models are parameterized with actual bird densities derived from high-quality territory-mapping data from Estonia [18], and I also address the question of how to best use such data.
2. Materials and Methods
2.1. The Study System
Estonia (total area 45,228 km2) is a lowland country in North Europe, in the hemiboreal vegetation zone. The topography is mostly of glacial origin. The country has a mild temperate climate with a mean air temperature of +17.8 °C in July and −3.8 °C in February (1991–2020 norms) and an average precipitation of 662 mm/year (data by the Estonian Environmental Agency). During the last decades, the climate has been shifting to an earlier onset of spring and a shorter duration of snow cover, particularly in the coastal areas [30]. A mid-twentieth-century estimate for the potential vegetation in the country predicted ca. 85% forest cover in the absence of human activity [31] (p. 61).
Currently, forest lands cover 53.5% of the country (48.8% stands; 4.7% regenerating areas, mostly clear-cuts) [32]. This area mostly forms contiguous forest landscapes with a fine-grain stand structure. The main sources of the spatial heterogeneity are (i) a diversity of soils (27 forest site types distinguished in practical forestry [33]), and (ii) anthropogenically transformed age structure (mostly clear-cutting origin; in addition, afforestation due to abandonment or drainage). The resulting average patch (stand) size is currently ca. 1.3 hectares, while only 2.0% of forest lands are old natural stands [32]. Coniferous stands form 39% and deciduous stands 41% of the forests, the rest are conifer–deciduous mixtures [34].
Current dynamics in the structure and functioning of the Estonian forest landscapes are mostly driven by timber harvesting and forestry drainage pressures, and forest protection for biodiversity. Of these, forestry drainage became an integral part of the Estonian forestry model in the 1960s, when extensive drainage systems were built with state subsidies. Currently, 15.4% of the forest land is categorized as the fundamentally transformed decayed-peat site type and drainage has also affected much of the remaining forests on Histosols (6.7%). The long-term ecological perspectives of the drained forests are uncertain, but their vegetation tends to converge toward (impoverished) mesotrophic or paludified sites [23,35].
Since the 1990s, the Estonian forests have been increasingly strictly protected for forest biodiversity, from 3% to 15% of forest land [32,36]. However, due to former management, most forest reserves are in various stages of ecological recovery; young recently protected stands are particularly common on the most productive sites [37]. In parallel, the remaining forest land (which also includes some milder protection regimes) has become increasingly intensively managed. In recent years, the annual harvest volumes (of which ¾ are from clear-cutting) have approached ca. 3% of the estimated volume of live trees in ‘managed’ forests. All harvesting and regeneration must comply with the Forest Law, where the ecologically most influential restriction is the minimum age (or diameter) limit for clear-cutting by tree species and site productivity (see also Table 1). Currently, most intensive timber removals (7.6 m3/ha of total forest land annually) characterize the forests managed by timber companies (20% of all forest land) [32]. State-owned forest land comprises 52%. Most of this is managed by the State Forest Management Centre (47%), which holds an FSC certificate of responsible forestry and is the only management body in the country that has an upper limit to the total timber volume allowed to be harvested.
A total of 108 bird species regularly breed in the Estonian forests (Section 2.3); a further six species are occasional breeders (Streptopelia decaocto, Strix nebulosa, Milvus migrans, M. milvus, Falco vespertinus, and Fringilla montifringilla), and two regular breeders of the 20th century are now probably extinct (Circaetus gallicus and Coracias garrulus). The regular breeders include significant populations of several species that are vulnerable to intensive forest management, such as Tetrao urogallus, Picoides tridactylus, Dendrocopos leucotos, and Ficedula parva (e.g., [8,38,39]. Others have already become rare and are listed nationally as Critically Endangered (e.g., Ciconia nigra, Clanga clanga, and Bubo bubo); in addition, there is a clear recent decline in common forest birds [25]. At the same time, extensive clear-cuts are providing secondary habitats for >10 open-land species that have their main populations outside forest lands (see Section 3.1). The Estonian situation can thus be seen as a vulnerability zone for a rather natural species pool; it can significantly impoverish in the foreseeable future—a process passed by most West European countries a long time ago [40].
2.2. Model Structure and the Management Scenarios
The aim of the modelling was to investigate a biodiversity integrity response to potential developments in production forestry and conservation. The full Estonian forest-bird fauna was considered as a realistic study system, given that its rather complete current pool of species is facing management-related pressures (Section 2.1).
The models assessed breeding-bird densities and numbers of species for alternative silvicultural and protection regimes (hereafter: management scenarios) at the landscape scale. Each management scenario produced a specific mixture of stand-age classes nested within forest types (hereafter: habitat types). The bird assemblage response was derived as a weighted average of habitat-type specific absolute densities for each resultant landscape composition (see Section 2.3 for input data). For brevity, the density units are referred to as ‘pairs ha−1’, although the actual census units have been territorial males or, in nonterritorial species, expectably reproducing females.
Such a model structure allows for calculating assemblage characteristics for any set of habitat types, but I focused on two scenario types that aim at stable desirable landscapes: (i) equal mixtures of age classes as produced by uniform even-aged silviculture of high forest (a ‘normal forest’ for timber production [41]); (ii) old-growth stands to compensate their loss in rotational forestry (a target of strict protection, e.g., [36]). Table 2 lists the seven combinations of those analyzed scenario types. To understand their influence in heterogeneous landscapes and in response to ecosystem transformation, the scenarios were (iii) applied to selected pairs of contrasting forest types, varying their proportions from 0% to 100%.
For the calculations, the following simplifications were made to match the input data and to avoid overparameterization (see Section 4.3 for further discussion on limitations):
- A subset of 13 forest types was considered (Table 1) based on the availability of multiple high-quality bird surveys using territory-mapping [18]. These types cover an estimated 65% of the Estonian current forest land. For analyzing their mixtures, three forest-type pairs were selected to explore the effects of different management intensities in more productive than in less productive forests on a landscape, and three pairs addressed the drainage-caused transformation of peatland forests.
- Although technically possible, nonlinear variation of densities along with the habitat amount was not included. Instead, a species was considered ‘present’ in a landscape if the model output density was at least one pair per 100 km2. While some large birds may have viable populations at smaller densities, many such species cannot be linked with specific forest types and were omitted altogether (Section 2.3).
- Habitat-type specific densities of each species were maintained constant in habitat mixtures, thus ignoring edge effects and habitat adjacency. These effects can vary much within each scenario, depending on the grain size of the landscape and spatial planning (rather than forest age structure per se). My rationale was that the most common habitat-structure effects on bird densities are more realistically (although implicitly) included in the census data than could be accounted for in theoretical configurations.
- Natural disturbances and uneven-aged management were not explicitly modelled. Instead, a hypothetical 200-year rotation was explored as a near-natural landscape state for bird assemblages (Table 2). This refers to a 0.5% annual loss of old-forest cover, which is two times the average annual windstorm effect observed [36]. Such a loss rate was considered a reasonable order of magnitude in small-scale forest use.

Table 1.
The 13 Estonian forest-type profiles, as considered in the models (real ecological variation can be wider), and the main data sources on breeding densities of bird species.
Table 1.
The 13 Estonian forest-type profiles, as considered in the models (real ecological variation can be wider), and the main data sources on breeding densities of bird species.
| Forest Type (% in Estonia) 1 | Typical Soil | Productivity 2 | Rotation Age 3 | Species Pool 4 | Main Density Data |
|---|---|---|---|---|---|
| Pinus sylvestris-dominated forests on natural site types (16) | |||||
| Hepatica (2) | Cambisol | I | 90 | 60 (52) | [42,43] |
| Rhodococcum (3) | Podzol | II | 90 | 53 (47) | [44,45] |
| Myrtillus (4) | Gleyic Podzol | III | 100 | 60 (53) | [46,47] |
| Vaccinium uliginosum (2) | Gleysol | V | 120 | 39 (33) | [46] |
| Bog (1.5) | Fibric Histosol | Va | 120 | 29 (25) | [18] |
| Deciduous forests and mixedwood with Picea abies on natural site types (54) | |||||
| Aegopodium (7) | Gleic Cambisol/Luvisol | Ia | 60 | 70 (57) | [42,44,45] |
| Oxalis (8) | Albeluvisol | I | 70 | 72 (59) | [42,44,45] |
| Filipendula (11) | Gleysol | II | 70 | 70 (56) | [18,48] |
| Swamp (0.7) | Fluvisol | III | 65 | 61 (48) | [18,44,45] |
| Birch fen (0.5) | Sapric Histosol | IV | 70 | 48 (39) | [18,49] |
| Drained peatland forests 5 (16) | |||||
| Drained Oxalis (7) | decomposed Histosol | II | 80 | 68 (58) | [18,45] |
| Drained Myrtillus (8) | drained Histosol | III | 90 | 54 (48) | [46,50] |
| Drained bog (1) | drained Histosol | IV | 100 | 34 (30) | [46] |
1 The typology is primarily based on soil moisture, nutrient status, and typical understory composition, as described by [33]; the approximate area estimates are based on the National Forest Inventory [32] and the National Forest Registry. 2 National site productivity index; ordered from the best to the worst as classes Ia, I,… V, Va. Typical timber volumes (m3/ha) in 100-year-old stands: Ia–II > 300; III, ca. 200–300; IV–Va, < 200 [33]. 3 Typical minimum age of clear-cutting allowed by the national legislature (as of 2022); the ‘Current’ rotation age in the modelled scenarios (Table 2). 4 No. of bird species estimated to regularly breed on forest land at 200-year uniform rotation; in brackets, the no. of ‘forest species’ (excluding those species that have their main populations elsewhere). See Supplementary Table S1 for the list. 5 Pinus sylvestris dominated, except Oxalis, which transforms into Picea abies-dominated mixedwood.
Table 2.
The seven scenarios modelled for each forest type and their paired combinations.
| Scenario | Rotation Parameters | Protection Parameters | Real-World Analogue |
|---|---|---|---|
| Current rotations | Current site-type specific age (Table 1) | No protection | Production landscape |
| Current integrated | Current | 15% of each site type | Country average |
| Shortened rotations | −10 years of Current | 15% of each site type | Intensified logging |
| Extended rotations | +10 years of Current | 15% of each site type | Reduced logging |
| Balanced protection | Current | 15% total, incl. 5% ‘safe margin’ for every site type 1 | Rare ecosystems prioritized for conservation |
| Combined protection | 70% Current; 20% Near-natural | 10% of each site type | EU Biodiversity Strategy [29] |
| Near-natural | 200 years | No protection | Small-scale forestry |
1 In forest-type mixtures, the forest type covering <5% fully protected; above the 5% threshold proportional protection of 15% of area; total protected area kept at 15% level.
2.3. Deriving Bird-Density Data for Model Input
Three approaches were initially considered for obtaining breeding-bird density estimates for model parametrization. Only recent, high-quality data with known census bias were considered, preferably from territory-mapping studies [18].
- (I)
- I used the smoothed functions of total bird-assemblage densities in relation to post-clear-cut year (stand age), as recently derived from all the territory-mapping data available in Estonia [18]. All those polynomial functions (Supplementary Table S2) show monotonous increases (with possible stabilization) along the succession, but forest types vary in the recovery rates and timing. The strength of this approach is that uncertainties in the density estimates of individual species are not multiplied; instead, a typical resource-limited overall density is assumed in every forest ecosystem. In addition, the input data have accounted for methodological inconsistency [18]. The obvious limitation is that species richness, composition, and turnover cannot be estimated.
- (II)
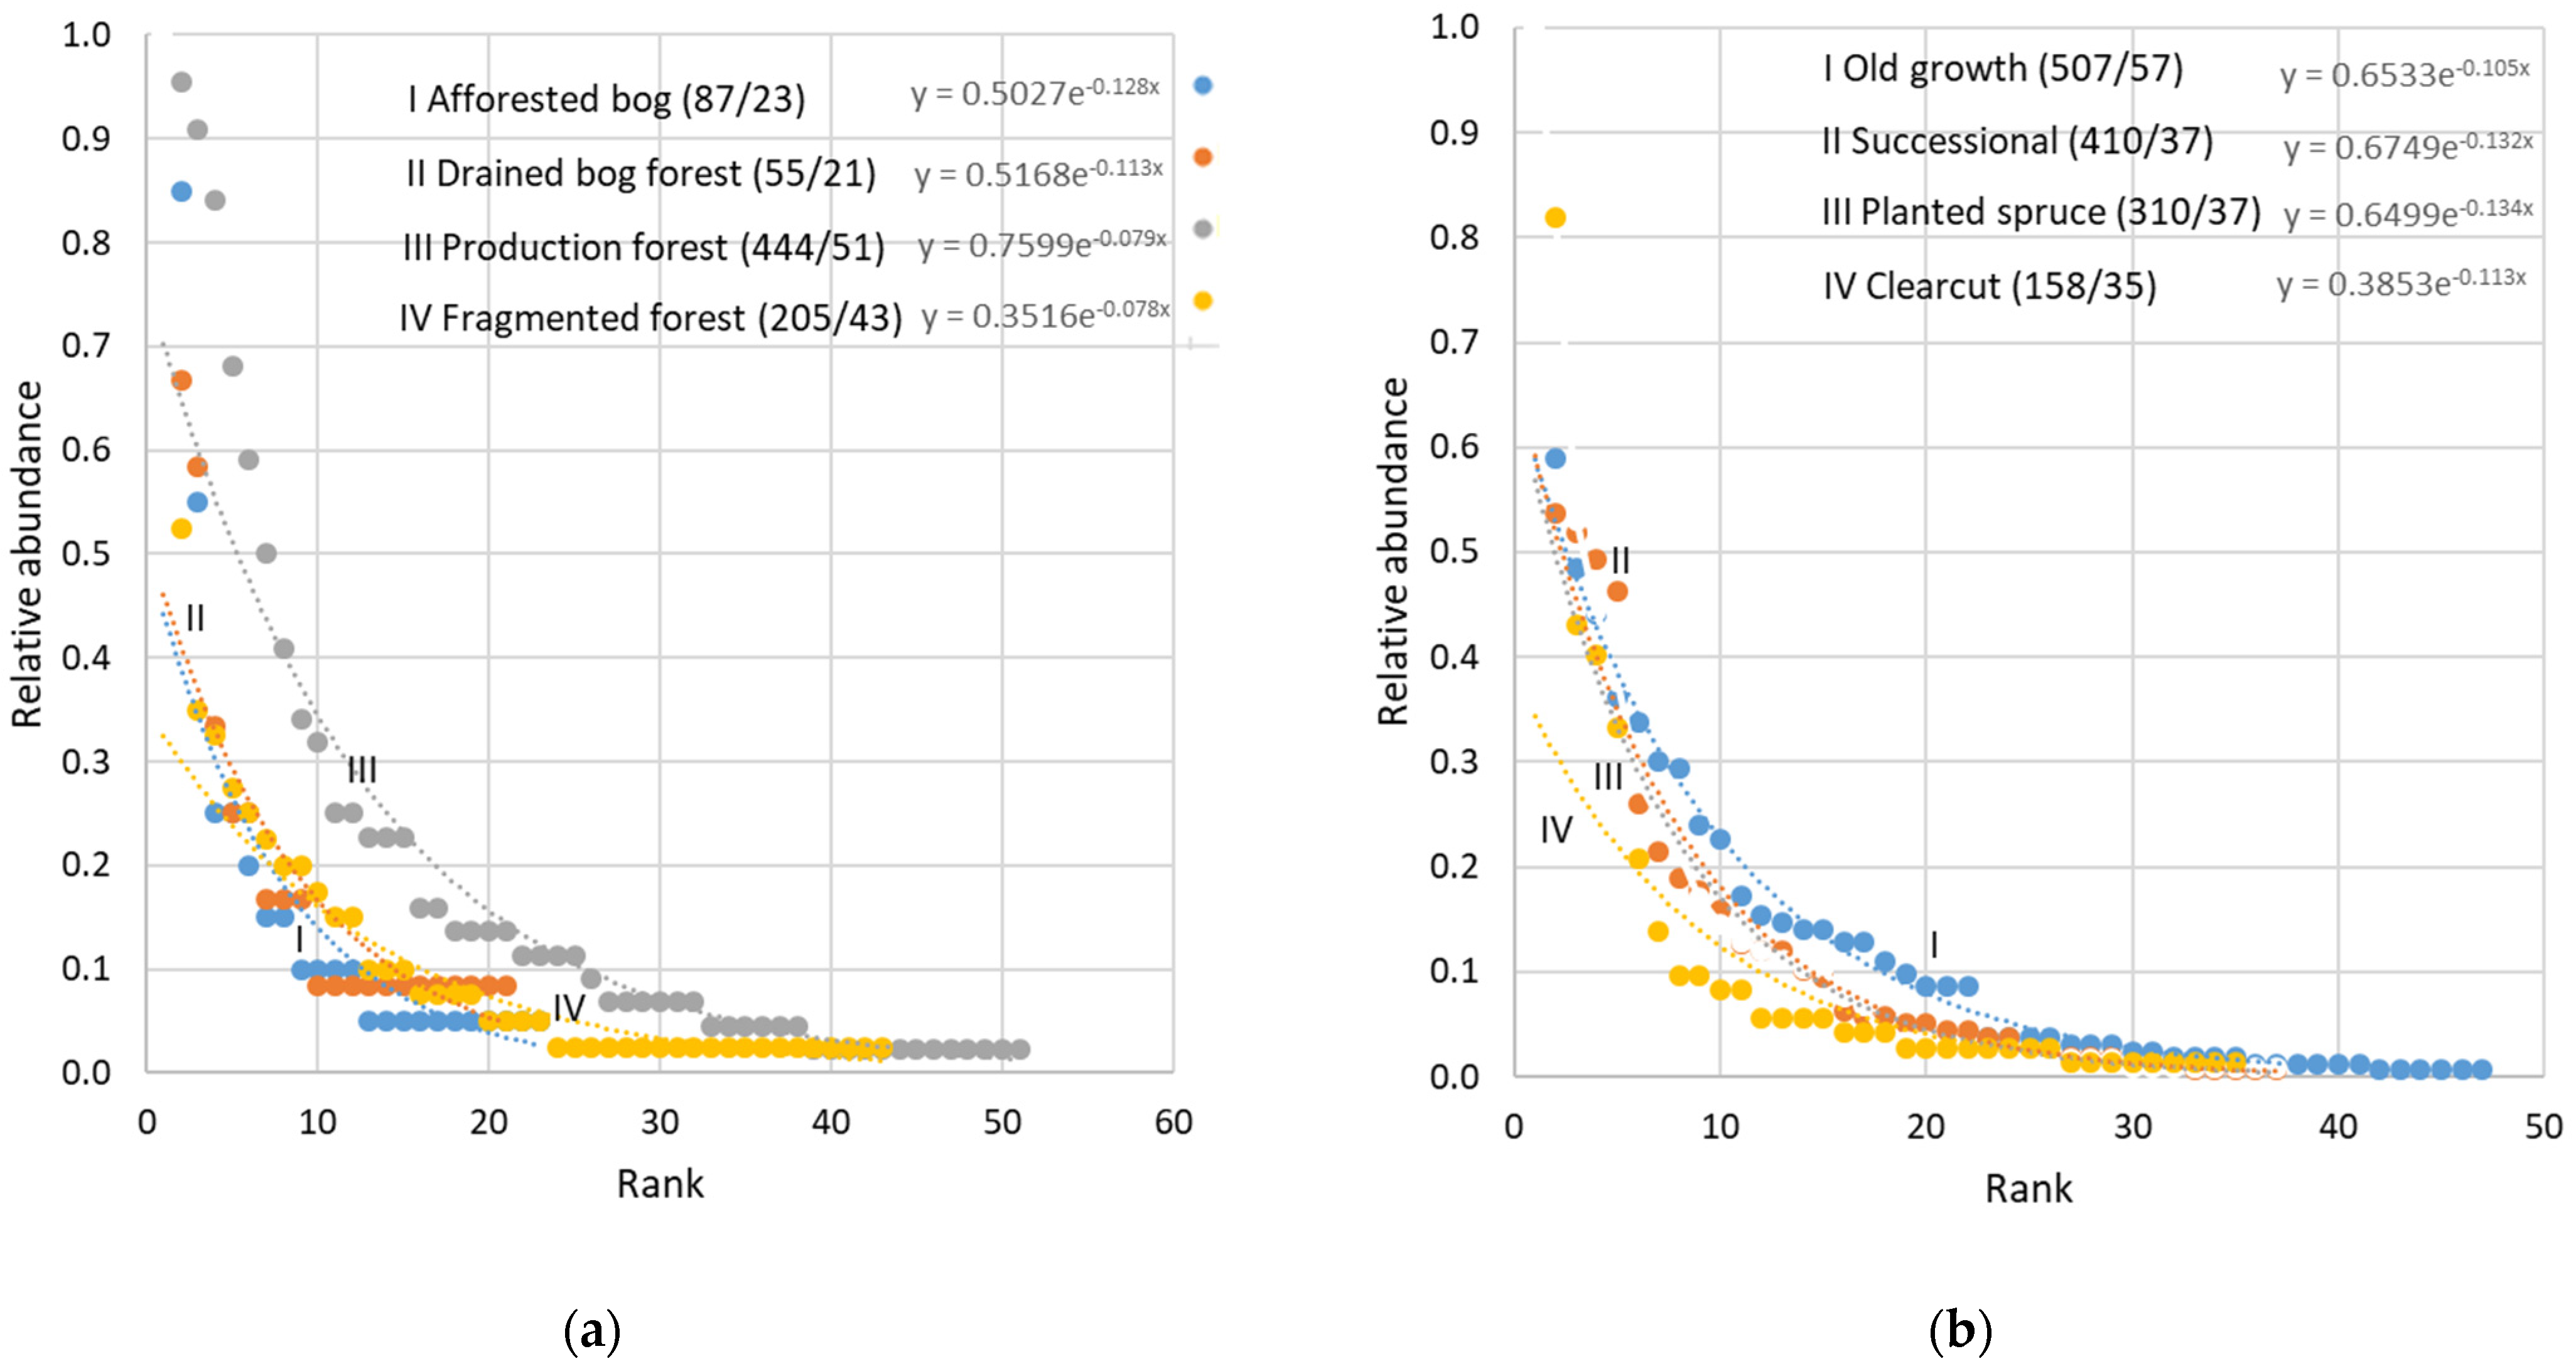
- To add species compositional characteristics, I first considered rank-abundance curves based on (near-)comprehensive surveys in multiple contrasting forest environments (Figure 1). I evaluated forest-type consistency of the curves and positions of the species for a potential to formalize species in theoretical terms (without referring to actual species) [51]. Such an expectation was based on two consistencies previously found: that early- and later-successional forests have similar proportions of the dominant species in the assemblage and a similar total density of nonpasserines [18]. However, a closer exploration indicated that the curve shapes are sensitive to within-sample environmental heterogeneity (Figure 1), and the assemblage overlap between forest types is inconsistent. Thus, this approach was not considered a valid basis for modelling species composition.
- (III)
- As an empirical approach, I compiled a database of the average densities of each species by forest type and age class (10-year classes up to 200 years). The main sources are indicated in Table 1; the other sources were major reviews [18,52], and large-scale mappings of birds of prey [53] and woodpeckers [38]. For each species, I first assessed the forest types of its regular occurrence and consistency of available density estimates. I omitted 35 species that, in Estonia, are either very rare (in forests), (semi)colonial, or only occur in specific adjacency situations (e.g., at water bodies, bogs, or meadows): Bucephala clangula, Streptopelia decaocto, Apus apus, Ciconia nigra, Ardea cinerea, Gallinago media, Actitis hypoleucos, Asio otus, Strix nebulosa, Bubo bubo, Pandion haliaetus, Circaetus gallicus, Clanga clanga, Aquila chrysaetos, Circus cyaneus, Haliaeetus albicilla, Milvus migrans, Upupa epops, Jynx torquilla, Picus viridis, Leiopicus medius, Falco tinnunculus, F. vespertinus, Corvus monedula, C. cornix, Acrocephalus schoenobaenus, Phylloscopus trochiloides, Sturnus vulgaris, Turdus pilaris, Fringilla montifringilla, Coccothraustes coccothraustes, Chloris chloris, Linaria cannabina, Loxia pytyopsittacus, and Carduelis carduelis.
For each of the 79 species retained, I constructed their likely density time-series from actual (scattered) measurements along the forest age (Supplementary Table S1). I used simple conservative rules and considered the species ecology (including extensive personal field experience). The main rules were: (i) unless otherwise known, connect data points linearly over time; (ii) most species respond to major age-related structural changes in successional forests (canopy closure in clear-cuts; reduction in stem densities in young forests; mortality of pioneer tree species; development of a 2nd story) (e.g., [42,44,45]); (iii) for dominant passerines, 15–20% underestimation in territory mapping and at least 30% in single-visit transect count as mean census bias [18]; (iv) average the densities among alternative tree-species compositions. The latter was a major issue in a few bird species that are primarily influenced by tree-species composition, e.g., Ficedula hypoleuca is ca. 10 times more abundant in productive deciduous mixtures vs. spruce forests along the whole succession [42]. The estimates were thus generalized for this specific assemblage analysis and cannot replace species-specific modelling.
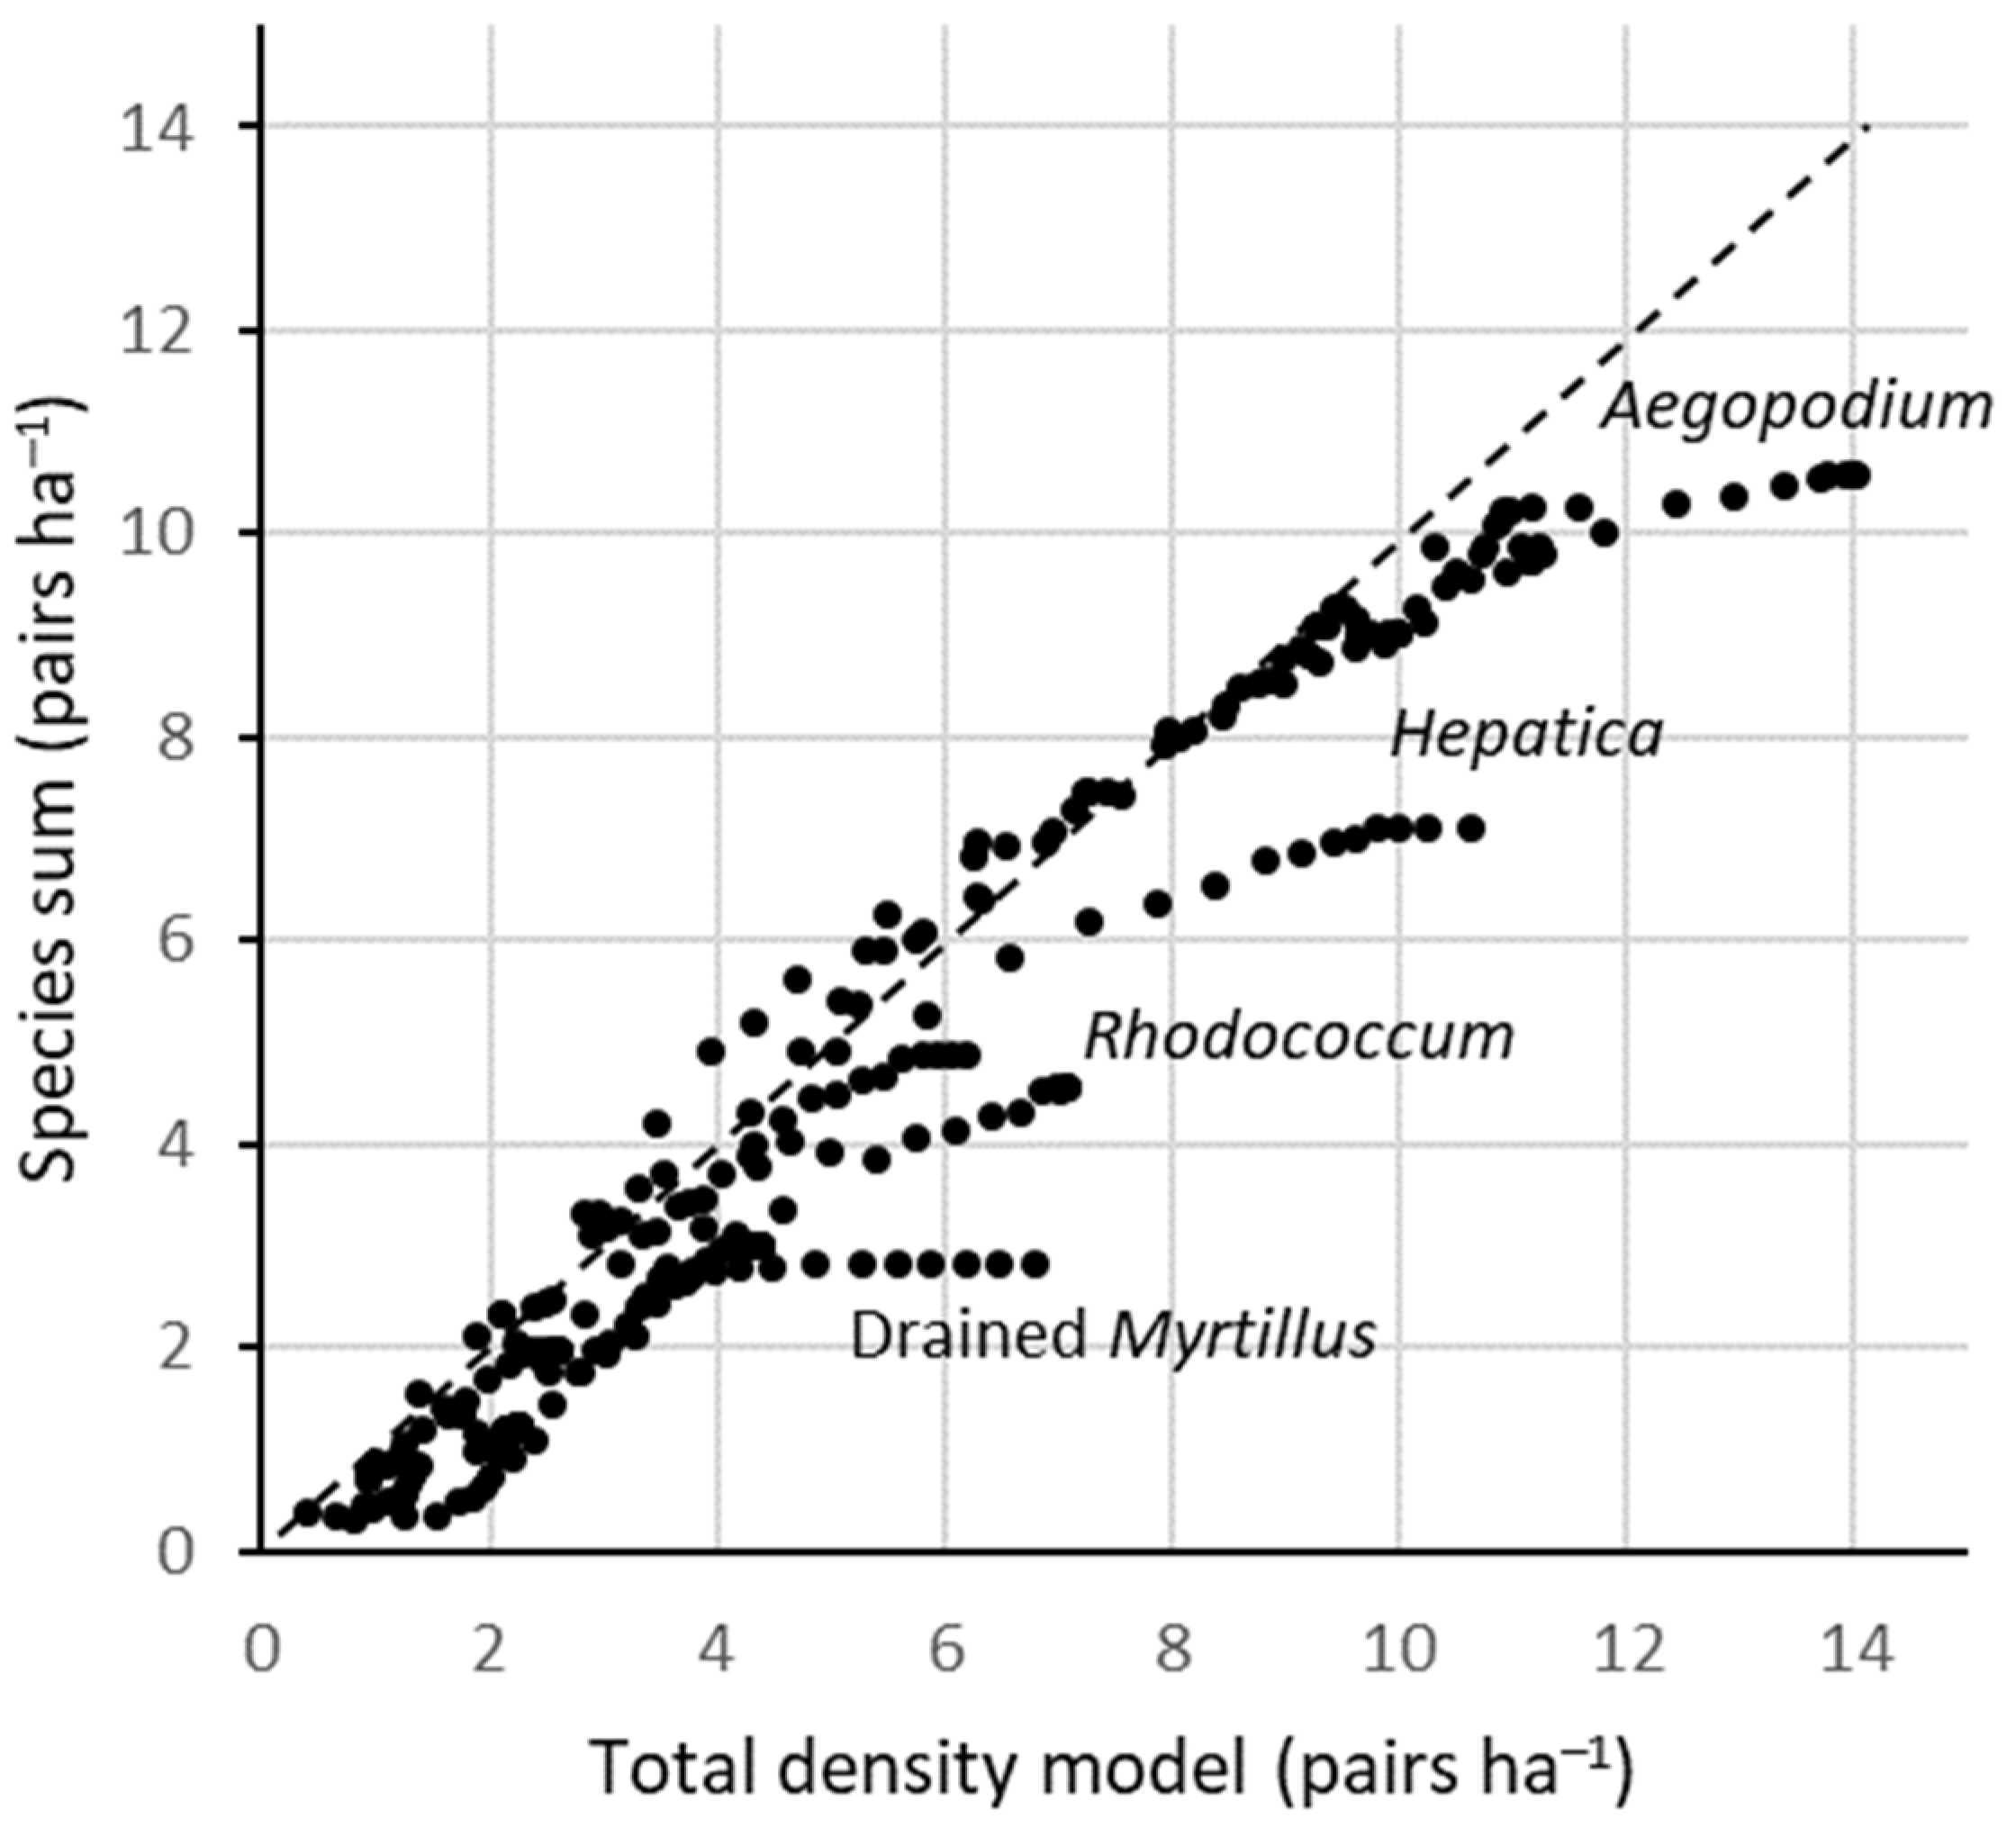
Validating the final species-density database against the total-density functions (Approach I) showed a consistent pattern: most of the species sums in forest type × age class combinations were within ±1 pairs ha−1 of the modelled totals. However, in some (most notably five) forest types, the highest densities were increasingly underestimated as the species sums compared to the modelled totals (Figure 2). A major reason is probably a scarcity of empirical studies in forests >120 years old; most species-specific estimates were conservatively kept at stable level above this age, while the density functions suggested further increases. At least in some forest types, such late-successional increases have been documented elsewhere (e.g., [54]). Thus, for modelling the total densities, I used the Approach I, while species compositions are parameterized using Approach III.
3. Results
3.1. Species Pools and Densities: Near-Natural vs. Current Rotations
Among the 79 regular forest-breeding species assessed, 15 species have their main populations outside forests: Anas platyrhynchos, A. crecca, Crex crex, Grus grus, Gallinago gallinago, Lanius collurio, Acrocephalus dumetorum, A. palustris, Locustella naevia, Sylvia curruca, S. communis, Luscinia luscinia, Saxicola rubetra, Carpodacus erythrinus, and Emberiza citrinella. The species pools of the remaining 64 ‘forest birds’ varied among forest types more than twofold: from 25 species in bog forests to 59 species in mesotrophic Oxalis-type forests (Table 1). The estimated total-density variation in a ‘near-natural’ landscape state was tenfold: from 1.0 (bog) to 9.9 pairs ha−1 (Aegopodium-type eutrophic forest).
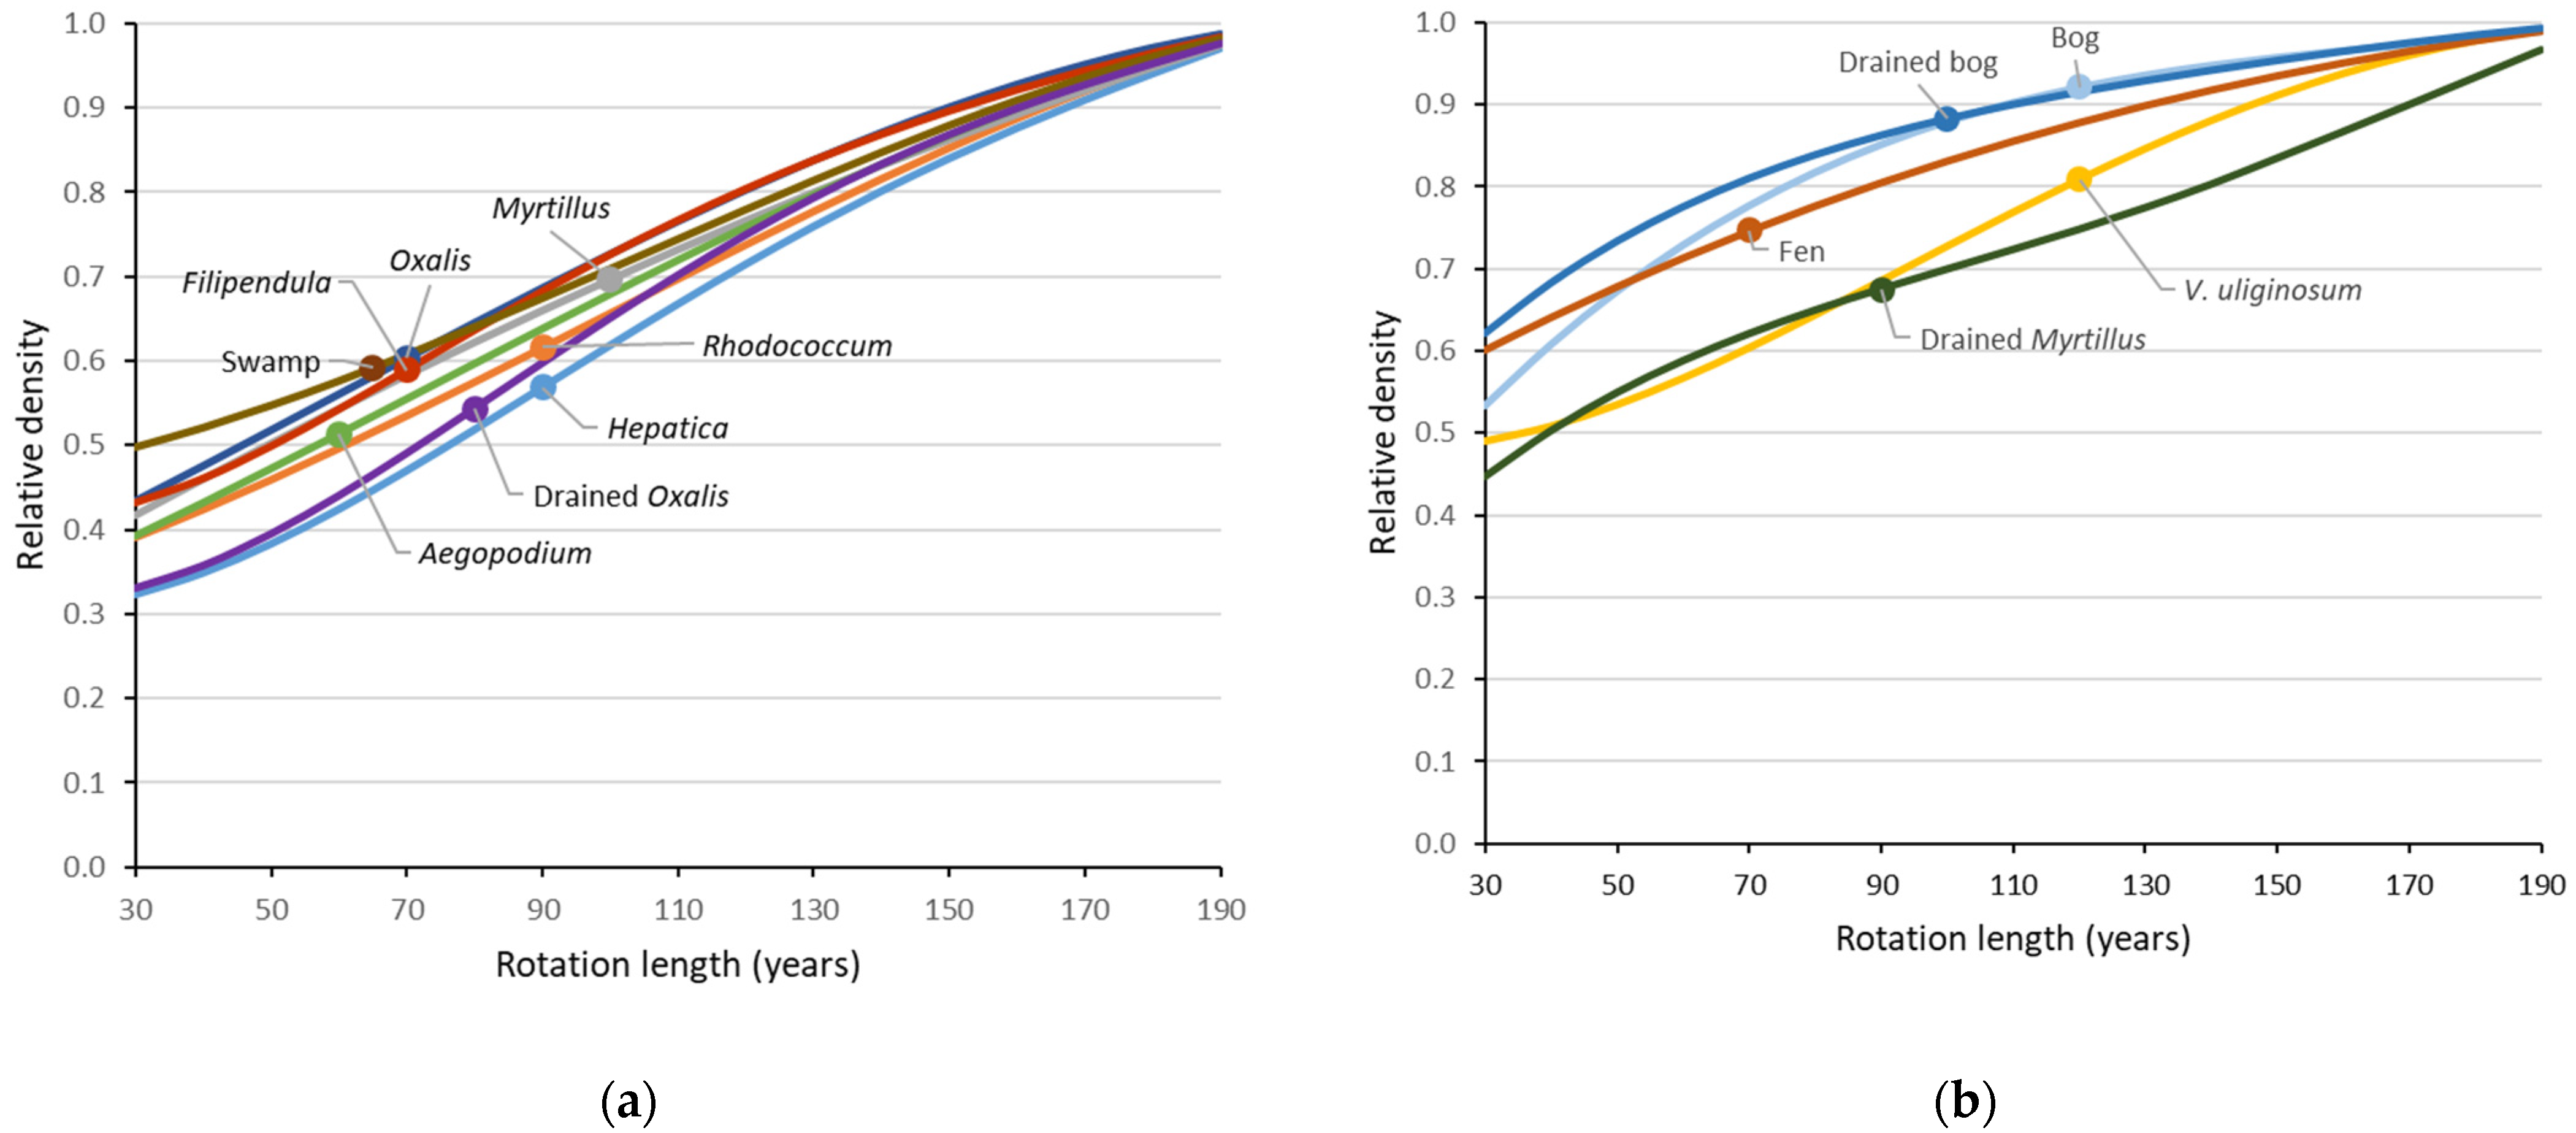
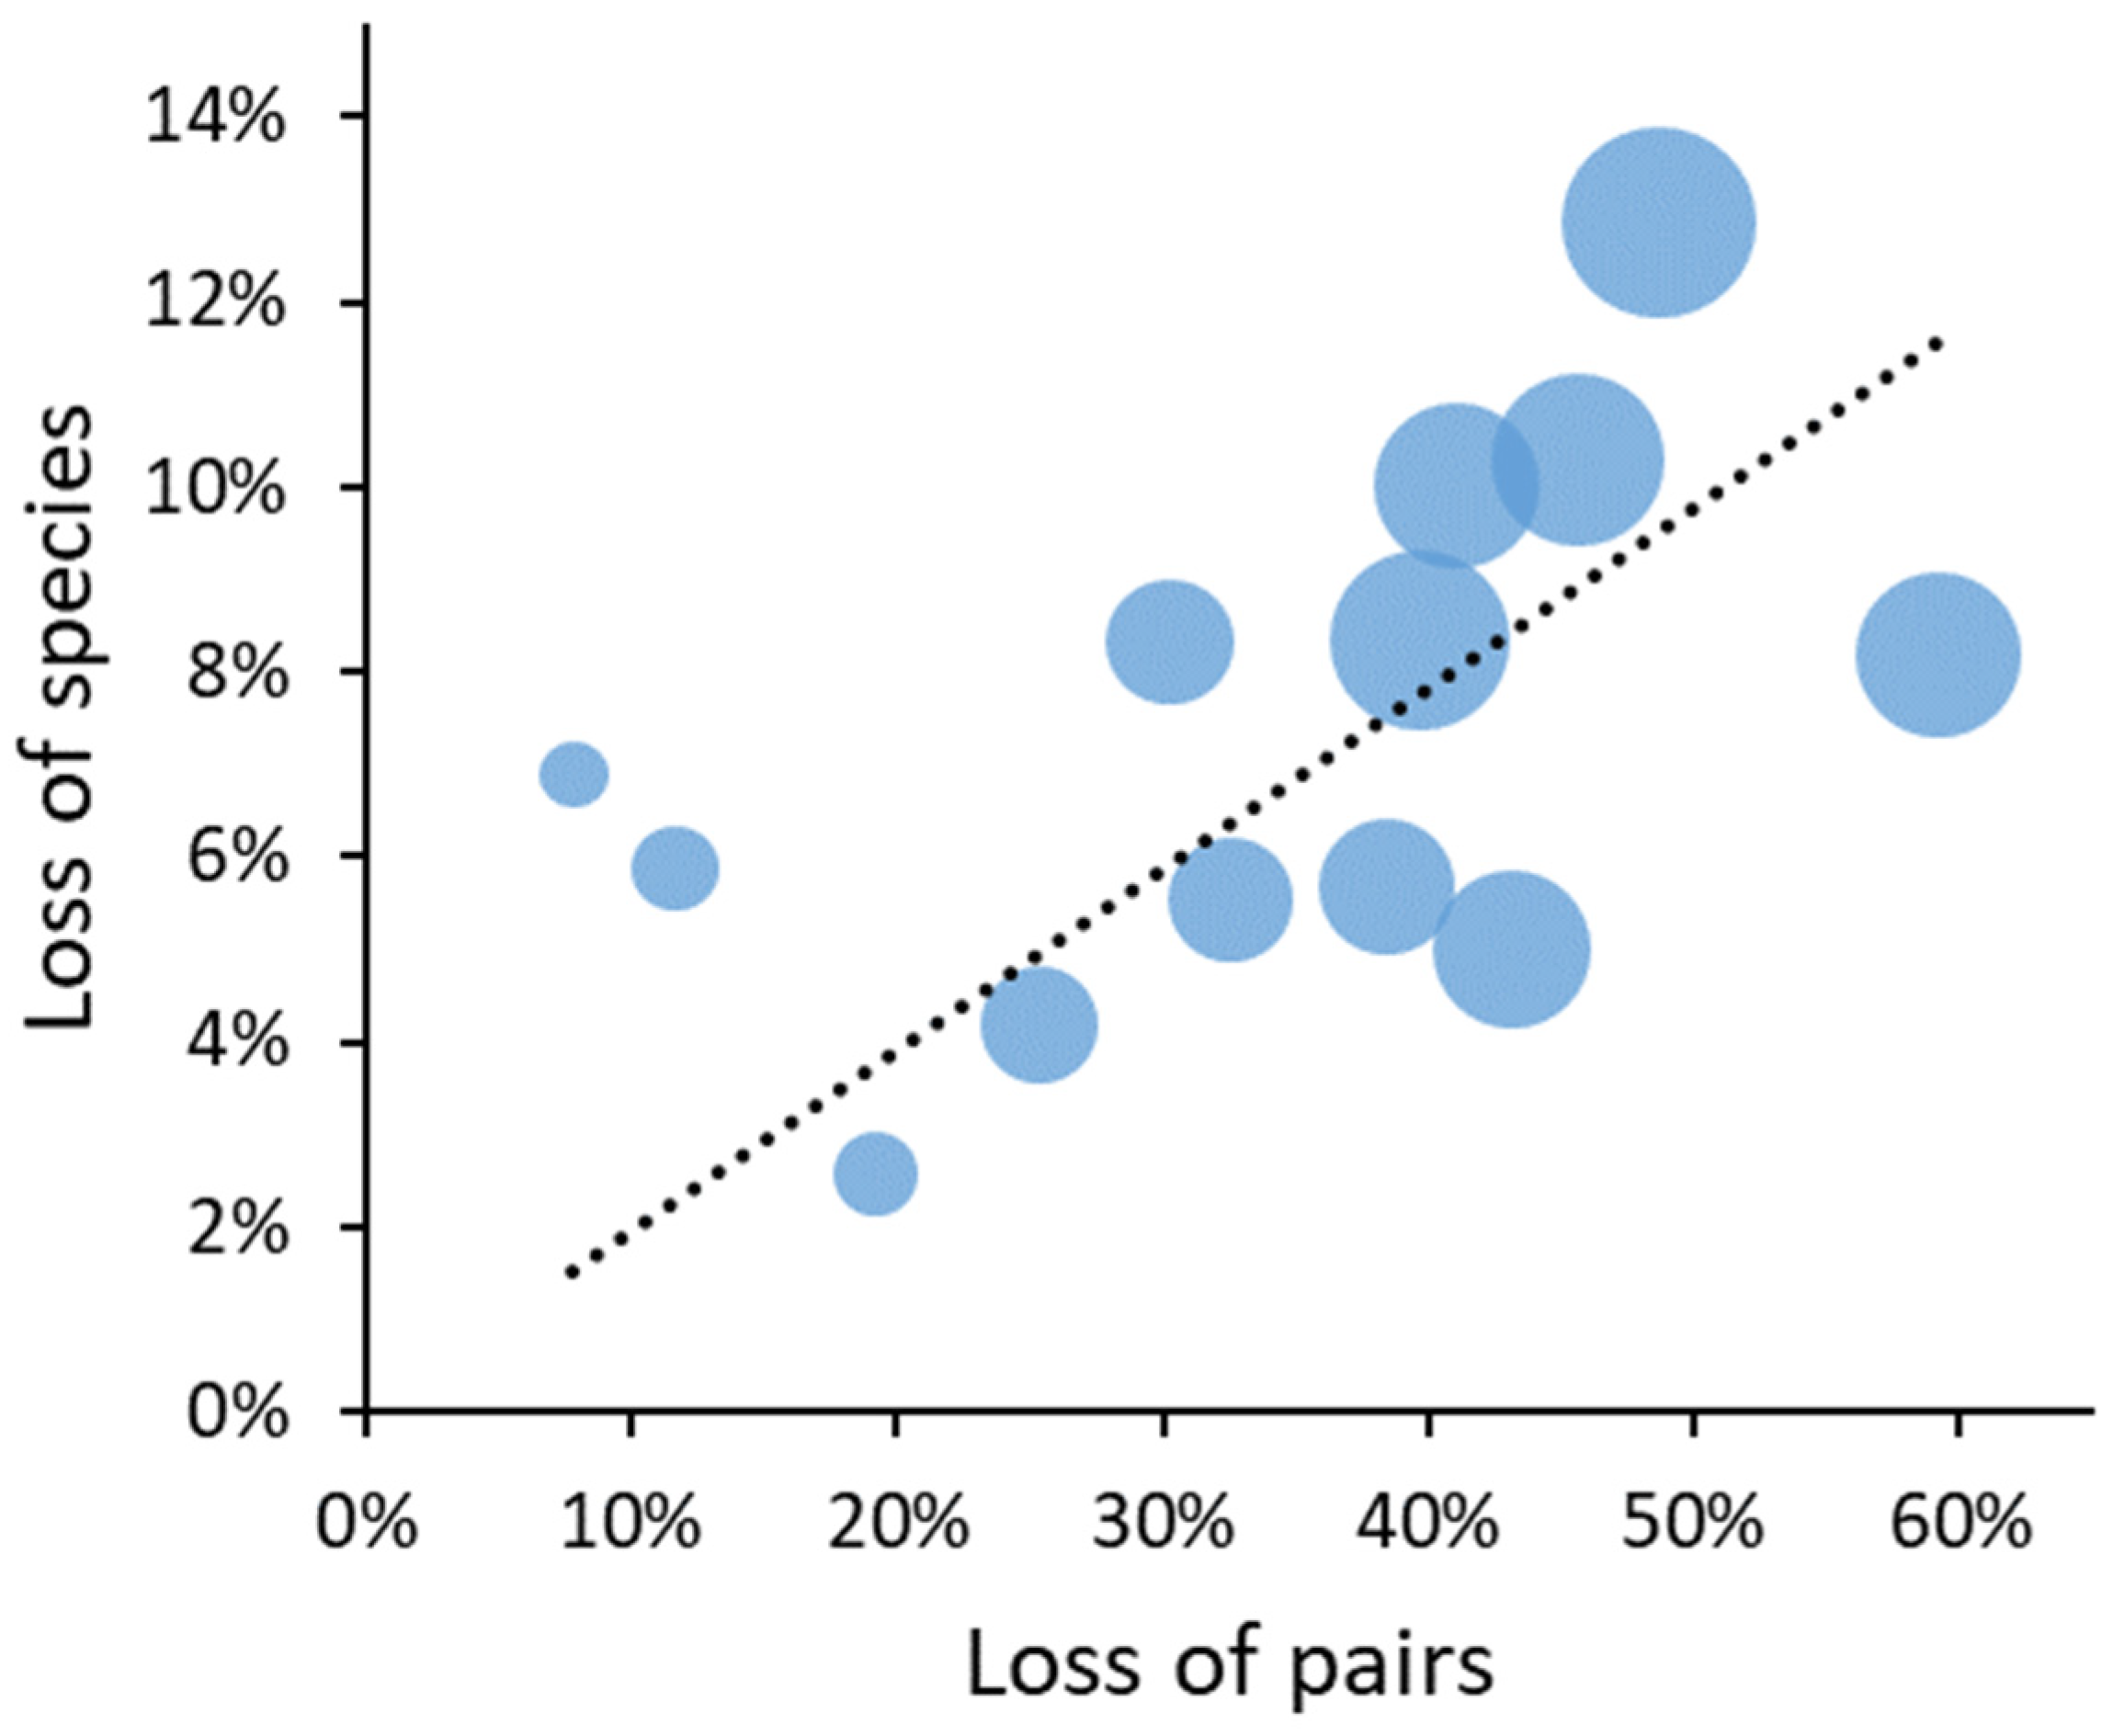
Applying the total-density functions (Approach I) to a range of rotation lengths confirmed that the current economically adjusted rotation lengths reduced bird numbers (compared to ‘near-natural’ landscapes) relatively more in productive forest types (Figure 3). While bog forests lost ca. 10%, the most fertile Aegopodium type lost nearly half of its bird pairs at current rotations. Without set-asides, this also meant an estimated loss of species, which ranged from one (Vaccinium uliginosum) or two (natural and drained bog forests; fen forests) to nine species (Aegopodium-type). Across forest types, a 50% loss of pairs (typical of current rotations in productive forest types) was associated with an estimated 10% loss of species (Figure 4).
Specifically, the model (Approach III) suggested a loss of six species from most forest types at current vs. ‘near-natural’ rotations (Glaucidium passerinum, Strix aluco, S. uralensis, Clanga pomarina, Accipiter gentilis, and Picoides tridactylus), while one species, Accipiter nisus, appeared in several forest types where it was absent in the ‘near-natural’ state. The landscape-scale presences of 13 species typical of early-successional or thicket areas were not affected (Streptopelia turtur, Crex crex, Gallinago gallinago, Lanius collurio, Acrocephalus dumetorum, A. palustris, Locustella fluviatilis, L. naevia, Sylvia curruca, S. communis, Saxicola rubetra, Carpodacus erythinus, and Emberiza citrinella). Yet, their estimated total densities increased from a forest-type average 7.8 ± 6.1 (SD) to 21.7 ± 19.2 pairs km−2, and their proportions in the whole landscape-scale bird assemblage from 1.2 ± 0.8% to 5.4 ± 4.1%.
3.2. Combined Scenarios in Landscape Mixtures
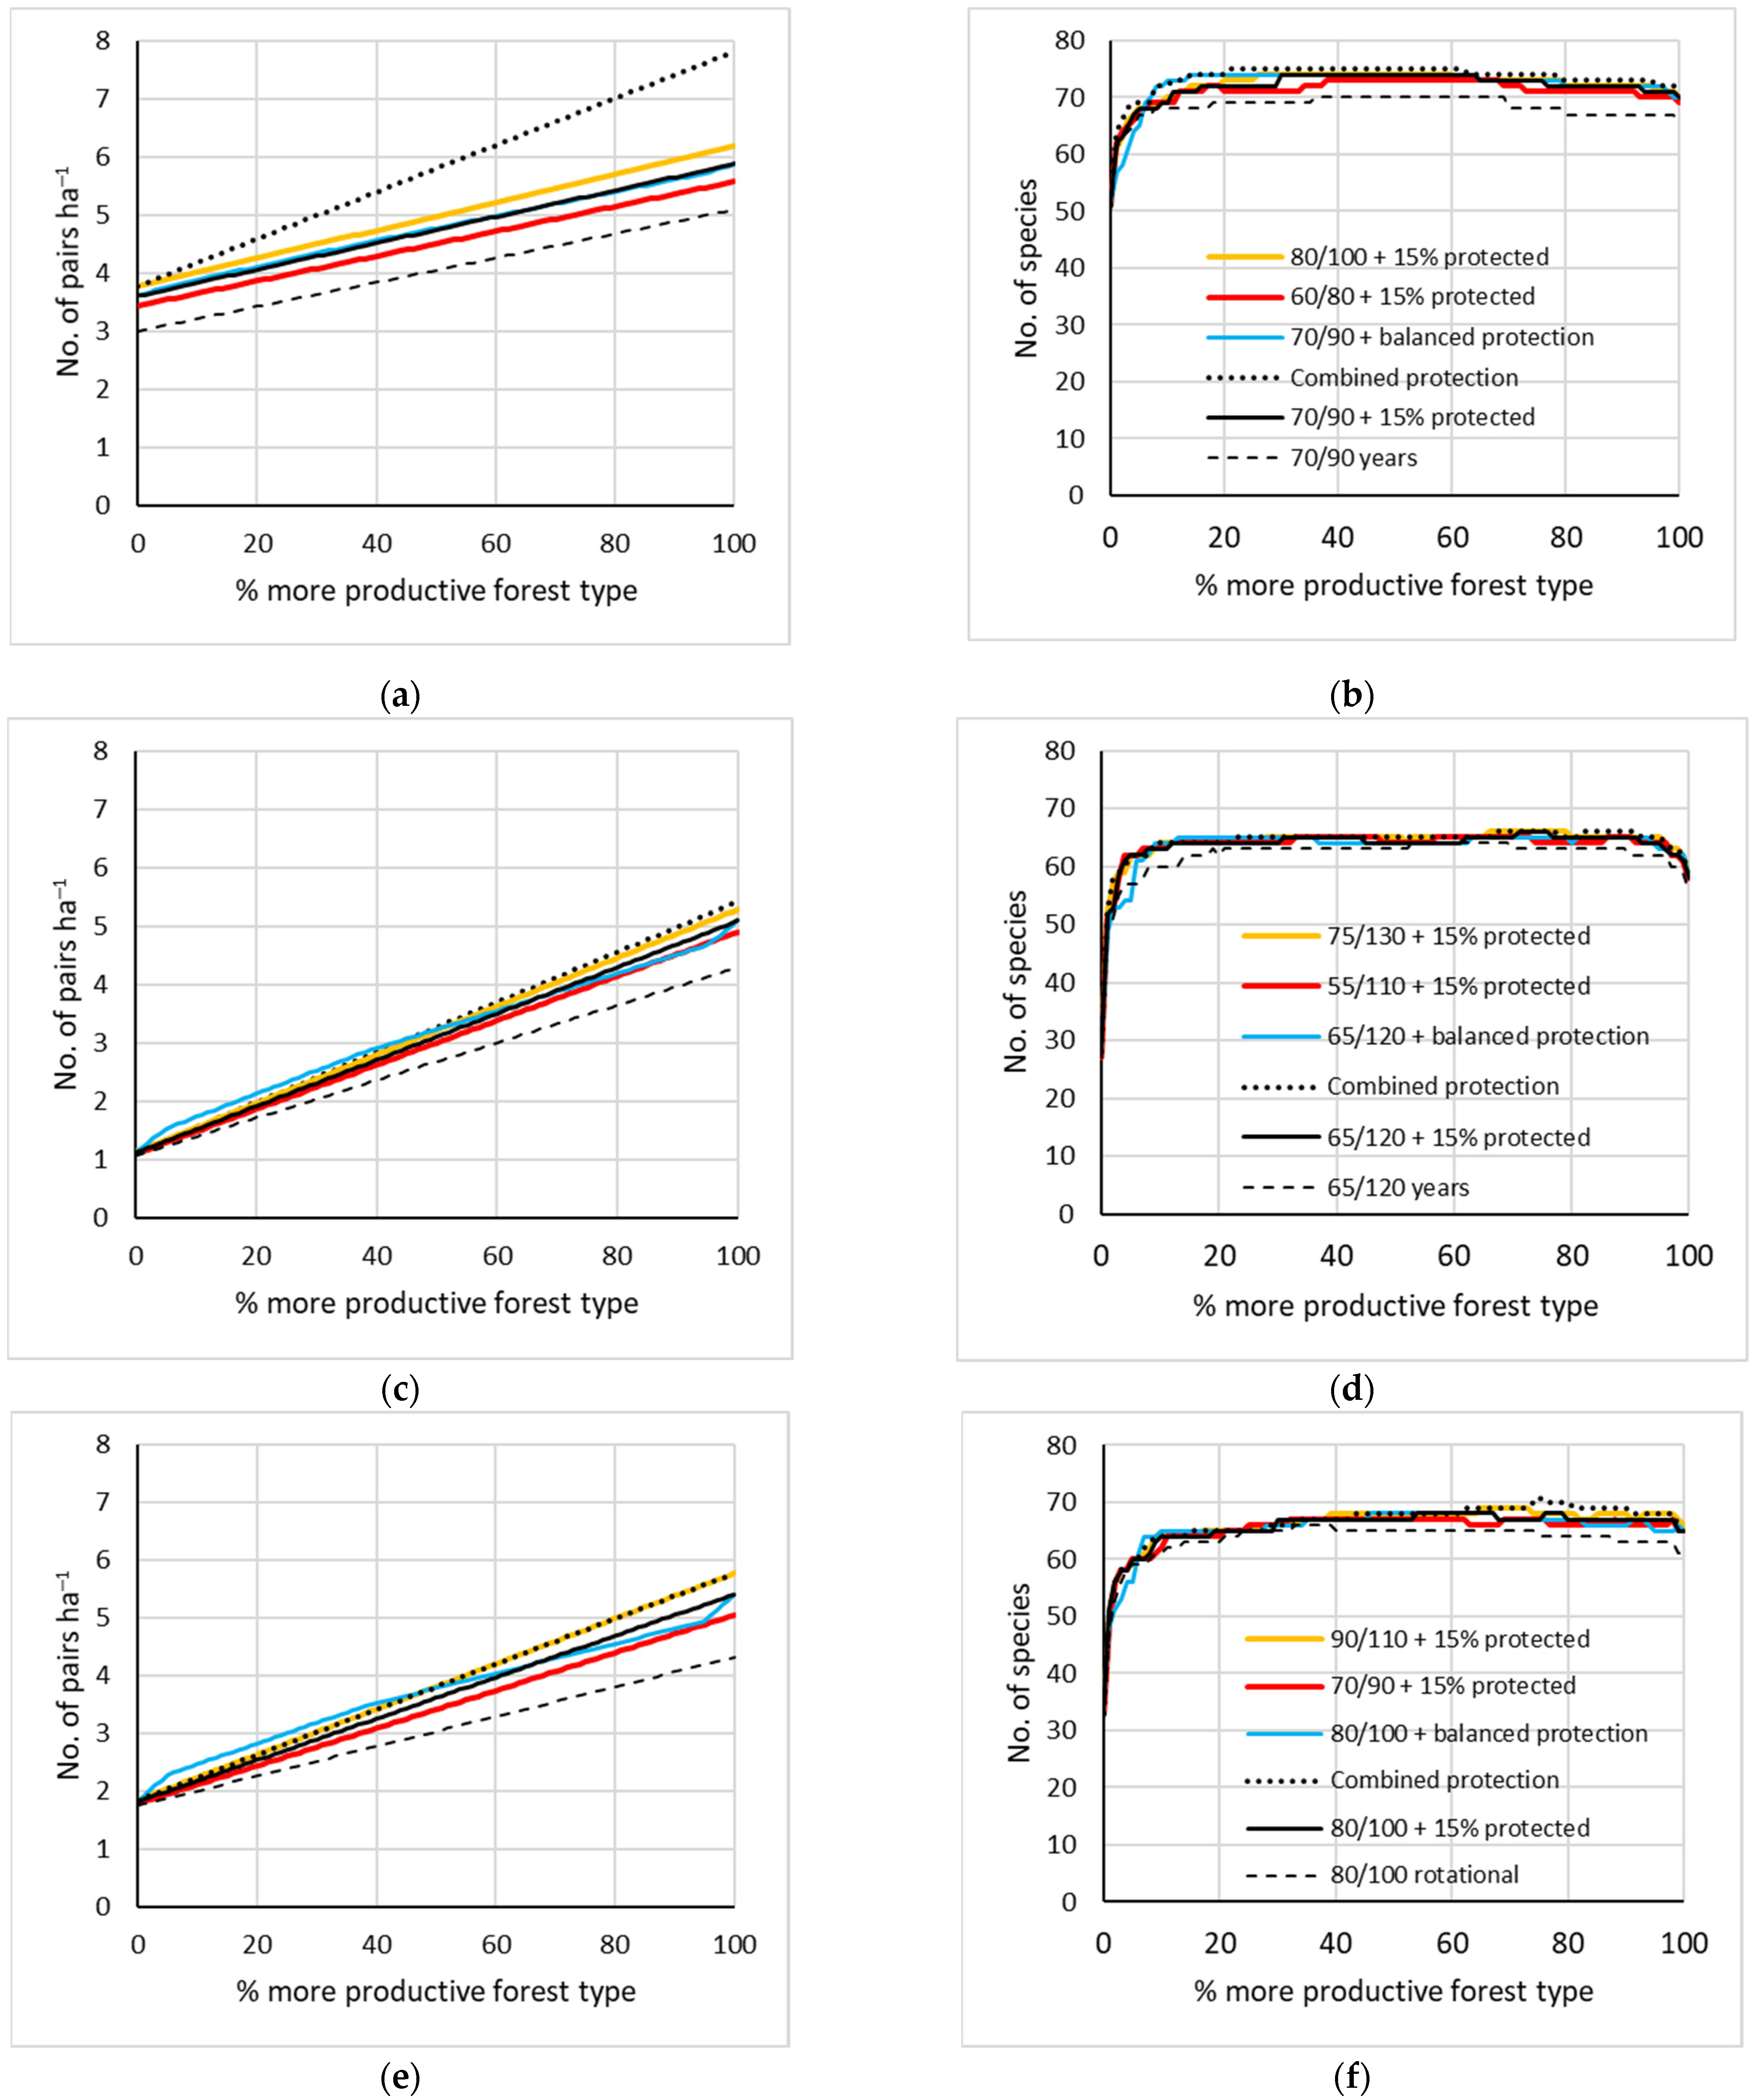
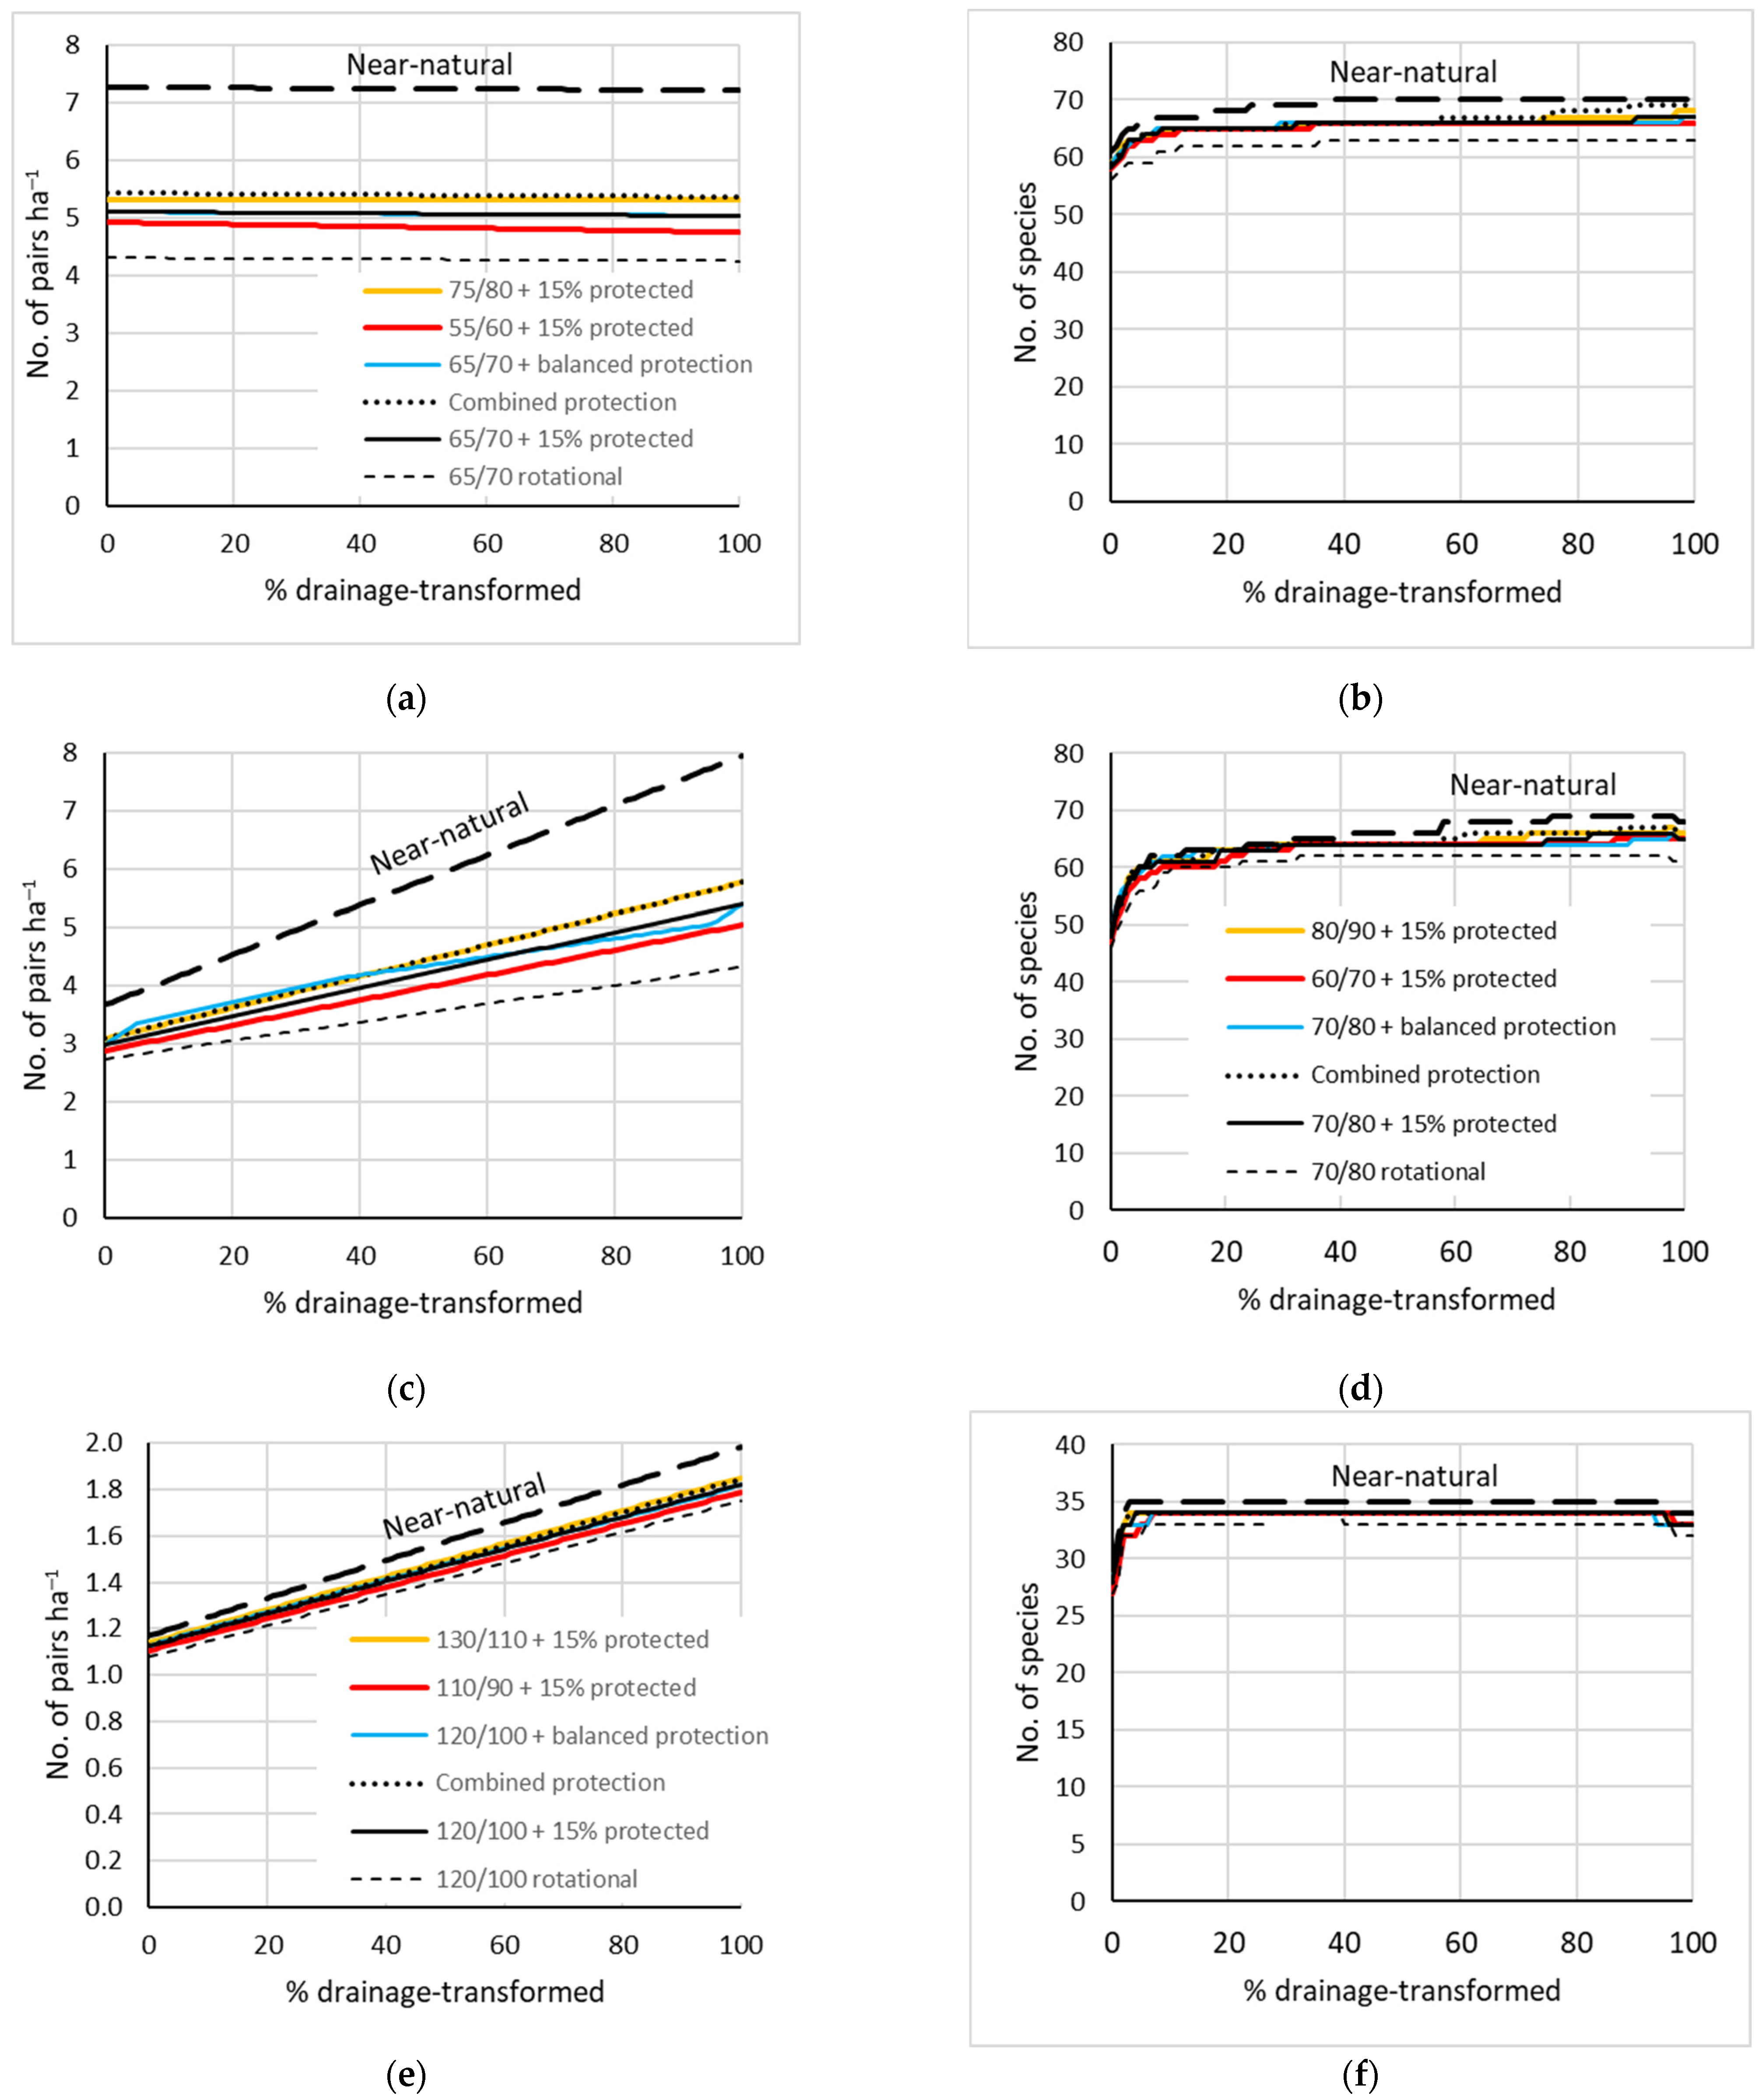
The results of combined scenarios in landscape mixtures showed major influences on bird abundance and, expectably, smaller differences in landscape-scale species richness. The first set of those models was focused on mixtures of more and less productive forest types: mesic mixedwood and dry pine forests on mineral soil (Figure 5a,b), a peatland mixture of eutrophic swamps and ombrotrophic bogs (Figure 5c,d), and its fully transformed state after forestry drainage (Figure 5e,f). The second set of models simulated the transformation of swamp, fen, and bog forests, respectively (Figure 6).
The main findings based on those models were as follows:
- The effects of increasing or reducing rotation age by 10 years were symmetrical around the current rotation scenario. The 10-year reduction in the rotation age, while retaining the 15% strict protection, had a much less detrimental effect on the bird densities than retaining the rotation length, but removing the strict protection.
- The combined protection following the EU Biodiversity Strategy [29] had a strong positive influence on the bird densities in the most productive sites on mineral soil (Figure 5a). In peatlands, its performance was similar to a 10-year increase in the rotation age, while retaining the simple 15% strict protection (e.g., Figure 5c and Figure 6).
- Allocating strict protection to the rarer forest types on the landscape only had a limited positive effect in a narrow range of conditions—at ca. 5–30% share of the productive forest type (Figure 5b,c,e). At >80% share, the effect of such allocation became negative, comparable with reducing rotation lengths by 10 years (Figure 5e).
- The site-transformative effects of forestry drainage were forest-type dependent and mostly added species to the landscapes. The only direct drainage-caused losses estimated by the models were Grus grus in natural birch fens and Corvus corax in bogs. In productive swamps on thin peat, a moderate species addition (11%) was the main effect (Figure 6a,b), while the additions were larger in pine bogs (24%) and birch fens (33%) and also caused increases in overall densities there (Figure 6c–f).
- The main pressure of forestry drainage on forest-bird assemblages is its likely indirect effect through intensified logging (Figure 6). This was clearest for bird abundance in swamps (Figure 6a: ‘near-natural’ intact swamp vs. a forestry scenario of a transformed state). However, when drained managed forests on former swamp and fen sites are protected and become older, they can contribute patches of relatively high bird density (Figure 6a,c: ‘near-natural’ scenarios on the right).
4. Discussion
4.1. Bird Assemblages as Indicators of Ecological Integrity
The broad aim of this modelling study was to assess landscape-scale integrity through the lens of bird-assemblage dynamics. Specific management implications are discussed in more detail in Section 4.2, but there were two overarching findings.
First, site productivity was a major effect modifier of the management scenarios. Its effect combined two mechanisms: a natural potential to support a rich bird assemblage versus the economic adjustment for shorter rotations in productive sites. Supporting my study hypothesis, the result was a disproportionately large reduction in bird assemblages in rotationally managed heterogeneous landscapes. A reverse was also true: strict reserves in productive forests did not just increase representation of their specific or threatened species pools but served as overall hotspots with disproportionately large landscape-scale effects (see also [55,56,57,58]). An obvious reason is that many bird species are not strict forest-type specialists, but nevertheless have higher densities in more productive forests. Such a site-productivity effect (gains of pairs and species) extended to artificial draining of some poorer peatland forests, particularly if that was not followed by intensive logging.
These results imply that sustainable forest management should explicitly plan for the management regimes of ecological hotspots in forest landscapes.
Secondly, total bird densities were much more sensitive to management scenarios than species turnover or species richness. In fact, their estimated relationship suggested a major role of a simple ‘more-individuals’ mechanism (supported by site productivity, see above) on the number of species [59,60,61]. It is unclear how much the shape of the particular relationship extracted (Figure 4) depended on the averaging of input densities or how the ‘presence’ of a species was modelled. Notably, the species losses predicted by the models were of sparse species, mostly owls and raptors, which may be limited in younger forests by a lack nest sites. Since this limitation depends on tree retention approaches [62], there is a range of alternative density values for young forests and for the model outcomes.
Nevertheless, since common species contribute most to total densities, my results support using common birds as early-warning indicators in sustainable forest management. The current use of common-bird indicators, at least for European forests, has become based on standardized trends of a fixed set of continentally widespread species [16,63]. Such trends do not measure the realization or loss of the ecological potential of forest ecosystems, which is relevant for ecological integrity questions (see [64]). For example, what are the functional consequences of managing productive forest types at only half of their ecological carrying capacity (Figure 3), particularly when we consider that most of such areas have been already converted to agriculture? In applied vegetation science, such a potential has been captured through the concept of ‘potential natural vegetation’ [65], which could be broadened for use in ecosystem sustainability assessments.
An assemblage-density perspective could thus complement assessments of particular environmental threats, limiting factors, or selected species sensitive to these in forest landscapes (e.g., [8,37,66,67]). Using the Estonian example, the modelled density differences among management scenarios (Figure 5 and Figure 6) had a magnitude similar to the recent 26% decline reported based on point counts [25]. Considering as well the likely density reductions due to intensified thinnings [68] and reports on the trend reversal at reduced management intensities elsewhere [69], intensified forestry so far stands out as the most plausible explanation to the observed decline in the Estonian forest birds.
4.2. Sustaining Birds in Even-Aged Silvicultural Contexts
The main goal of the scenario analysis was to understand potential contributions of alternative approaches to sustainable forest management. Such analyses are still rare in terms of absolute per area biodiversity measurements, which require representative abundance data by species. Although breeding-bird counts also remain incomplete (and do not provide information on bird abundance outside the breeding season), relative indices contain additional biases and are less straightforward for cost–benefit analyses or for manager communication [18].
I highlight four implications for management from the current study.
- (1)
- At the landscape scale, there was no evidence for a dilemma between conserving old-forest versus early-successional species (cf. [70]). The early-successional species, typical also of seminatural meadows, also remained present in the long-rotation (‘near-natural’) scenario that retained the highest total densities and species richness. However, this result may depend on clear-cuts being large enough [71]; it may also be region-specific. One issue is that the calculations omitted some early-successional species that may have larger area requirements than those included, e.g., Circus cyaneus [72]. For some other species, notably Lyrurus tetrix, the importance of early-successional forests was modelled as forest-type specific and thus depends on the landscape [8]. The same applies to several raptor, owl, and woodpecker species that nest in forests but, depending on other habitats on the landscape, may benefit from clear-cuts as foraging habitats. Such adjacency effects were not considered in these models and deserve further study, as does the potential to design some parts of forest landscapes more suitable for early-successional species.
- (2)
- Old-forest reserves appeared as a central mitigation tool against reductions in bird densities at current rotations. This concurs with the results of spatial models [73,74] and empirical data elsewhere [75,76]. In Estonia, the current protected area (15% of forest land) is still far from old-growth habitat quality, but there is the first evidence of old-forest species colonizing landscapes through the reserve networks [77]. In addition, by providing patches with old-forest structure, even drained forests on former swamp and fen sites could mitigate landscape-level forestry impacts on birds if old stands of natural site types are scarce. These findings help with the planning of set-asides and their natural recovery in the forest landscapes that have already been degraded. The modelled protection scenarios also serve as hypotheses of future dynamics in such landscapes that can be tested against empirical data.
- (3)
- The protection system envisioned in the EU Biodiversity Strategy [29] notably outperformed other conservation improvements in the most productive forests (see also [78]). An alternative with similar performance for birds in less productive forests was to increase rotation age in all production forests. The cost-effectiveness of these alternatives may vary among jurisdictions, e.g., depending on forest ownership structure and the system of conservation incentives.
- (4)
- The predictions of forestry drainage consequences highlighted that such impact assessments should include the following timber production in drained forests, rather than focusing on draining alone. While ecologically, drainage and rotational forestry can be analyzed separately, they realize as connected forestry-intensification decisions in a longer perspective [23]. On the other hand, until rotational management has not transformed the age structure, the changes in bird assemblages of some drained forest types may be rather subtle. This suggests that, in the case of birds, restoration of the hydrology of drained forests may lead to dilemmas wherein negative short-term impacts of the interventions should be considered [79].
4.3. Study Limitations
There are three main types of limitations to this study. The most general is an implicit assumption that habitat-type composition (formalized as forest type × stand age combination) captures most of the variation in species densities, which in turn serve as a proxy of population viability in rotational forest landscapes. Many bird studies report that this is not necessarily the case, notably due to edge and adjacency effects, within-stand heterogeneity (microhabitats), sink-source structure of the populations, or different environmental factors or social dominance affecting site colonization and reproduction (e.g., [80,81,82,83]). A simple approach to conceptualize those effects would be to further split the habitat types into ‘subunits’, for example, by also distinguishing edge areas and some major tree-compositional variants. It does not follow, however, that landscape-scale influences of rotational management on any of those habitat subunits should deviate from the variability documented at a coarser scale [84]. A key question might be whether some habitat subunits host specific bird species that might become vulnerable due to smaller areas than modelled for the coarse habitat types [85,86]. Hence, these fine-scale effects are more likely to be seen in particular species (and worth analyzing separately; Section 4.1) than for assemblage characteristics.
The qualitatively most important question regarding such hidden factors is that of potential compensatory effects of forest management. For example, whether the loss of older stands might be compensated by density increases through edge effects; whether silviculturally enhancing stands of different tree species or using variable techniques might increase beta diversity of the bird assemblages in managed landscapes [87]; or whether road construction and forestry drainage might enrich bird habitats with new conditions or habitat elements. The latter was also partly supported in this study in poor forested wetland types, while the role of fragmentation in the high-density estimates in Estonian old forests has been discussed elsewhere [18,45]. However, since such effects have not been purposefully planned for biodiversity, they probably vary a lot among real landscapes and are not an inherent feature of the rotational management. Furthermore, they can be equally well accompanied with, and possibly neutralized by, additional detrimental effects on birds, such as the removal of important habitat structures and heterogeneity at thinnings, increases in mesopredators, or disturbances. There is a necessity to study such complex effects and to distinguish the least-detrimental silvicultural and landscape options at particular logging intensities [88].
Secondly, the model input data were heavily smoothed, particularly at the species level. The estimates of species turnover and changes in species richness are thus clearly conservative, given also that many rare or difficult-to-model species were omitted altogether. Another source of uncertainty was that small variations in average densities cannot be reasonably detected in the (inevitably varying) original census data. The models also ignored random variation (the input was one average density estimate per habitat type per species). In the real world, habitats have finite areas and their patches host a finite number of bird pairs. Thus, the presence of rarer species on landscapes may have a strong stochastic component, which was not captured in a general <1 pair/km2 density threshold of absence (but see [84] for an empirical study at the same scale).
Yet, what primarily matters for the current analysis is whether such changes would affect the relative differences among the scenarios and from the reference scenario (here: 200-year rotation). Most important of such potential biases may be the uncertainty over bird densities in forests exceeding 150 years of age, which would affect the performance of the old-forest reserves in the models. However, somewhat counterintuitively, the species may reduce their habitat breadth, and thus become even more vulnerable, at higher losses of their main habitat [89]. In such a case, forestry-related loss of old stands could be even more effectively compensated by old-forest reserves.
Finally, the input (and thus at least some model outputs) are specific to the particular geographic region, time scale, and management practices. In addition, within Estonia, shapes of the rank-abundance curves of bird assemblages varied among forest types. This indicates that universal quantitative models of forestry impacts on birds may not be achievable. What might be a robust scale, forest typology, and avian indicators that contribute to wider conservation and forestry assessments remain to be studied (cf. [90]). Geo-graphically different species pools and modifications of even-aged forestry may further affect model outcomes. For example, forest birds in North Europe may be less sensitive to even-aged forestry than those in North America [91] and some ‘early-successional’ birds (here modelled as clear-cut specialists) may find optimal habitat in sparse stands [92]. Invasive or feral species, which are an important threat to forest birds in many regions, may change the relative outcomes of conservation options (e.g., [93]).
Further complexity is added in landscape mixtures of native and exotic woody species, and in farmland–forest mosaics [94]. In Britain, recent declines of woodland birds are mostly related to early-successional habitats, since old growth has been lost long ago [95]. In addition, in the Estonian forests, stand-scale management (particularly of clear-cuts and young stands) has changed repeatedly during the last decades. On top of that, there have been several species-level changes in abundances that are apparently unrelated to stand structure, e.g., the spread of Turdus merula and decline of Sturnus vulgaris among common birds [18,52].
5. Conclusions
The landscape-composition models indicated that total breeding-bird density had a sensitive response to several basic scenarios for sustainable forest management and conservation. When a (near-natural) reference state is defined, the bird responses can also provide a measure of ecological integrity and might help to set broad landscape management goals. The scenarios and goals can be further regionally specified where sufficient data on bird densities are available, e.g., by adding continuous-cover and plantation forestry and forest restoration to the ‘even-aged management with set-asides’ scenario.
The largest (likely) reductions in the Estonian forest-bird fauna were related to the loss of old forests, particularly a disproportionate degradation in the natural hotspots in the most productive sites. Consequently, a representative network of old-forest reserves appeared to be a major mitigation tool. In productive sites, expanding some protection levels to wider areas (as envisioned in the EU Biodiversity Strategy) would make a further contribution. How much and which kind of forest use could be allowed in such wider protection zones is a study priority, at least on the continental scale.
Supplementary Materials
The following supporting information can be downloaded at: https://www.mdpi.com/article/10.3390/land11111965/s1, Table S1: Species density values by habitat type used in the models; Table S2: Total-density functions used in the models.
Funding
This research was funded by the Estonian Research Council, grant number 1121.
Data Availability Statement
The data generated and used in this study as model input have been supplied as the Supplementary Materials.
Acknowledgments
I am grateful to Eerik Leibak for commenting on the input data and to Raul Rosenvald for discussions on the management scenarios. Three anonymous reviewers provided thoughtful comments on the manuscript.
Conflicts of Interest
The author declares no conflict of interest. The funders had no role in the design of the study; in the collection, analyses, or interpretation of data; in the writing of the manuscript; or in the decision to publish the results.
References
- Rametsteiner, E.; Mayer, P. Sustainable forest management and Pan-European forest policy. Ecol. Bull. 2004, 51, 51–57. [Google Scholar]
- Lindenmayer, D.B.; Cunningham, S.A. Six principles for managing forests as ecologically sustainable ecosystems. Landsc. Ecol. 2013, 28, 1099–1110. [Google Scholar] [CrossRef]
- Hunter, M.L., Jr. (Ed.) Maintaining Biodiversity in Forest Ecosystems; Cambridge University Press: Cambridge, UK, 1999. [Google Scholar]
- Kremen, C.; Merenlender, A.M. Landscapes that work for biodiversity and people. Science 2018, 362, eaau6020. [Google Scholar] [CrossRef] [Green Version]
- Lindenmayer, D.; Hobbs, R.J.; Montague-Drake, R.; Alexandra, J.; Bennett, A.; Burgman, M.; Cale, P.; Calhoun, A.; Cramer, V.; Cullen, P.; et al. A checklist for ecological management of landscapes for conservation. Ecol. Lett. 2008, 11, 78–91. [Google Scholar] [CrossRef]
- Rempel, R.S.; Naylor, B.J.; Elkie, P.C.; Baker, J.; Churcher, J.; Gluck, M.J. An indicator system to assess ecological integrity of managed forests. Ecol. Indic. 2016, 60, 860–869. [Google Scholar] [CrossRef] [Green Version]
- Hutto, R.L. Using landbirds as an indicator species group. In Avian Conservation: Research and Management; Marzluff, J.M., Sallabanks, R., Eds.; Island Press: Washington, DC, USA, 1998; pp. 75–92. [Google Scholar]
- Angelstam, P.; Roberge, J.-M.; Lõhmus, A.; Bergmanis, M.; Brazaitis, G.; Dönz-Breuss, M.; Edenius, L.; Kosinski, Z.; Kurlavicius, P.; Lārmanis, V.; et al. Habitat modelling as a tool for landscape-scale conservation—A review of parameters for focal forest birds. Ecol. Bull. 2004, 51, 427–453. [Google Scholar]
- Whelan, C.J.; Şekercioğlu, Ç.H.; Wenny, D.G. Why birds matter: From economic ornithology to ecosystem services. J. Ornithol. 2015, 156, 227–238. [Google Scholar] [CrossRef]
- Schulze, E.D.; Craven, D.; Durso, A.M.; Reif, J.; Guderle, M.; Kroiher, F.; Hennig, P.; Weiserbs, A.; Schall, P.; Ammer, C.; et al. Positive association between forest management, environmental change, and forest bird abundance. For. Ecosyst. 2019, 6, 3. [Google Scholar] [CrossRef] [Green Version]
- Oettel, J.; Lapin, K. Linking forest management and biodiversity indicators to strengthen sustainable forest management in Europe. Ecol. Indic. 2021, 122, 107275. [Google Scholar] [CrossRef]
- Andrén, H. Effects of habitat fragmentation on birds and mammals in landscapes with different proportions of suitable habitat: A review. Oikos 1994, 71, 355–366. [Google Scholar] [CrossRef] [Green Version]
- Andrén, H.; Delin, A.; Seiler, A. Population response to landscape changes depends on specialization to different landscape elements. Oikos 1997, 80, 193–196. [Google Scholar] [CrossRef]
- Opdam, P.; Wiens, J.A. Fragmentation, habitat loss and landscape management. In Conserving Bird Biodiversity: General Principles and Their Application; Norris, K., Pain, D.J., Eds.; Cambridge University Press: Cambridge, UK, 2002; pp. 202–223. [Google Scholar]
- Gregory, R.D.; Voříšek, P.; Van Strien, A.; Gmelig Meyling, A.W.; Jiguet, F.; Fornasari, L.; Reif, J.; Chylarecki, P.; Burfield, I.J. Population trends of widespread woodland birds in Europe. Ibis 2007, 149, 78–97. [Google Scholar] [CrossRef]
- Voříšek, P.; Schwarz, M.; Raši, R. Pilot Study: Common Forest Bird Species Indicator; Forest Europe, Liaison Unit: Bratislava-Zvolen, Slovakia, 2019; Available online: https://foresteurope.org (accessed on 10 October 2022).
- Betts, M.G.; Yang, Z.; Hadley, A.S.; Smith, A.C.; Rousseau, J.S.; Northrup, J.M.; Nocera, J.J.; Gorelick, N.; Gerber, B.D. Forest degradation drives widespread avian habitat and population declines. Nat. Ecol. Evol. 2022, 6, 709–719. [Google Scholar] [CrossRef] [PubMed]
- Lõhmus, A. Absolute densities of breeding birds in Estonian forests: A synthesis. Acta Ornithol. 2022; 57, in press. [Google Scholar]
- Petty, S.J.; Avery, M.I. Forest Bird Communities: A Review of the Ecology and Management of Forest Bird Communities in Relation to Silvicultural Practices in the British Uplands; Forestry Commission: Edinburgh, UK, 1990; 110p. [Google Scholar]
- Ram, D.; Lindström, Å.; Pettersson, L.B.; Caplat, P. Forest clear-cuts as habitat for farmland birds and butterflies. For. Ecol. Manag. 2020, 473, 118239. [Google Scholar] [CrossRef]
- Angelstam, P.; Naumov, V.; Elbakidze, M.; Manton, M.; Priednieks, J.; Rendenieks, Z. Wood production and biodiversity conservation are rival forestry objectives in Europe’s Baltic Sea Region. Ecosphere 2018, 9, e02119. [Google Scholar] [CrossRef] [Green Version]
- Felton, A.; Sonesson, J.; Nilsson, U.; Lämås, T.; Lundmark, T.; Nordin, A.; Ranius, T.; Roberge, J.M. Varying rotation lengths in northern production forests: Implications for habitats provided by retention and production trees. Ambio 2017, 46, 324–334. [Google Scholar] [CrossRef] [Green Version]
- Lõhmus, A.; Remm, L.; Rannap, R. Just a ditch in forest? Reconsidering draining in the context of sustainable forest management. BioScience 2015, 65, 1066–1076. [Google Scholar] [CrossRef] [Green Version]
- Järvinen, O.; Kuusela, K.; Väisänen, R.A. Effects of modern forestry on the numbers of breeding birds in Finland. Silva Fenn. 1977, 11, 284–294. [Google Scholar] [CrossRef] [Green Version]
- Nellis, R.; Volke, V. Changes in abundances of forest birds during the period of 1983 to 2018. Hirundo 2019, 32, 63–80. [Google Scholar]
- Angelstam, P.; Manton, M.; Green, M.; Jonsson, B.G.; Mikusiński, G.; Svensson, J.; Sabatini, F.M. Sweden does not meet agreed national and international forest biodiversity targets: A call for adaptive landscape planning. Landsc. Urban Plann. 2020, 202, 103838. [Google Scholar] [CrossRef]
- Felton, A.; Löfroth, T.; Angelstam, P.; Gustafsson, L.; Hjältén, J.; Felton, A.M.; Simonsson, P.; Dahlberg, A.; Lindbladh, M.; Svensson, J.; et al. Keeping pace with forestry: Multi-scale conservation in a changing production forest matrix. Ambio 2020, 49, 1050–1064. [Google Scholar] [CrossRef] [PubMed] [Green Version]
- Mönkkönen, M.; Aakala, T.; Blattert, C.; Burgas, D.; Duflot, R.; Eyvindson, K.; Kouki, J.; Laaksonen, T.; Punttila, P. More wood but less biodiversity in forests in Finland: A historical evaluation. Memo. Soc. Fauna Flora Fenn. 2022, 98 (Suppl. S2), 1–11. [Google Scholar]
- European Commission. EU Biodiversity Strategy for 2030: Bringing Nature Back into Our Lives; Communication from the Commission to the European Parliament, the Council, the European Economic and Social Committee and the Committee of the Regions; European Commission: Brussels, Belgium, 2020. [Google Scholar]
- Jaagus, J. Climatic changes in Estonia during the second half of the 20th century in relationship with changes in large-scale atmospheric circulation. Theor. Appl. Climatol. 2006, 83, 77–88. [Google Scholar] [CrossRef]
- Laasimer, L. Vegetation of the Estonian S.S.R.; Valgus: Tallinn, Estonia, 1965. [Google Scholar]
- Sirkas, F.; Valgepea, M. Year-Book Forest 2020; Estonian Environmental Agency: Tallinn, Estonia, 2022. [Google Scholar]
- Lõhmus, E. Eesti Metsakasvukohatüübid [Estonian Forest Site Types]; Eesti NSV Agrotööstuskoondise Info-Ja Juurutusvalitsus: Tallinn, Estonia, 1984; 121p. [Google Scholar]
- Aitsam, V.; Sims, A.; Tolm, T.; Nikopensius, M.; Karu, H.; Raudsaar, M.; Valgepea, M.; Timmusk, T.; Pärt, E. Statistiline mets: 20 aastat Statistilist Metsainventeerimist Eestis; Estonian Environmental Agency: Tallinn, Estonia, 2019. [Google Scholar]
- Remm, L.; Lõhmus, P.; Leis, M.; Lõhmus, A. Long-term impacts of forest ditching on non-aquatic biodiversity: Conservation perspectives for a novel ecosystem. PLoS ONE 2013, 8, e63086. [Google Scholar] [CrossRef]
- Lõhmus, A.; Kohv, K.; Palo, A.; Viilma, K. Loss of old-growth, and the minimum need for strictly protected forests in Estonia. Ecol. Bull. 2004, 51, 401–411. [Google Scholar]
- Lõhmus, A.; Kont, R.; Runnel, K.; Vaikre, M.; Remm, L. Habitat models of focal species can link ecology and decision-making in sustainable forest management. Forests 2020, 11, 721. [Google Scholar] [CrossRef]
- Lõhmus, A.; Nellis, R.; Pullerits, M.; Leivits, M. The potential for long-term sustainability in seminatural forestry: A broad perspective based on woodpecker populations. Environ. Manag. 2016, 57, 558–571. [Google Scholar] [CrossRef]
- Lõhmus, A.; Leivits, M.; Pēterhofs, E.; Zizas, R.; Hofmanis, H.; Ojaste, I.; Kurlavičius, P. The Capercaillie (Tetrao urogallus): An iconic focal species for knowledge-based integrative management and conservation of Baltic forests. Biodivers. Conserv. 2017, 26, 1–21. [Google Scholar] [CrossRef]
- Mikusiński, G.; Roberge, J.-M.; Fuller, R.J. Future Forests: Avian Implications and Research Priorities. In Ecology and Conservation of Forest Birds; Mikusiński, G., Fuller, R.J., Roberge, J.-M., Eds.; Cambridge University Press: Cambridge, UK, 2018; pp. 508–536. [Google Scholar]
- Bettinger, P.; Boston, K.; Siry, J.P.; Grebner, D.L. Forest Management and Planning, 2nd ed.; Academic Press-Elsevier: London, UK, 2017; 349p. [Google Scholar]
- Pass, E.; Kont, R.; Lõhmus, A. Spruce planting leads post-clearcut bird assemblages to a novel successional pathway—A comparative study in hemiboreal mixed forests. Ann. For. Sci. 2022, 79, 20. [Google Scholar] [CrossRef]
- Vainu, A. Puhtu Metsa Haudelinnustiku Võrdlus Aastatel 1965 ja 2016 [Breeding Bird Fauna of the Puhtu Forest in 1965 and 2017]; Student Work; Pärnu Sütevaka Gümnaasium: Pärnu, Estonia, 2017. [Google Scholar]
- Rosenvald, R.; Lõhmus, A. Breeding birds in hemiboreal clear-cuts: Tree retention effects in relation to site type. Forestry 2007, 80, 503–516. [Google Scholar] [CrossRef] [Green Version]
- Rosenvald, R.; Lõhmus, A.; Kraut, A.; Remm, L. Bird communities in hemiboreal old-growth forests: The roles of food supply, stand structure, and site type. For. Ecol. Manag. 2011, 262, 1541–1550. [Google Scholar] [CrossRef]
- Lõhmus, A. Population densities of breeding birds in forests surrounding the drained Kripsi mire (East Estonia). Hirundo 2020, 33, 30–52. [Google Scholar]
- Rootsi, I.; Viht, E.; Õun, A. Land bird association of Lahemaa National Park. In Lahemaa Uurimused, III; Valgus: Tallinn, Estonia, 1988; pp. 143–157. [Google Scholar]
- Vilbaste, H. Number dynamics of the breeding birds in the forest of South-West Estonia. Commun. Balt. Comm. Study Birds Migr. 1990, 22, 102–117. [Google Scholar]
- Lõhmus, A. Breeding bird communities in two Estonian forest landscapes: Are managed areas lost for biodiversity conservation? Proc. Est. Acad. Sci. Biol. Ecol. 2004, 53, 52–67. [Google Scholar] [CrossRef]
- Kiis, M. Nesting Birds of Pine Bog Woodlands: Effects of Forestry Draining and Restoration. Master’s Thesis, University of Tartu, Tartu, Estonia, 2020. [Google Scholar]
- Avolio, M.L.; Carroll, I.T.; Collins, S.L.; Houseman, G.R.; Hallett, L.M.; Isbell, F.; Koerner, S.E.; Komatsu, K.J.; Smith, M.D.; Wilcox, K.R. A comprehensive approach to analyzing community dynamics using rank abundance curves. Ecosphere 2019, 10, e02881. [Google Scholar] [CrossRef] [Green Version]
- Elts, J.; Kuus, A.; Leibak, E. (Eds.) Distribution and Numbers of Estonian Breeding Birds; Eesti Ornitoloogiaühing: Tartu, Estonia, 2018; 557p. [Google Scholar]
- Väli, Ü.; Nellis, R.; Lõhmus, A. The abundances and reproductive performances of Estonian raptors from 1994 to 2018. Hirundo 2019, 32, 40–62. [Google Scholar]
- Zawadzka, D.; Drozdowski, S.; Zawadzki, G.; Zawadzki, J.; Mikitiuk, A. Importance of old forest stands for diversity of birds in managed pine forests—A case study from Augustów Forest (NE Poland). Pol. J. Ecol. 2018, 66, 162–181. [Google Scholar] [CrossRef]
- Joppa, L.N.; Pfaff, A. High and far: Biases in the location of protected areas. PLoS ONE 2009, 4, e8273. [Google Scholar] [CrossRef]
- Honkanen, M.; Roberge, J.M.; Rajasärkkä, A.; Mönkkönen, M. Disentangling the effects of area, energy and habitat heterogeneity on boreal forest bird species richness in protected areas. Glob. Ecol. Biogeogr. 2010, 19, 61–71. [Google Scholar] [CrossRef]
- Venter, O.; Magrach, A.; Outram, N.; Klein, C.J.; Possingham, H.P.; Di Marco, M.; Watson, J.E. Bias in protected-area location and its effects on long-term aspirations of biodiversity conventions. Conserv. Biol. 2018, 32, 127–134. [Google Scholar] [CrossRef] [PubMed]
- Taylor, C.; Lindenmayer, D.B. The adequacy of Victoria’s protected areas for conserving its forest-dependent fauna. Austral Ecol. 2019, 44, 1076–1091. [Google Scholar] [CrossRef]
- Mönkkönen, M.; Forsman, J.T.; Bokma, F. Energy availability, abundance, energy-use and species richness in forest bird communities: A test of the species–energy theory. Glob. Ecol. Biogeogr. 2006, 15, 290–302. [Google Scholar] [CrossRef]
- Seoane, J.; Laiolo, P.; Obeso, J.R. Abundance leads to more species, particularly in complex habitats: A test of the increased population size hypotheses in bird communities. J. Biogeogr. 2017, 44, 556–566. [Google Scholar] [CrossRef]
- Storch, D.; Bohdalková, E.; Okie, J. The more-individuals hypothesis revisited: The role of community abundance in species richness regulation and the productivity–diversity relationship. Ecol. Lett. 2018, 21, 920–937. [Google Scholar] [CrossRef]
- Rosenvald, R.; Lõhmus, P.; Rannap, R.; Remm, L.; Rosenvald, K.; Runnel, K.; Lõhmus, A. Assessing long-term effectiveness of green-tree retention. For. Ecol. Manag. 2019, 448, 543–548. [Google Scholar] [CrossRef]
- Gregory, R.D.; Skorpilova, J.; Vorisek, P.; Butler, S. An analysis of trends, uncertainty and species selection shows contrasting trends of widespread forest and farmland birds in Europe. Ecol. Indic. 2019, 103, 676–687. [Google Scholar] [CrossRef]
- Roche, P.K.; Campagne, C.S. From ecosystem integrity to ecosystem condition: A continuity of concepts supporting different aspects of ecosystem sustainability. Curr. Opin. Environ. Sustain. 2017, 29, 63–68. [Google Scholar] [CrossRef]
- Loidi, J.; Fernández-González, F. Potential natural vegetation: Reburying or reboring? J. Veg. Sci. 2012, 23, 596–604. [Google Scholar] [CrossRef]
- Carignan, V.; Villard, M.A. Selecting indicator species to monitor ecological integrity: A review. Environ. Monit. Assess. 2002, 78, 45–61. [Google Scholar] [CrossRef]
- Wade, A.S.; Barov, B.; Burfield, I.J.; Gregory, R.D.; Norris, K.; Vorisek, P.; Wu, T.; Butler, S.J. A niche-based framework to assess current monitoring of European forest birds and guide indicator species’ selection. PLoS ONE 2014, 9, e97217. [Google Scholar] [CrossRef] [PubMed] [Green Version]
- Lõhmus, A. Short-term impacts of clear-cutting and thinning on breeding birds in forests. Hirundo 2021, 34, 120084. [Google Scholar]
- Reif, J.; Skálová, A.J.; Vermouzek, Z.; Voříšek, P. Long-term trends in forest bird populations reflect management changes in Central European forests. Ecol. Indic. 2022, 141, 109137. [Google Scholar] [CrossRef]
- King, D.I.; Schlossberg, S. Synthesis of the conservation value of the early-successional stage in forests of eastern North America. For. Ecol. Manag. 2014, 324, 186–195. [Google Scholar] [CrossRef]
- DeGraaf, R.M.; Yamasaki, M. Options for managing early-successional forest and shrubland bird habitats in the northeastern United States. For. Ecol. Manag. 2003, 185, 179–191. [Google Scholar] [CrossRef]
- Wilson, M.W.; Irwin, S.; Norriss, D.W.; Newton, S.F.; Collins, K.; Kelly, T.C.; O’Halloran, J. The importance of pre-thicket conifer plantations for nesting Hen Harriers Circus cyaneus in Ireland. Ibis 2009, 151, 332–343. [Google Scholar] [CrossRef]
- Loehle, C.; Van Deusen, P.; Wigley, T.B.; Mitchell, M.S.; Rutzmoser, S.H.; Aggett, J.; Beebe, J.A.; Smith, M.L. A method for landscape analysis of forestry guidelines using bird habitat models and the Habplan harvest scheduler. For. Ecol. Manag. 2006, 232, 56–67. [Google Scholar] [CrossRef]
- Spies, T.A.; McComb, B.C.; Kennedy, R.S.H.; McGrath, M.T.; Olsen, K.; Pabst, R.J. Potential effects of forest policies on terrestrial biodiversity in a multi-ownership province. Ecol. Appl. 2007, 17, 48–65. [Google Scholar] [CrossRef]
- Häkkilä, M.; Abrego, N.; Ovaskainen, O.; Mönkkönen, M. Habitat quality is more important than matrix quality for bird communities in protected areas. Ecol. Evol. 2018, 8, 4019–4030. [Google Scholar] [CrossRef]
- Timmers, R.; van Kuijk, M.; Verweij, P.A.; Ghazoul, J.; Hautier, Y.; Laurance, W.F.; Arriaga-Weiss, S.L.; Askins, R.A.; Battisti, C.; Berg, Å.; et al. Conservation of birds in fragmented landscapes requires protected areas. Front. Ecol. Environ. 2022, 20, 361–369. [Google Scholar] [CrossRef]
- Runnel, K.; Sell, I.; Lõhmus, A. Recovery of the Critically Endangered bracket fungus Amylocystis lapponica in the Estonian network of strictly protected forests. Oryx 2020, 54, 478–482. [Google Scholar] [CrossRef] [Green Version]
- Verschuyl, J.P.; Hansen, A.J.; McWethy, D.B.; Sallabanks, R.; Hutto, R.L. Is the effect of forest structure on bird diversity modified by forest productivity. Ecol. Appl. 2008, 18, 1155–1170. [Google Scholar] [CrossRef] [PubMed]
- Remm, L.; Lõhmus, A.; Leibak, E.; Kohv, M.; Salm, J.O.; Lõhmus, P.; Rosenvald, R.; Runnel, K.; Vellak, K.; Rannap, R. Restoration dilemmas between future ecosystem and current species values: The concept and a practical approach in Estonian mires. J. Environ. Manag. 2019, 250, 109439. [Google Scholar] [CrossRef] [PubMed]
- Block, W.M.; Brennan, L.A. The habitat concept in ornithology. In Current Ornithology; Power, D., Ed.; Springer: Boston, MA, USA, 1993; Volume 2, pp. 35–91. [Google Scholar]
- Schmiegelow, F.K.; Mönkkönen, M. Habitat loss and fragmentation in dynamic landscapes: Avian perspectives from the boreal forest. Ecol. Applic. 2002, 12, 375–389. [Google Scholar] [CrossRef]
- Johnson, M.D. Measuring habitat quality: A review. Condor 2007, 109, 489–504. [Google Scholar] [CrossRef]
- Halstead, K.E.; Alexander, J.D.; Hadley, A.S.; Stephens, J.L.; Yang, Z.; Betts, M.G. Using a species-centered approach to predict bird community responses to habitat fragmentation. Landsc. Ecol. 2019, 34, 1919–1935. [Google Scholar] [CrossRef]
- De Camargo, R.X.; Boucher-Lalonde, V.; Currie, D.J. At the landscape level, birds respond strongly to habitat amount but weakly to fragmentation. Divers. Distrib. 2018, 24, 629–639. [Google Scholar] [CrossRef] [Green Version]
- Sisk, T.D.; Haddad, N.M.; Ehrlich, P.R. Bird assemblages in patchy woodlands: Modeling the effects of edge and matrix habitats. Ecol. Appl. 1997, 7, 1170–1180. [Google Scholar] [CrossRef]
- Bennett, A.F.; Radford, J.Q. Thresholds, incidence functions, and species-specific cues: Responses of woodland birds to landscape structure in south-eastern Australia. In Setting Conservation Targets for Managed Forest Landscapes; Villard, M.-A., Jonsson, B.G., Eds.; Cambridge University Press: Cambdridge, UK; pp. 161–184.
- Mentil, L.; Battisti, C.; Carpaneto, G.M. The older the richer: Significant increase in breeding bird diversity along an age gradient of different coppiced woods. Web Ecol. 2018, 18, 143–151. [Google Scholar] [CrossRef] [Green Version]
- Arroyo-Rodríguez, V.; Fahrig, L.; Tabarelli, M.; Watling, J.I.; Tischendorf, L.; Benchimol, M.; Cazetta, E.; Faria, D.; Leal, I.R.; Melo, F.P.; et al. Designing optimal human-modified landscapes for forest biodiversity conservation. Ecol. Lett. 2020, 23, 1404–1420. [Google Scholar] [CrossRef]
- Torrenta, R.; Lacoste, F.; Villard, M.A. Loss and fragmentation of mature woodland reduce the habitat niche breadth of forest birds. Landsc. Ecol. 2018, 33, 1865–1879. [Google Scholar] [CrossRef]
- Barbati, A.; Marchetti, M.; Chirici, G.; Corona, P. European forest types and forest Europe SFM indicators: Tools for monitoring progress on forest biodiversity conservation. For. Ecol. Manag. 2014, 321, 145–157. [Google Scholar] [CrossRef] [Green Version]
- Mönkkönen, M.; Welsh, D.A. A biogeographical hypothesis on the effects of human caused landscape changes on the forest bird communities of Europe and North America. Ann. Zool. Fenn. 1994, 31, 61–70. [Google Scholar]
- Hanberry, B.B.; Thompson III, F.R. Open forest management for early successional birds. Wildl. Soc. Bull. 2019, 43, 141–151. [Google Scholar] [CrossRef] [Green Version]
- Latham, A.D.M.; Warburton, B.; Byrom, A.E.; Pech, R.P. The ecology and management of mammal invasions in forests. Biol. Invasions 2017, 19, 3121–3139. [Google Scholar] [CrossRef]
- Ónodi, G.; Botta-Dukát, Z.; Winkler, D.; Rédei, T. Endangered lowland oak forest steppe remnants keep unique bird species richness in Central Hungary. J. For. Res. 2022, 33, 343–355. [Google Scholar] [CrossRef]
- Fuller, R.J.; Smith, K.W.; Grice, P.V.; Currie, F.A.; Quine, C.P. Habitat change and woodland birds in Britain: Implications for management and future research. Ibis 2007, 149, 261–268. [Google Scholar] [CrossRef]
Figure 1.
Comparative rank-abundance curves for breeding-bird assemblages in Estonian forests. (a) Four ecosystems in an Estonian forest landscape (data from [46]). Production forest was managed using the even-aged system; Fragmented forest was a mixture with a cultural landscape. (b) Four successional stages of mixedwood on productive soils (data from [42]). Successional and Planted spruce stages were post-clear-cut forests of similar age (30–60 years), but with natural deciduous vs. planted Picea abies regeneration, respectively. An exponential function was fitted to each data series, after standardizing the mean abundance of each species to the most abundant species (1.0 on y-axis). The numbers in brackets in the legend indicate total no. of pairs/total no. of species sampled.

Figure 2.
Total breeding-bird densities, as estimated by two approaches: the sum of reported densities of individual species (y-axis; Supplementary Table S1) versus the total-density functions derived from territory-mapping studies ([18]; Supplementary Table S2). Each symbol is an estimate of the total density in one age class of a forest type; there were a total of 13 forest types × 20 age classes. The parity line and the most deviating forest-type series are indicated.

Figure 3.
Relative total densities of breeding birds by forest type in relation to rotation length: (a) High productivity forests (productivity index Ia–III); (b) less productive forests (productivity index III–Va). The relative density 1.0 refers to a uniform 200-year rotation; raw density estimates for calculations were taken from the total-density functions [18]. The circles indicate the current rotation lengths in Estonia (see Table 1 for details).

Figure 4.
Estimated landscape-scale loss of species in relation to the loss of bird pairs in 13 Estonian forest types (symbols) at current rotations, as compared to a uniform 200-year rotation (reference). Bubble size is proportional to the reference density. The intercept of the regression line has been set to zero, given that species cannot be lost without pairs lost.

Figure 5.
Mean modelled densities (left column) and species richness (right column) of breeding birds for six management scenarios in forest-type mixtures: (a,b) Oxalis mixedwood (more productive) and Rhodococcum pine forests; (c,d) swamp (more productive) and bog forest; (e,f) drained Oxalis (more productive) and drained bog. The two numbers in the scenario names indicate rotation lengths for the more productive/less productive forest types, respectively; their current values are those specified for the dashed line. The ‘balanced protection’ scenario safeguarded complete strict protection to any forest type until its 5% proportion in the landscape. ‘Combined’ protection combined current rotation lengths (70% of area) with strict protection (10%) and ‘near-natural’ management (20%); the latter being modelled as 200-year rotation.

Figure 6.
Mean modelled densities (left column) and species richness (right column) of breeding birds for seven management scenarios along forestry drainage gradients: (a,b) From swamp forest to secondary Filipendula forest; (c,d) from fen forest to drained Oxalis; (e,f) from bog forest to drained bog forest (note different y-scales compared with those above). The drainage gradients were modelled as forest-type mixtures. The ‘near-natural’ reference is a 200-year rotation. See Figure 5 for further explanations of the scenarios.

Publisher’s Note: MDPI stays neutral with regard to jurisdictional claims in published maps and institutional affiliations. |
© 2022 by the author. Licensee MDPI, Basel, Switzerland. This article is an open access article distributed under the terms and conditions of the Creative Commons Attribution (CC BY) license (https://creativecommons.org/licenses/by/4.0/).
Share and Cite
MDPI and ACS Style
Lõhmus, A. Ecological Sustainability at the Forest Landscape Level: A Bird Assemblage Perspective. Land 2022, 11, 1965. https://doi.org/10.3390/land11111965
AMA Style
Lõhmus A. Ecological Sustainability at the Forest Landscape Level: A Bird Assemblage Perspective. Land. 2022; 11(11):1965. https://doi.org/10.3390/land11111965
Chicago/Turabian StyleLõhmus, Asko. 2022. "Ecological Sustainability at the Forest Landscape Level: A Bird Assemblage Perspective" Land 11, no. 11: 1965. https://doi.org/10.3390/land11111965
Note that from the first issue of 2016, this journal uses article numbers instead of page numbers. See further details here.