
Simulating Soil-Plant-Climate Interactions and Greenhouse Gas Exchange in Boreal Grasslands Using the DNDC Model

Abstract
:1. Introduction
2. Materials and Methods
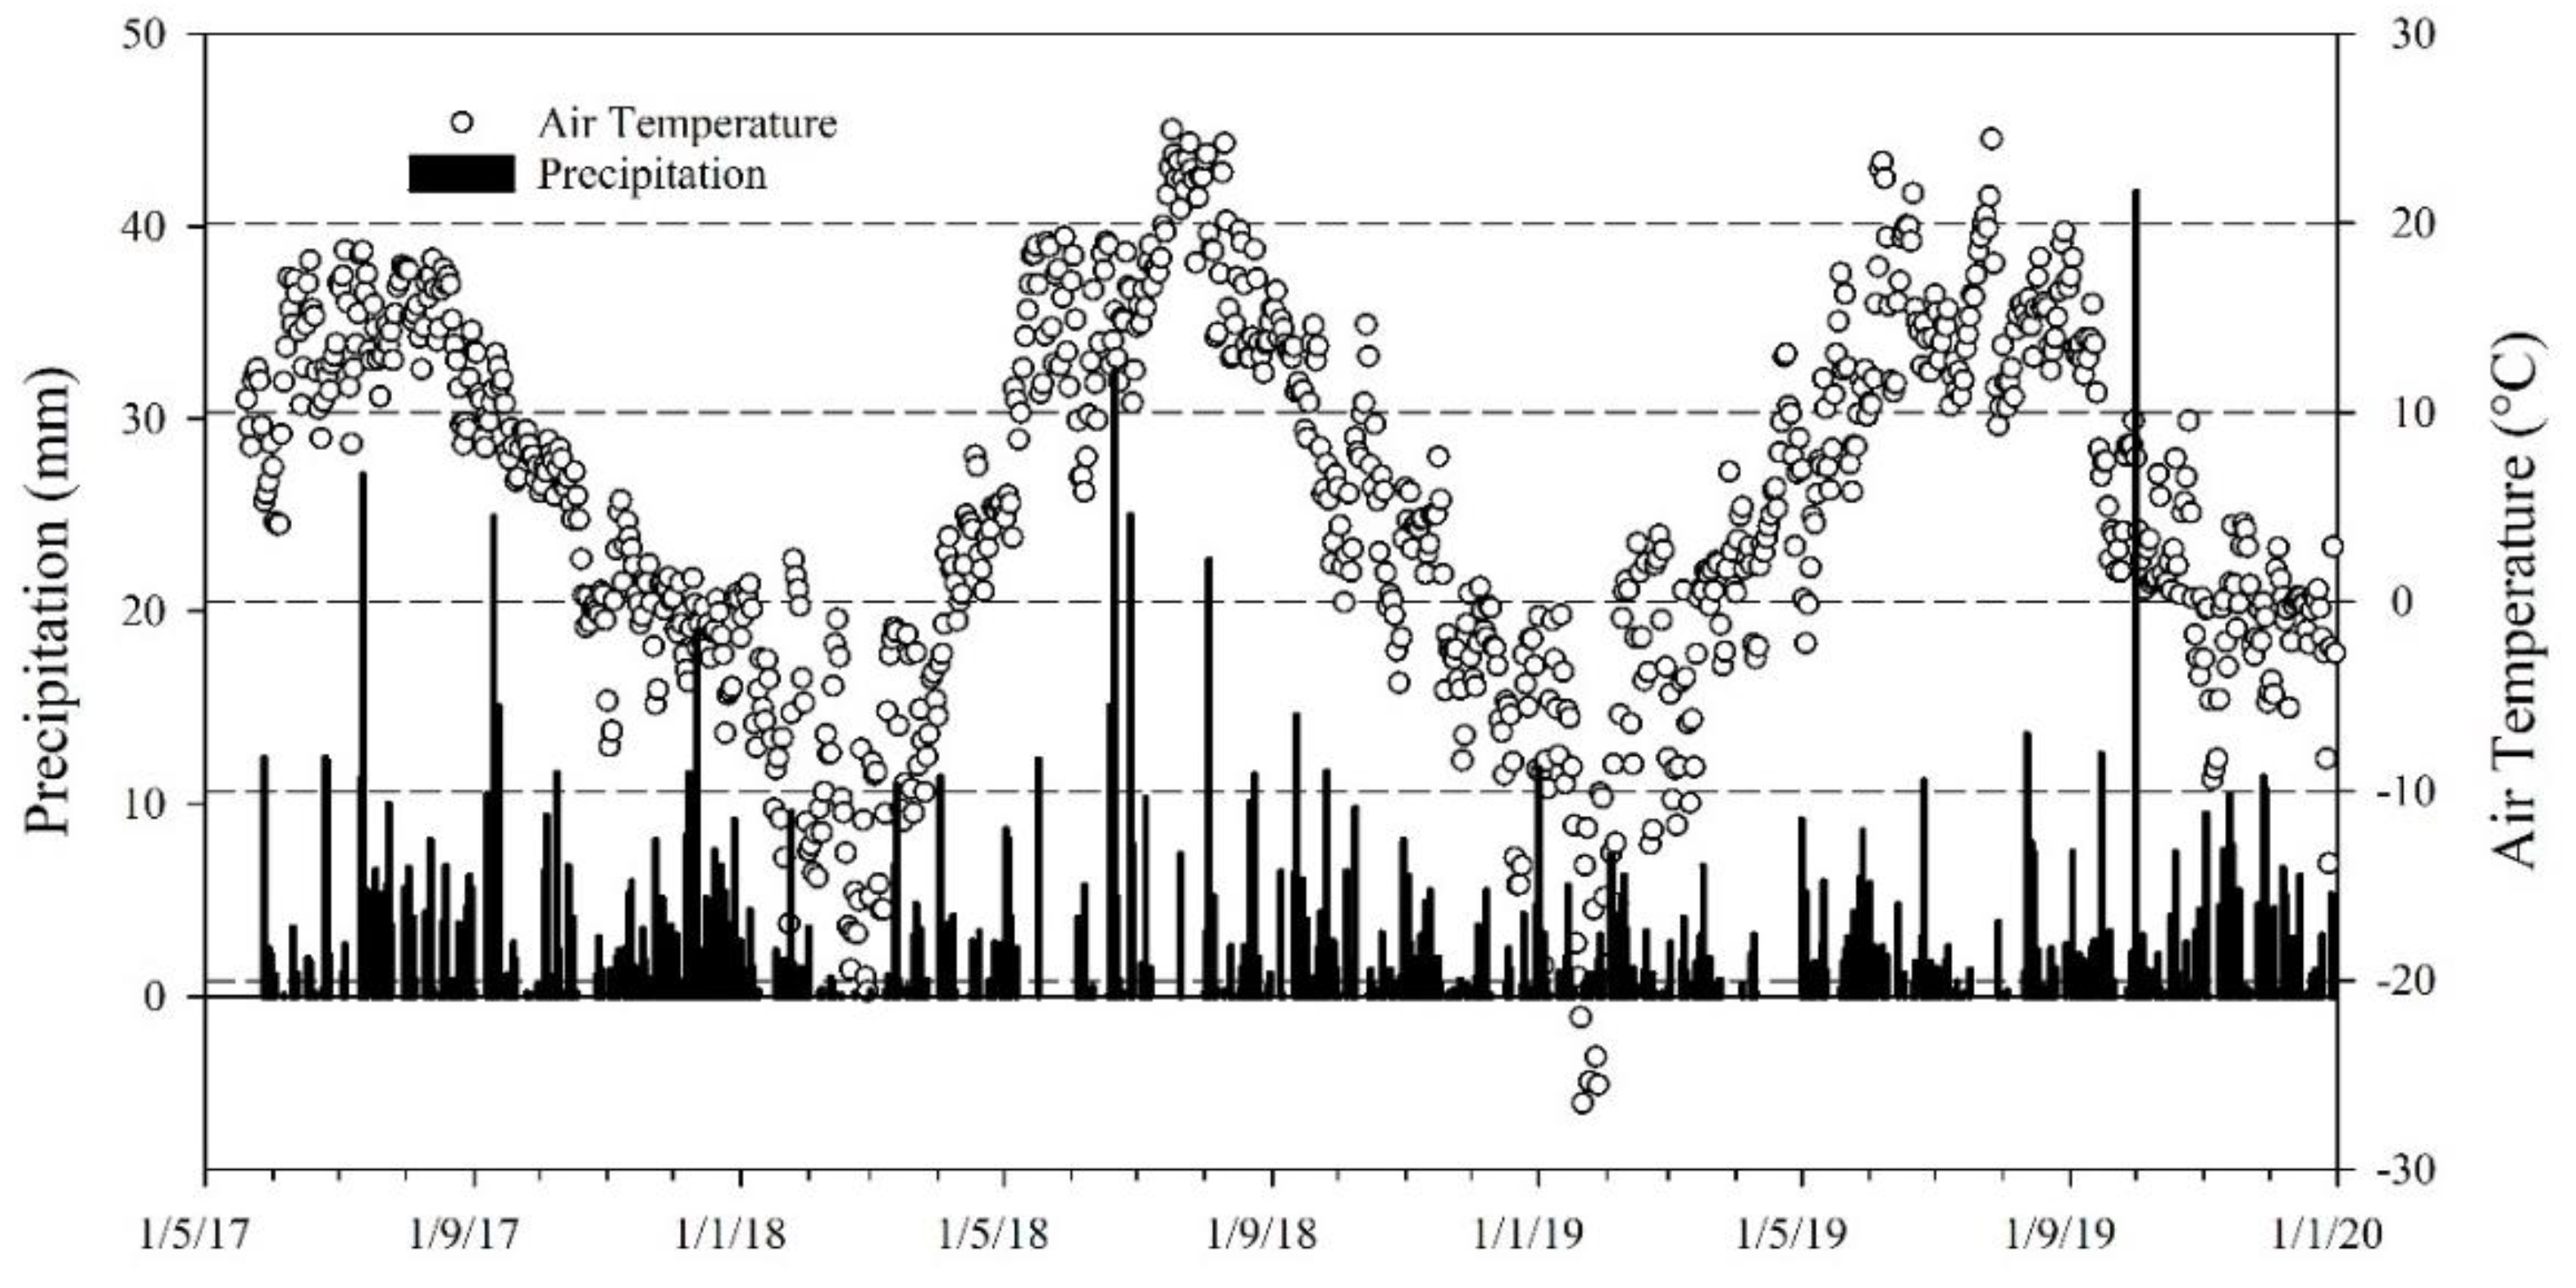
2.1. Site Description
2.2. Eddy Covariance Data
2.3. The DNDC Model
2.4. Model Initialisation Calibration and Evaluation
3. Results
4. Discussion
4.1. GHG Exchange
4.2. Soil Climate
4.3. Biomass
5. Conclusions
Author Contributions
Funding
Data Availability Statement
Conflicts of Interest
References
- Unc, A.; Altdorff, D.; Abakumov, E.; Adl, S.; Baldursson, S.; Bechtold, M.; Cattani, D.J.; Firbank, L.G.; Grand, S.; Guðjónsdóttir, M.; et al. Expansion of Agriculture in Northern Cold-Climate Regions: A Cross-Sectoral Perspective on Opportunities and Challenges. Front. Sustain. Food Syst. 2021, 5, 663448. [Google Scholar] [CrossRef]
- Lind, S.E.; Virkajärvi, P.; Hyvönen, N.P.; Maljanen, M.; Kivimäenpää, M.; Jokinen, S.; Antikainen, S.; Latva, M.; Räty, M.; Martikainen, P.J.; et al. Carbon dioxide and methane exchange of a perennial grassland on a boreal mineral soil. Boreal Environ. Res. 2020, 25, 1–17. [Google Scholar]
- United Nations Department for Economic and Social Affairs. Sustainable Development Goals Report 2022; S.l.: United Nations: New York, NY, USA, 2022. [Google Scholar]
- Harrison, M.T.; Cullen, B.R.; Mayberry, D.E.; Cowie, A.L.; Bilotto, F.; Badgery, W.B.; Liu, K.; Davison, T.; Christie, K.M.; Muleke, A.; et al. Carbon myopia: The urgent need for integrated social, economic and environmental action in the livestock sector. Glob. Chang. Biol. 2021, 27, 5726–5761. [Google Scholar] [CrossRef] [PubMed]
- Fleming, A.; O’Grady, A.P.; Stitzlein, C.; Ogilvy, S.; Mendham, D.; Harrison, M.T. Improving acceptance of natural capital accounting in land use decision making: Barriers and opportunities. Ecol. Econ. 2022, 200, 107510. [Google Scholar] [CrossRef]
- Harrison, M.T. Climate change benefits negated by extreme heat. Nat. Food 2021, 2, 855–856. [Google Scholar] [CrossRef]
- Harrison, M.T.; Evans, J.R.; Moore, A.D. Using a mathematical framework to examine physiological changes in winter wheat after livestock grazing: 1. Model derivation and coefficient calibration. Field Crops Res. 2012, 136, 116–126. [Google Scholar] [CrossRef]
- Harrison, M.T.; Evans, J.R.; Moore, A.D. Using a mathematical framework to examine physiological changes in winter wheat after livestock grazing: 2. Model validation and effects of grazing management. Field Crops Res. 2012, 136, 127–137. [Google Scholar] [CrossRef]
- Romera, A.J.; Cichota, R.; Beukes, P.C.; Gregorini, P.; Snow, V.O.; Vogeler, I. Combining Restricted Grazing and Nitrification Inhibitors to Reduce Nitrogen Leaching on New Zealand Dairy Farms. J. Environ. Qual. 2017, 46, 72–79. [Google Scholar] [CrossRef]
- Vogeler, I.; Beukes, P.; Burggraaf, V. Evaluation of mitigation strategies for nitrate leaching on pasture-based dairy systems. Agric. Syst. 2013, 115, 21–28. [Google Scholar] [CrossRef]
- Grant, B.; Smith, W.N.; Desjardins, R.; Lemke, R.; Li, C. Estimated N2O And CO2 Emissions as Influenced by Agricultural Practices in Canada. Clim. Change 2004, 65, 315–332. [Google Scholar] [CrossRef]
- Höglind, M.; Cameron, D.; Persson, T.; Huang, X.; van Oijen, M. BASGRA_N: A model for grassland productivity, quality and greenhouse gas balance. Ecol. Model. 2020, 417, 108925. [Google Scholar] [CrossRef]
- Korhonen, P.; Palosuo, T.; Persson, T.; Höglind, M.; Jégo, G.; Van Oijen, M.; Gustavsson, A.-M.; Bélanger, G.; Virkajärvi, P. Modelling grass yields in northern climates–A comparison of three growth models for timothy. Field Crops Res. 2017, 224, 37–47. [Google Scholar] [CrossRef]
- Riedo, M.; Grub, A.; Rosset, M.; Fuhrer, J. A pasture simulation model for dry matter production, and fluxes of carbon, nitrogen, water and energy. Ecol. Model. 1998, 105, 141–183. [Google Scholar] [CrossRef]
- Ehrhardt, F.; Soussana, J.-F.; Bellocchi, G.; Grace, P.; McAuliffe, R.; Recous, S.; Sándor, R.; Smith, P.; Snow, V.; de Antoni Migliorati, M.; et al. Assessing uncertainties in crop and pasture ensemble model simulations of productivity and N2O emissions. Glob. Chang. Biol. 2018, 24, e603–e616. [Google Scholar] [CrossRef] [Green Version]
- Graux, A.-I.; Gaurut, M.; Agabriel, J.; Baumont, R.; Delagarde, R.; Delaby, L.; Soussana, J.-F. Development of the pasture simulation model for assessing livestock production under climate change. Agric. Ecosyst. Environ. 2011, 144, 69–91. [Google Scholar] [CrossRef]
- Harrison, M.T.; Christie, K.M.; Rawnsley, R.P.; Eckard, R.J. Modelling pasture management and livestock genotype interventions to improve whole-farm productivity and reduce greenhouse gas emissions intensities. Anim. Prod. Sci. 2014, 54, 2018–2028. [Google Scholar] [CrossRef]
- Sándor, R.; Ehrhardt, F.; Brilli, L.; Carozzi, M.; Recous, S.; Smith, P.; Snow, V.; Soussana, J.-F.; Dorich, C.D.; Fuchs, K.; et al. The use of biogeochemical models to evaluate mitigation of greenhouse gas emissions from managed grasslands. Sci. Total Environ. 2018, 642, 292–306. [Google Scholar] [CrossRef] [PubMed] [Green Version]
- Ho, C.K.M.; Jackson, T.; Harrison, M.T.; Eckard, R.J. Increasing ewe genetic fecundity improves whole-farm production and reduces greenhouse gas emissions intensities: 2. Economic performance. Anim. Prod. Sci. 2014, 54, 1248–1253. [Google Scholar] [CrossRef]
- Bilotto, F.; Harrison, M.T.; Migliorati, M.D.A.; Christie, K.M.; Rowlings, D.W.; Grace, P.R.; Smith, A.P.; Rawnsley, R.P.; Thorburn, P.J.; Eckard, R.J. Can seasonal soil N mineralisation trends be leveraged to enhance pasture growth? Sci. Total Environ. 2021, 772, 145031. [Google Scholar] [CrossRef]
- Christie, K.M.; Smith, A.P.; Rawnsley, R.P.; Harrison, M.T.; Eckard, R.J. Simulated seasonal responses of grazed dairy pastures to nitrogen fertilizer in SE Australia: N loss and recovery. Agric. Syst. 2020, 182, 102847. [Google Scholar] [CrossRef]
- Sándor, R.; Ehrhardt, F.; Grace, P.; Recous, S.; Smith, P.; Snow, V.; Soussana, J.-F.; Basso, B.; Bhatia, A.; Brilli, L.; et al. Ensemble modelling of carbon fluxes in grasslands and croplands. Field Crops Res. 2020, 252, 107791. [Google Scholar] [CrossRef]
- Taylor, C.A.; Harrison, M.T.; Telfer, M.; Eckard, R. Modelled greenhouse gas emissions from beef cattle grazing irrigated leucaena in northern Australia. Anim. Prod. Sci. 2016, 56, 594. [Google Scholar] [CrossRef]
- Li, C.; Frolking, S.; Crocker, G.J.; Grace, P.R.; Klír, J.; Körchens, M.; Poulton, P.R. Simulating trends in soil organic carbon in long-term experiments using the DNDC model. Geoderma 1997, 81, 45–60. [Google Scholar] [CrossRef]
- Abdalla, M.; Song, X.; Ju, X.; Topp, C.F.E.; Smith, P. Calibration and validation of the DNDC model to estimate nitrous oxide emissions and crop productivity for a summer maize-winter wheat double cropping system in Hebei, China. Environ. Pollut. 2020, 262, 114199. [Google Scholar] [CrossRef]
- Abdalla, M.; Hastings, A.; Chadwick, D.; Jones, D.; Evans, C.; Jones, M.; Rees, R.; Smith, P. Critical review of the impacts of grazing intensity on soil organic carbon storage and other soil quality indicators in extensively managed grasslands. Agric. Ecosyst. Environ. 2018, 253, 62–81. [Google Scholar] [CrossRef] [Green Version]
- Abdalla, M.; Kumar, S.; Jones, M.; Burke, J.; Williams, M. Testing DNDC model for simulating soil respiration and assessing the effects of climate change on the CO2 gas flux from Irish agriculture. Glob. Planet. Chang. 2011, 78, 106–115. [Google Scholar] [CrossRef]
- Abdalla, M.; Wattenbach, M.; Smith, P.; Ambus, P.; Jones, M.; Williams, M. Application of the DNDC model to predict emissions of N2O from Irish agriculture. Geoderma 2009, 151, 327–337. [Google Scholar] [CrossRef]
- Congreves, K.; Grant, B.; Dutta, B.; Smith, W.; Chantigny, M.; Rochette, P.; Desjardins, R. Predicting ammonia volatilization after field application of swine slurry: DNDC model development. Agric. Ecosyst. Environ. 2016, 219, 179–189. [Google Scholar] [CrossRef]
- Guest, G.; Kröbel, R.; Grant, B.; Smith, W.; Sansoulet, J.; Pattey, E.; Desjardins, R.; Jégo, G.; Tremblay, N. Model comparison of soil processes in eastern Canada using DayCent, DNDC and STICS. Nutr. Cycl. Agroecosyst. 2017, 109, 211–232. [Google Scholar] [CrossRef]
- He, W.; Dutta, B.; Grant, B.; Chantigny, M.; Hunt, D.; Bittman, S.; Tenuta, M.; Worth, D.; VanderZaag, A.; Desjardins, R.; et al. Assessing the effects of manure application rate and timing on nitrous oxide emissions from managed grasslands under contrasting climate in Canada. Sci. Total Environ. 2020, 716, 135374. [Google Scholar] [CrossRef]
- Levy, P.E.; Mobbs, D.C.; Jones, S.K.; Milne, R.; Campbell, C.; Sutton, M.A. Simulation of fluxes of greenhouse gases from European grasslands using the DNDC model. Agric. Ecosyst. Environ. 2007, 121, 186–192. [Google Scholar] [CrossRef]
- Sansoulet, J.; Pattey, E.; Kröbel, R.; Grant, B.; Smith, W.; Jégo, G.; Desjardins, R.; Tremblay, N. Comparing the performance of the STICS, DNDC, and DayCent models for predicting N uptake and biomass of spring wheat in Eastern Canada. Field Crops Res. 2014, 156, 135–150. [Google Scholar] [CrossRef]
- Forster, D.; Helama, S.; Harrison, M.T.; Rotz, C.A.; Chang, J.; Ciais, P.; Pattey, E.; Virkajärvi, P.; Shurpali, N. Use, calibration and verification of agroecological models for boreal environments: A review. Grassl. Res. 2022, 1, 14–30. [Google Scholar] [CrossRef]
- Rafique, R.; Peichl, M.; Hennessy, D.; Kiely, G. Evaluating management effects on nitrous oxide emissions from grasslands using the process-based DeNitrification-DeComposition (DNDC) model. Atmos. Environ. 2011, 45, 6029–6039. [Google Scholar] [CrossRef]
- Khalil, M.I.; Fornara, D.A.; Osborne, B. Simulation and validation of long-term changes in soil organic carbon under permanent grassland using the DNDC model. Geoderma 2020, 361, 114014. [Google Scholar] [CrossRef]
- Mammarella, I.; Peltola, O.; Nordbo, A.; Järvi, L.; Rannik, Ü. ‘EddyUH: An Advanced Software Package for Eddy Covariance Flux Calculation for a Wide Range of Instrumentation and Ecosystems. Gases/Situ Meas. /Data Process. Inf. Retr. 2016. preprint. [Google Scholar] [CrossRef]
- Li, C.; Frolking, S.; Harriss, R. Modeling carbon biogeochemistry in agricultural soils. Glob. Biogeochem. Cycles 1994, 8, 237–254. [Google Scholar] [CrossRef]
- Li, C.; Frolking, S.; Frolking, T.A. A model of nitrous oxide evolution from soil driven by rainfall events: 2. Model applications. J. Geophys. Res. Atmos. 1992, 97, 9777–9783. [Google Scholar] [CrossRef]
- Li, C.S. Modeling trace gas emissions from agricultural ecosystems. Nutr. Cycl. Agroecosyst. 2000, 58, 259–276. [Google Scholar] [CrossRef]
- Li, C.; Salas, W.; Zhang, R.; Krauter, C.; Rotz, A.; Mitloehner, F. ‘Manure-DNDC: A biogeochemical process model for quantifying greenhouse gas and ammonia emissions from livestock manure systems. Nutr. Cycl. Agroecosyst. 2012, 93, 163–200. [Google Scholar] [CrossRef]
- Deng, J.; Xiao, J.; Ouimette, A.; Zhang, Y.; Sanders-DeMott, R.; Frolking, S.; Li, C. Improving a Biogeochemical Model to Simulate Surface Energy, Greenhouse Gas Fluxes, and Radiative Forcing for Different Land Use Types in Northeastern United States. Glob. Biogeochem. Cycles 2020, 34, e2019GB006520. [Google Scholar] [CrossRef]
- Deng, J.; Li, C.; Frolking, S.; Zhang, Y.; Bäckstrand, K.; Crill, P. Assessing effects of permafrost thaw on C fluxes based on multiyear modeling across a permafrost thaw gradient at Stordalen, Sweden. Biogeosciences 2014, 11, 4753–4770. [Google Scholar] [CrossRef] [Green Version]
- Deng, L.; Zhu, G.; Tang, Z.; Shangguan, Z. Global patterns of the effects of land-use changes on soil carbon stocks. Glob. Ecol. Conserv. 2016, 5, 127–138. [Google Scholar] [CrossRef] [Green Version]
- Lind, S.E.; Shurpali, N.J.; Peltola, O.; Mammarella, I.; Hyvönen, N.; Maljanen, M.; Räty, M.; Virkajärvi, P.; Martikainen, P.J. Carbon dioxide exchange of a perennial bioenergy crop cultivation on a mineral soil. Biogeosciences 2016, 13, 1255–1268. [Google Scholar] [CrossRef] [Green Version]
- Zambrano-Bigiarini, M. hzambran/hydroGOF, v0.4-0. 2020. Available online: https://github.com/hzambran/hydroGOF/tree/v0.3-10 (accessed on 16 October 2022).
- Oertel, C.; Matschullat, J.; Zurba, K.; Zimmermann, F.; Erasmi, S. Greenhouse gas emissions from soils—A review. Geochemistry 2016, 76, 327–352. [Google Scholar] [CrossRef] [Green Version]
- Kim, N.; Zabaloy, M.C.; Guan, K.; Villamil, M.B. Do cover crops benefit soil microbiome? A meta-analysis of current research. Soil Biol. Biochem. 2020, 142, 107701. [Google Scholar] [CrossRef]
- Khan, A.R. Influence of Tillage on Soil Aeration. J. Agron. Crop Sci. 1996, 177, 253–259. [Google Scholar] [CrossRef]


| Unit | Value |
|---|---|
| Soil pH | 5.8 ± 0.19 |
| EC mS m−1 | 14 ± 2.4 |
| SOM% | 5.2 ± 0.9 |
| SOC% | 3.0 ± 0.52 |
| C/N ratio | 15 ± 0.4 |
| Total N% | 0.2 ± 0.03 |
| P mg L−1 | 5.4 ± 1.28 |
| K mg L−1 | 104 ± 12.9 |
| Perennial Grass | Grain | Leaf | Stem | Root |
| Max. biomass production (kg C/ha/yr) | 400 | |||
| Biomass fraction | 0.04 | 0.28 | 0.28 | 0.4 |
| Biomass C/N ratio | 35 | |||
| Annual N demand (kg N/ha/yr) | 143 | |||
| Thermal degree days to maturity | 1500 | |||
| Water demand (g water/g dry matter (DM)) | 150 | |||
| N fixation index (crop N/N from soil) | 1.5 | |||
| Optimum temperature (°C) | 18 | |||
| Barley | ||||
| Max. biomass production (kg C/ha/yr) | 2496 | |||
| Biomass fraction | 0.3 | 0.23 | 0.23 | 0.23 |
| Biomass C/N ratio | 45 | 75 | 75 | 85 |
| Annual N demand (kg N/ha/yr) | 129 | |||
| Thermal degree days to maturity | 1500 | |||
| Water demand (g water/g DM) | 150 | |||
| N fixation index (crop N/N from soil) | 1 | |||
| Optimum temperature for crop growth (°C) | 18 |
| Year | 1 (2017) | 2 (2018) | 3 (2019) | 4 (2020) |
|---|---|---|---|---|
| Model setup | Calibration dataset | Evaluation dataset | NA | |
| Crop: perennial grass | 18 May 2017–30 October 2018 | 4 June 2019–31 May 2020 | ||
| Cover crop: barley | NA | NA | 4 June 2019–31 May 2020 | |
| Cuts | 29 June 16 August | 26 June 7 August | 6 August | - |
| Overseeding/reseeding | 18 May | NA | 16 August | - |
| Fertilisation | 22 May & 3 July | 22 May & 2 July | 2 July | * 22 May & 2 July |
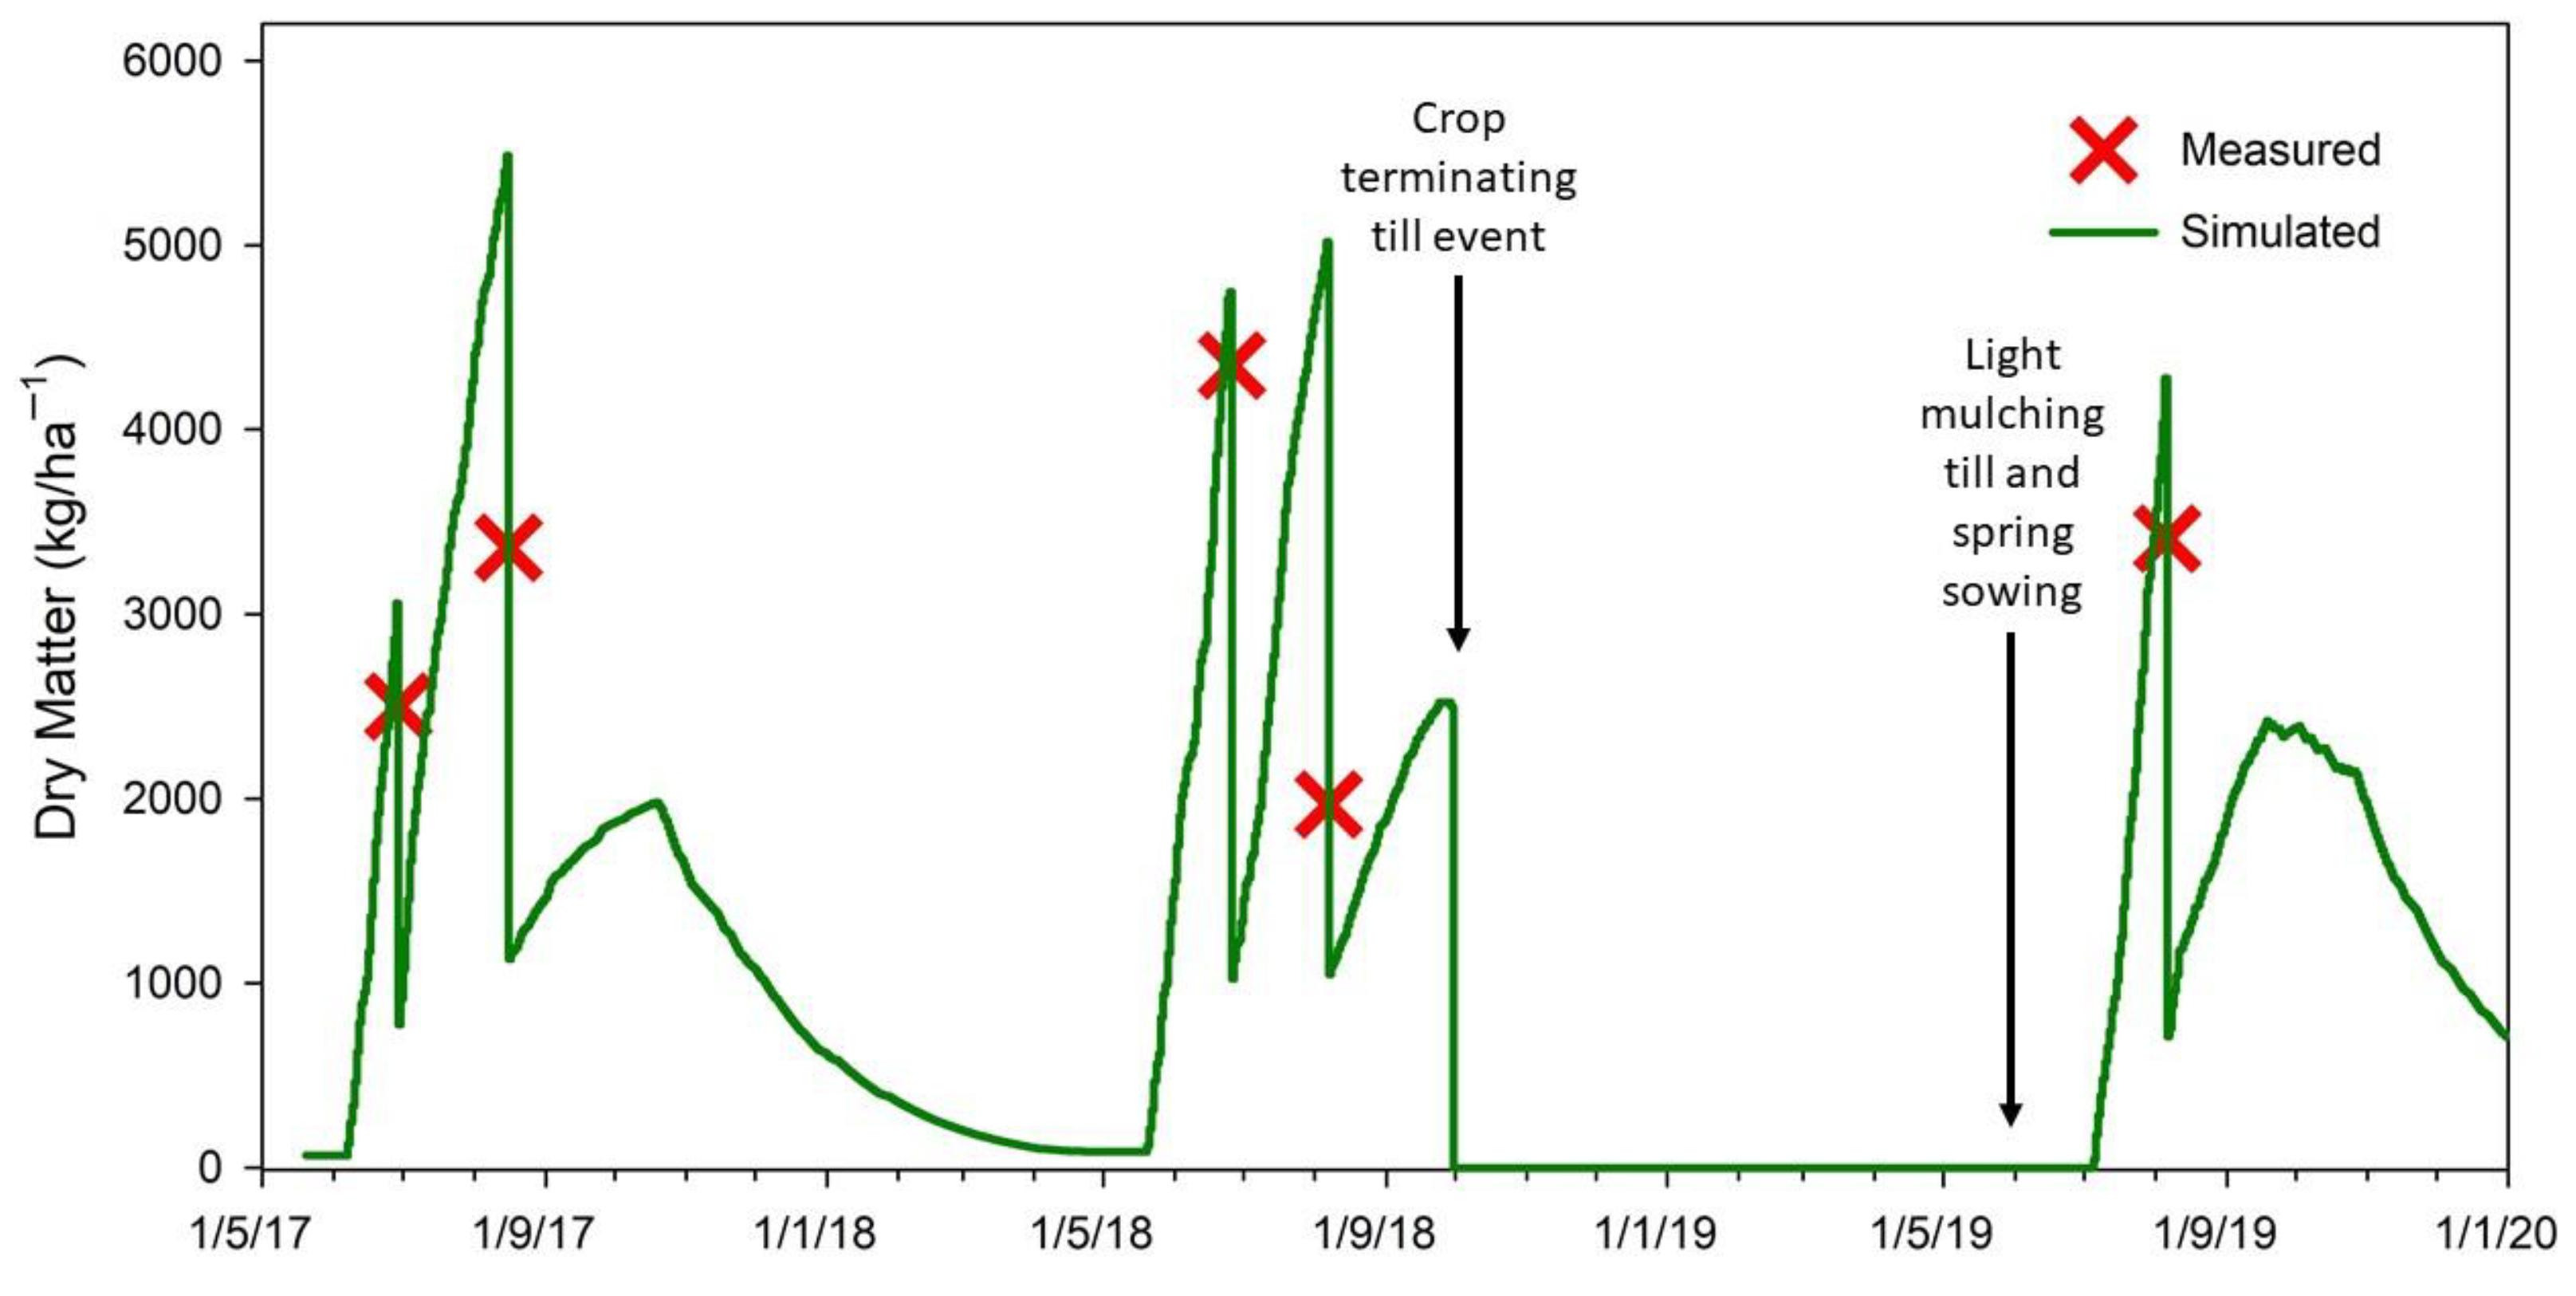
| Tillage | NA | 30 September (crop killing till), 30 October | 3 June | - |
| Evaluation Method | Poor | Fair | Good | Excellent |
|---|---|---|---|---|
| Spearman’s rank correlation (ρ) | 0.30 | 0.50 | 0.70 | 1.00 |
| MAE | 4.0+ | 3.0–3.9 | 2.0–2.9 | 1.0–1.9 |
| RMSE | ≥40 | 20–39 | 10–19 | 0–10 |
| pBias% | >20% | 15–20% | 11–15% | <10% |
| ρ | MAE | RMSE | pBias% | Mean Score | |
|---|---|---|---|---|---|
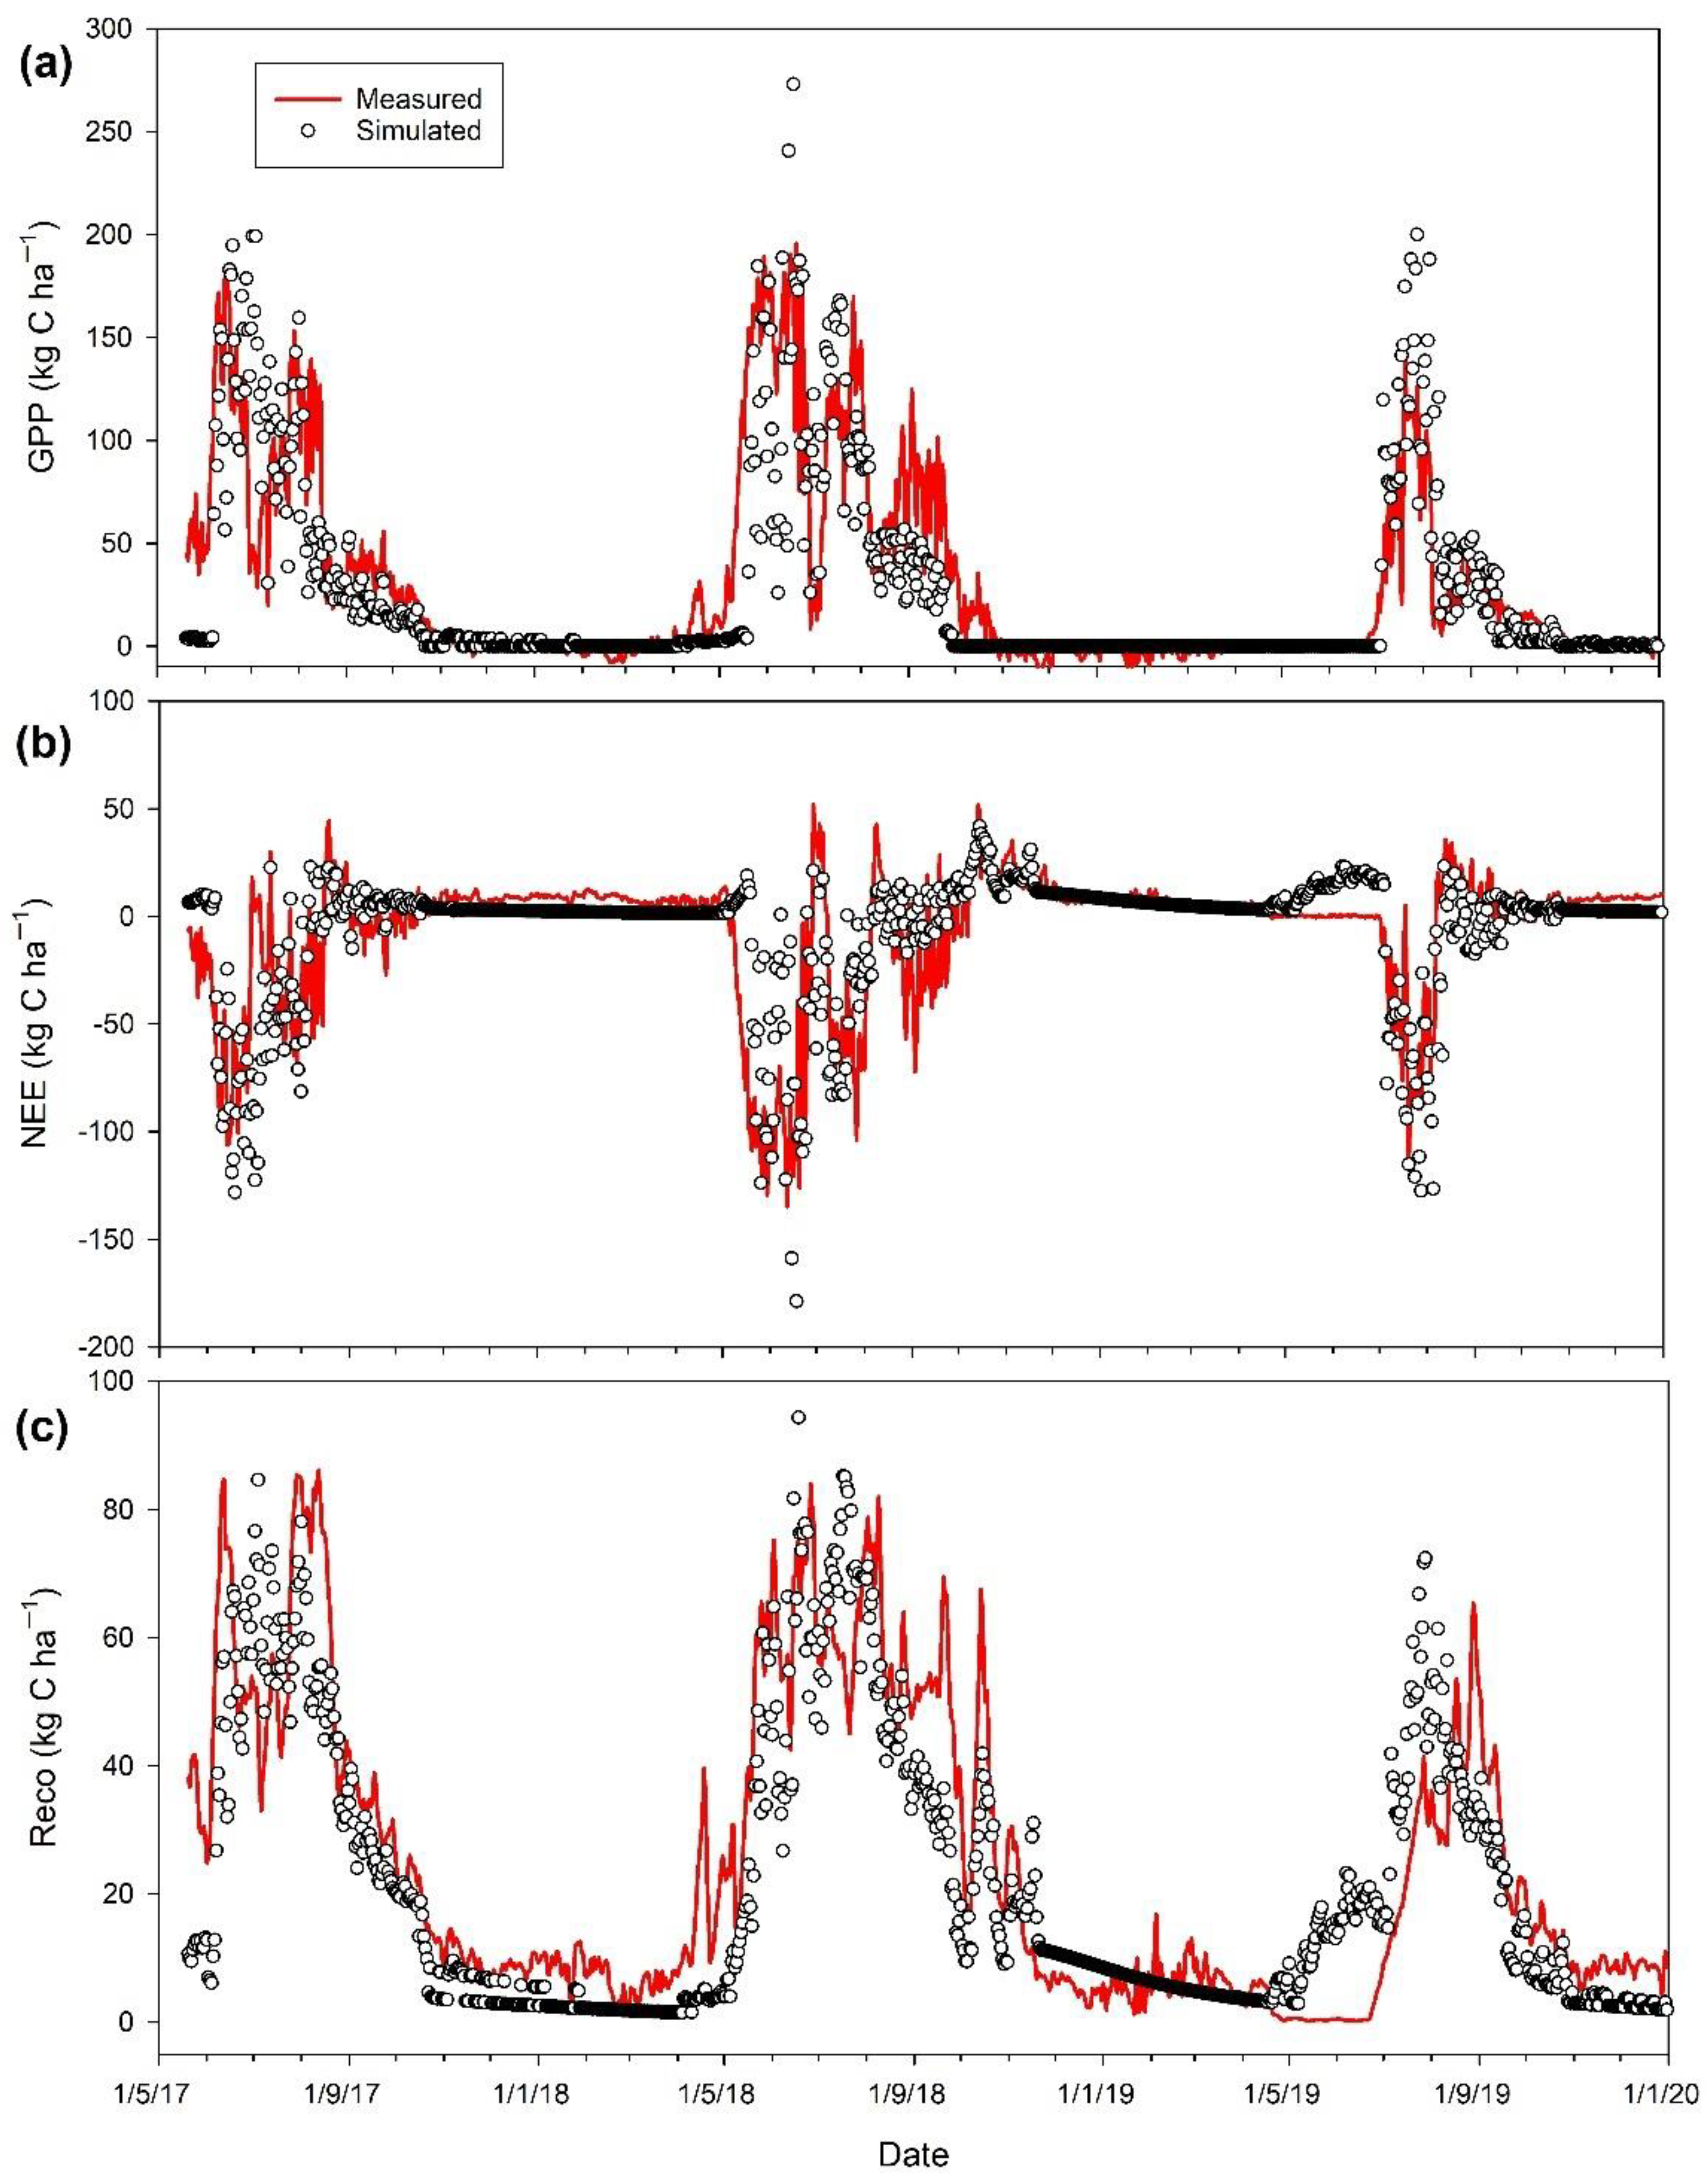
| GPP (kg C ha−1) | 0.80 (p < 0.001) | 21.3 | 35.1 | –20.7% | Fair |
| NEE (kg C ha−1) | 0.72 (p < 0.001) | 16.6 | 26.7 | –14.2% | Fair |
| Reco (kg C ha−1) | 0.85 (p < 0.001) | 10.9 | 14.2 | –22.8% | Fair |
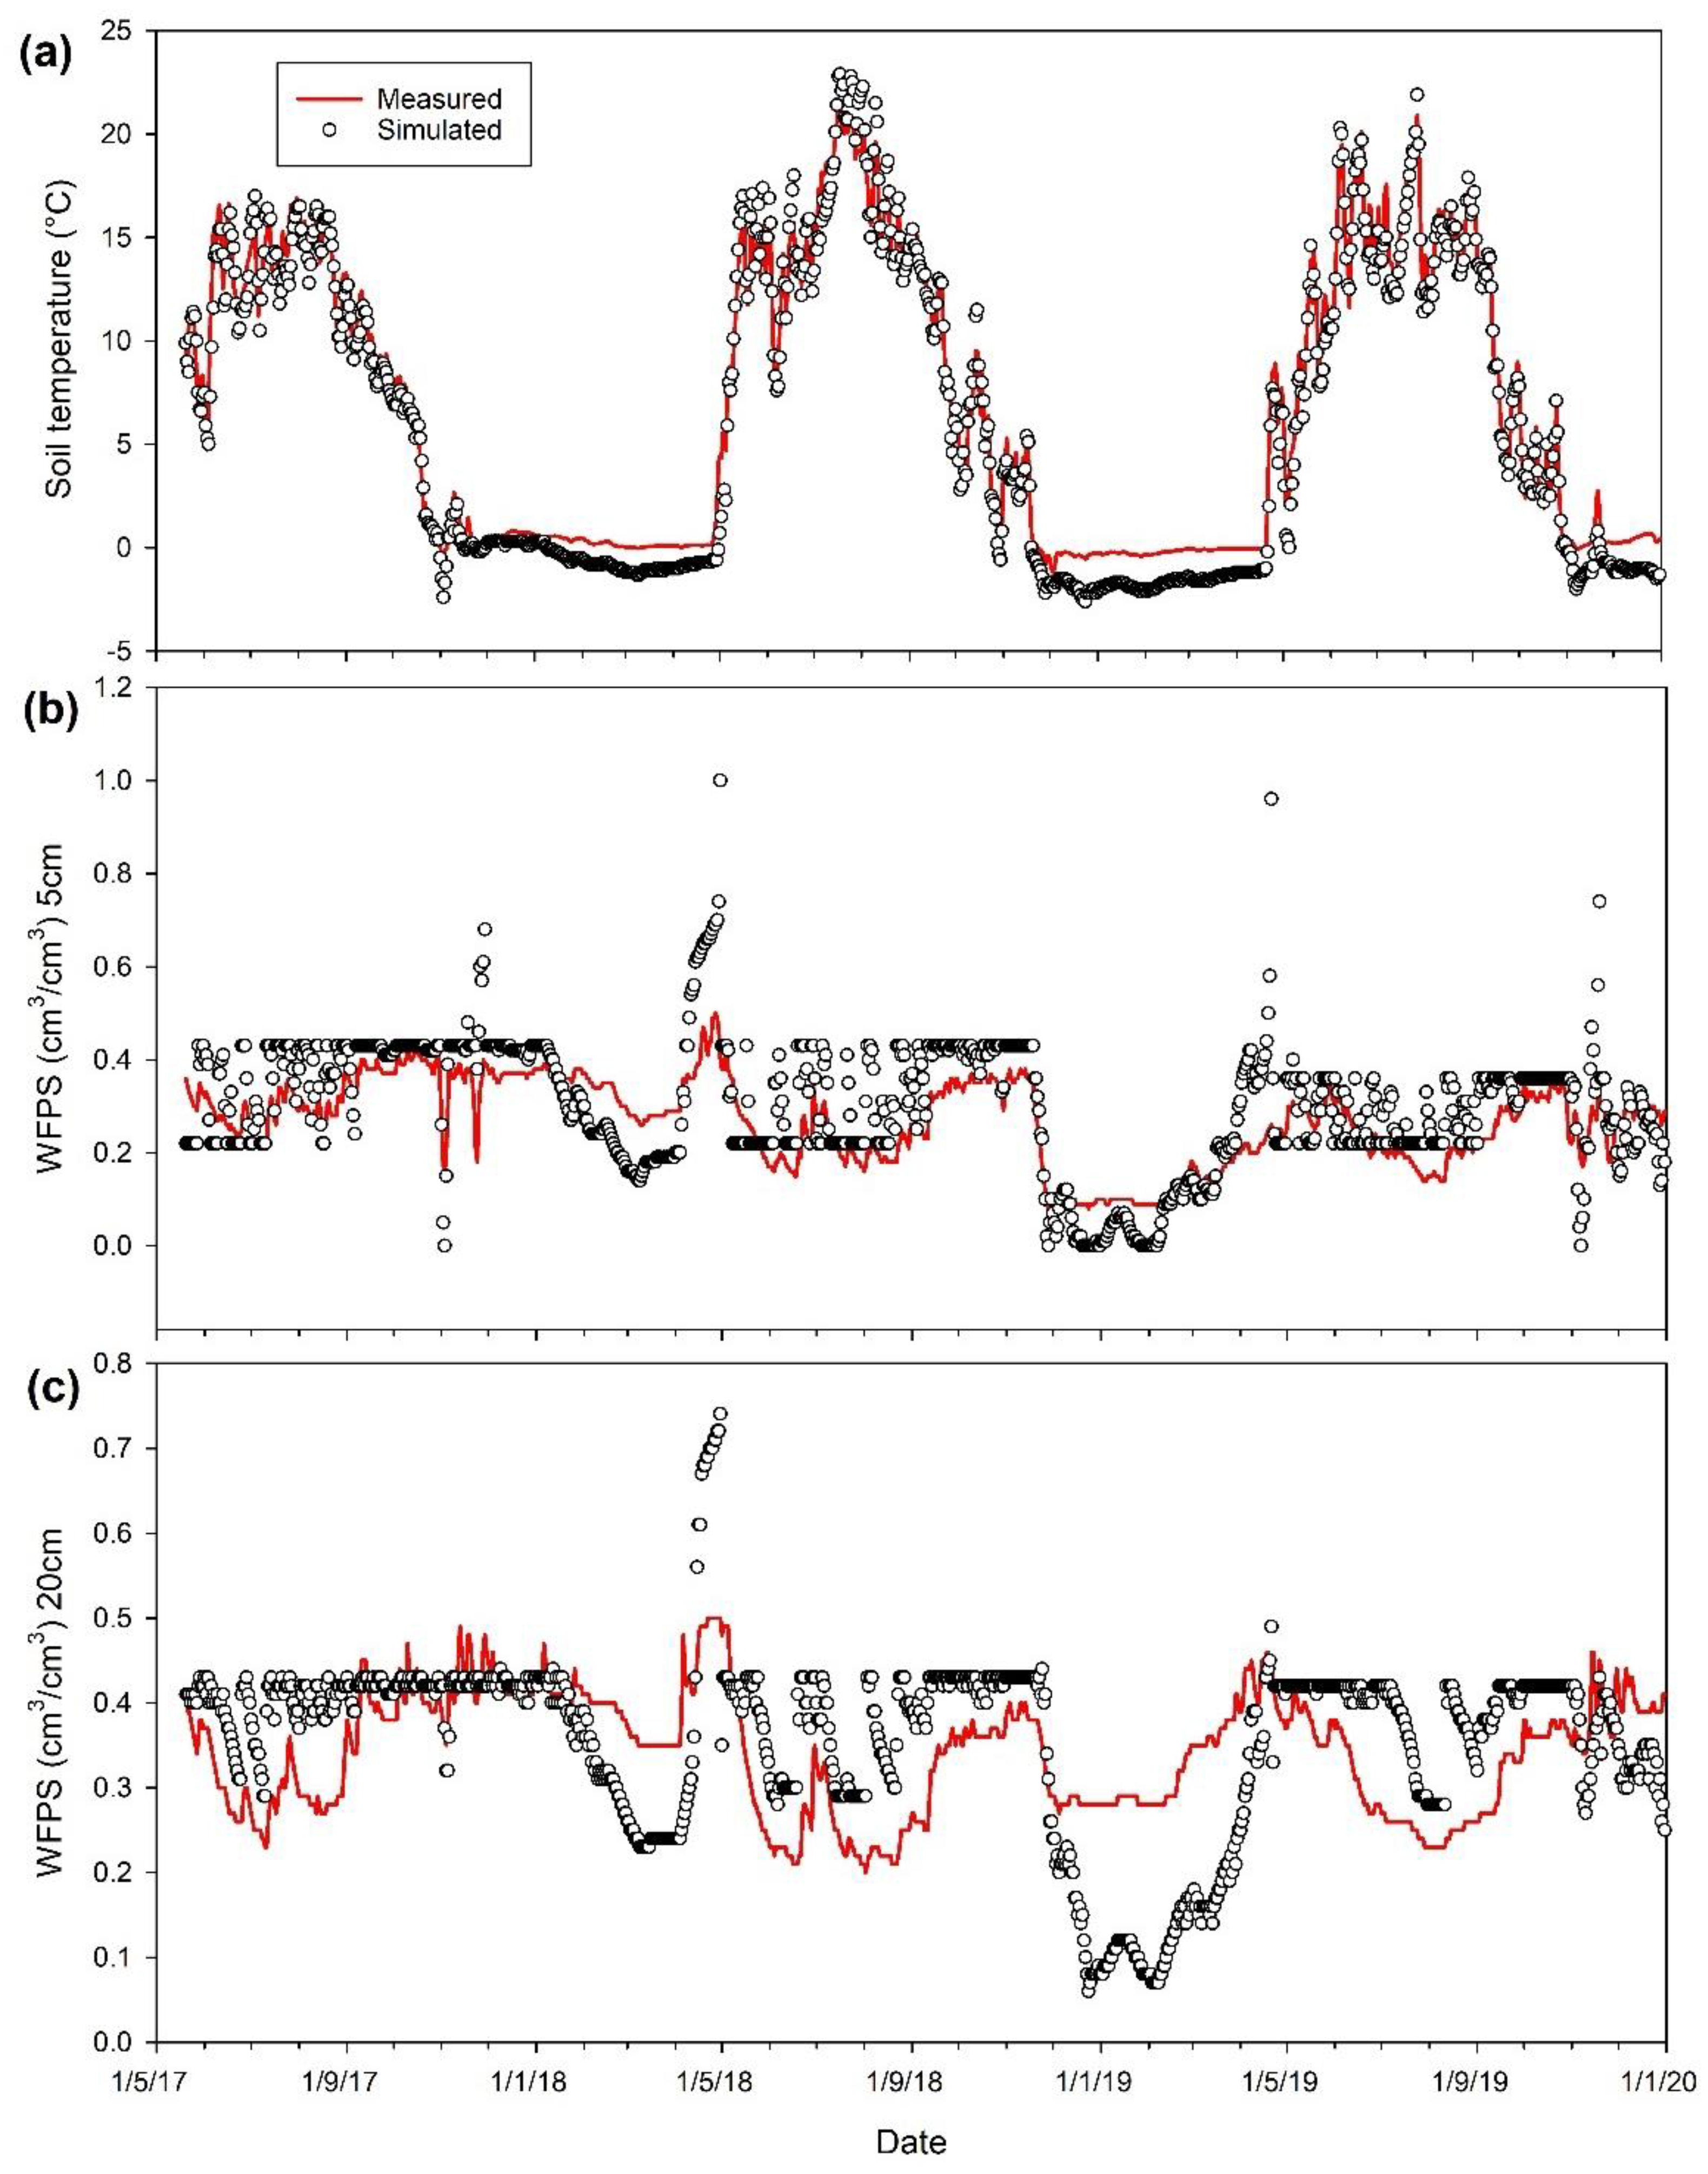
| Soil Temp (°C) | 1.00 (p < 0.001) | 0.1 | 1.2 | 18.2% | Excellent |
| WFPS (cm3/cm3) 5 cm | 0.73 (p < 0.001) | 0.1 | 0.1 | –11.2% | Excellent |
| WFPS (cm3/cm3) 20 cm | 0.25 (p < 0.001) | 0.1 | 0.1 | –5.0% | Good |
| Calibration/Evaluation Years | Measured | Simulated | Difference |
|---|---|---|---|
| GPP (T C ha–1 yr–1) | |||
| 2018 | 14.79 | 10.09 | 4.70 |
| 2019 | 4.15 | 5.19 | 1.04 |
| Mean | 9.47 | 7.64 | –1.83 |
| NEE (T C ha–1 yr–1) | |||
| 2018 | –3.64 | –1.97 | 1.68 |
| 2019 | 0.22 | –0.35 | –0.57 |
| Mean | –1.71 | –1.17 | 0.55 |
| Reco (T C ha–1 yr–1) | |||
| 2018 | 11.15 | 8.12 | –3.03 |
| 2019 | 4.58 | 4.84 | 0.26 |
| Mean | 7.87 | 6.48 | –1.38 |
Publisher’s Note: MDPI stays neutral with regard to jurisdictional claims in published maps and institutional affiliations. |
© 2022 by the authors. Licensee MDPI, Basel, Switzerland. This article is an open access article distributed under the terms and conditions of the Creative Commons Attribution (CC BY) license (https://creativecommons.org/licenses/by/4.0/).
Share and Cite
Forster, D.; Deng, J.; Harrison, M.T.; Shurpali, N. Simulating Soil-Plant-Climate Interactions and Greenhouse Gas Exchange in Boreal Grasslands Using the DNDC Model. Land 2022, 11, 1947. https://doi.org/10.3390/land11111947
Forster D, Deng J, Harrison MT, Shurpali N. Simulating Soil-Plant-Climate Interactions and Greenhouse Gas Exchange in Boreal Grasslands Using the DNDC Model. Land. 2022; 11(11):1947. https://doi.org/10.3390/land11111947
Chicago/Turabian StyleForster, Daniel, Jia Deng, Matthew Tom Harrison, and Narasinha Shurpali. 2022. "Simulating Soil-Plant-Climate Interactions and Greenhouse Gas Exchange in Boreal Grasslands Using the DNDC Model" Land 11, no. 11: 1947. https://doi.org/10.3390/land11111947