Article

Research on the Satisfaction of Beijing Waterfront Green Space Landscape Based on Social Media Data

School of Landscape Architecture, Beijing Forestry University, Beijing 100083, China
*
Author to whom correspondence should be addressed.
Land 2022, 11(10), 1849; https://doi.org/10.3390/land11101849
Submission received: 13 September 2022 / Revised: 16 October 2022 / Accepted: 17 October 2022 / Published: 20 October 2022
(This article belongs to the Special Issue Landscape Governance in the Age of Social Media)

Abstract

:
Urban blue–green space is essential to the normal functioning of the urban landscape ecosystem, and it is also a significant metric for assessing the quality of urban human settlements. In China’s territorial space planning, the overall planning strategy’s implementation depends on constructing the blue–green space network in the urbanized construction area. This paper used 85 typical riverside parks in Beijing’s blue–green space as the research object, collecting and analyzing multiple social media user data. It explored the main factors that influenced people’s satisfaction with the landscape design and sensory perception of urban waterfront green space from the perspectives of parks beside different river systems, parks of different types, and parks in different districts. The distinction between urban waterfront green space evaluation was further discussed through variance analysis. The research revealed the following findings: (1) by comparing the total number of park reviews in different seasons, it could be observed that tourists evidently preferred the spring landscape, and the winter landscape construction of waterfront green space needs to be improved. (2) By comparing the review stars of different parks, it could be observed that tourists appreciated parks with multiple functions, excellent recreation facilities, complete management services and parks close to the city center. Functions and services became important influencing factors for park evaluation. (3) There was room for improvement in water ecology in the river landscapes of parks adjacent to various river systems, and people paid more attention to the level of service facilities. (4) According to different categories of parks, people’s demand for service facilities, activity organization, cultural displays and other aspects was different. (5) Among parks in different districts, people preferred the distinctive animal and plant landscapes and recreational activities of parks in districts on the outskirts of the city. According to the conclusions, suggestions were made for optimizing and improving Beijing’s waterfront green space, providing managers with technical support and a basis for decision-making.

1. Introduction

China’s “Notice of the Ministry of Natural Resources on Comprehensively Carrying out Territorial Space Planning Work” issued in 2019 stipulates that “the control scope and balanced distribution requirements of urban structural green space, water bodies and other open spaces within the urban development boundary” [1]. It indicates that, under the new context of implementing the strategy of ecological civilization construction, territorial space planning will constantly reinforce the construction strategy of ecological space development and protection pattern. As a result, the overall planning orientation will shift from urban expansion to ecological constraint [2], and the blue–green space system as the urban ecological space network will receive significant attention.
Traditional ecological space consists primarily of green space made up of parks and green corridors and blue space made up of rivers and wetlands [3]. Changes in the global climate and the acceleration of urbanization have spawned strategies and methods to ensure the safety of urban rainwater, such as sponge cities. The combination of blue space, such as rivers and lakes, and green space has also received more attention [4,5]. Therefore, as an essential component of the urban landscape ecosystem, blue–green space can maintain the regular operation of the urban landscape ecosystem. Moreover, it improves citizens’ high quality of life [6,7,8], which positively affects residents’ physical and mental health [9]. Urban livability, social stability, and economic prosperity depend on in-depth research on improving urban blue–green ecological space [6,7]. Currently, ecological functions, such as microclimate regulation [10], rainwater storage [11], and health promotion [12] of waterfront green space in blue–green space, have been extensively studied by scholars domestically and internationally. However, few scholars have placed them in the context of the era of sustainable urban construction and development.
Beijing contains more than 200 rivers that are part of the following 5 major river systems of the Haihe River Basin: the Daqing River System in the southwest, the Yongding River System in the west and south-central region, the Wenyu River-North Canal River System in the central and southeast region, the Chaobai River System in the northeast and eastern region, and the Ju River-Jiyun River System in the eastern region [13]. The urban water system and adjacent green space are intertwined, forming a diverse public open space network that ultimately constitutes Beijing’s blue–green space layout. As a vital component of urban blue–green space, riverside parks are important nodes that connect Beijing’s natural ecological and cultural recreation corridors and essential objects for people’s evaluations of urban blue–green space [14]. To improve the quality of urban blue–green space, it is essential to evaluate the function evaluation and optimization direction of urban riverside parks.
Most current studies that evaluate the green space and park landscape along the waterfront are based on traditional research. Numerous issues, such as high cost, limited content categories, small data sample size, and insufficient collection time, limited the universality and precision of the research results [15,16,17,18]. As the popularity of network information technology has increased, so have the opportunities for citizens to participate in the evaluation of urban parks. Many valuable and diverse comments are posted by users on various social media platforms on the Internet [19], which serve as comprehensive data sources for assessing users’ emotions and opinions on events [20]. Numerous scholars [21,22,23] have identified this data information as a tool for public participation in practice due to its diverse content categories, large data sample size, and intense immediacy. Currently, social media data are separated into two categories for various natural landscape studies. On the one hand, it uses photos with geographic location information to predict the number of visits to infer people’s travel preferences, in combination with the actual situation of the site. It guides space planning based on public information feedback [24,25,26]. On the other hand, it collects text data and obtains the image description of the destination [27], the usage profile of the place [28,29], and other elements after conducting a thorough analysis. By using network social media as a platform to conduct various research and understand the city with bottom-up ideas, people can participate in the planning and optimization of urban space. This aspect is more conducive to building a livable environment that meets people’s requirements [30,31,32], thereby increasing people’s sense of happiness and fostering a harmonious and stable society.
The realization of urban space’s service value heavily depends on people’s sensory experiences. Consequently, based on the ecological principle of landscape sensibility, it is possible to fully comprehend the needs of residents by investigating the impact of the status quo of blue–green space on individual residents. The ecological principle of landscape sense aims for sustainable development and studies land use planning, construction, and management from the perspectives of natural factors, physical perception, psychological perception, and the social economy [33,34]. Through the evaluation of the waterfront green space in the urban blue–green space, it is crucial to analyze the optimization strategy of park functions from the two perspectives of the park’s landscape design factors and visitors’ sensory perception factors.
Using social media data to study the characteristics of people’s recreational experiences can quickly and comprehensively understand people’s needs and satisfaction levels for various factors of urban riverside parks [35]. It helps city managers create famous waterfront landscapes to maintain and improve urban ecosystem services [36] and closely connect people and urban ecosystem services. However, from the users’ perspective, comparative research on the service function evaluation of waterfront green space in Chinese urban blue–green space through quantitative analysis of massive text data is lacking.
Given this research gap, we chose Beijing, with its numerous river systems, as a case study for the investigation. Beijing, the capital of China, is one of the world’s megacities. It was founded and flourished on the water. The urban development essentially followed the pattern of “water system–Garden–Imperial City–capital city”. The central area of ancient Beijing was a collection of lakes, and the city grew gradually on the ancient Yongding River Ferry [37]. Consequently, the problems faced by Beijing’s blue–green space are not only universal but also typical and, in many ways, unique. In addition, the current urban construction in Beijing has changed from incremental development mode to stock renewal mode, and urban renewal will become the hot spot and focus in the future for a long period of time [38]. In recent years, significant exploration and practice of urban renewal has been carried out in Beijing, but it mostly focuses on old residential areas, old buildings, old factories and other types, and less attention is paid to the riverside green space, riverside park and other kinds of blue–green space near old residential areas. As an important part of the sustainable development of urban planning, the renewal and construction of blue–green space is also very necessary.
This paper aimed to explore the core landscape value of waterfront green space in terms of tourists’ recreation and perception, and excavate the key points to be improved in the planning and construction of existing parks, in order to play a certain reference role in the function optimization of Beijing riverside parks, so that the waterfront landscape in Beijing’s blue–green space can meet the needs of ecological humanities and the requirements of the new era of China. Based on different classification criteria and from the perspectives of recreational elements and perceptional elements in the blue–green space, this paper analyzed the factors that affect the evaluation satisfaction of various riverfront parks by using the text data analysis method of social media, and compared the evaluation results of 85 riverfront parks in the blue–green space of Beijing from multiple perspectives. The following four characteristics were identified:
(1)
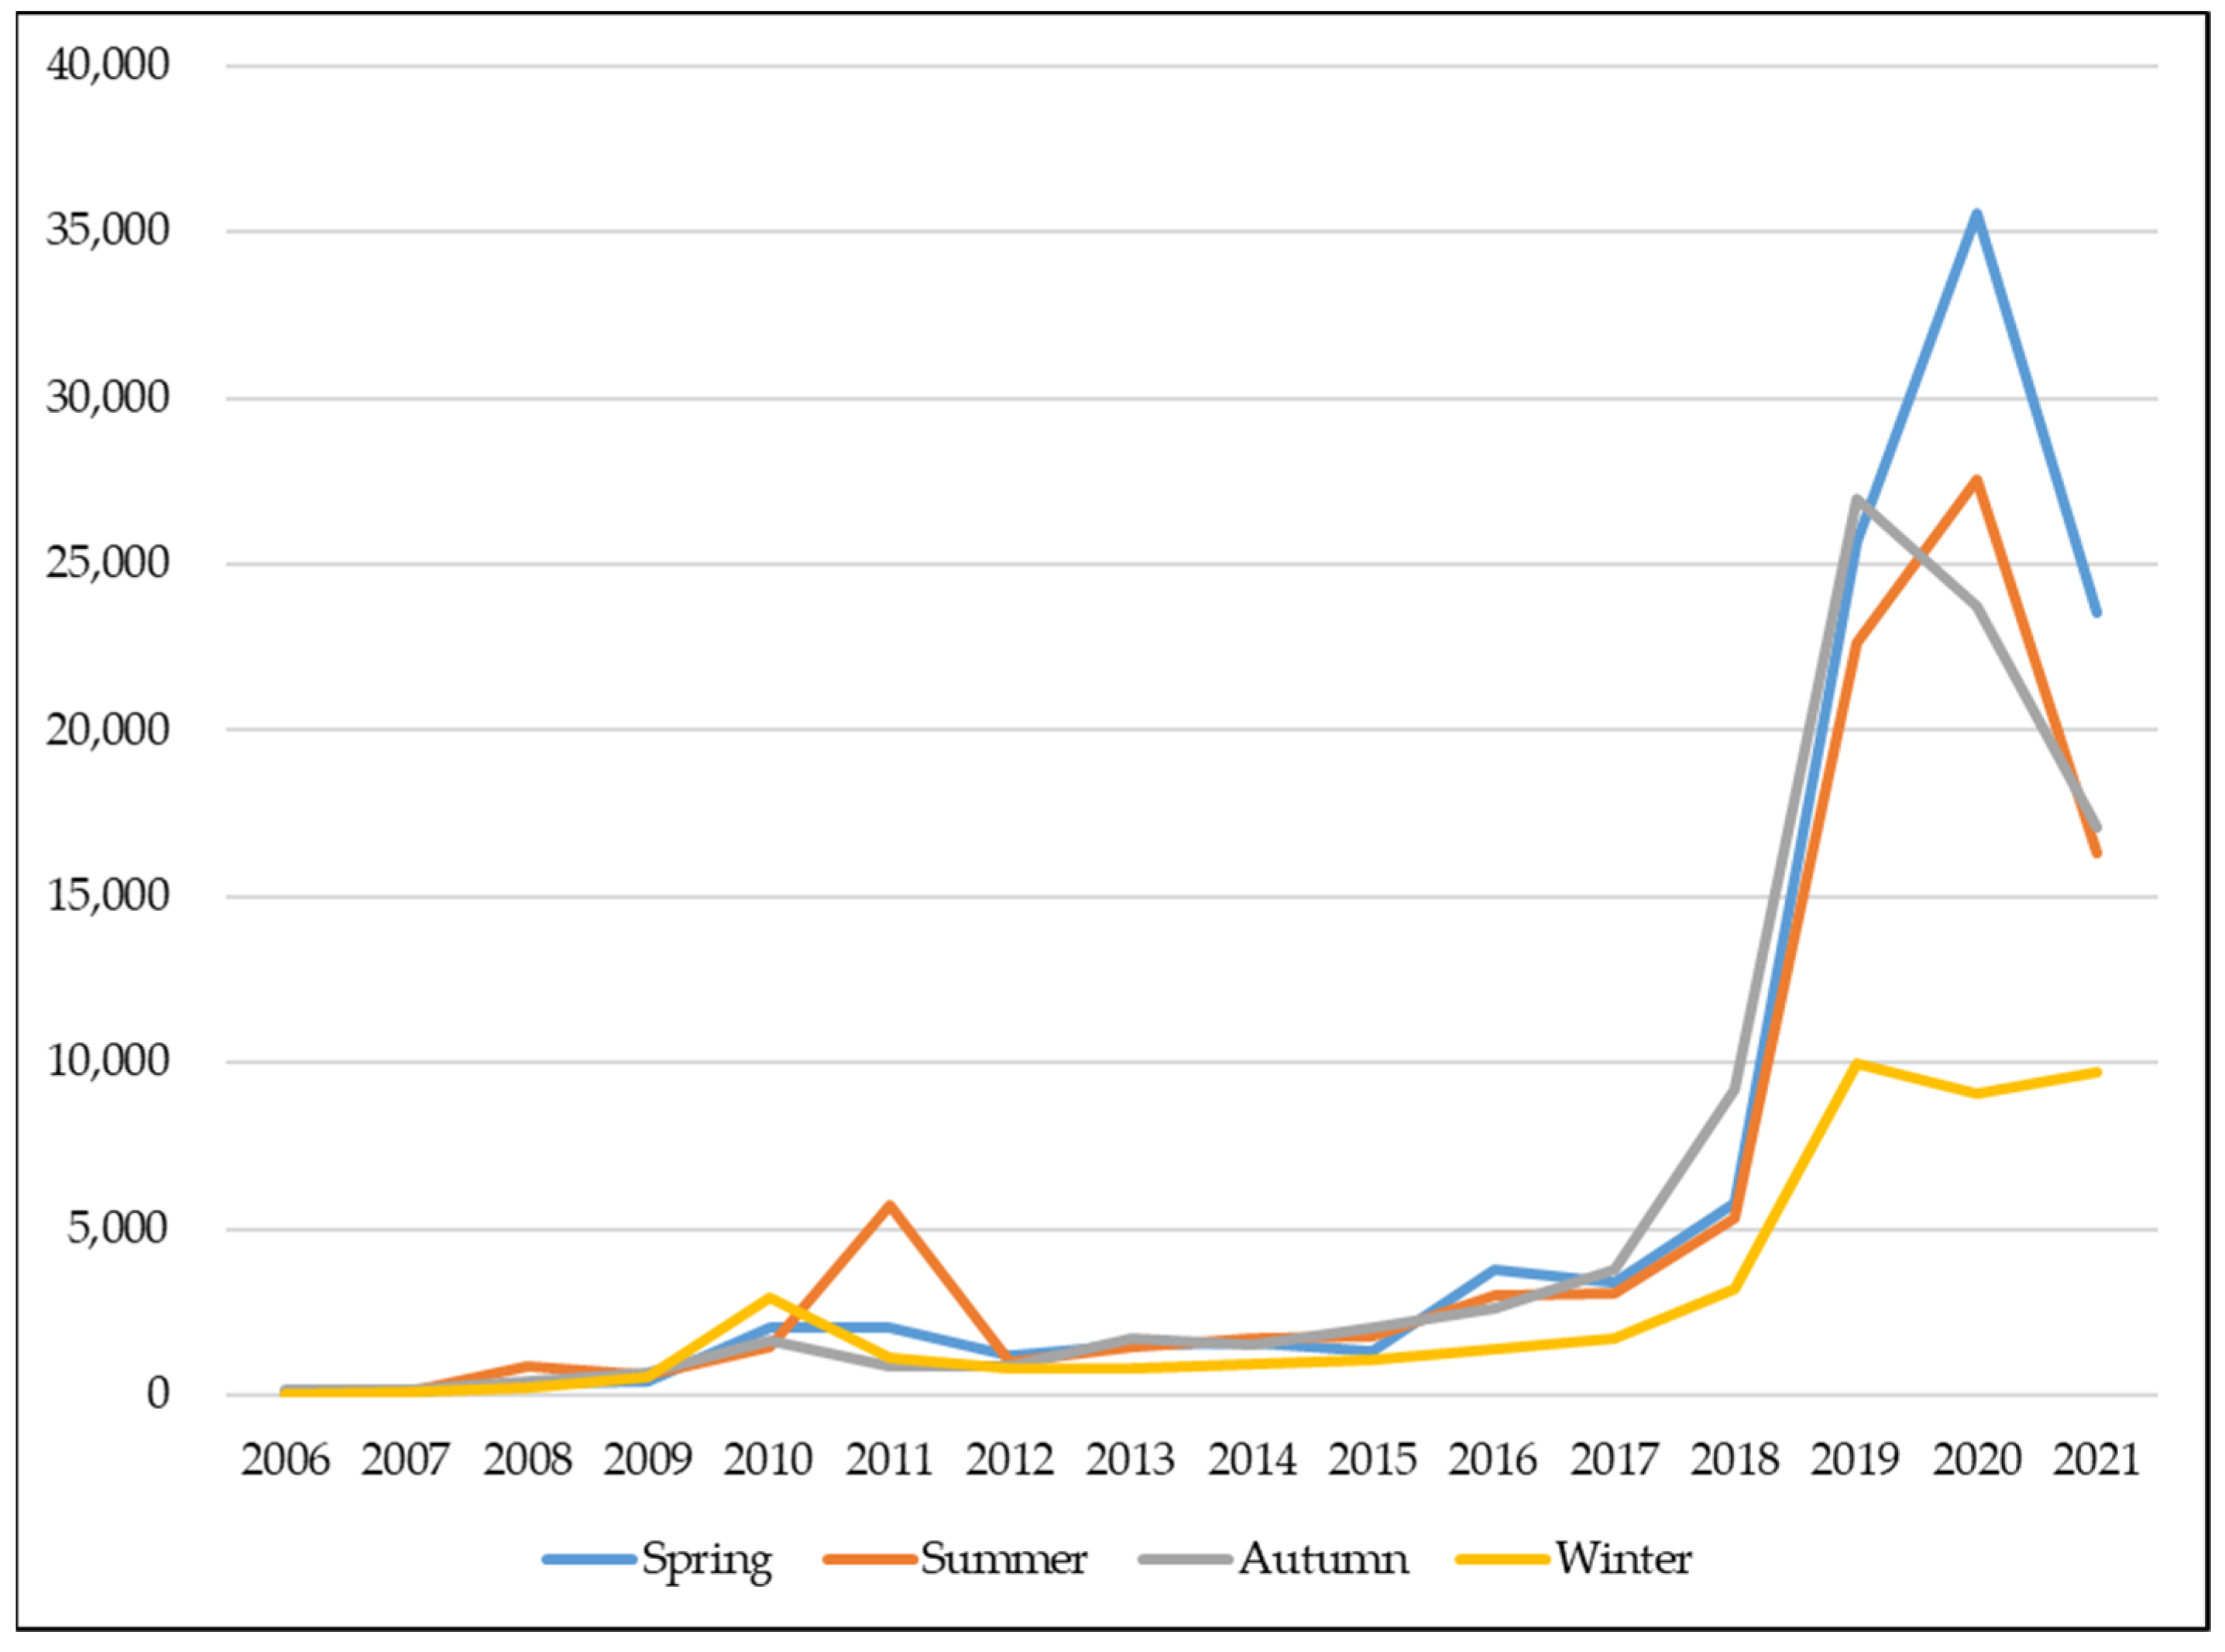
Compare the number of comments at different times based on the collected social media text data;
(2)
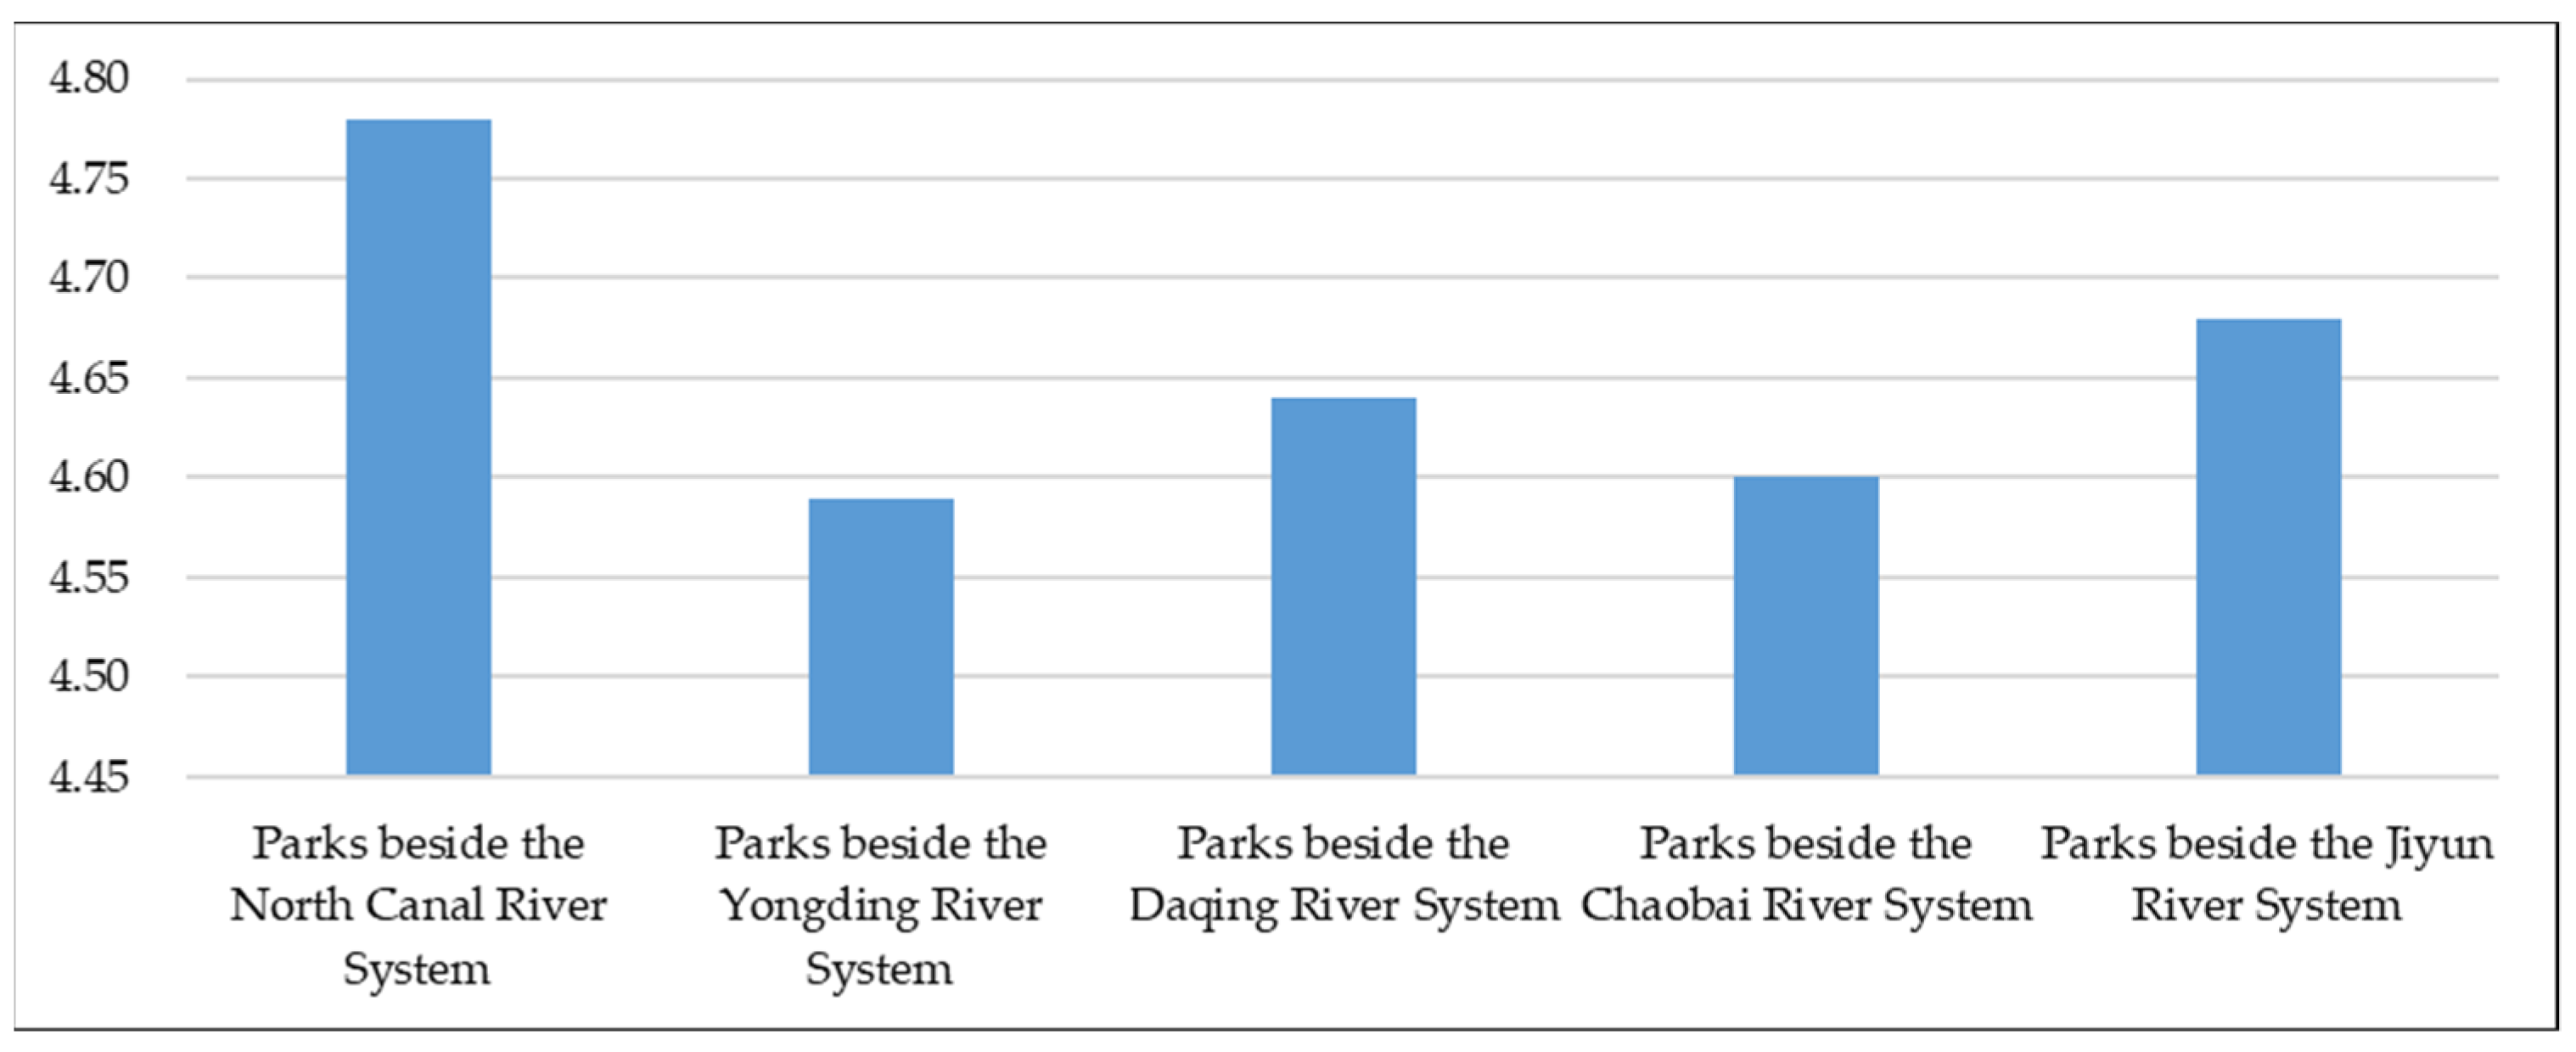
Explore the overall evaluation of parks in different water systems, categories and locations based on the weighted average of rating stars;
(3)
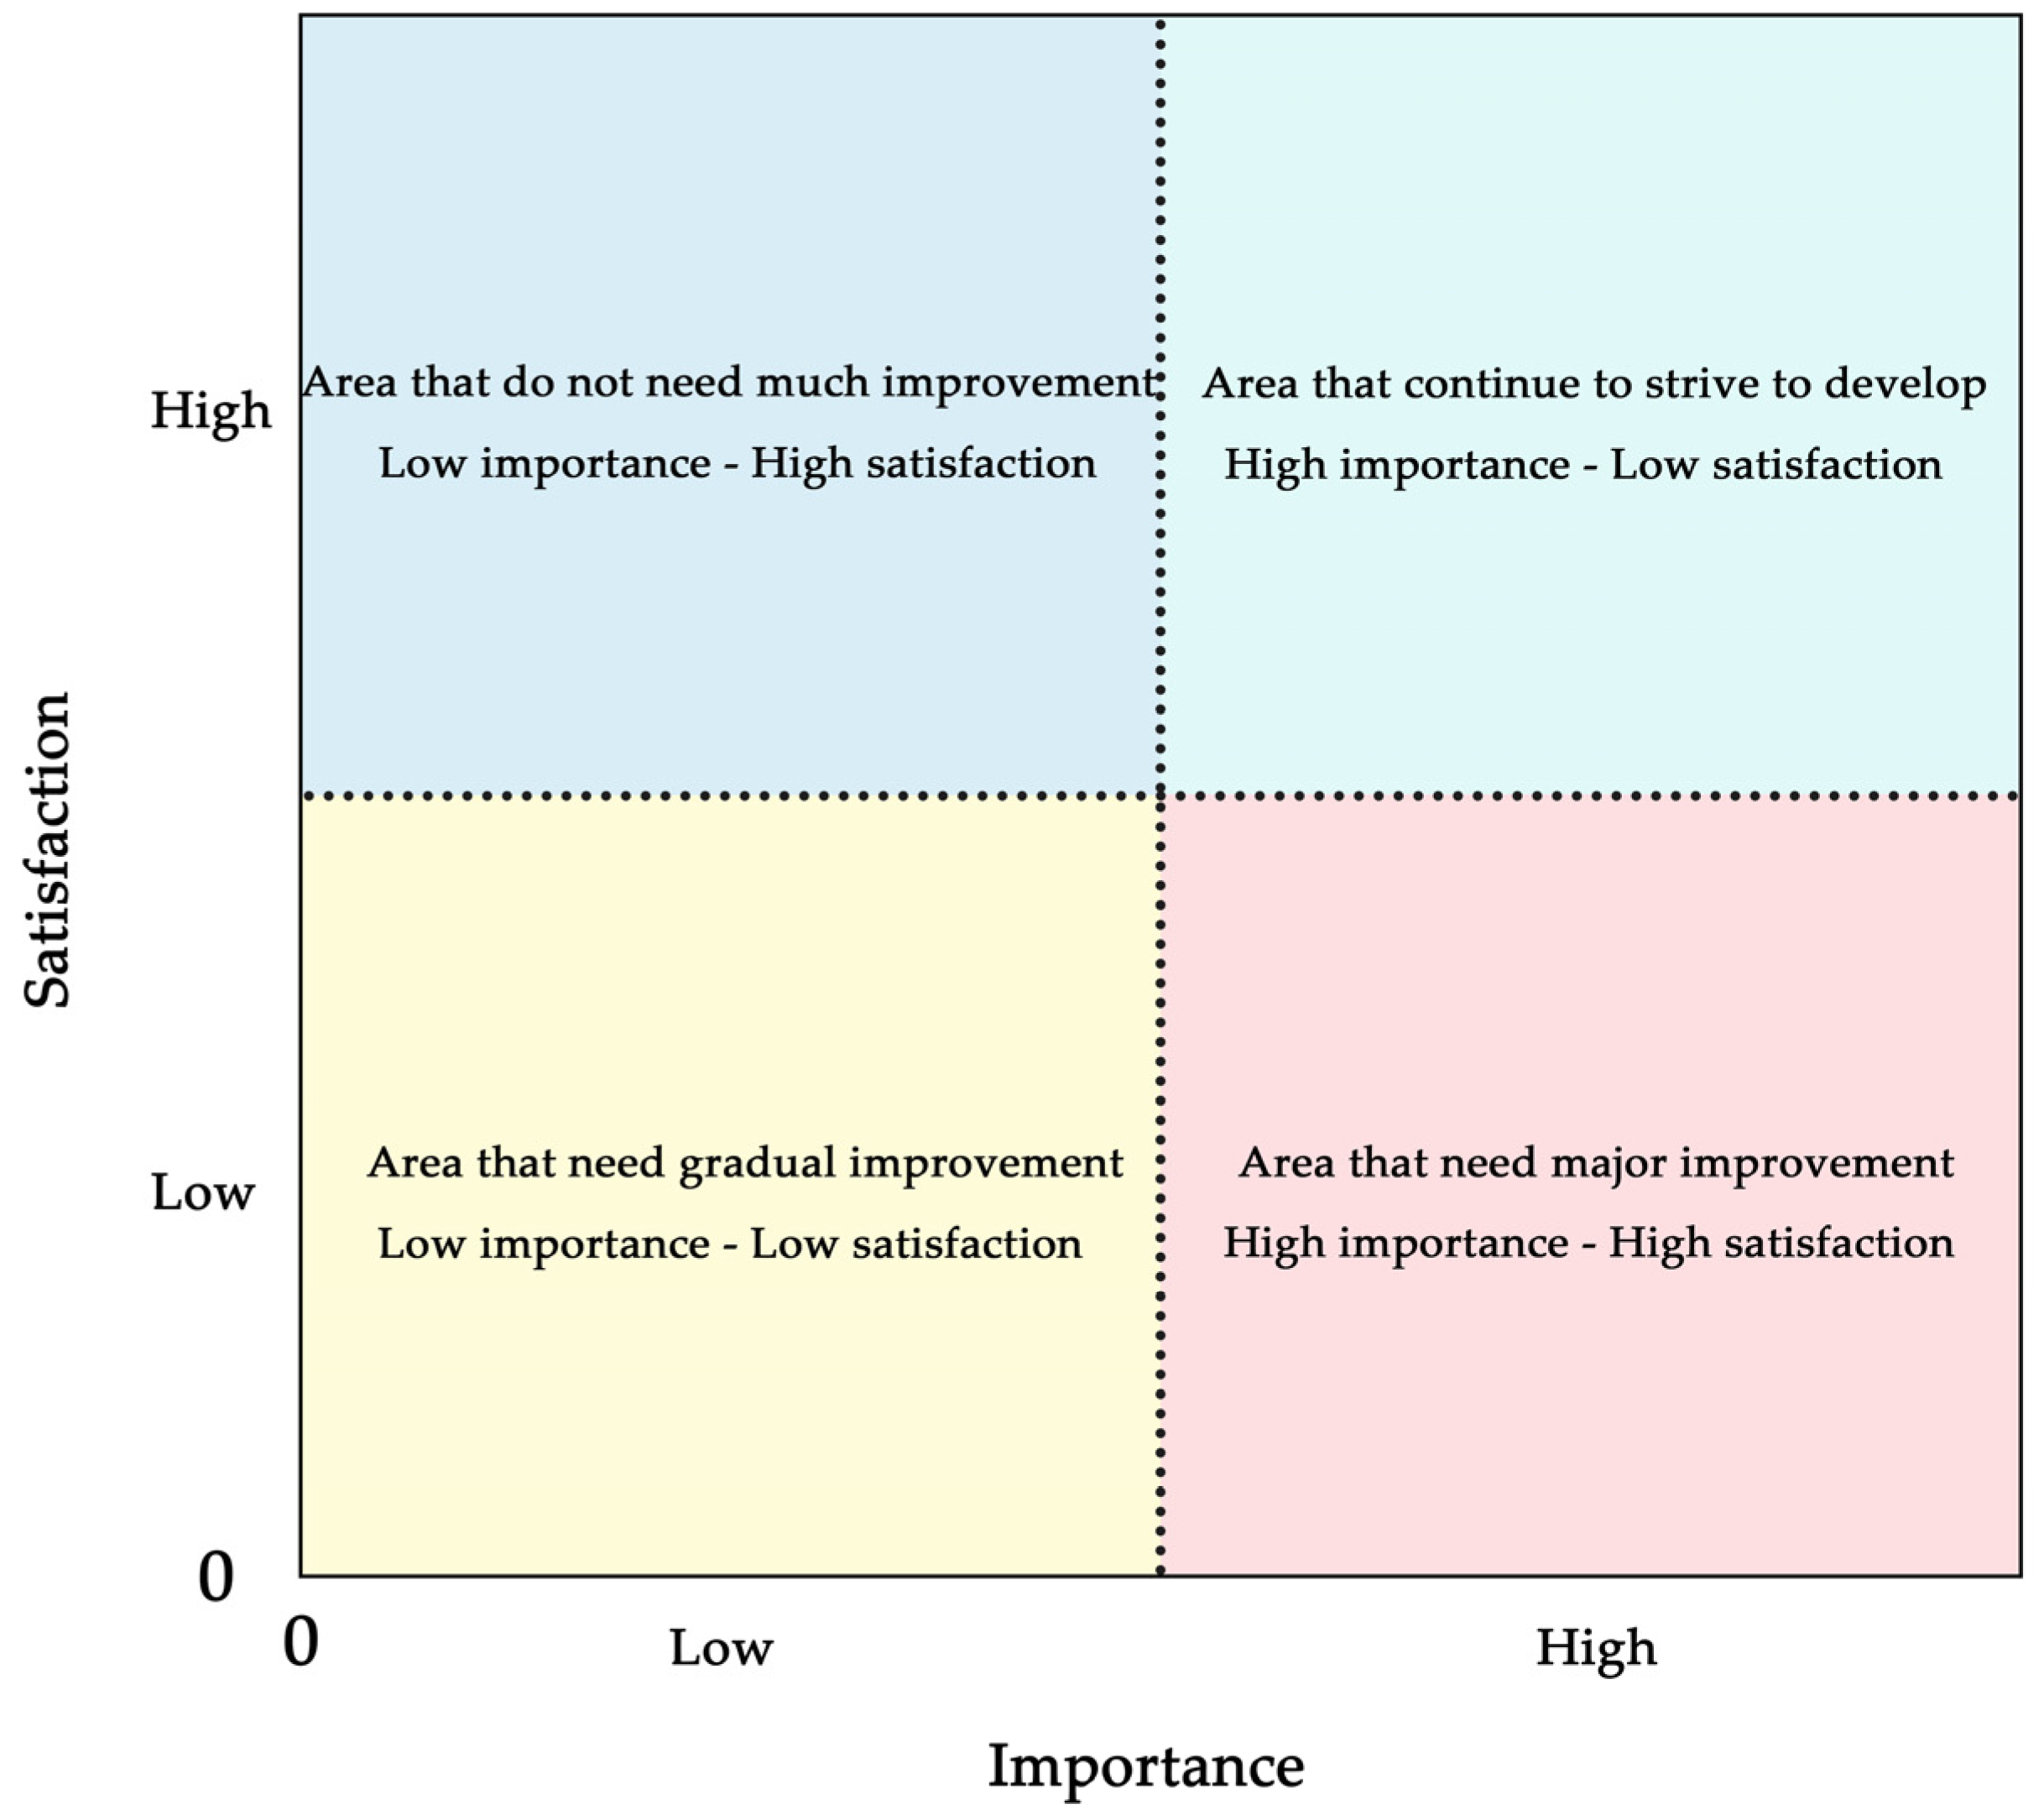
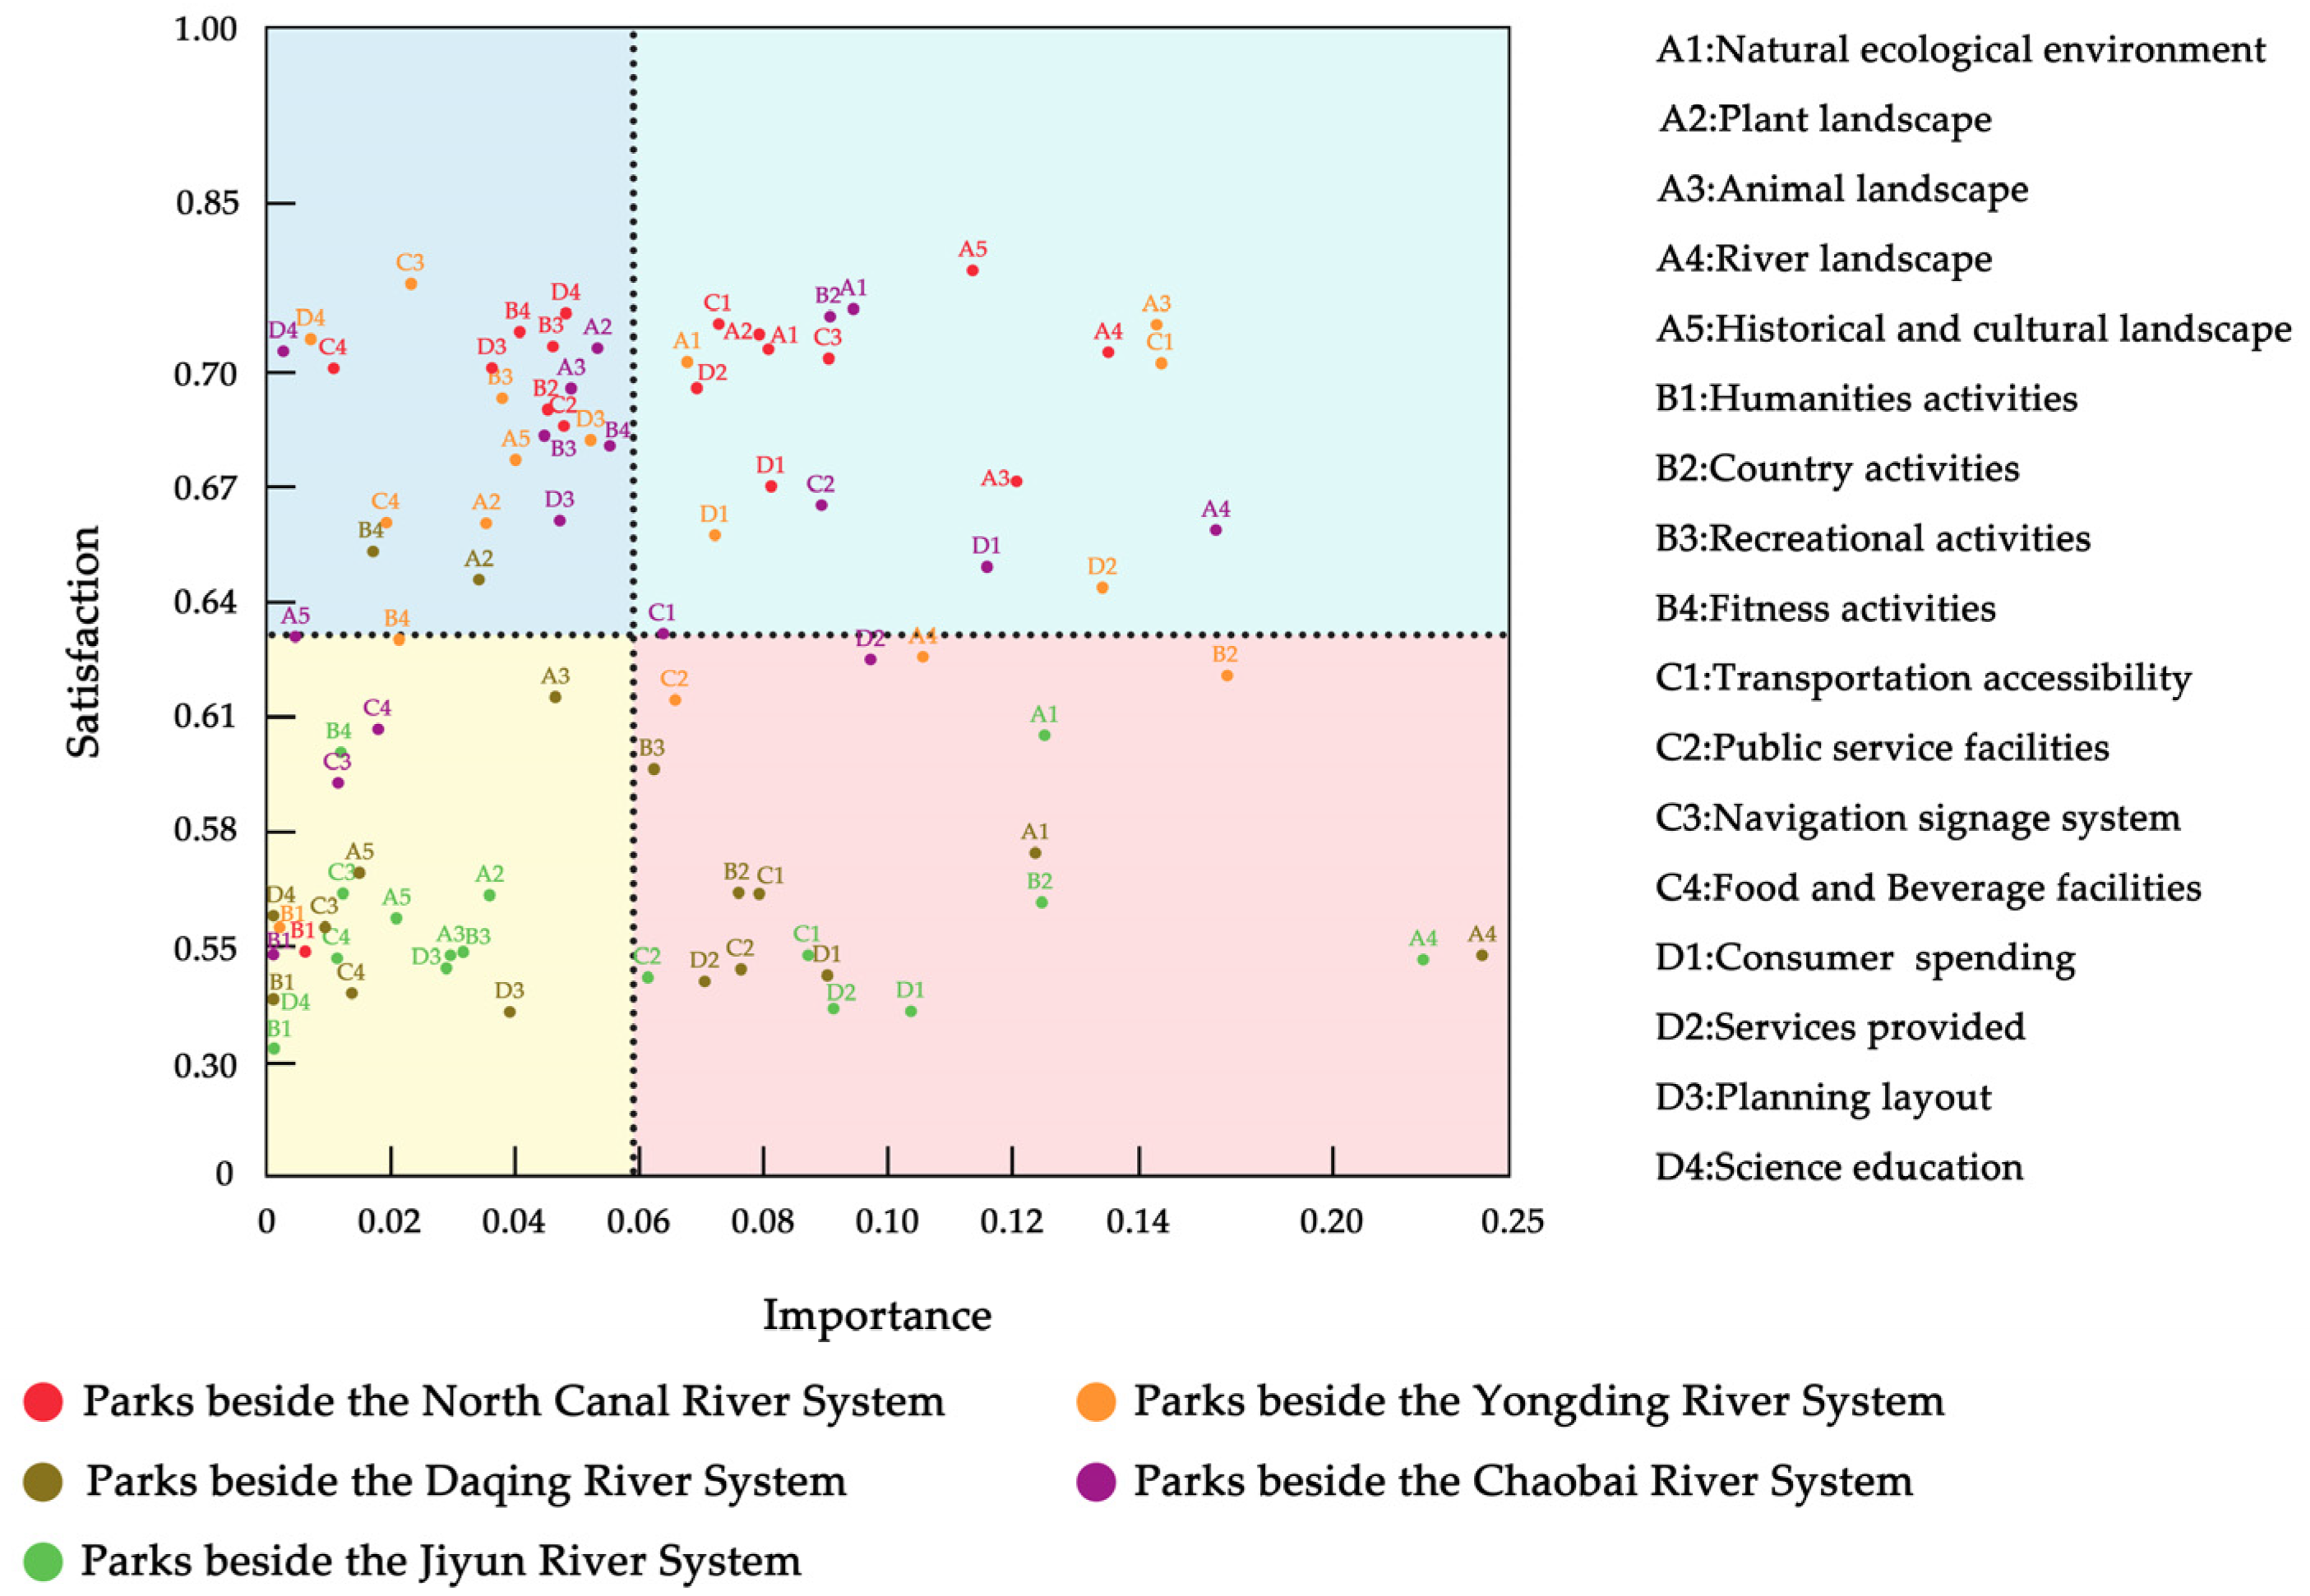
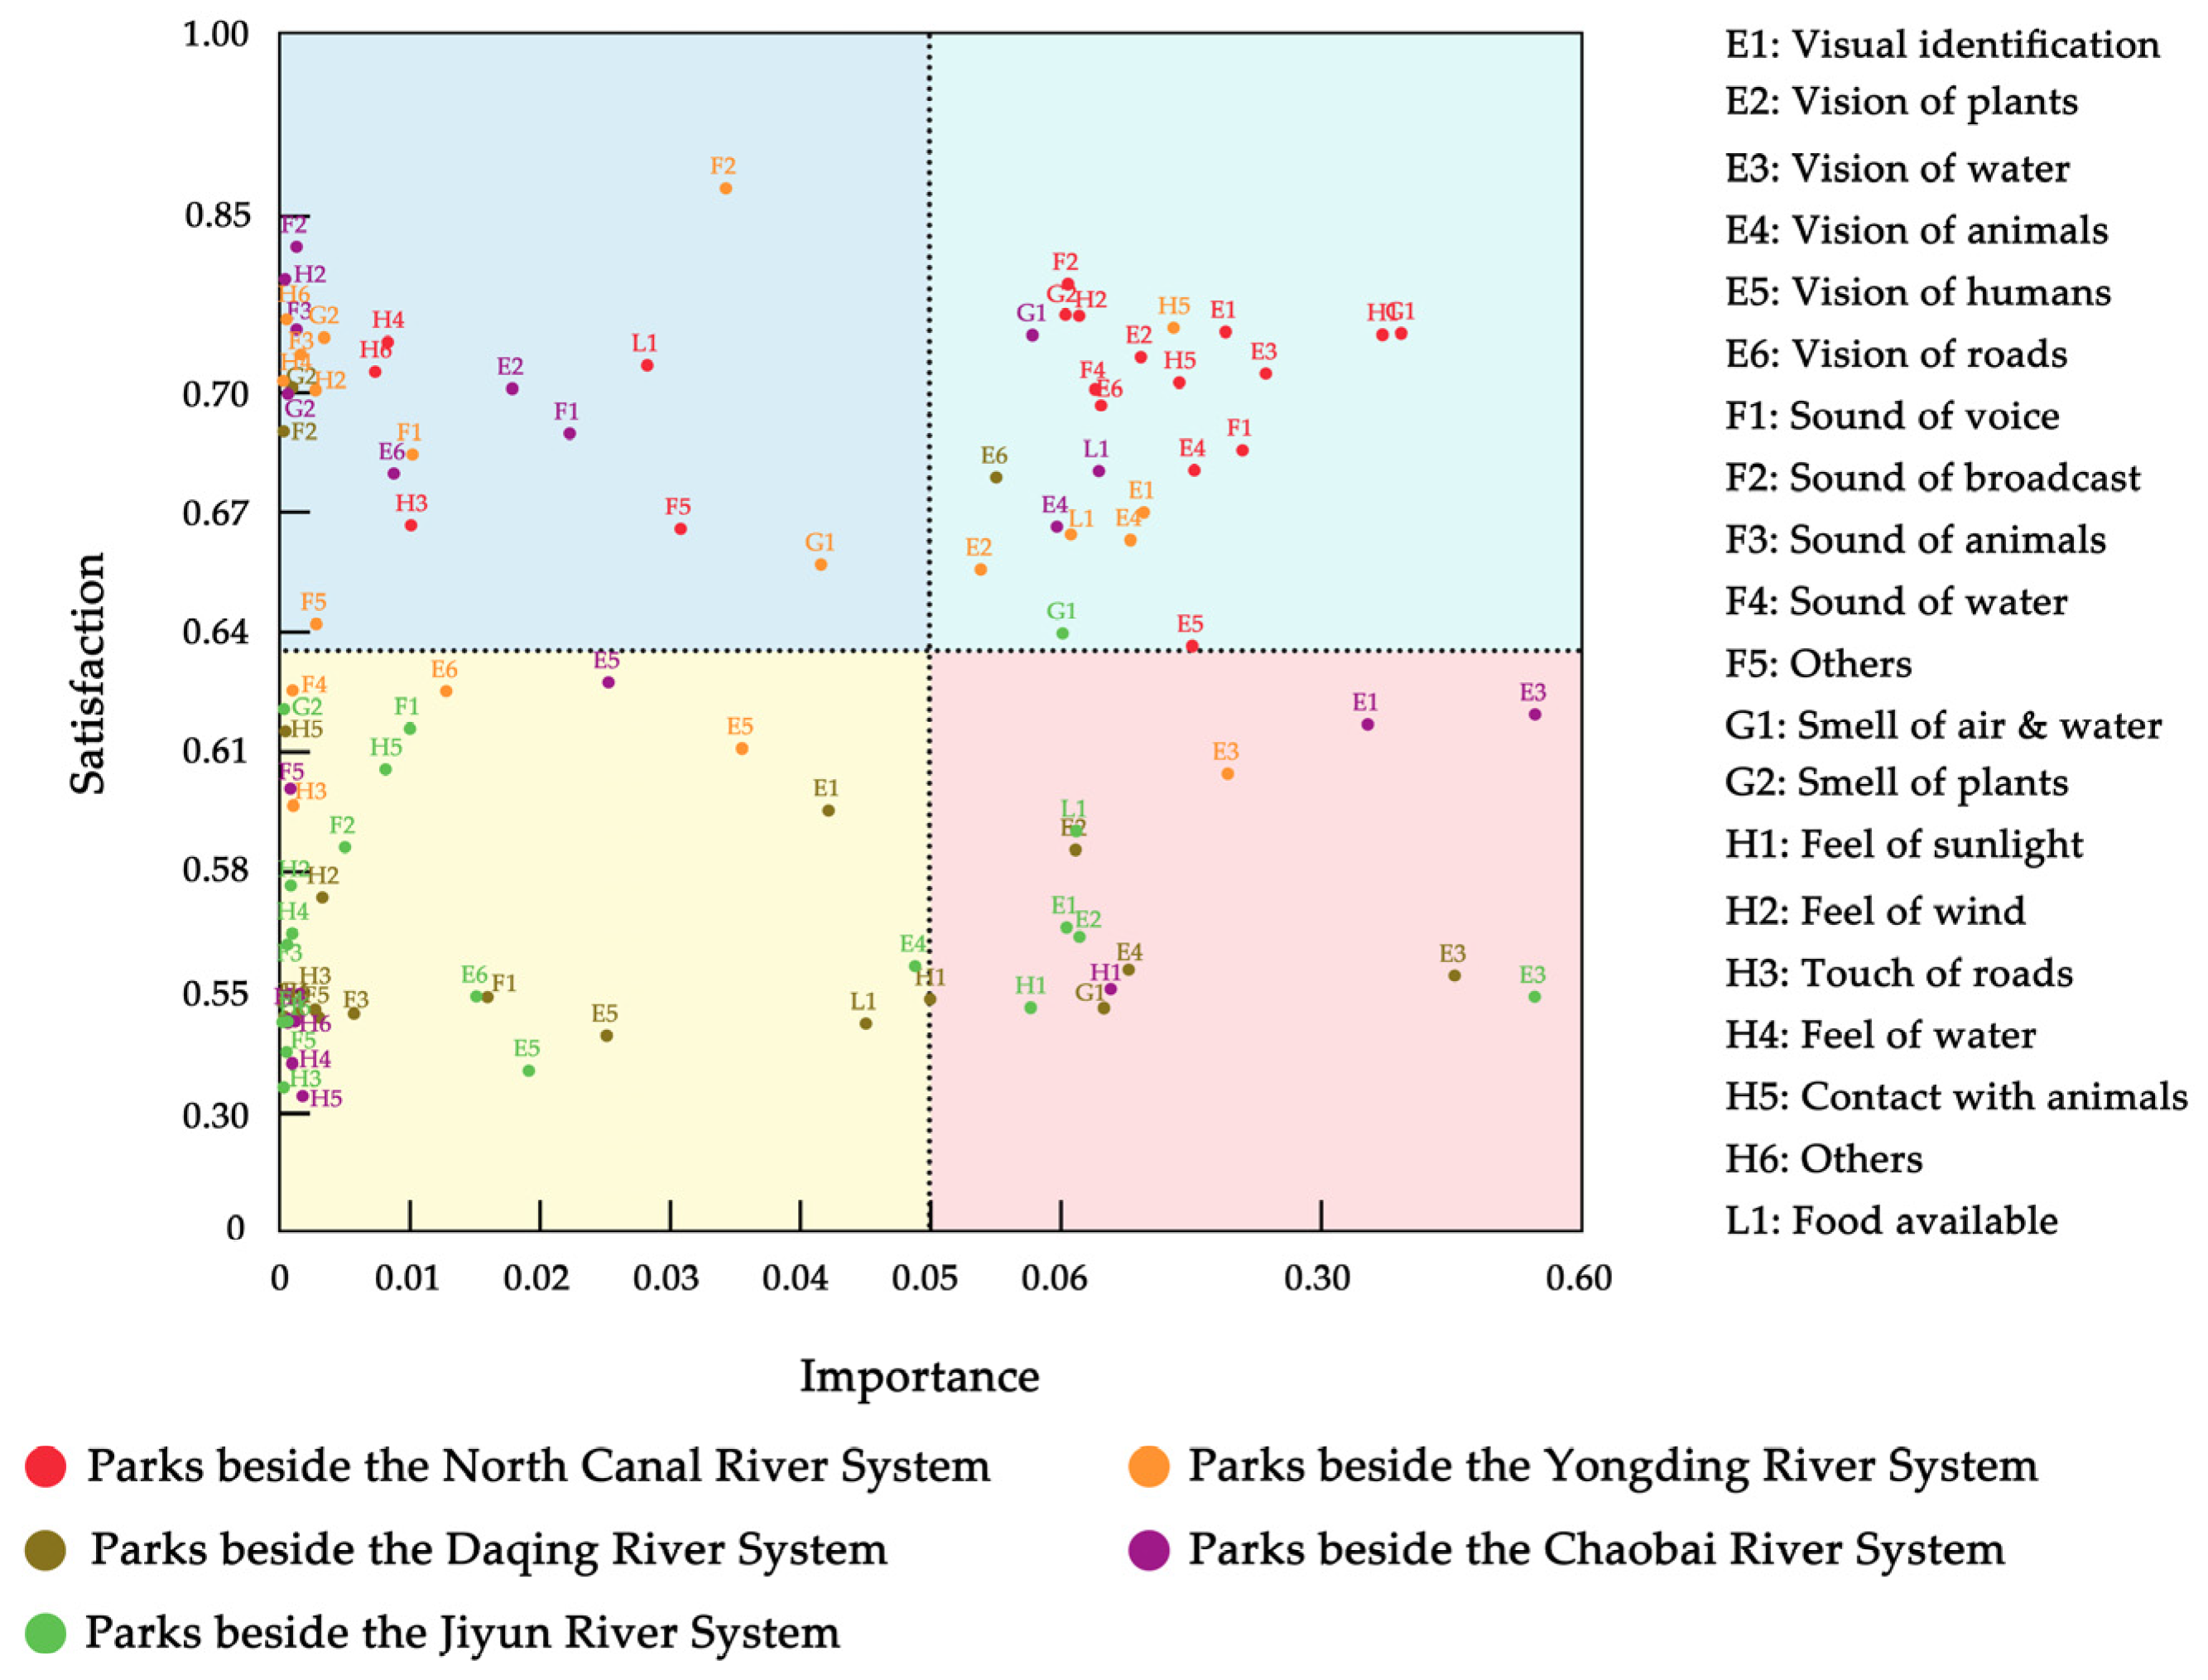
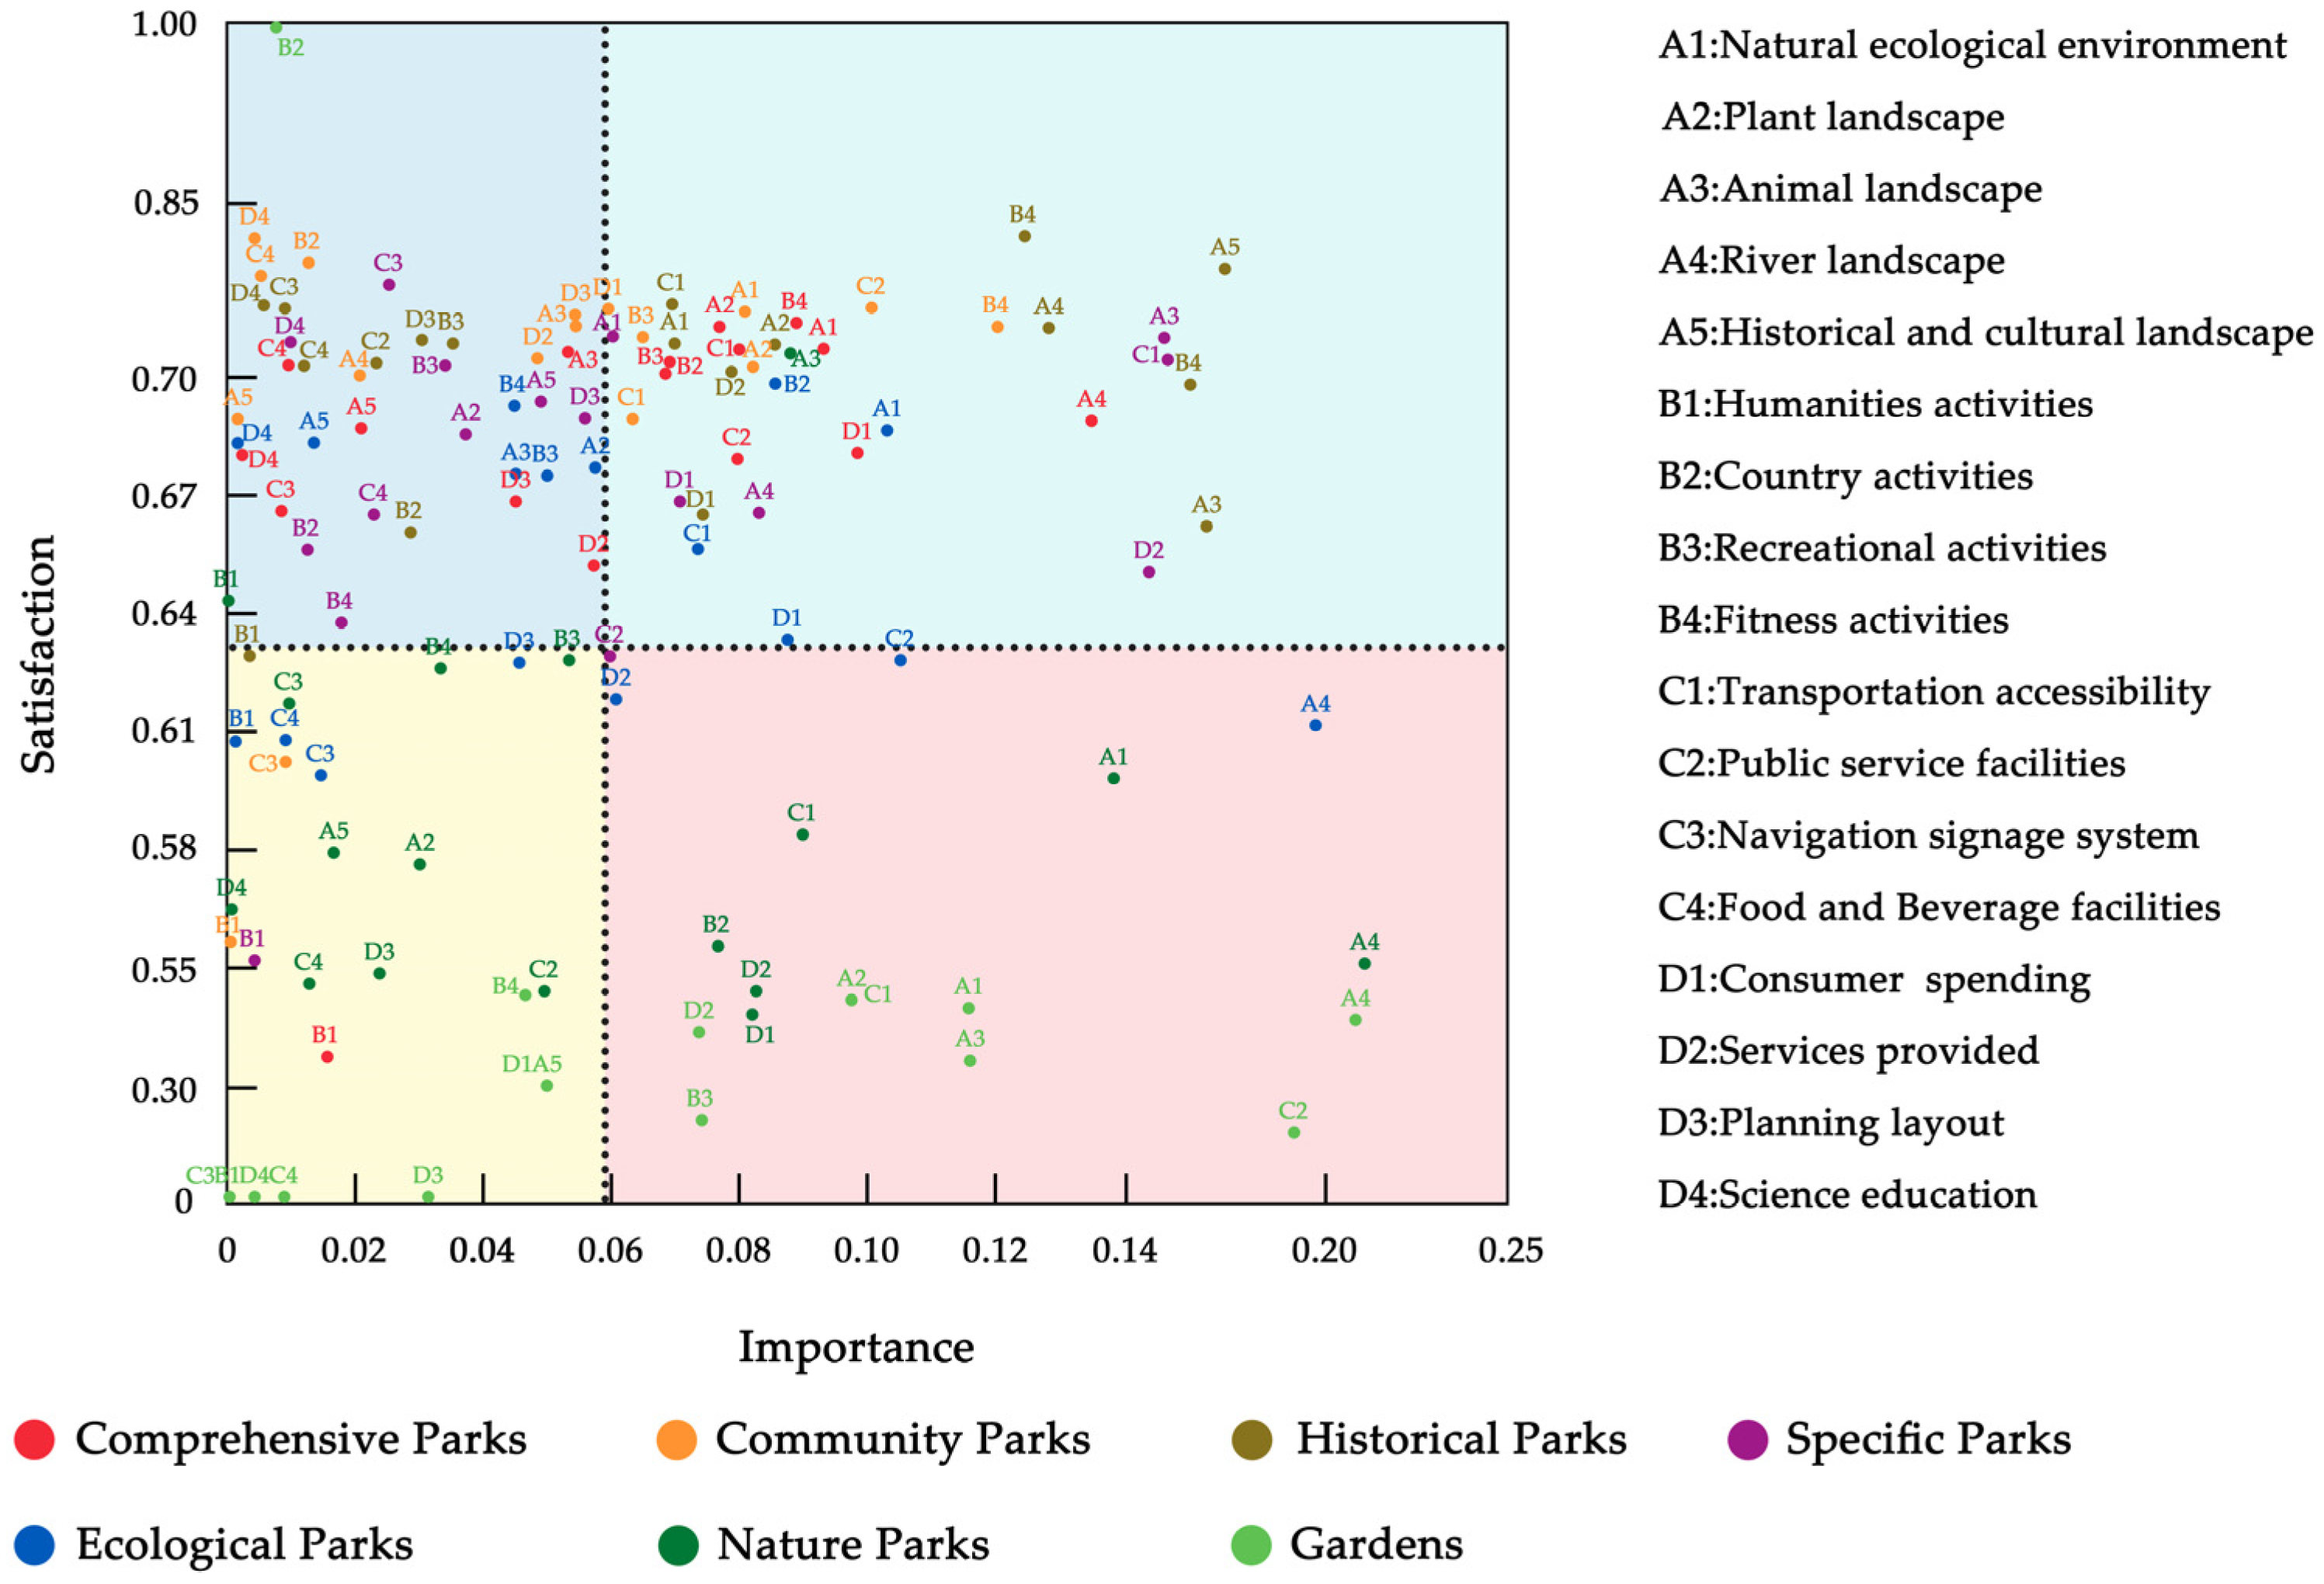
Study the factors that influence people’s satisfaction with landscape design and sensory perception of various parks based on importance–performance analysis;
(4)
The differences in the satisfaction of park evaluation factors between parks adjacent to different river systems, parks of different types, and parks in different districts, based on one-way analysis of variance.

2. Literature Review

Cities, water systems and green space are closely related to each other. Water systems are an important organization system of urban open space [39]. Waterfront green space, under the organization of urban water systems, constitutes an urban open space system in which blue and green spaces are interwoven, which results in social and economic benefits, as well as important ecosystem service functions in the city. Since the popularity of urban blue and green space is increasing, a large number of investigations and studies have shown that urban blue and green space has public benefits, such as the positive role of promoting public health. Blue–green spaces have played a role in the health of those living in Japanese megacities by providing a place to reduce stress and mental strain during the coronavirus pandemic [40]. Knight et al. [41] have proven the necessity of improving the ecological quality of blue and green space to enhance residents’ life satisfaction.
The evaluation of blue–green space and waterfront green space provided valuable directions and suggestions for blue–green space planning and urban green space renewal. Some scholars have studied and analyzed the environmental quality, aesthetic quality, aging suitability and other aspects of blue and green space and waterfront green space. Mishra et al. [42] proposed the Blue Health Environmental Assessment tool (BEAT) to evaluate the multiple environmental factors that influence people’s access to, use of, and health promotion of blue spaces, in order to support evidence-based planning for urban blue space development as a public health resource. Subiza Perez et al. [43] developed a Perceived Environmental Aesthetic Qualifications Scale (PEAQS), which surveyed 331 respondents in 3 locations and summarized the conditions under which people have aesthetic perceptions of blue–green space. Min et al. [44] proposed that environment, function and transportation were the most important factors that affect the elderly’s overall satisfaction with waterfront open space through observation of and interviews with the elderly, providing a reference for urban blue and green space to meet the needs of the elderly and improve the service level.
First proposed by Martilla and James in 1977, importance–performance analysis (IPA) was used to compare customers’ pre-consumption expectations and post-consumption satisfaction, as well as the customer’s evaluation of the performance status of each product attribute [45,46]. The application of IPA to the service industry began in the early 1990s [47], including the evaluation of specific service satisfaction [48], the study of the attractiveness of designated areas [49], and the formulation of tourism policy [50]. In recent years, IPA has been utilized extensively in landscape architecture to examine the characteristics of visitor demand [51] and the recreation situation [16,52]. Liu et al. [53] used IPA to identify the most pressing problems in Shanghai’s public spaces on both sides of the Pujiang River and to determine the direction of improvement. In the study of the tourism experience of Haizhu National Wetland Park, Lin et al. [54] used IPA to find out the imperfect aspects of park construction and service, and proposed improvement strategies for the park to improve tourists’ satisfaction. Zheng et al. [55] constructed a perception evaluation model based on sentiment analysis and IPA to evaluate the landscape perception of Beijing Yuyuantan Park.
One-way analysis of variance, or ANOVA, is a statistical method widely used to analyze experimental data. In essence, ANOVA is a hypothesis test. It analyzes and com-pares the data fluctuations under a certain influencing factor to infer whether there is a significant difference between the population. If there is a significant difference, it indicates that the influence of this factor is significant [56]. ANOVA is also widely used in landscape architecture to infer whether two things are related. When studying the relationship between landscape configuration characteristics and the urban heat island effect, Connors et al. [57] used ANOVA to test whether different land uses were significantly correlated with different landscape indicators and land surface temperature. Gao et al. [58] used ANOVA to infer whether there were differences in visual behaviors of visitors observing different types of forest landscape space.
The research in this paper conducted IPA on the recreation elements and perception elements of urban waterfront green space based on social media texts, and made scientific and detailed adjustments and improvements to the index system of the IPA of recreation elements, so as to make it more consistent with the spatial characteristics of urban waterfront green space and the evaluation text of tourists. In terms of tourist perception, the evaluation model of tourist perception elements in this study added indicators such as water sound, water and wind contact, which made up for the shortcomings of the previous evaluation index system of landscape perception. In order to further explore whether the scores of riverfront parks are correlated with different classifications of riverfront parks, SPSS tools were used to conduct a one-way analysis of variance. If the results showed correlation, multiple comparison analyses for each index factor were carried out to investigate the differences between index factors in various blue–green spaces in detail.

3. Materials and Methods

3.1. Study Area

According to our survey, at present, there are problems in Beijing riverside park, such as its single function, inconvenient transportation, slow driving system, and lack of waterfront activity space. There is a strong demand for waterfront environment quality improvement and facility function supplement [59]. In addition, the Beijing Urban Master Plan (2016–2035) proposed to build a green space structure of “one screen, three rings, five rivers and nine wedges” in the city [60], in order to strengthen water ecological environment governance, restore the ecological functions of rivers and lakes, and ensure a good urban ecological environment. Therefore, this study selected 85 parks as the research object (Figure 1), which are an important part of the blue–green space in Beijing and are adjacent to the following 5 major water systems: Yongding River, Daqing River, North Canal River, Chaobai River and Jiyun Canal water systems, and compared them with three social networks, Dianping [61], Ctrip [62], and Mafengwo [63].
In addition, the parks were divided into seven categories based on the park directory information officially released by the Beijing Municipal Bureau of Landscape and Afforestation [64]. Comprehensive parks refer to parks with complete functions, complete facilities and diverse content, which can meet the needs of different people for recreation. Community parks refer to parks where residents in a certain area of residential land carry out daily leisure activities nearby. Historical parks refer to garden scenes that can reflect garden building techniques in a specific historical period and have an impact on the change and cultural development of the city. Specific parks are parks that focus on creating special themes and building specific service content with leisure functions. Gardens are smaller parks that are convenient for nearby residents and workers to use. Ecological parks refer to parks that are located outside the urban construction land and assume multiple functions, such as natural landscape displays and popular science education publicity. Natural parks are areas open to the public in the natural protection area system, which have the functions of leisure and popular science education.
The administrative location of the parks was divided into the following three categories based on the planning documents of the Beijing Municipal government: six central districts (Dongcheng District, Xicheng District, Chaoyang District, Haidian District, Fengtai District and Shijingshan District), inner suburbs (Daxing District, Tongzhou District, Shunyi District, Changping District, Mentougou District, Fangshan District), and outer suburbs (Huairou District, Pinggu District, Miyun District, Yanqing District), to ensure the accuracy and recognition of classification.

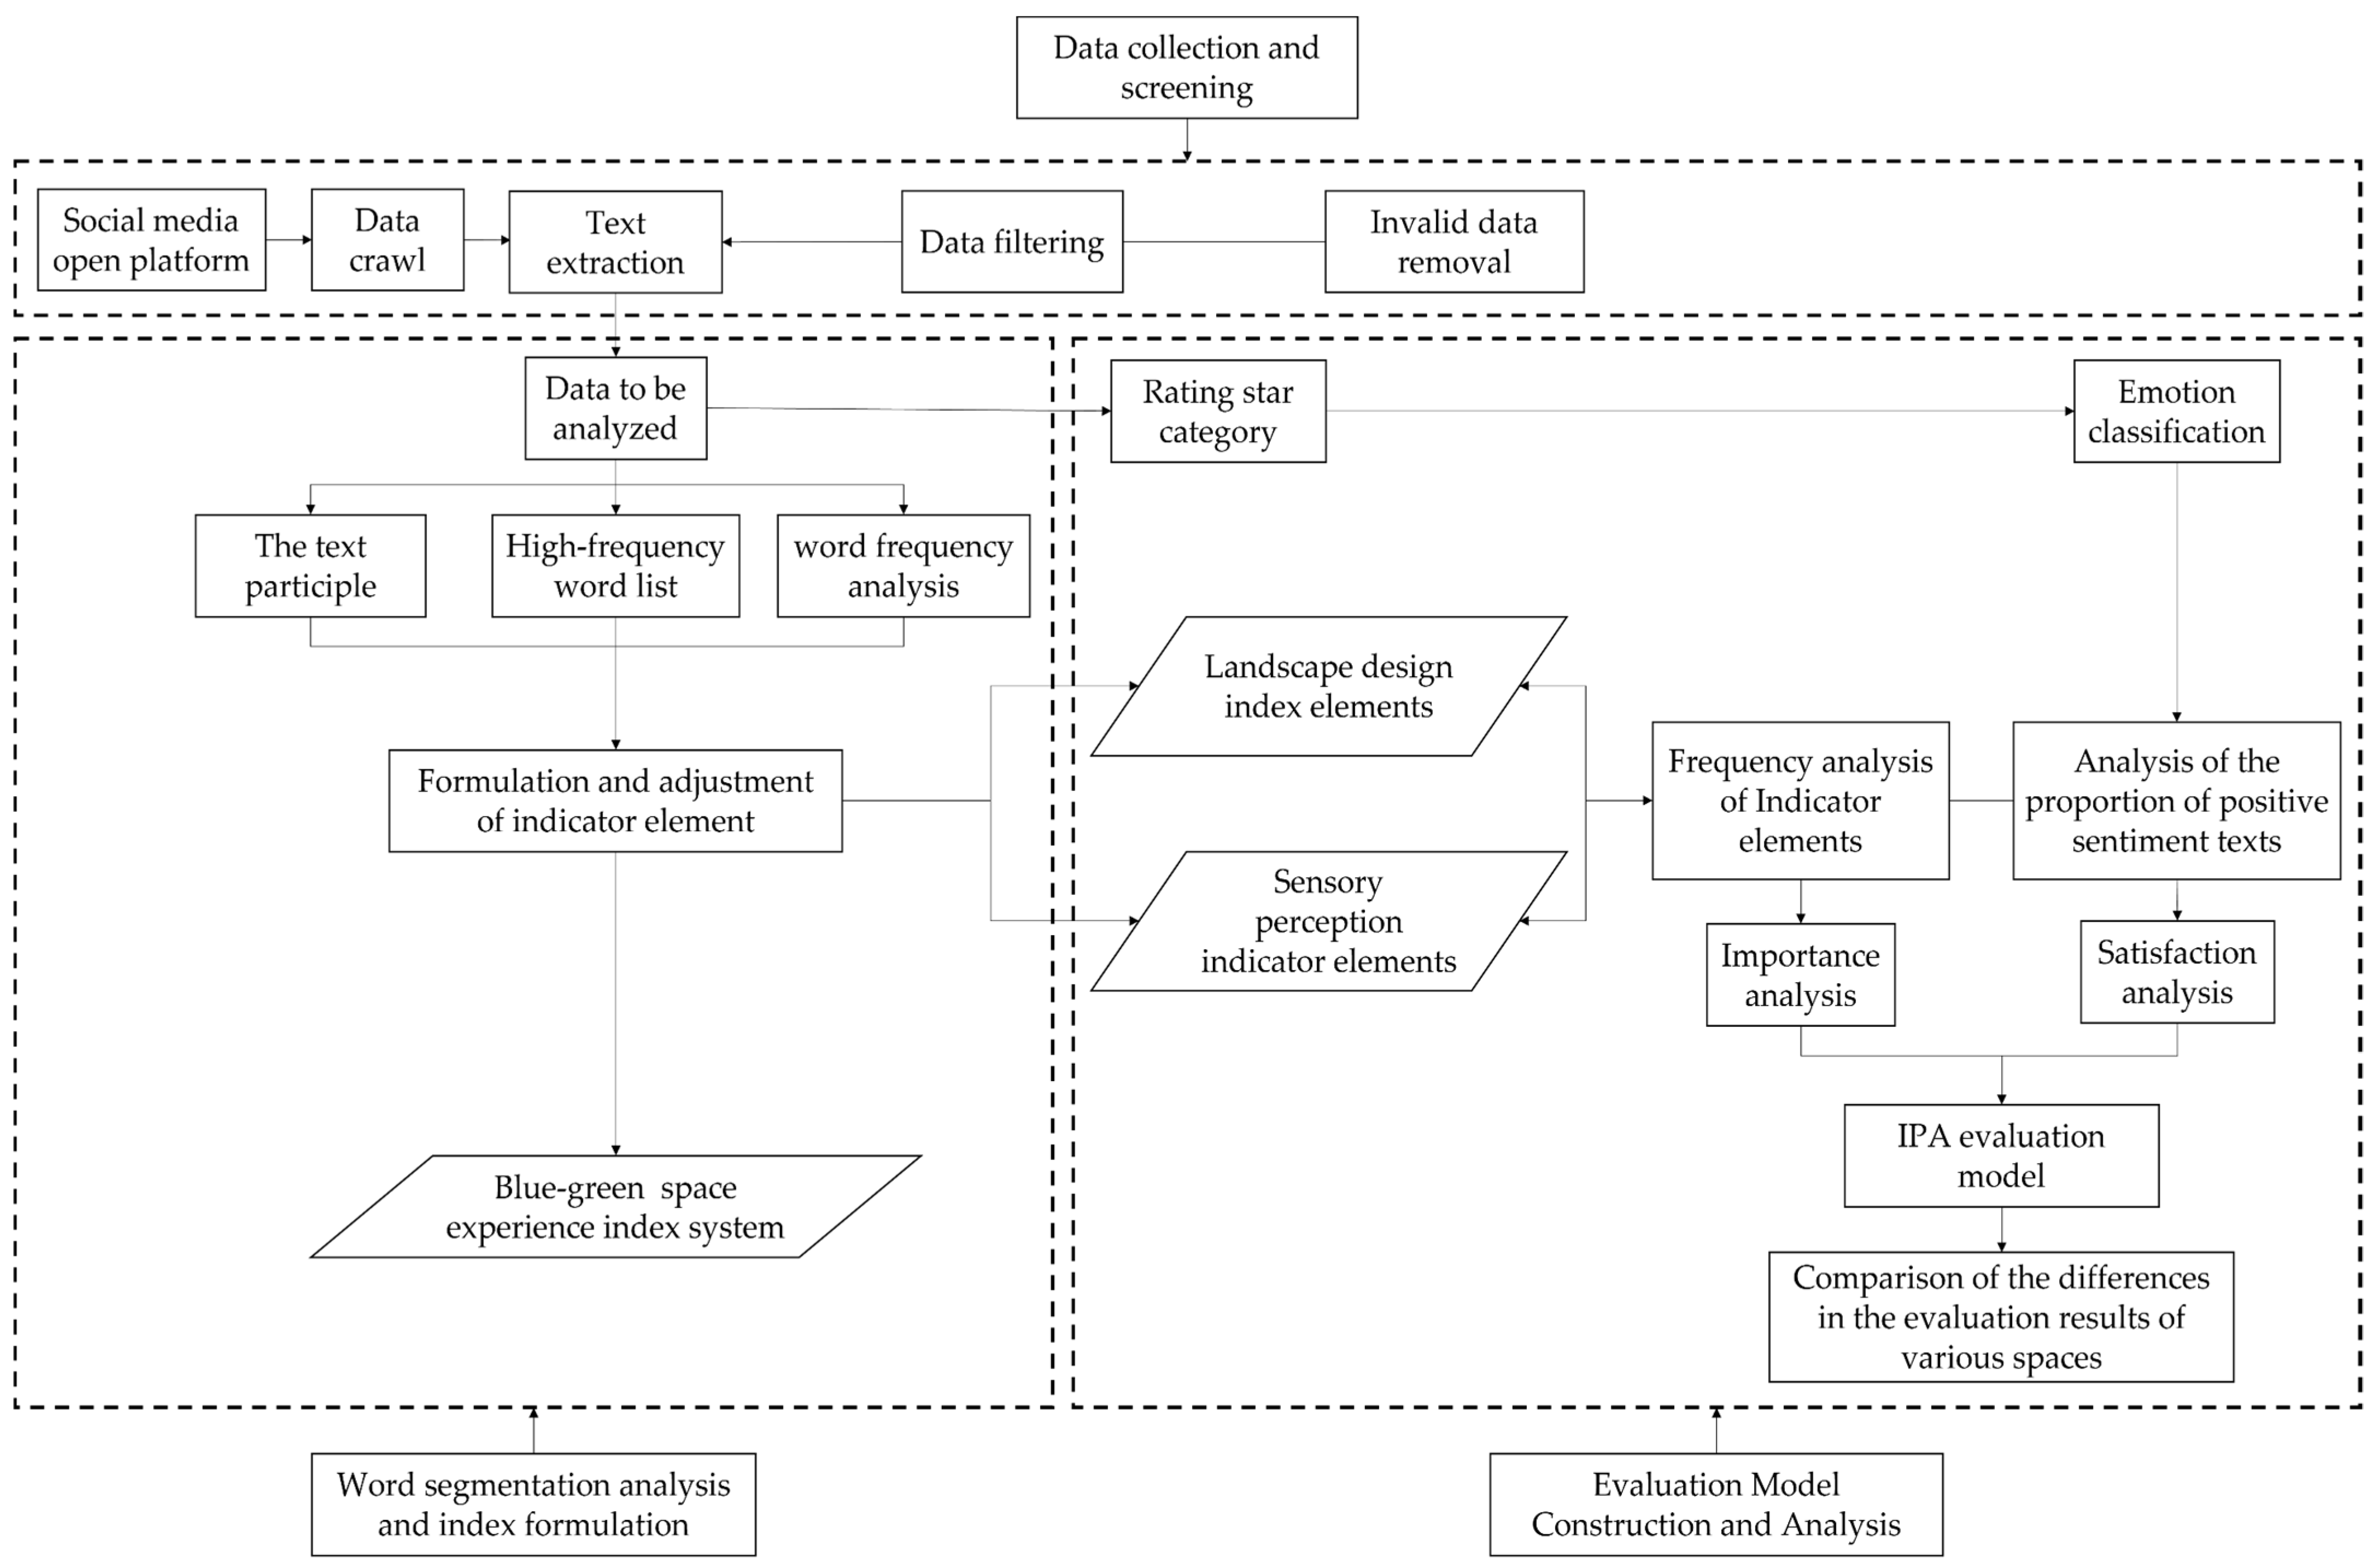
3.2. Analysis Process

This paper constructed an evaluation framework of typical blue–green spaces in Beijing based on social media data for the study of landscape satisfaction (Figure 2). Firstly, based on the proportion of the reviews on the three platforms, the weighted average of review stars was carried out to obtain the average rating stars and evaluation result of each park. Then, the basic database text was extracted by crawling and screening the data on the open platform of social media. The text segmentation of the data and the list of high-frequency words were extracted, and the indicator elements were formulated and adjusted as the index system of blue–green space experience. The index system was divided into landscape design index elements and sensory perception index elements, and the frequency analysis was carried out to obtain the results of word frequency importance. The IPA evaluation model was constructed based on the importance analysis results obtained from the analysis of the proportion of positive emotion text, and the difference comparison of evaluation results of various spaces was finally formed.

3.3. Data Processing and Index Design

Multiple influential social media platforms in China provided the data for this study, including Dianping, Ctrip, and Mafengwo. The data included the text and image content published by users in a particular space, the gender and region of the rating stars, and other elements. The time period used ranged from 1 January 2006 to 31 December 2021, thereby avoiding the problem of incorrect results due to poor comment information timeliness. In addition, a preliminary screening of the collected information was conducted to obtain valid texts with sufficient information and high approval; finally, 352,837 comments, totaling 51,319,471 words, were obtained. The ratio of foreign visitor reviews to local visitor reviews was 1:6, and the ratio of male visitor reviews to female visitor reviews was 1:3.
Since there is no apparent space between words in written Chinese, we must segment the sequence of Chinese character strings arranged at equal distances to process the information [65]. Therefore, we use tools for word segmentation to analyze the acquired text data and remove any words that lack actual meaning. The research used the ROSTCM6 software to perform word segmentation and word frequency analysis on the text data, and a word frequency table was generated.
This study referred to the park landscape evaluation system [52,66] and the visitor perception evaluation system [67] in the blue–green space recreation evaluation literature. It combined them with the existing high-frequency word data from two aspects of park design and individual perception elements. The high-frequency word data were screened, checked, and classified, and a landscape design factor evaluation system with 4 major indicators and 17 factors (Table 1) and a sensory perception factor evaluation system with 5 major indicators and 18 factors (Table 2) were developed.

3.4. Evaluation Model and Method

Through the social media text analysis results, this study evaluated the satisfaction of riverside parks in the blue–green space using the IPA method. In the IPA analysis chart, visitor expectations (importance) served as the horizontal axis, visitor satisfaction served as the vertical axis, and the overall average value served as the separation point of the X–Y axis, resulting in a four-quadrant evaluation model (Figure 3). The first quadrant involves the area that continues to strive to develop, including the experience factors that visitors value and are satisfied with. The second quadrant entails the area that does not need much improvement, including the experience factors that visitors think are not significant, but nonetheless make them very satisfied. The third quadrant is the area that needs gradual improvement, including the experience factors that visitors believe are unimportant and unsatisfactory. Finally, the fourth quadrant involves the area that requires major improvement, including the experience factors that visitors value but are unsatisfied with [68]. The visitor expectations (importance) were evaluated by the frequency of each factor; visitor satisfaction was measured by the proportion of positive emotional texts in the text data. First, we determined the corresponding quantity and frequency of each index factor based on the two major index systems, then graded the evaluation text by referring to a Likert-scale satisfaction grading method. The “1–5 star ratings” of the evaluation text corresponded to “very dissatisfied”, “dissatisfied”, “average”, “satisfied”, and “very satisfied” [16]. Specifically, evaluation texts with more than 4 stars were considered positive emotional texts. Finally, the number and ratio of positive emotional texts were determined for each index factor to evaluate user satisfaction with the factor.

3.5. Analysis of Variance and Comparison

In this study, SPSS tools were used to conduct a one-way analysis of variance and multiple comparison analyses for each index factor [56] to investigate the differences between index factors in various blue–green spaces. In addition, the data used in ANOVA enabled further comparative analysis based on the result data obtained from the IPA analysis and all variables were parameterized to facilitate tests used to check their normality and homoscedasticity, with the obtained p-values. Therefore, the use of ANOVA was feasible.

4. Results

4.1. Comparative Analysis of the Changes in the Number of Reviews in Different Seasons

Based on the selected reviews with a long time span, the changes in the total number of park reviews from spring (March–May), summer (June–August), autumn (September–November) and winter (December–February) from 2006 to 2021 were compared (Figure 4). As can be observed from the figure, the total number of comments in the four seasons generally increased, and the slower growth or sharp decline in the number of comments in 2020 and 2021 was related to the weakened travel intention of tourists after the outbreak of COVID-19. Due to the increasing needs of tourists for a better life, the use of tourism social media has become more extensive with the increase in park recreation activities, and the sample size of comments has increased. Therefore, the differences in the total amount of comments in the four seasons after 2016 have significantly increased. The total amount of comments in winter was the least, and the total amount of comments in spring, summer and autumn was relatively higher. Tourists’ interest in the typical blue–green space in Beijing increased year by year, and they prefer the landscape in spring, summer and autumn, which was related to the climate conditions and the life form of native plants in Beijing. Especially in the past two years, the number of comments was significantly higher in spring, probably because of the rich plant landscape and good water landscape in spring. While maintaining the landscape in spring, summer and autumn, the construction of waterfront green space should enhance the attraction of the park’s winter landscape, so as to give full play to its role in social economy and social ecology.

4.2. Comparative Analysis of Riverside Parks Beside Different River Systems

4.2.1. Rating Star Analysis

According to the statistics (Figure 5), the rating stars of riverside parks from high to low followed the following order: parks beside the North Canal River System, parks beside the Jiyun River System, parks beside the Daqing River System, parks beside the Chaobai River System, parks beside the Yongding River System. The parks beside the North Canal River System receive the highest score, which may be related to their superior geo-graphical location, the large number and variety of parks, the relatively comprehensive coverage of the user demands of all populations, and the large number of samples. The high scores of the parks adjacent to the Daqing River System and the Jiyun River System may be attributable to the late construction date, newer facilities, and the small sample size. Meanwhile, the low scores of the parks adjacent to the Chaobai River System and Yongding River System may be attributable to the fact that the service facilities in the parks are relatively old and do not meet the needs of all users. Therefore, in order to meet the needs of the public, it is recommended that scientific and reasonable space improvements should be implemented.

4.2.2. Importance–Performance Analysis Based on Spatial Landscape Design and Visitors’ Sensory Perception

From the perspective of spatial landscape design, importance–performance analysis for parks with different river systems (Figure 6) revealed that most of the factors that involved parks beside the North Canal River System were in the first and second quadrants. Meanwhile, only “humanities activities” were in the third quadrant, indicating that people were highly satisfied with all aspects of the parks beside the North Canal River System and were more attentive to the humanities activities. The parks adjacent to the Yongding River System highlighted the following three factors: “river landscape”, “country activities”, and “public service facilities”, which were in the fourth quadrant, indicating that people were satisfied with the Yongding River Park as a whole. However, due to its imperfections, it needed to be improved in the areas of river management, river landscape construction, and park services. Only one factor of the “service provided” in the fourth quadrant for the parks along the Chaobai River System indicated that people were extremely satisfied with all aspects of the parks along the Chaobai River System, but expected the park’s service level to be enhanced. Most of the factors of the parks adjacent to the Daqing River System and the Heji Canal river system were in the third and fourth quadrants. It indicates that these parks have significant room for improvement in all aspects, especially regarding the “river landscape”, “natural ecological environment”, and “consumer spending”. These were related to the fact that most of these parks were built relatively late, far from the city center, large in size, it was difficult to refine the landscape construction fully, and they were difficult to manage and maintain.
The importance–performance analysis of parks with different river systems (Figure 7) revealed, from the perspective of visitors’ sensory perception, that people were most satisfied with parks adjacent to the North Canal River System. In contrast, their satisfaction with “crowd interference” was slightly lower. It was likely because the parks adjacent to the North Canal River System were closer to the city center, were constructed earlier, and had more comprehensive service facilities, making them more familiar to visitors. As a result, more visitors chose the parks adjacent to the North Canal River System as their travel destination, which affected the park’s experience. Most parks adjacent to the Yongding River System were in the first and second quadrants. However, they required improvement in terms of “vision of water”, “crowd interference”, “vision of roads”, and particularly “vision of water”. This was likely because the surrounding industrial areas impacted the water quality of the parks. The distribution of factors in the parks adjacent to the Chaobai River System was relatively even, and the “visual recognizability”, “vision of water”, and “feel of sunlight” needed improvement, consistent with the park’s distinctive landscape. Visitors’ recreational experiences were hampered by inadequate construction and inadequate humanization of facilities. In addition, the factors of parks beside the Daqinghe River system and the Jihe River system were primarily located in the third and fourth quadrants, and the aspects of “vision of water”, “vision of animals”, “vision of plants”, and “smell of air and water” needed improvement. It indicates that the ecological environment of these parks beside different river systems needed improvement, which may be related to the fact that the Daqing River and Ji Canal watersheds were mostly located in the suburbs, the construction of these parks was late in the year, and their management services were still imperfect.

4.2.3. One-Way Analysis of Variance and Multiple Comparison Analysis

From the one-way analysis of variance, it was determined that among the 17 landscape design indicators, water parks differed significantly in their satisfaction compared to historical and cultural landscapes, recreational activities, and services provided. Consequently, based on the results of the IPA analysis, several factors were chosen for additional multiple comparison analysis (Table 3).
The evaluation satisfaction of parks adjacent to the North Canal River System was relatively high. The differences between the North Canal River System and other river systems predominated in each index. The historical and cultural landscape (A5) of the North Canal River System and the Jiyun River System differed significantly. The cultural and historical landscapes of the North Canal River System, the Yongding River System, and the Chaobai River System Park were reported as reasonably good. It may be because most historical parks with a rich cultural heritage are located near the North Canal River System. In contrast, the Daqing River System and the Jiyun River System primarily comprised ecological parks that were recently constructed. The North Canal River System, the Yongding River System, and the Jiyun River System had notably different recreation activities (B3) and service offerings (D2). It may be because the Jiyun River System Park was constructed later in the year, and various garden management service facilities were not yet complete. In addition, it was located far from the city center, transportation was inconvenient, the number of visitors was relatively low, and various activities were not carried out to their full potential.
The results of the one-way analysis of variance revealed that among the 20 sensory perception indicators, there were significant differences in the satisfaction of different water parks in the following 5 aspects: visual identification, vision of animals, vision of humans, odor of plants, and feel of roads. Consequently, based on the results of the IPA analysis, several factors were chosen for additional multiple comparison analysis (Table 4).
Regarding visual identification (E1), parks adjacent to the Jiyun River System were significantly less pleasing than those adjacent to the North Canal River System, the Yongding River System, the Daqing River System, and the Chaobai River System. The following reasons were speculated: (1) the parks adjacent to the North Canal River System included historical parks, special parks, and ecological parks, among others. Specifically, the historical parks featured a variety of distinctive garden structures, and the landscape was generally recognizable. (2) Most parks adjacent to the Jiyun River System were natural and ecological parks, which were located far from the city center, had a large area, and had high maintenance and management costs, making it challenging to meet the diverse needs of visitors. In terms of the vision of animals (E4), vision of humans (E5), smell of plants (G2), and feel of roads (H3), the parks adjacent to the Yongding River System provided a lower level of satisfaction than those adjacent to the North Canal River System. It may be because, compared to the parks along the Yongding River System, the parks along the North Canal River System had superior management, more accessible facilities, a more beautiful environment, and greater accessibility regarding traffic. Among all the sensory perception factors, the satisfaction with the vision factor varied the most between parks adjacent to different river systems. In contrast, satisfaction with the other factors was relatively balanced. The parks adjacent to the North Canal River System were the most ideal regarding sensory perception, while the parks adjacent to the Jiyun River System had room for improvement.

4.3. Comparative Analysis of Riverside Parks of Different Types

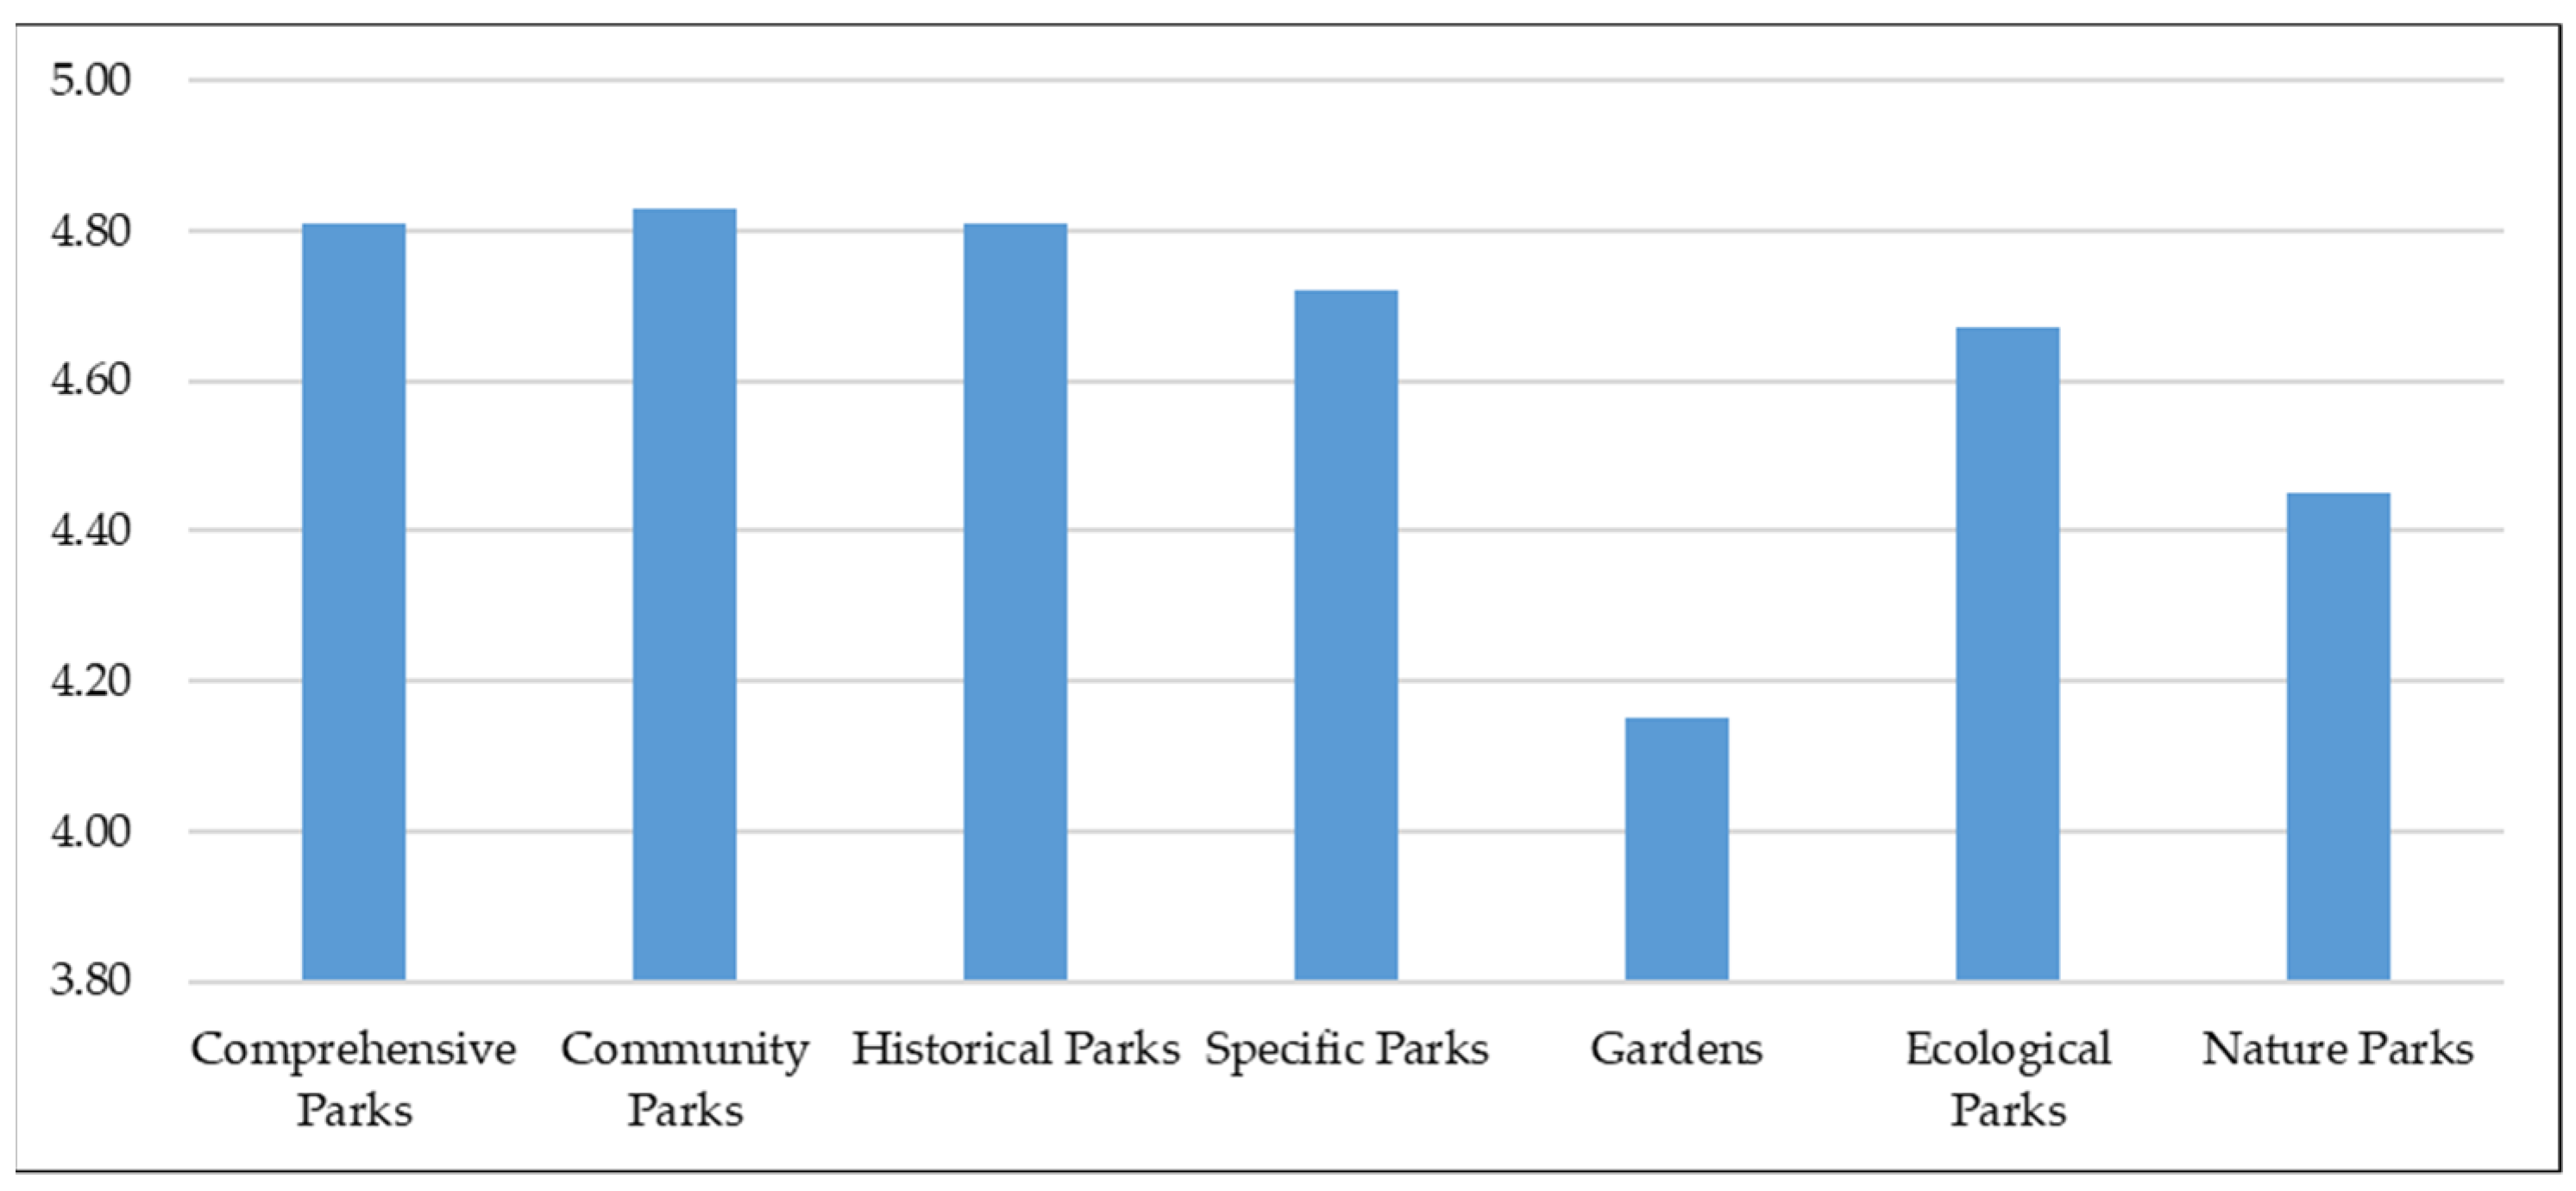
4.3.1. Rating Star Analysis

According to the statistics (Figure 8), community parks are the parks with the highest rating that were generally welcomed by people. Comprehensive parks and historical parks were given high rating stars and similar scores, indicating that comprehensive parks with diverse content, suitable recreation and supporting management service facilities, and historical parks with profound history and cultural deposits, excellent maintenance and management, and strong scientific and educational significance were favored by most tourists. The scores of specific parks, ecological parks and nature parks are relatively low, indicating that parks with specific content or form and natural landscapes are not able to attract the majority of people, and can be further improved in terms of the theme characteristics and natural landscape. The gardens have the lowest rating, which may be related to the small number of samples, the small scale and the small proportion of residents. The service radius of the park can be further optimized, and public service facilities can be improved to provide residents with a better leisure and recreation experience.

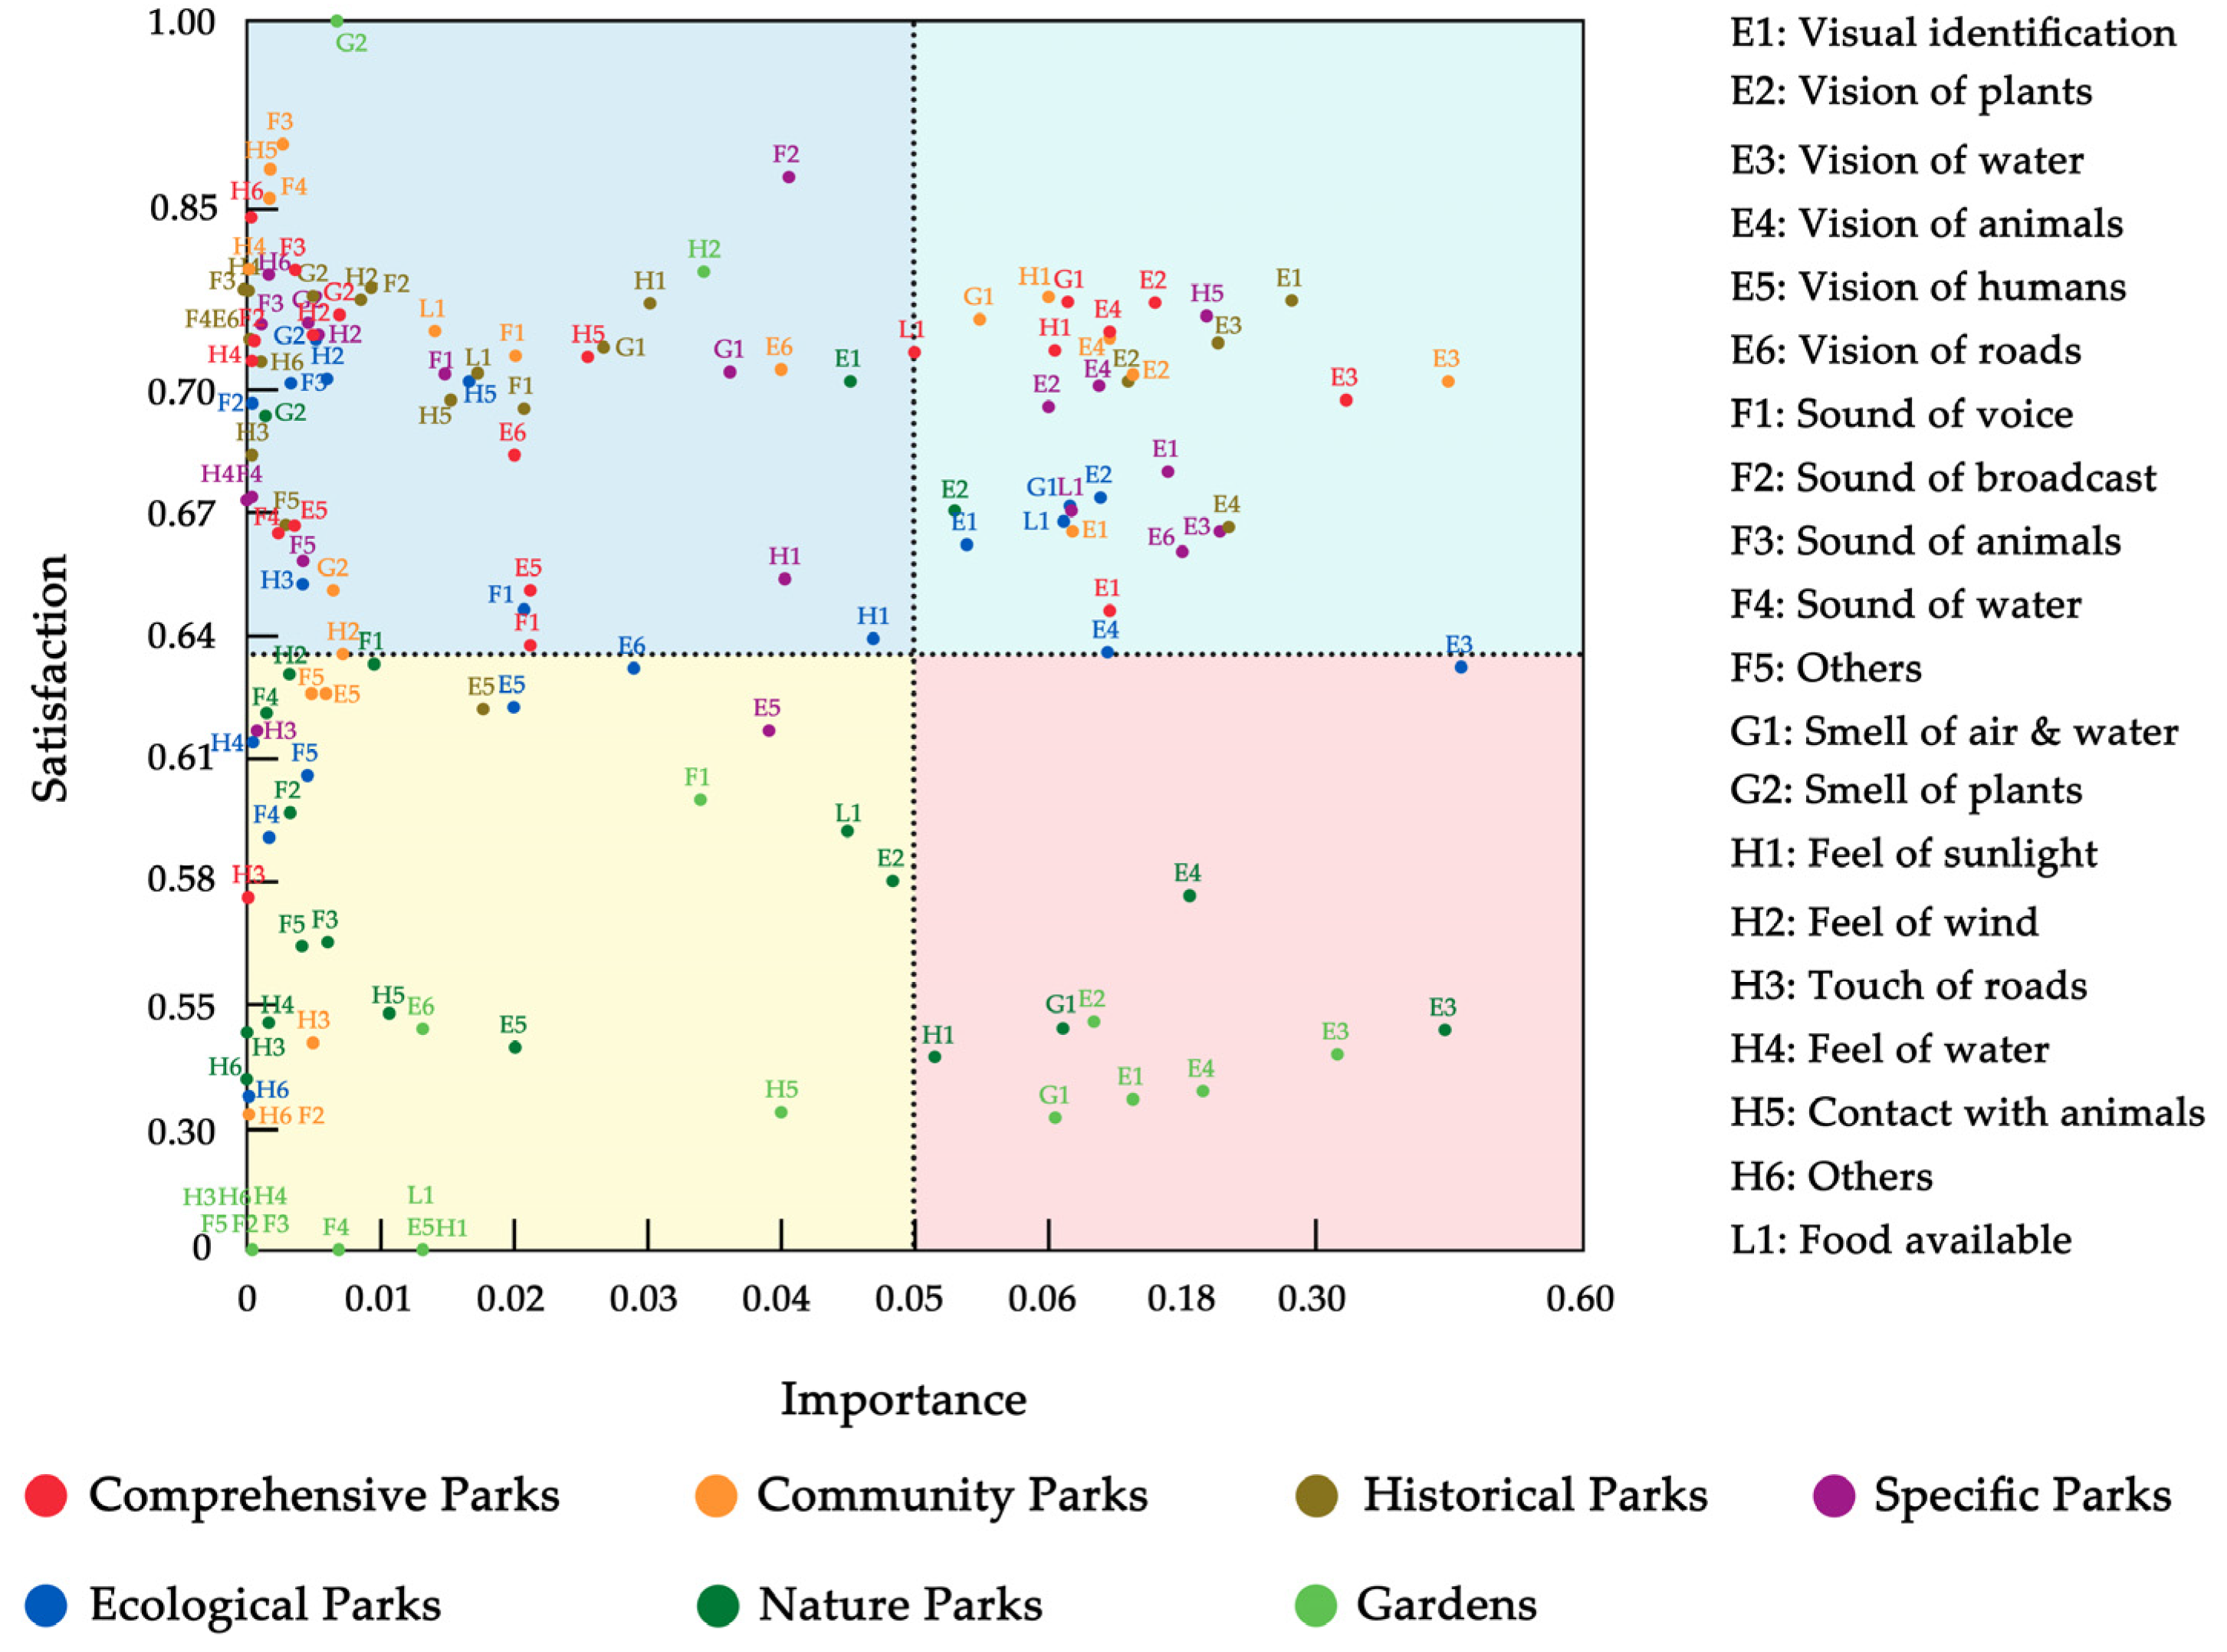
4.3.2. Importance–Performance Analysis Based on Spatial Landscape Design and Visitor Sensory Perception

According to the importance–performance analysis of parks of different types (Figure 9), from the perspective of spatial landscape design, most of the factors of comprehensive parks, community parks, historical parks, and specific parks were in the first and second quadrants. Only “humanities activities” of the comprehensive park was in the third quadrant, indicating that people were highly satisfied with all comprehensive park aspects. Meanwhile, the satisfaction values that involved “public service facilities”, “services provided”, and “consumer spending” were relatively low; hence, the infrastructure and management services of these parks must be further improved. Only “humanities activities” and “navigation signage system” were in the third quadrant, indicating that people were more interested in community parks. It meant that the guide and identification system of community parks and the types of community activities could be further improved and enriched, as they were closely related to the convenience and comfort of community life. The distribution of the factors of historical parks and the park evaluation score demonstrated that the satisfaction of people’s awareness of historical parks was the highest, but “animal landscape” still required improvement. The low level of satisfaction with “services provided” in specific parks may be attributable to the need for more detailed management and maintenance of those parks. Most factors in the ecological park were in the first and second quadrants; a few were in the area where the first and second quadrants intersected with the third and fourth quadrants. Among them, the “river landscape” required improvement, which may have been necessitated by the fact that some natural river channels had been altered by canalization, thereby destroying the original ecological environment. The nature parks and gardens were primarily located in the third and fourth quadrants. In addition to the factors of “animal landscape” and “humanities activities” in natural parks, which were in high-satisfaction areas, other aspects needed improvement. It may be because most natural parks were located far from urban areas, and the management services were not yet ideal. The low level of satisfaction with the park may be attributable to the small sample size.
From the perspective of visitors’ sensory perception, the importance–performance analysis for parks of different types (Figure 10) revealed that most visual perception factors were in the first and fourth quadrants. It indicates that visual perception was significantly more critical than other sensory perception needs. In terms of different park types, most of the factors of comprehensive parks, community parks, historic parks, and specific parks were in the first and second quadrants, indicating that people were relatively satisfied with the sensory perception of various aspects of these parks. However, there were still factors that needed improvement. Among them, “feel of roads” satisfaction was generally low, particularly in underdeveloped community parks. Most ecological park factors were within the average satisfaction category, but “vision of water” and “vision of animals” needed to be improved significantly. It may be due to the ecological parks’ damage to the natural water environment and animal habitats and the length of time needed for restoration. Finally, most garden and natural park factors were in the third and fourth quadrants, indicating that people’s satisfaction with all aspects of sensory perception in these parks was relatively low and that all factors required improvement. Again, it was related to the remote and suburban regions with verdant mountains and forests, significant temperature variations, and variable climates.

4.3.3. One-Way Analysis of Variance and Multiple Comparison Analysis

Except for the natural ecological environment, river landscape, country activities, fitness activities, and navigation signage system, the one-way analysis of variance revealed that among the 17 landscape design indicators, there were significant differences in satisfaction between the parks of different types in all other aspects. Consequently, based on the results of the IPA analysis, several factors were chosen for additional multiple comparison analysis (Table 5).
Comprehensive and historical parks had relatively high overall satisfaction, whereas ecological and nature parks had relatively low overall satisfaction. The differences between each index were most pronounced between comprehensive parks, historical parks, and specific parks, as well as between nature and ecological parks. Especially concerning historical parks and specific parks, each index displayed glaring differences. Comprehensive parks and historical parks with plant landscapes (A2) and animal landscapes (A3) differed significantly from specific parks from the perspective of each index due to their different park type positioning. There were clear distinctions between ecological and historical parks with cultural landscapes (A5). It may be because ecological parks focus more on creating and maintaining natural landscapes. In contrast, historical parks focus more on the continuation and inheritance of historical and cultural landscapes. Significant differences existed between natural and other types of parks regarding consumer spending (D1) and services provided (D2). These differences were attributable to the vast area of natural parks, their distance from the city center, and their high maintenance and management costs.
From the one-way analysis of variance, it was determined that among the 20 indicators of sensory perception, different types of parks had significantly different levels of satisfaction with each factor. Consequently, based on the results of the IPA analysis, several factors were chosen for additional multiple comparison analysis (Table 6).
The differences between comprehensive parks and historical parks were negligible, and the differences in various indicators were primarily concentrated between comprehensive parks and other types of parks, with the differences in vision factor being particularly pronounced. Among them, there were significant differences in visual identification between historical and ecological parks (E1). Historical parks focus more on the human environment, whereas ecological parks focus more on the natural environment. There were clear distinctions between nature and other types of parks, except for ecological parks in their vision of water (E3) and vision of animals (E4), which were related to the different construction purposes of natural parks. The protection of natural ecosystems and natural landscapes received the most attention in nature parks, followed by ornamental, cultural, and scientific values. The smell of the air and water in nature parks differed from that of other parks (G1), which may be attributable to the nature parks’ distance from the city center, beautiful natural surroundings, and high air and water quality. There were discernible differences between community parks and ecological parks in the quality of sunlight (H1), which may be attributable to differences in the number of visitors, the reason for their visit, and the location of the parks.

4.4. Comparative Analysis of Riverside Parks in Different Districts

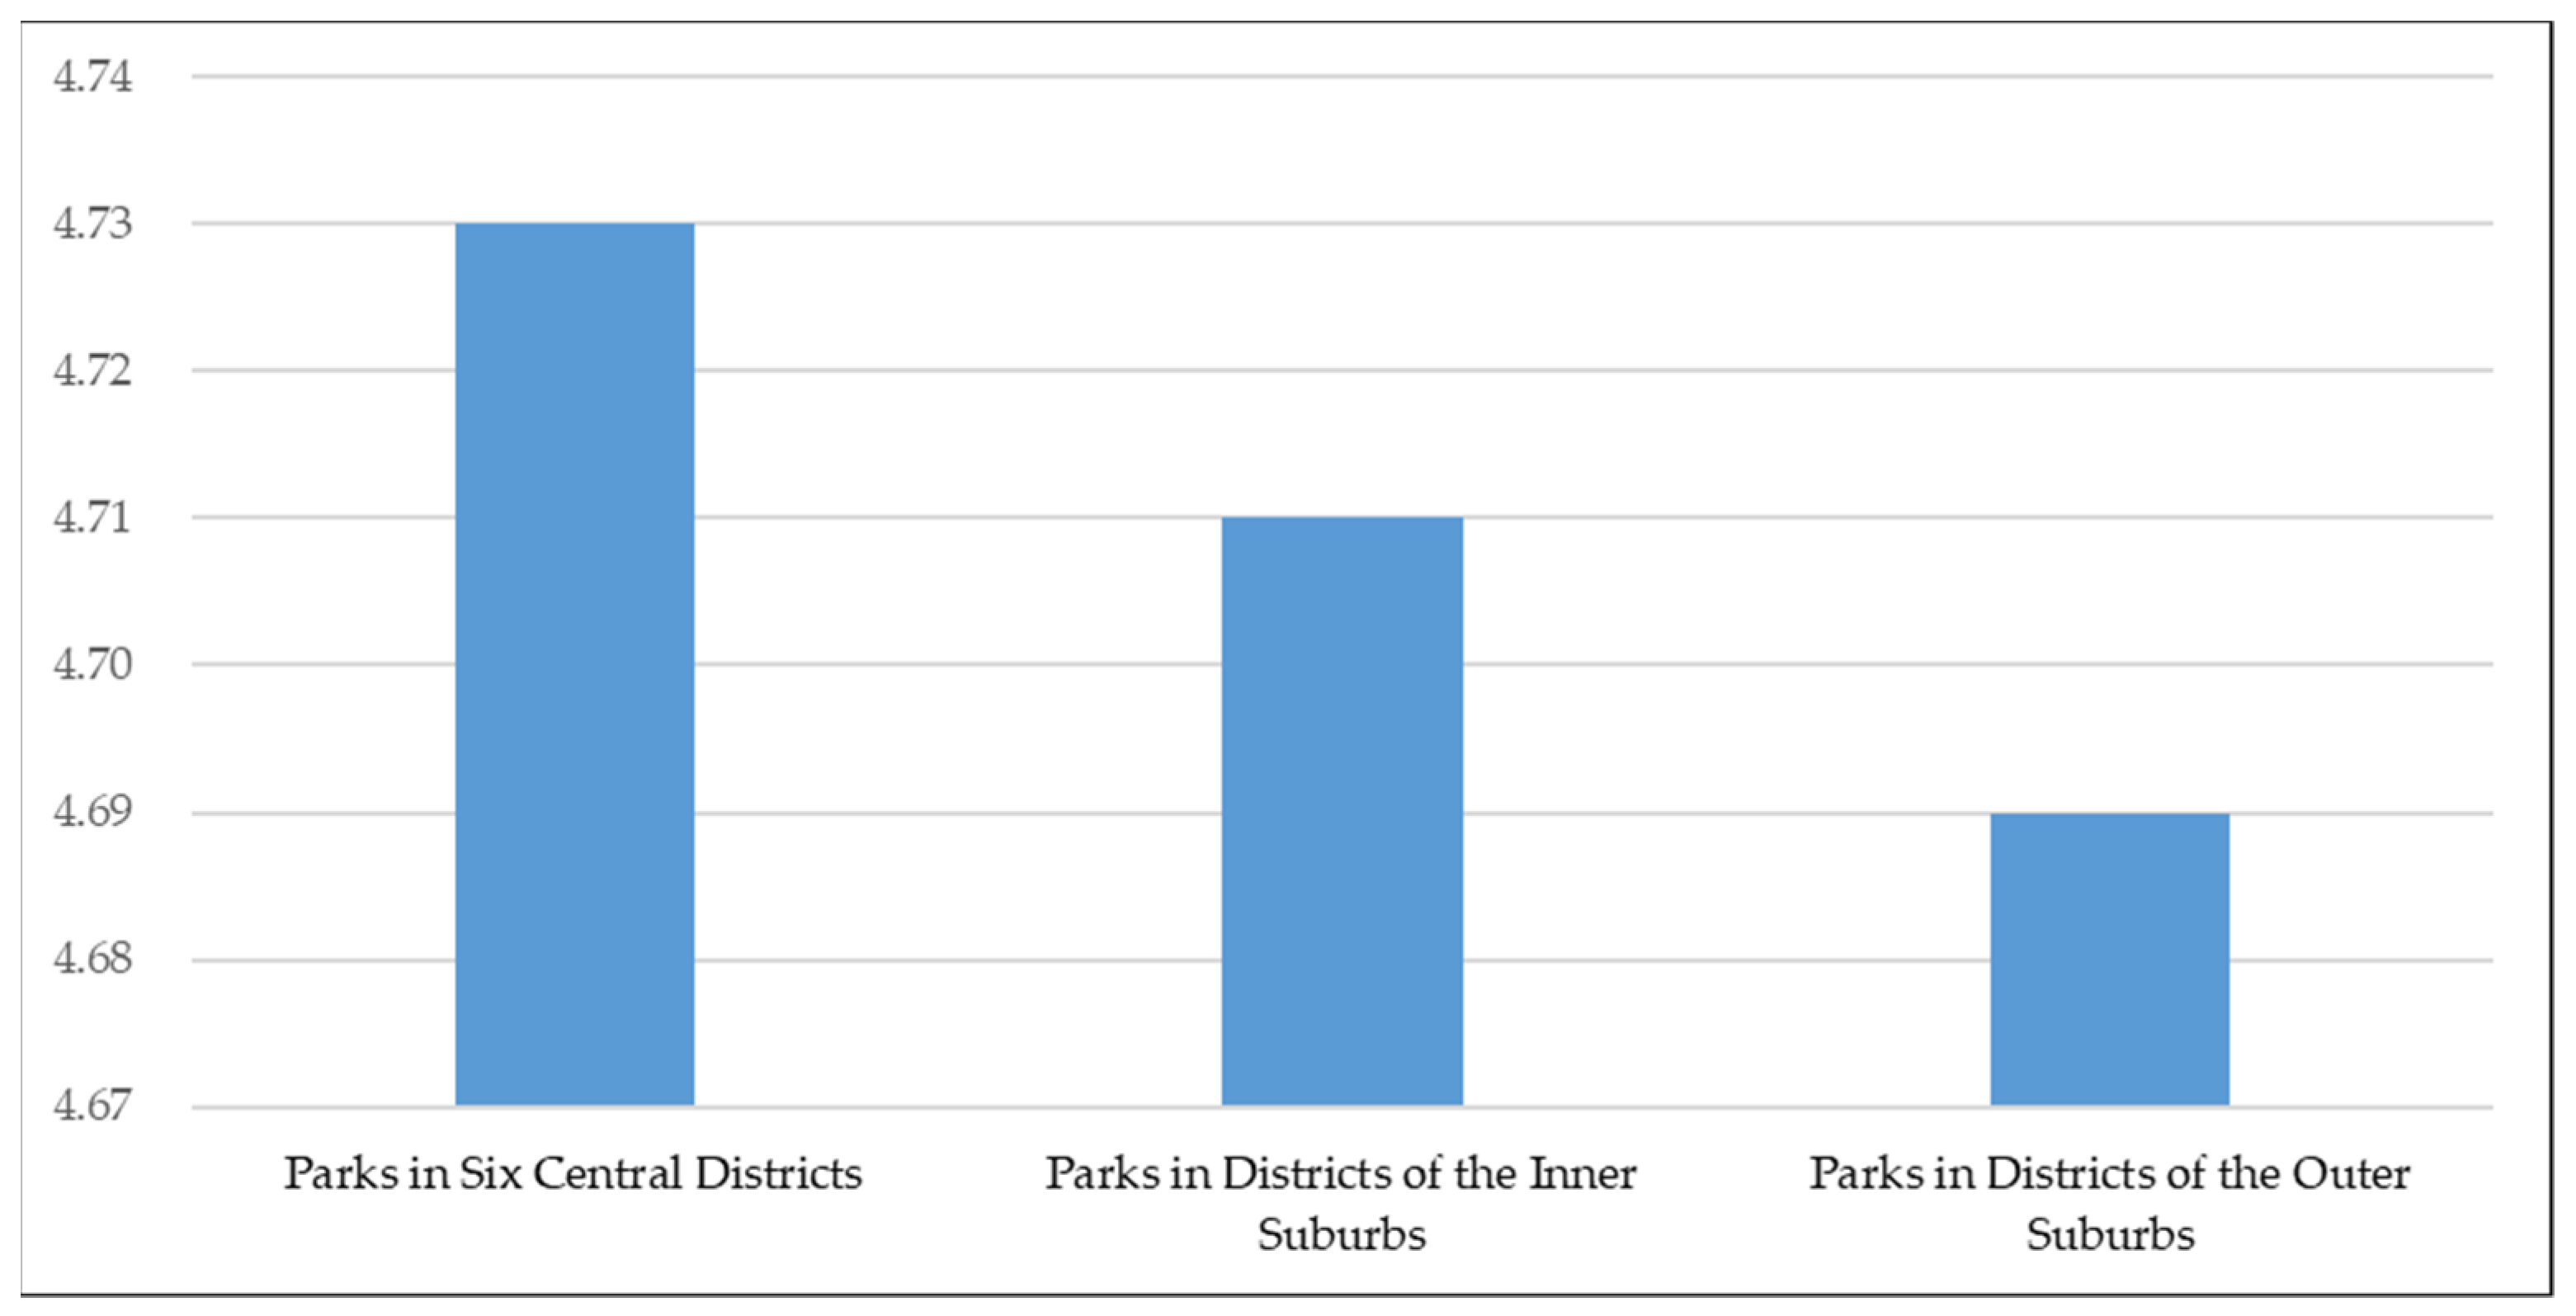
4.4.1. Rating Star Analysis

According to the statistics (Figure 11), the average rating stars of riverside parks in six central districts, districts of the inner suburbs and districts of the outer suburbs decrease sequentially. The difference between the lowest and highest average rating star is approximately 0.05, and the overall difference is small. The average rating star of the parks in six central districts is the highest, possibly because they are located in the city center, with long-term operation and sufficient management experience. The satisfaction of the parks in the districts of the inner suburbs is moderate, which may be due to the proximity of the parks to the city center and the variety and content of the parks. The average rating star of parks in districts of the outer suburbs is the lowest, which may be related to the fact that the parks are far away from the city center and are dominated by plant landscapes and ecological recreation activities. Therefore, the positioning of the parks should be improved to enhance the attraction of the parks.

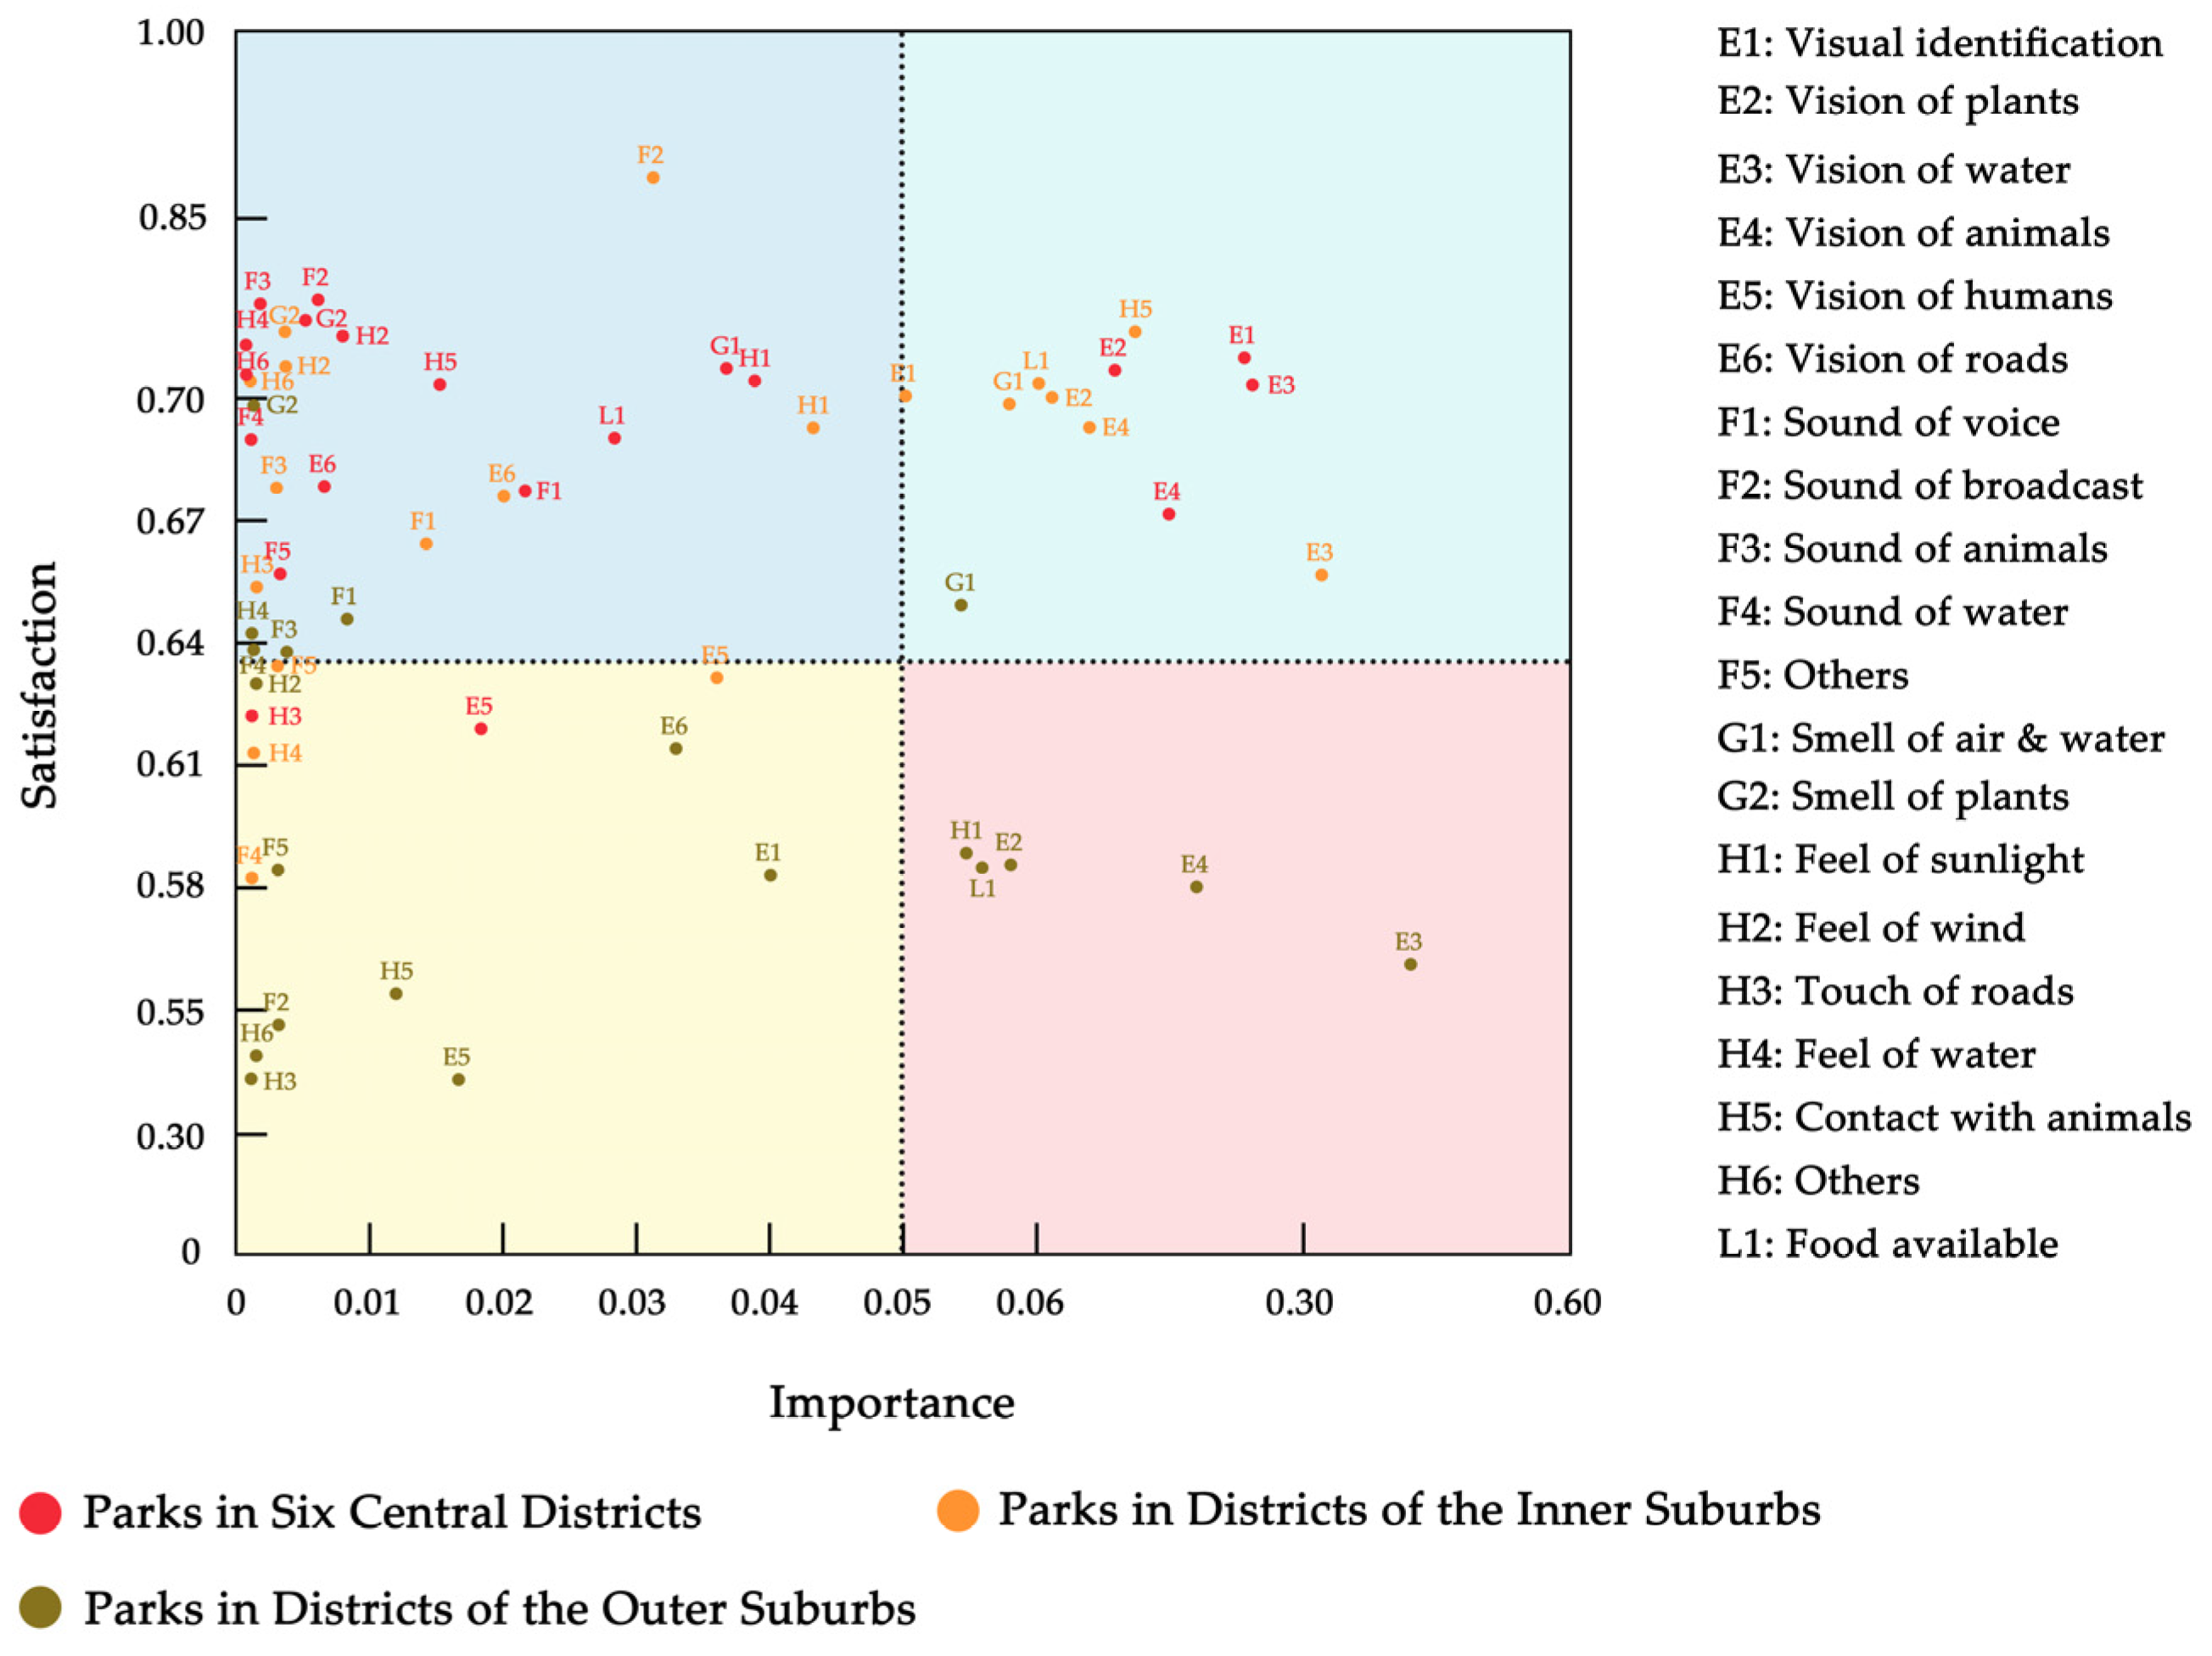
4.4.2. Importance–Performance Analysis Based on Two Aspects of Spatial Landscape Design and Visitors’ Sensory Perception

From the standpoint of spatial landscape design, the importance–performance analysis for parks in different districts (Figure 12) revealed that most park factors within the six central districts were in the first and second quadrants. The highly significant landscape factors were also located in the first and second quadrants. A high level of satisfaction was reported, but “humanities activities” needed to be improved. The residents of the six central districts may have had a higher standard of living and higher expectations and the evaluation criteria for parks may have been more stringent than in other areas. Consequently, the requirements for developing park cultural activities were more stringent. All the factors of the parks in the districts of the inner suburbs were in the first and second quadrants, indicating that they were relatively acceptable in all respects. The factors of parks in the districts of the outer suburbs were primarily in the third and fourth quadrants, with “animal landscape” and “recreational activities” located in the first and second quadrants, respectively. It may be due to people’s desire to be close to nature and to relax in the suburban environment. However, satisfaction with factors such as “consumer spending” and “services provided” was lower, likely because the time and cost of the park activities did not match the satisfaction of the activities available in the parks.
The importance–performance analysis of parks in different districts (Figure 13) revealed, from the perspective of visitors’ sensory perception, that most of the park factors in the six central districts were in the second quadrant. In contrast, the first quadrant contained only visual factors, indicating that the importance and satisfaction of visual factors were high. In addition, the satisfaction of “crowd interference” and “feel of roads” was low due to the park’s early construction in the six central districts, its proximity to the city center, and increased visitors. In addition, some facilities have been utilized for an extended period and have not been repaired promptly; therefore, the parks should focus on mitigating the adverse effects of crowd congestion. Most of the factors of parks in the districts of the inner suburbs were in the first and second quadrants, indicating that the parks reported relatively high sensory perception scores. Meanwhile, the satisfaction with “sound of broadcast” was the highest, representing visitors’ recognition of the park’s broadcast and explanation services. In addition, satisfaction with “the sound of water” and “feel of water” was relatively low. It may be attributable to this region’s abundance of water resources and park landscape, which led to people having higher expectations. The sensory perception factors of parks in the districts of the outer suburbs were concentrated in the third and fourth quadrants. As a result, the sensory perception of these parks was unsatisfactory. In contrast, the satisfaction of olfactory factors was relatively high, indicating that the parks in this region possessed more significant advantages regarding the smell of plants, air quality, and water quality. Among the sensory perception factors, the visual factor was the most important, and satisfaction was relatively high. In contrast, the importance and satisfaction of the tactile factor were relatively low. Therefore, park administrators should prioritize enhancing tactile perception.

4.4.3. One-Way Analysis of Variance and Multiple Comparison Analysis

A one-way variance analysis determined that among the 17 landscape design indicators, there were significant differences in the recreational activities and food and beverage facilities satisfaction of parks in different districts. Consequently, based on the results of the IPA analysis, several factors were chosen for additional multiple comparison analysis (Table 7).
Regarding recreational activities (B3), the satisfaction of parks in districts of the outer suburbs was significantly lower than that of parks in the six central districts. The difference between the satisfaction of parks in the districts of the inner suburbs and six central districts of the city was insignificant. It may be attributable to the late construction of parks in the districts of the outer suburbs, the low distribution density of parks, and the lack of convenient transportation, all of which impacted the evaluation of park satisfaction. Regarding food and beverage facilities (C4), the satisfaction gap between parks in the districts of the outer suburbs and those in the six central districts and districts of the outer suburbs was more pronounced. It indicates that the management of parks in the outer suburbs was imperfect and that the facilities and services were not fully standardized. In general, the improvement of landscape design factors of parks in different districts was relatively symmetrical. The parks in the districts of the outer suburbs lacked recreational activities (B3) and food and beverage facilities (C4), compared to the parks in the six central districts. Consequently, we should concentrate on enhancing the overall landscape construction and service management of the parks in the districts of the outer suburbs.
The one-way analysis of variance determined that among the 20 sensory perception indicators, the satisfaction of parks in different districts differed significantly, most notably in the perception of plants, the perception of voices, and the perception of roads. Consequently, based on the results of the IPA analysis, several factors were chosen for additional multiple comparison analysis (Table 8).
Regarding plant vision (E2), relatively low satisfaction with parks in the outer suburbs was reported. It may be because numerous ecological and natural parks in the outer suburbs, which had a large area, were constructed late in the year and had a high maintenance cost regarding the plant landscapes, while some had not yet even formed any plant landscapes. Regarding sound of voice (F1) and feel of roads (H3), parks in the six central districts had the highest satisfaction score, while parks in the districts of the inner suburbs had the lowest satisfaction score. It was due to the long road journey in the outer suburbs, the absence of a convenient road system, and the lack of smooth road surface repair.
Similar to the analysis of landscape design factors, the satisfaction with parks in different districts regarding sensory perception factors was the highest in the six central districts and lowest in the districts of the outer suburbs. Therefore, we should prioritize enhancing the level of park construction in the districts of the outer suburbs. People tend to pay more attention to the ecological quality of nature parks in the districts of the outer suburbs, where the area required for activities is more extensive than parks in the districts of the inner suburbs. Critical factors in the design and construction of nature parks include adequate size and area and adequate and timely management and upkeep.

5. Discussion

The space was based on multiple social media text data collections from 85 typical Beijing riverside parks. First, differences in the park star rating and visitor sentiment of different river systems, types, and districts were analyzed. Second, IPA was used to analyze the primary factors that influenced the satisfaction of landscape design and sensory perception of different river systems, types, and districts. Finally, analysis of variance was used to investigate the differences and causes of the satisfaction of certain factors among various parks.
Liu [53] et al. proposed that infrastructure construction and ecological quality of public space were important influencing factors after studying the factors that affect the recreation satisfaction of riverside public space in Shanghai, and our conclusion is basically consistent with their conclusion. Following the perspective of parks adjacent to different river systems, the study determined that the parks adjacent to the North Canal River System were closer to the city center, constructed earlier, had more comprehensive service facilities, and were more familiar to visitors. Their overall satisfaction was the highest, while the low satisfaction of a few parks was usually due to the imperfect facilities in the parks. For example, there was no parking space, seats, toilets or other basic service facilities in these parks, which made it difficult for visitors to drive there and stay and rest in the park for a long time. Therefore, the level of traffic inside the park could be further optimized, the necessary service facilities could be increased, and the park function system could be improved to reduce the negative impact of heavy traffic on park satisfaction. On the other hand, the parks adjacent to the Yongding River System were close to industrial areas and negatively impacted the natural environment. Therefore, ecological restoration should be bolstered to enhance the quality of aquatic landscapes. At the same time, some large-scale parks, such as Beijing West Eighteen Lakes Scenic Area and Pearl Lake Scenic area, did not keep up with the maintenance and management of the natural landscape and park-supporting service facilities, resulting in low satisfaction with the park. Therefore, more attention should be paid to the areas that must be maintained and restored in the park and one must also protect and improve the key and characteristic landscape of the park, and realize the multi-faceted renewal and construction of the park. Most of the satisfaction factors of the parks around the Chaobai River system were good. There was a need to improve “visual identification”, “vision of water”, “feel of sunlight”, and “services provided”. Taking Hanshiqiao Wetland Park as an example, the satisfaction of “water view” was not high mainly because the water system in the park was not strongly connected with the water system outside the park, the water quality was poor, many wetland landscapes were blocked by fences, the management service system in the park was also not comprehensive, and the road system in the park was not complete. To enhance the level of service management, we should focus on the construction of distinctive landscapes and the improvement of the facility systems in the parks, and strengthen the relationship between the internal and external environment of the park. For the parks adjacent to the Daqing River System and the Jiyun River System, the overall satisfaction was relatively average and it is necessary to improve the “river landscape”, “natural ecological environment”, “consumer spending”, “transportation accessibility”, “smell of air and water”, “plant and animal landscape”, and “services provided”. Various park management service facilities must be optimized, the types of park activities must be expanded, the ecological landscape of the parks must be enhanced, the modes of travel to each park must be expanded, and systematic facility maintenance and ecological restoration must be performed regularly.
Concerning parks of various types, individuals have varying service requirements. This finding supports previous studies conducted by other scholars in other cities. Wang [29] et al. proposed that different types of parks required different optimization directions. Comprehensive parks should prioritize improving transportation accessibility, overall activity area, park functions, and infrastructure to meet the diverse needs of visitors of varying ages. Through popular science awareness activities, historical parks should focus on displaying and expressing history and culture to their fullest extent. Special parks must be managed and maintained with greater care. The guide sign system and types of community activities, closely related to the convenience and comfort of community life, should be enhanced in community parks. Gardens should expand the distribution area and increase the distribution location’s flexibility. Ecological parks should optimize the ecological experience and strengthen the educational function of ecological science. Based on preserving ecology, natural parks should improve various service facilities and increase special attractions to increase their appeal to visitors.
This study also came to a conclusion that previous studies have never mentioned. The parks in the six central districts could be improved in terms of “humanities activities”, “vision of humans”, and “feel of roads”, when compared to parks in other districts. To reduce the adverse effects of crowd congestion, the variety of humanities-related activities should be expanded, and visitors to the park should be better organized. In addition, some damaged structures should be repaired promptly. For parks in the districts of the inner suburbs, the “sound of water” and “feel of water” provided relatively low satisfaction levels. Therefore, the quality of the landscape should be further enhanced. The overall satisfaction of the parks in the districts of the outer suburbs was relatively high; however, there was room for improvement and the following actions should be taken: (1) one must optimize the internal traffic flow of the parks, improve the traffic conditions of the main entrances and exits, and enhance the guidance for self-driving visitors; (2) increase the construction of the parks’ distinctive landscape, enhance the level of park management services, reduce park fees, save visitors time and money, and improve the parks’ actual accessibility; (3) for natural parks in the outer suburbs, the ecological quality should be enhanced, sufficient area and scale should be ensured, and maintenance should be performed promptly.
In addition, few previous studies have compared the number of reviews in different seasons. Through analysis, this study found that fewer tourists chose to visit riverfront parks in winter. Therefore, as an important part of urban blue–green space, riverside parks can enhance the planting of winter ornamental plants and add winter park activities, such as snow watching and skating, on the basis of ecological priority, so as to enhance the attraction of winter landscapes and further improve the landscape benefits of the park.
In general, the renewal and upgrading of urban parks plays an important role in the renewal and optimization of urban living environments. Managers must implement appropriate strategies to strengthen ecological environment protection, increase the construction of distinctive landscapes, and reduce the cost of tourism to enhance the recreation experiences and happiness of visitors. Simultaneously, the park promotion must coordinate with other urban planning projects to ensure the urban landscape ecosystem’s stable operation and realize the city’s ecological value and sustainable development. It is the primary direction for improving and optimizing waterfront green space in the urban blue–green space.

6. Conclusions

This study analyzed social media text data for 85 typical riverside parks in blue–green spaces in Beijing, a city with abundant river systems. As an innovative study, this work broke through previous urban blue–green space research limitations. The optimization analysis of waterfront green space in blue–green spaces was discussed from the users’ perspective. Concurrently, Internet technology was used to obtain a vast quantity of the most recent information and data. An in-depth comparison was conducted based on the park’s landscape design and the sensory perception of park visitors for the online evaluations of parks adjacent to different river systems, parks of different types, and parks in different districts. It was found that the evaluation of waterfront parks was closely related to the nature of land use, the surrounding environment and the visiting time of tourists. Enhancing their ecological function, improving park infrastructure and management services are the main issues facing managers at present.
However, the types of people who utilize social platforms are predominantly elderly, childless, and single. Consequently, there were still some flaws in the research findings. In addition, many other studies were aware of this problem [29,55,69]. In the future, it may be necessary to conduct offline questionnaires that are explicitly designed for the elderly and children to remedy research deficiencies using traditional and modern techniques. We hope that future research can improve the evaluation method of the park system further, propose more scientific and reasonable strategies for the improvement of the functions of waterfront parks, and provide more sustainable suggestions for the optimization of urban blue–green space, which will play a significant role in the maintenance of China’s urban ecosystem.

Supplementary Materials

The following supporting information can be downloaded at: ‘https://www.mdpi.com/article/10.3390/land11101849/s1, Table S1: List of 85 riverside parks in blue-green space; Table S2: IPA list of riverside parks beside different river systems based on landscape design; Table S3: IPA list of riverside parks beside different river systems based on sensory perception; Table S4: Multiple comparison analysis of landscape design indicators of riverside parks beside different river systems; Table S5: Multiple comparison analysis of sensory perception indicators of riverside parks beside different river systems; Table S6: IPA list of riverside parks in different types based on landscape design; Table S7: IPA list of riverside parks in different types based on sensory perception; Table S8: Multiple comparison analysis of landscape design indicators of riverside parks in different types; Table S9: Multiple comparison analysis of sensory perception indicators of riverside parks in different types; Table S10: IPA list of riverside parks in different districts based on landscape design; Table S11: IPA list of riverside parks in different districts based on sensory perception; Table S12: Multiple comparison analysis of landscape design indicators of riverside parks in different districts; Table S13: Multiple comparison analysis of sensory perception indicators of riverside parks in different districts.

Author Contributions

Data curation and formal analysis, S.C.; methodology and project administration, S.C.; software, Z.Z., W.S., Y.W. and R.Y.; writing—original draft preparation, S.C. and Z.Z.; writing—review and editing, X.G.; funding acquisition, X.G. All authors have read and agreed to the published version of the manuscript.

Funding

This research was funded by the projects of the Beijing Municipal Social Science Foundation of China (grant number: 21JCC094), National Natural Science Foundation of China (grant number: 31800606), and Beijing Scientific Research and Postgraduate Education Jointly Construction (grant number: 2015BLUREE01).

Institutional Review Board Statement

Not applicable.

Informed Consent Statement

Not applicable.

Data Availability Statement

All data generated or analyzed during this study are included in this article.

Conflicts of Interest

The authors declare no conflict of interest.

References

  1. Notice of the Ministry of Natural Resources on Comprehensively Carrying out Territorial Space Planning Work. Available online: http://www.gov.cn/xinwen/2019-06/02/content_5396857.htm (accessed on 2 June 2019).
  2. Zhang, L. Demarcation and Management of Urban Growth Boundary in Combination with Ecological Security Patterns. Ph.D. Thesis, Zhejiang University, Hangzhou, China, 2018. [Google Scholar]
  3. Bolund, P.; Hunhammar, S. Ecosystem Services in Urban Areas. Ecol. Econ. 1999, 29, 293–301. [Google Scholar] [CrossRef]
  4. Li, T. New Progress in Study on Resilient Cities. Urban Plan. Int. 2017, 32, 15–25. [Google Scholar] [CrossRef]
  5. Yu, K.; Li, D.; Yuan, H.; Fu, W.; Qiao, Q.; Wang, S. “Sponge City”: Theory and Practice. City Plan. Rev. 2015, 39, 26–36. [Google Scholar]
  6. Di, W.; Wang, Y.; Chen, F.; Xia, B. Thermal environment effects and interactions of reservoirs and forests as urban blue-green infrastructures. Ecol. Indic. 2018, 91, 657–663. [Google Scholar] [CrossRef]
  7. Ahmed, S.; Meenar, M.; Alam, A. Designing a Blue-Green Infrastructure (BGI) Network: Toward Water-Sensitive Urban Growth Planning in Dhaka, Bangladesh. Land 2019, 8, 138. [Google Scholar] [CrossRef] [Green Version]
  8. Yuan, Z.; Shi, T.; Hu, Y.; Gao, C.; Miao, L.; Fu, S.; Wang, S. Urban green space planning based on computational fluid dynamics model and landscape ecology principle: A case study of Liaoyang City, Northeast China. Chin. Geogr. Sci. 2011, 21, 11. [Google Scholar] [CrossRef]
  9. Pouso, S.; Borja, A.; Fleming, L.E.; Gómez-Baggethun, E.; Uyarra, M.C. Contact with blue-green spaces during the COVID-19 pandemic lockdown beneficial for mental health. Sci. Total Environ. 2021, 756, 143984. [Google Scholar] [CrossRef]
  10. Yu, Z.; Yang, G.; Zuo, S.; Jrgensen, G.; Vejre, H. Critical review on the cooling effect of urban blue-green space: A threshold-size perspective. Urban For. Urban Green. 2020, 49, 126630. [Google Scholar] [CrossRef]
  11. Jin, Y.; Zhou, Y.; Shen, J. Research on LID Rainfall Unit Design Method for the Blue and Green Ecological Network System—Based on the Analysis of Mountain Hydrological Characteristics. Chin. Landsc. Archit. 2018, 34, 83–87. [Google Scholar]
  12. Vaeztavakoli, A.; Lak, A.; Yigitcanlar, T. Blue and Green Spaces as Therapeutic Landscapes: Health Effects of Urban Water Canal Areas of Isfahan. Sustainability 2018, 10, 4010. [Google Scholar] [CrossRef] [Green Version]
  13. Five Major Water Systems and Major Rivers in Beijing. Available online: http://www.pekingmemory.cn/bdsy/2018/09/28/72.html (accessed on 28 September 2018).
  14. Chu, T. Exploration on Park City Design of Riverside Space Under Background of Inventory Land—Taking Urban Design of Riverside Space of Pihe Park in Chengdu as an Example. Urban Archit. Space 2022, 29, 9–15, 41. [Google Scholar]
  15. Donahue, M.L.; Keeler, B.L.; Wood, S.A.; Fisher, D.M.; Hamstead, Z.A.; Mcphearson, T. Using social media to understand drivers of urban park visitation in the Twin Cities, MN. Landsc. Urban Plan. 2018, 175, 1–10. [Google Scholar] [CrossRef]
  16. Yu, B.; Xie, C.; Yang, S.; Che, S. Correspondence Analysis on Residents’ Perceived Recreation Satisfaction and Importance in Shanghai Urban Community Park. Chin. Landsc. Archit. 2014, 30, 75–78. [Google Scholar]
  17. Xiao, X.; Du, K. A Study On Recreationists’ Satisfaction of Guangzhou City Parks. Hum. Geogr. 2011, 26, 129–133. [Google Scholar] [CrossRef]
  18. Li, C.; Xu, C.; Zhang, Z.; Gong, L.; Li, B.; Jin, G.; Chen, S. Residents’ Satisfaction on Country Parks in Beijing. J. Beijing For. Univ. (Soc. Sci.) 2010, 9, 68–72. [Google Scholar] [CrossRef]
  19. Zhao, Y.; Qin, B.; Liu, T. Sentiment Analysis. J. Softw. 2010, 21, 1834–1848. [Google Scholar] [CrossRef]
  20. Do, Y. Valuating aesthetic benefits of cultural ecosystem services using conservation culturomics. Ecosyst. Serv. 2019, 36, 100894. [Google Scholar] [CrossRef]
  21. Wang, Z.; Fu, H.; Jian, Y.; Salman, Q.; Jie, H.; Wang, L. On the comparative use of social media data and survey data in prioritizing ecosystem services for cost-effective governance. Ecosyst. Serv. 2022, 56, 101446. [Google Scholar] [CrossRef]
  22. Kim, K.-J. Welfare Activation Strategy for a Urban Park Users. J. Korea Contents Assoc. 2012, 12, 195–204. [Google Scholar] [CrossRef] [Green Version]
  23. Wang, Z.; Jie, H.; Fu, H.; Wang, L.; Jiang, H.; Ding, L.; Chen, Y. A social-media-based improvement index for urban renewal. Ecol. Indic. 2022, 137, 108775. [Google Scholar] [CrossRef]
  24. Tieskens, K.F.; Zanten, B.; Schulp, C.; Verburg, P.H. Aesthetic appreciation of the cultural landscape through social media: An analysis of revealed preference in the Dutch river landscape. Landsc. Urban Plan. 2018, 117, 128–137. [Google Scholar] [CrossRef]
  25. Sinclair, M.; Ghermandi, A.; Sheela, A.M. A crowdsourced valuation of recreational ecosystem services using social media data: An application to a tropical wetland in India. Sci. Total Environ. 2018, 642, 356–365. [Google Scholar] [CrossRef] [PubMed]
  26. Fisher, D.M.; Wood, S.A.; White, E.M.; Blahna, D.J.; Lange, S.; Weinberg, A.; Tomco, M.; Lia, E. Recreational use in dispersed public lands measured using social media data and on-site counts. J. Environ. Manag. 2018, 222, 465. [Google Scholar] [CrossRef] [PubMed]
  27. Zhang, G.; Li, J.; Zhang, L. A Research on Tourism Destination Image Perception of Huashan Scenic Spot: Based on Text Analysis of Weblogs. Tour. Sci. 2011, 25, 87–94. [Google Scholar] [CrossRef]
  28. Jiang, X.; Wu, D.; Wang, X. Investigation about After-use Evaluation of Garden Exhibition Based on Online Comments Data. Landsc. Archit. 2018, 25, 74–80. [Google Scholar] [CrossRef]
  29. Wang, Z.; Zhao, J.; Peng, Y.; Yue, W. Comparative Evaluation of Guangzhou City Parks: Text Analysis Based on Social Media Data. Landsc. Archit. 2019, 26, 89–94. [Google Scholar] [CrossRef]
  30. Li, L. Identification Research of Tangible and Intangible Attribute Value of Urban Heritage Based on Deep Learning: A Case Study of Suzhou River. Urban Dev. Stud. 2021, 28, 104–110. [Google Scholar]
  31. Dwivedi, M. Online destination image of India: A consumer based perspective. Int. J. Contemp. Hosp. Manag. 2009, 21, 226–232. [Google Scholar] [CrossRef]
  32. Govers, R.; Go, F.M. Projected destination image online: Website content analysis of pictures and text. Inf. Technol. Tour. 2004, 7, 73–89. [Google Scholar] [CrossRef]
  33. Zhao, J.; Liu, X.; Dong, R.; Shao, G. Landsenses ecology and ecological planning toward sustainable development. Int. J. Sustain. Dev. World Ecol. 2016, 23, 293–297. [Google Scholar] [CrossRef] [Green Version]
  34. Dong, R.; Liu, X.; Liu, M.; Feng, Q.; Su, X.; Wu, G. Landsenses ecological planning for the Xianghe Segment of China’s Grand Canal. Int. J. Sustain. Dev. World Ecol. 2016, 23, 298–304. [Google Scholar] [CrossRef]
  35. Gao, Y.; Yuan, J.; Yan, M. Study on the influencing factors of the vitality of public space in Wulihe Park in Shenyang. In Proceedings of the 2020/2021 China Urban Planning Annual Conference and 2021 China Urban Planning Academic Season, Chengdu, China, 25–30 September 2021; pp. 1192–1198. [Google Scholar]
  36. Zhao, J.; Yan, Y.; Deng, H.; Liu, G.; Shao, G. Remarks about landsenses ecology and ecosystem services. Int. J. Sustain. Dev. World Ecol. 2020, 27, 196–201. [Google Scholar] [CrossRef] [Green Version]
  37. Wu, Y.; Fu, H. Trait of Urban Water System Property and its Tourism Utility and Preservation in Beijing. J. Cap. Norm. Univ. (Nat. Sci. Ed.) 2004, 02, 66–70, 84. [Google Scholar] [CrossRef]
  38. Zhang, F. The new born in the old: Urban renewal in Beijing. Beijing Plan. Rev. 2022, 04, 164. [Google Scholar]
  39. Zhang, K. The relationship between river and open space in Europe, Cities: Case studies of London and Emshere District Park. City Plan. Rev. 2013, 37, 76–80. [Google Scholar]
  40. Jo, T.; Sato, M.; Minamoto, T.; Ushimaru, A. Valuing the cultural services from urban blue-space ecosystems in Japanese megacities during the COVID-19 pandemic. People Nat. 2022, 4, 1176–1189. [Google Scholar] [CrossRef]
  41. Knight, S.J.; McClean, C.J.; White, P.C.L. The importance of ecological quality of public green and blue spaces for subjective well-being. Landsc. Urban Plan. 2022, 226, 104510. [Google Scholar] [CrossRef]
  42. Mishra, H.S.; Bell, S.; Vassiljev, P.; Kuhlmann, F.; Niin, G.; Grellier, J. The development of a tool for assessing the environmental qualities of urban blue spaces. Urban For. Urban Green. 2020, 49, 126575. [Google Scholar] [CrossRef]
  43. Subiza-Pérez, M.; Hauru, K.; Korpela, K.; Haapala, A.; Lehvävirta, S. Perceived Environmental Aesthetic Qualities Scale (PEAQS)—A self-report tool for the evaluation of green-blue spaces. Urban For. Urban Green. 2019, 43, 126383. [Google Scholar] [CrossRef]
  44. Gong, M.; Ren, M.Y.; Dai, Q.; Luo, X.Y. Aging-Suitability of Urban Waterfront Open Spaces in Gongchen Bridge Section of the Grand Canal. Sustainability 2019, 11, 6095. [Google Scholar] [CrossRef] [Green Version]
  45. Martilla, J.A.; James, J.C. Importance-Performance Analysis. J. Mark. 1977, 41, 77–79. [Google Scholar] [CrossRef]
  46. Liang, H.; Wang, Y.; Liu, M. Tourists’ Perception of Local Food Experience in Tourist Destination by IPA Analysis: A Case Study in Enshi, Hubei. J. Agro-For. Econ. Manag. 2016, 15, 335–342. [Google Scholar] [CrossRef]
  47. Chen, X. The Modified Importance-performance Analysis Method and its Application in Tourist Satisfaction Research. Tour. Trib. 2013, 28, 59–66. [Google Scholar]
  48. Chen, P.; Liu, W. Assessing management performance of the national forest park using impact range-performance analysis and impact-asymmetry analysis. For. Policy Econ. 2019, 104, 121–138. [Google Scholar] [CrossRef]
  49. Go, F.; Zhang, W.J. Applying Importance-Performance Analysis to Beijing as an International Meeting Destination. J. Travel Res. 1997, 35, 42–49. [Google Scholar] [CrossRef]
  50. Evans, M.R.; Chon, K.S. Formulating and Evaluating Tou Rism Policy Using Importance-Performance Analysis. J. Hosp. Tour. Res. 1989, 13, 203–213. [Google Scholar] [CrossRef]
  51. Gu, X. Research for Vistors’ Structure, Behavior, Demand Characteristics and Influencing Factors in Shanghai Parks. Master’s Thesis, East China Normal University, Shanghai, China, 2013. [Google Scholar]
  52. Fan, Y.; Mao, D.; Zhou, C.; Ye, J.; Chen, L.; Zheng, Y. Recreational Resources Evaluation of Fuzhou West Lake Park Based on Internet Text Analysis. J. Chin. Urban For. 2019, 17, 41–46. [Google Scholar]
  53. Liu, Q.; Pan, Y.; Zhang, Z.; Wang, X. Recreational Satisfaction of Typical Riverfront Public Spaces in Shanghai Based on IPA Analysis. J. Chin. Urban For. 2021, 19, 29–34. [Google Scholar]
  54. Lin, P.; Chen, L.L.; Luo, Z.S. Analysis of Tourism Experience in Haizhu National Wetland Park Based on Web Text. Sustainability 2022, 14, 3011. [Google Scholar] [CrossRef]
  55. Zheng, T.; Yan, Y.; Zhang, W.; Zhu, J.; Wang, C.; Rong, Y.; Lu, H. Landsense assessment on urban parks using social media data. Acta Ecol. Sin. 2022, 42, 561–568. [Google Scholar]
  56. Dai, J.; Yuan, J. Comparison of one-way analysis of variance and multiple linear regression analysis. Stat. Decis. 2016, 09, 23–26. [Google Scholar] [CrossRef]
  57. Connors, J.P.; Galletti, C.S.; Chow, W.T.L. Landscape configuration and urban heat island effects: Assessing the relationship between landscape characteristics and land surface temperature in Phoenix, Arizona. Landsc. Ecol. 2012, 28, 271–283. [Google Scholar] [CrossRef]
  58. Gao, Y.; Zhang, T.; Zhang, W.K.; Meng, H.; Zhang, Z. Research on visual behavior characteristics and cognitive evaluation of different types of forest landscape spaces. Urban For. Urban Green. 2020, 54, 126788. [Google Scholar] [CrossRef]
  59. Wang, Y.; Liu, J.; Shao, L.; Tang, Y. Guiding Factors and Orientations for Improving Urban Waterfront Space: A Case Study of Haidian Section of Qinghe River in Beijing. World Archit. 2022, 24–33. [Google Scholar] [CrossRef]
  60. Li, F.; Li, K.; Li, X. Research on Scenario Planning of Beijing Second Green Belt Country Park Ring. Landsc. Archit. 2021, 28, 58–64. [Google Scholar] [CrossRef]
  61. Dianping Official Website. Available online: https://www.dianping.com/ (accessed on 2 February 2022).
  62. Ctrip Official Website. Available online: https://www.ctrip.com/ (accessed on 2 February 2022).
  63. Mafengwo Official Website. Available online: https://www.mafengwo.cn/ (accessed on 2 February 2022).
  64. Notice of Beijing Municipal Bureau of Landscape and Afforestation on the Issuance of the Measures for the Classification and Classification of Parks in Beijing. Available online: http://yllhj.beijing.gov.cn/zwgk/fgwj/gfxwj/202206/t20220621_2747422.shtml (accessed on 2 February 2022).
  65. Liu, Q.; Jia, H. A View of Chinese Word Automatic Segmentation Research in the Chinese Information Disposal. Comput. Eng. Appl. 2006, 175–177, 182. [Google Scholar]
  66. Wang, M.; Qiu, M.; Wang, J.; Peng, Y. The Supply-demand Relation Analysis and Improvements Based on Importance-Performance Analysis of Cultural Ecosystem Services in Waterfront Areas Along the Suzhou Creek in Shanghai. Landsc. Archit. 2019, 26, 107–112. [Google Scholar] [CrossRef]
  67. Zheng, T.; Yan, Y.X.; Lu, H.; Pan, Q.; Zhu, J.; Wang, C.; Zhang, W.; Rong, Y.; Zhan, Y. Visitors’ perception based on five physical senses on ecosystem services of urban parks from the perspective of landsenses ecology. Int. J. Sustain. Dev. World Ecol. 2020, 27, 214–223. [Google Scholar] [CrossRef]
  68. Xu, B.; Shi, Q.; Zhang, Y. Evaluation of the Health Promotion Capabilities of Greenway Trails: A Case Study in Hangzhou, China. Land 2022, 11, 547. [Google Scholar] [CrossRef]
  69. Hausmann, A.; Toivonen, T.; Fink, C.; Heikinheimo, V.; Kulkarni, R.; Tenkanen, H.; Di Minin, E. Understanding sentiment of national park visitors from social media data. People Nat. 2020, 2, 750–760. [Google Scholar] [CrossRef]
Figure 1. The distribution of riverside parks in 85 blue–green spaces.
Land 11 01849 g001
Figure 2. Evaluation framework for the study of landscape satisfaction of typical blue–green spaces in Beijing.
Land 11 01849 g002
Figure 3. IPA evaluation model diagram with four areas.
Land 11 01849 g003
Figure 4. Comparative analysis of the changes in the number of reviews in different seasons.
Land 11 01849 g004
Figure 5. The average stars of riverside parks beside different river systems.
Land 11 01849 g005
Figure 6. IPA model of riverside parks beside different river systems based on spatial landscape design.
Land 11 01849 g006
Figure 7. IPA model of riverside parks beside different river systems based on visitors’ sensory perception.
Land 11 01849 g007
Figure 8. The average stars of riverside parks of different types.
Land 11 01849 g008
Figure 9. IPA model of riverside parks of different types based on spatial landscape design.
Land 11 01849 g009
Figure 10. IPA model of riverside parks of different types based on visitors’ sensory perception.
Land 11 01849 g010
Figure 11. The average stars of riverside parks in different districts.
Land 11 01849 g011
Figure 12. IPA model of riverside parks in different districts based on spatial landscape design.
Land 11 01849 g012
Figure 13. IPA model of riverside parks in different districts based on sensory perception.
Land 11 01849 g013
Table 1. Evaluation index system of landscape design.
Evaluation TermIndicatorsIndicator Definition
Landscape (A)Natural ecological environment (A1)Environmental quality, beautiful scenery, etc.
Plant landscape (A2)Trees, leaves, flowers, etc.
Animal landscape (A3)Ducks, birds, fish, squirrels, frogs, etc.
River landscape (A4)Water, rivers, lakes, ponds, etc.
Historical and cultural landscape (A5)Culture, history, royal, red walls, ancient pavilions, the Hall of Abstinence, circular mounds, ancient trees, etc.
Activity (B)Humanities activities (B1)Exhibition halls, temple fairs, sacrifices, gardening, etc.
Country activities (B2)Boating, camping, mountain climbing, picnics, tents, etc.
Recreational activities (B3)Dancing, walking, taking pictures, resting, etc.
Fitness activities (B4)Exercise, sports, running, cycling, gym, etc.
Infrastructure (C)Transportation accessibility (C1)Highway, subway, bus, driving, walking, distance, location, etc.
Public service facilities (C2)Parking lots, restrooms, toilets, trash cans, etc.
Navigation signage system (C3)Navigation, maps, explanations, etc.
Food and beverage facilities (C4)Catering, restaurants, kiosks, ice cream, commodities, etc.
Management (D)Consumer spending (D1)Ticket price, free, charge, consumption, etc.
Services provided (D2)Management, attitude, reservations, complaints, quality, maintenance, queuing, etc.
Planning layout (D3)Planning, routes, areas, buildings, spaces, etc.
Science education (D4)Popular science, exhibitions, learning, knowledge, etc.
Table 2. Evaluation index system of sensory perception.
Senses TermIndicatorsIndicator Definition
Vision (E)Visual identification (E1)Vision of special sights
Vision of plants (E2)Vision of trees, grass, flowers, etc.
Vision of water (E3)Vision of water
Vision of animals (E4)Vision of wild ducks, squirrels, birds, etc.
Vision of humans (E5)Moderate number of people and no interference
Vision of roads (E6)Vision of the line shape, color, etc. of the road
Hearing (F)Sound of voice (F1)Moderate voice
Sound of broadcast (F2)Sound of broadcast
Sound of animals (F3)Sound of birds, insects, etc.
Sound of water (F4)Sound of water flow
Smell (G)Smell of air and water (G1)Fresh air and good water quality
Smell of plants (G2)Smell of plants
Touch (H)Feel of sunlight (H1)Feel of the balance of light and shadow
Feel of wind (H2)Feel of wind
Feel of roads (H3)Comfortable roads
Feel of water (H4)Hydrophilic experience
Contact with animals (H5)No mosquito bites
Taste (L)Food available (L1)Food available
Table 3. Multiple comparison analysis of landscape design indicators of riverside parks beside different river systems (only some important data are displayed here; all data can be found in the Supplementary File in the Supplementary Materials).
IJA5B3C2C4D2
Mean Dif.
(I−J)
Sig.Mean Dif.
(I−J)
Sig.Mean Dif.
(I−J)
Sig.Mean Dif.
(I−J)
Sig.Mean Dif.
(I−J)
Sig.
ab0.1405 *0.02100.1116 *0.0090 0.1172 *0.0190 0.0695 0.3830 0.1278 *0.0060
e0.3114 *0.00900.2318 *0.0050 0.0990 0.2990 0.3734 *0.0170 0.1862 *0.0360
b a−0.1405 *0.0210−0.1116 *0.0090 −0.1172 *0.0190 −0.0695 0.3830 −0.1278 *0.0060
c e0.2289 0.13200.1237 0.2410 −0.0279 0.8210 0.4162 *0.0400 0.0449 0.6920
* a (parks beside the North Canal River System); b (parks beside the Yongding River System); c (parks beside the Daqing River System); e (parks beside the Jiyun River System); Sig (short for significant difference, which is a statistical term for the evaluation of data differences in statistics).
Table 4. Multiple comparison analysis of sensory perception indicators of riverside parks beside different river systems (only some important data are displayed here; all data can be found in the Supplementary File in the Supplementary Materials).
IJE1E4E5G2H3
Mean Dif.
(I−J)
Sig.Mean Dif.
(I−J)
Sig.Mean Dif.
(I−J)
Sig.Mean Dif.
(I−J)
Sig.Mean Dif.
(I−J)
Sig.
ab0.1034 *0.0443 0.1219 *0.0058 0.1644 *0.0281 0.2204 *0.0106 0.2590 *0.0072
e0.3138 *0.0020 0.1164 0.1669 0.0197 0.8904 0.1601 0.3305 0.4131 *0.0262
ba−0.1034 *0.0443 −0.1219 *0.0058 −0.1644 *0.0281 −0.2204 *0.0106 −0.2590 *0.0072
e0.2104 *0.0471 −0.0054 0.9513 −0.1447 0.3427 −0.0603 0.7291 0.1540 0.4285
ce0.2563 *0.0473 −0.0137 0.8997 −0.0901 0.6272 0.2275 0.2858 0.4113 0.0852
* a (parks beside the North Canal River System); b (parks beside the Yongding River System); c (parks beside the Daqing River System); e (parks beside the Jiyun River System); Sig (short for significant difference, which is a statistical term for the evaluation of data differences in statistics).
Table 5. Multiple comparison analysis of landscape design indicators of riverside parks of different types (only some important data are displayed here; all data can be found in the Supplementary File in the Supplementary Materials).
IJA2A3A5D1D2
Mean Dif.
(I−J)
Sig.Mean Dif.
(I−J)
Sig.Mean Dif.
(I−J)
Sig.Mean Dif.
(I−J)
Sig.Mean Dif.
(I−J)
Sig.
fi0.1272 *0.0040 0.1598 *0.0000 0.2169 0.0550 0.0547 0.2600 0.0691 0.1820
j 0.1004 *0.0160 0.0993 *0.0160 0.1501 *0.0450 0.0204 0.6590 0.0295 0.5500
k0.0535 0.3930 0.0690 0.2710 0.3964 0.3560 0.2323 *0.0020 0.2312 *0.0030
gi0.1007 0.1740 0.1566 *0.0360 0.2259 *0.0280 0.0871 0.3000 0.1805 *0.0460
j 0.0739 0.3100 0.0961 0.1880 0.1591 *0.0080 0.0528 0.5230 0.1410 0.1120
k0.0271 0.7550 0.0658 0.4490 0.4053 0.3410 0.2647 *0.0090 0.3426 *0.0020
hi0.1514 *0.0050 0.1962 *0.0000 0.2724 *0.0070 0.0682 0.2520 0.1826 *0.0050
j 0.1246 *0.0160 0.1358 *0.0090 0.2056 *0.0020 0.0339 0.5560 0.1430 *0.0220
k0.0777 0.2650 0.1055 0.1310 0.4519 0.2360 0.2458 *0.0030 0.3447 *0.0000
if−0.1272 *0.0040 −0.1598 *0.0000 −0.2169 0.0550 −0.0547 0.2600 −0.0691 0.1820
g−0.1007 0.1740 −0.1566 *0.0360 −0.2259 *0.0280 −0.0871 0.3000 −0.1805 *0.0460
h−0.1514 *0.0050 −0.1962 *0.0000 −0.2724 *0.0070 −0.0682 0.2520 −0.1826 *0.0050
k−0.0737 0.2410 −0.0908 0.1490 0.1795 0.9880 0.1776 *0.0140 0.1621 *0.0350
jf−0.1004 *0.0160 −0.0993 *0.0160 −0.1501 *0.0450 −0.0204 0.6590 −0.0295 0.5500
g−0.0739 0.3100 −0.0961 0.1880 −0.1591 *0.0080 −0.0528 0.5230 −0.1410 0.1120
h−0.1246 *0.0160 −0.1358 *0.0090 −0.2056 *0.0020 −0.0339 0.5560 −0.1430 *0.0220
k−0.0469 0.4460 −0.0303 0.6210 0.2463 0.8630 0.2119 *0.0030 0.2016 *0.0080
* f (comprehensive parks); g (community parks); h (historical parks); i (specific parks); j (ecological parks); k (nature parks); Sig (short for significant difference, which is a statistical term for the evaluation of data differences in statistics).
Table 6. Multiple comparison analysis of sensory perception indicators of riverside parks of different types (only some important data are displayed here; all data can be found in the Supplementary File in the Supplementary Materials).
IJE1E3E4G1H1
Mean Dif.
(I−J)
Sig.Mean Dif.
(I−J)
Sig.Mean Dif.
(I−J)
Sig.Mean Dif.
(I−J)
Sig.Mean Dif.
(I−J)
Sig.
fi0.1285 0.3350 0.0605 0.1630 0.1680 *0.0010 0.1011 0.0640 0.0989 0.9210
j 0.1081 0.2250 0.0532 0.2000 0.1186 *0.0090 0.0770 0.1390 0.0655 0.9360
k0.2373 0.9690 0.2147 *0.0010 0.2731 *0.0000 0.2544 *0.0020 0.2204 0.8210
gi0.1283 0.4950 0.0888 0.2360 0.1514 0.0630 0.1023 0.2760 0.2132 *0.0450
j 0.1078 0.5110 0.0816 0.2700 0.1019 0.2020 0.0781 0.3980 0.1799 *0.0030
k0.2371 0.9700 0.2431 *0.0070 0.2564 *0.0080 0.2556 *0.0230 0.3348 0.3660
hi0.2030 *0.0220 0.1418 *0.0090 0.1829 *0.0020 0.1342 *0.0450 0.1548 0.3020
j 0.1825 *0.0070 0.1345 *0.0100 0.1335 *0.0180 0.1100 0.0900 0.1214 0.0800
k0.3118 0.8380 0.2960 *0.0000 0.2880 *0.0000 0.2875 *0.0020 0.2763 0.5820
if−0.1285 0.3350 −0.0605 0.1630 −0.1680 *0.0010 −0.1011 0.0640 −0.0989 0.9210
g−0.1283 0.4950 −0.0888 0.2360 −0.1514 0.0630 −0.1023 0.2760 −0.2132 *0.0450
h−0.2030 *0.0220 −0.1418 *0.0090 −0.1829 *0.0020 −0.1342 *0.0450 −0.1548 0.3020
k0.1088 1.0000 0.1542 *0.0170 0.1051 0.1280 0.1533 0.0570 0.1215 0.9990
jf−0.1081 0.2250 −0.0532 0.2000 −0.1186 *0.0090 −0.0770 0.1390 −0.0655 0.9360
g−0.1078 0.5110 −0.0816 0.2700 −0.1019 0.2020 −0.0781 0.3980 −0.1799 *0.0030
h−0.1825 *0.0070 −0.1345 *0.0100 −0.1335 *0.0180 −0.1100 0.0900 −0.1214 0.0800
k0.1293 1.0000 0.1615 *0.0110 0.1545 *0.0240 0.1774 *0.0250 0.1549 0.9820
* f (comprehensive parks); g (community parks); h (historical parks); i (specific parks); j (ecological parks); k (nature parks); Sig (short for significant difference, which is a statistical term for the evaluation of data differences in statistics).
Table 7. Multiple comparison analysis of landscape design indicators of riverside parks in different districts (only some important data are displayed here; all data can be found in the Supplementary File).
IJB3C4
Mean Dif. (I−J)Sig.Mean Dif. (I−J)Sig.
ln0.1577 *0.0450 0.2949 *0.0391
mn0.1387 0.0789 0.2818 *0.0497
* l (parks in six central districts); m (parks in districts of the inner suburbs); n (parks in districts of the outer suburbs); Sig (short for significant difference, which is a statistical term for the evaluation of data differences in statistics).
Table 8. Multiple comparison analysis of sensory perception indicators of riverside parks in different districts (only some important data are displayed here; all data can be found in the Supplementary File in the Supplementary Materials).
IJE2F1H3
Mean Dif. (I−J)Sig.Mean Dif. (I−J)Sig.Mean Dif. (I−J)Sig.
lm0.0477 0.4868 0.1028 *0.0423 0.0759 0.7428
n0.0717 *0.0215 0.1484 0.1622 0.3998 *0.0057
ml−0.0477 0.4868 −0.0103 *0.0423 −0.0759 0.7428
n0.0240 0.8764 0.0457 0.6672 0.3239 *0.0206
* l (parks in six central districts); m (parks in districts of the inner suburbs); n (parks in districts of the outer suburbs); Sig (short for significant difference, which is a statistical term for the evaluation of data differences in statistics).
Publisher’s Note: MDPI stays neutral with regard to jurisdictional claims in published maps and institutional affiliations.

