
Identification and Classification of Urban PLES Spatial Functions Based on Multisource Data and Machine Learning

Abstract
:1. Introduction
2. Materials and Methods
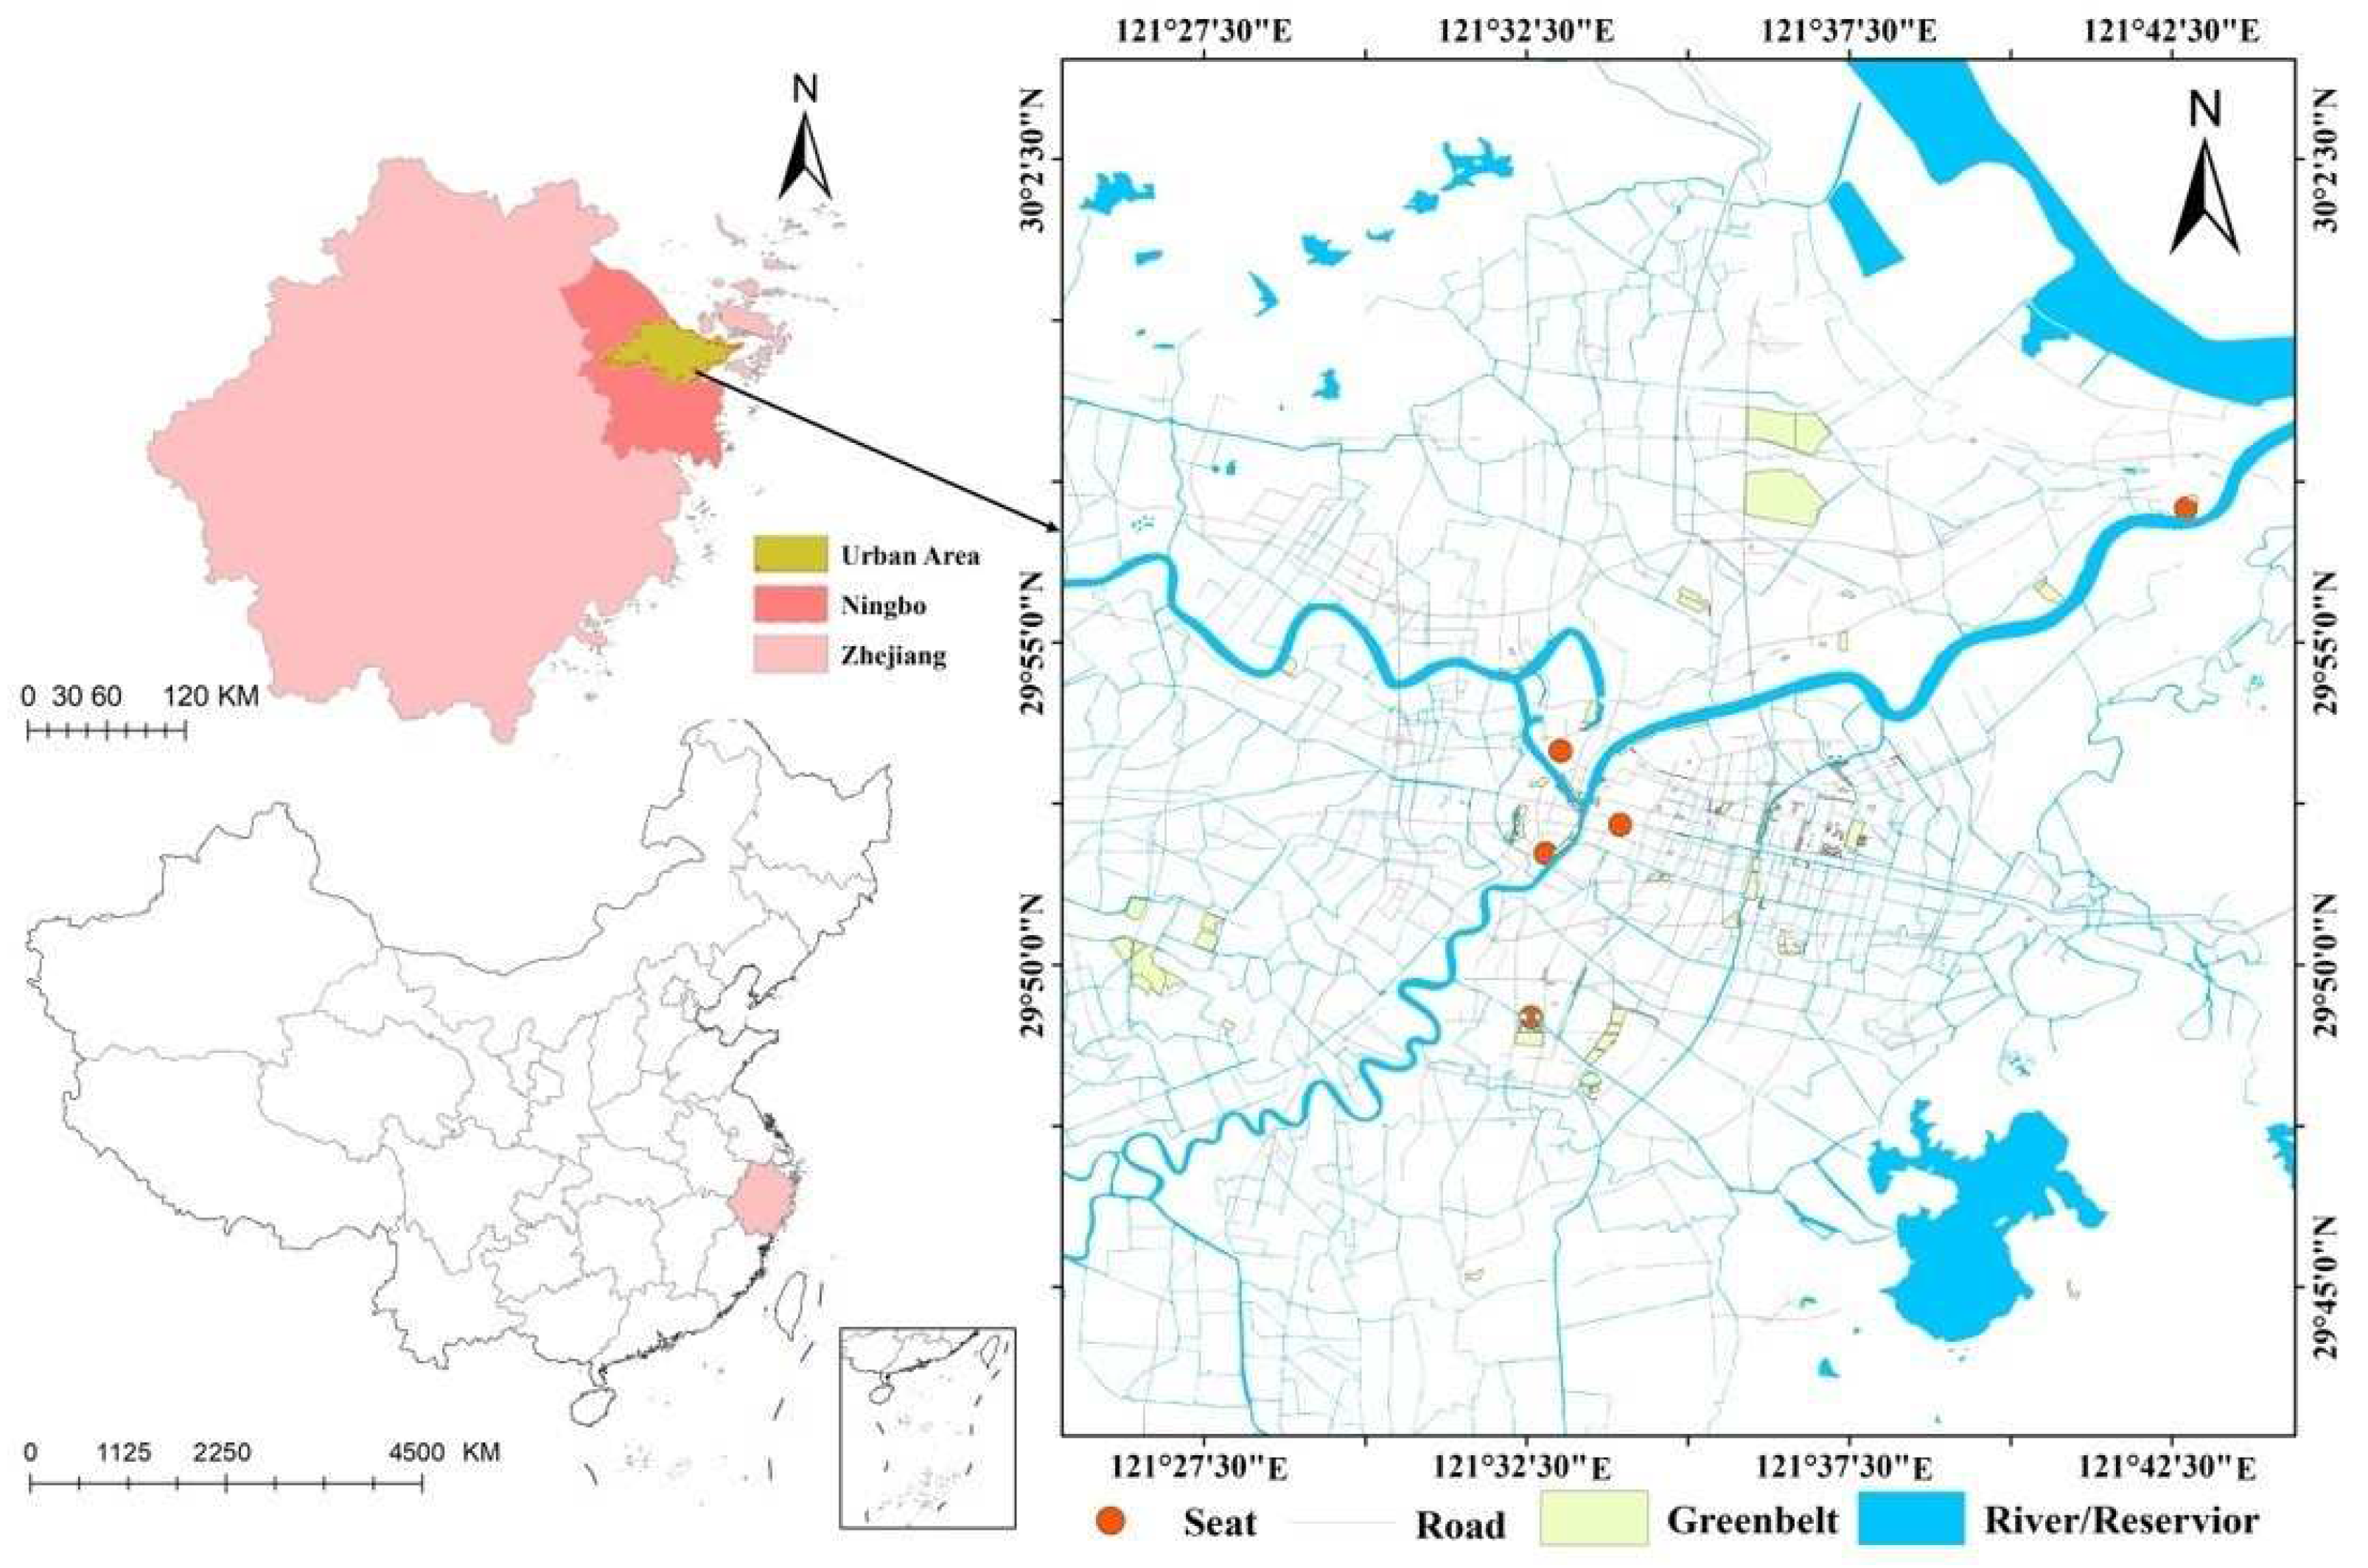
2.1. Study Area
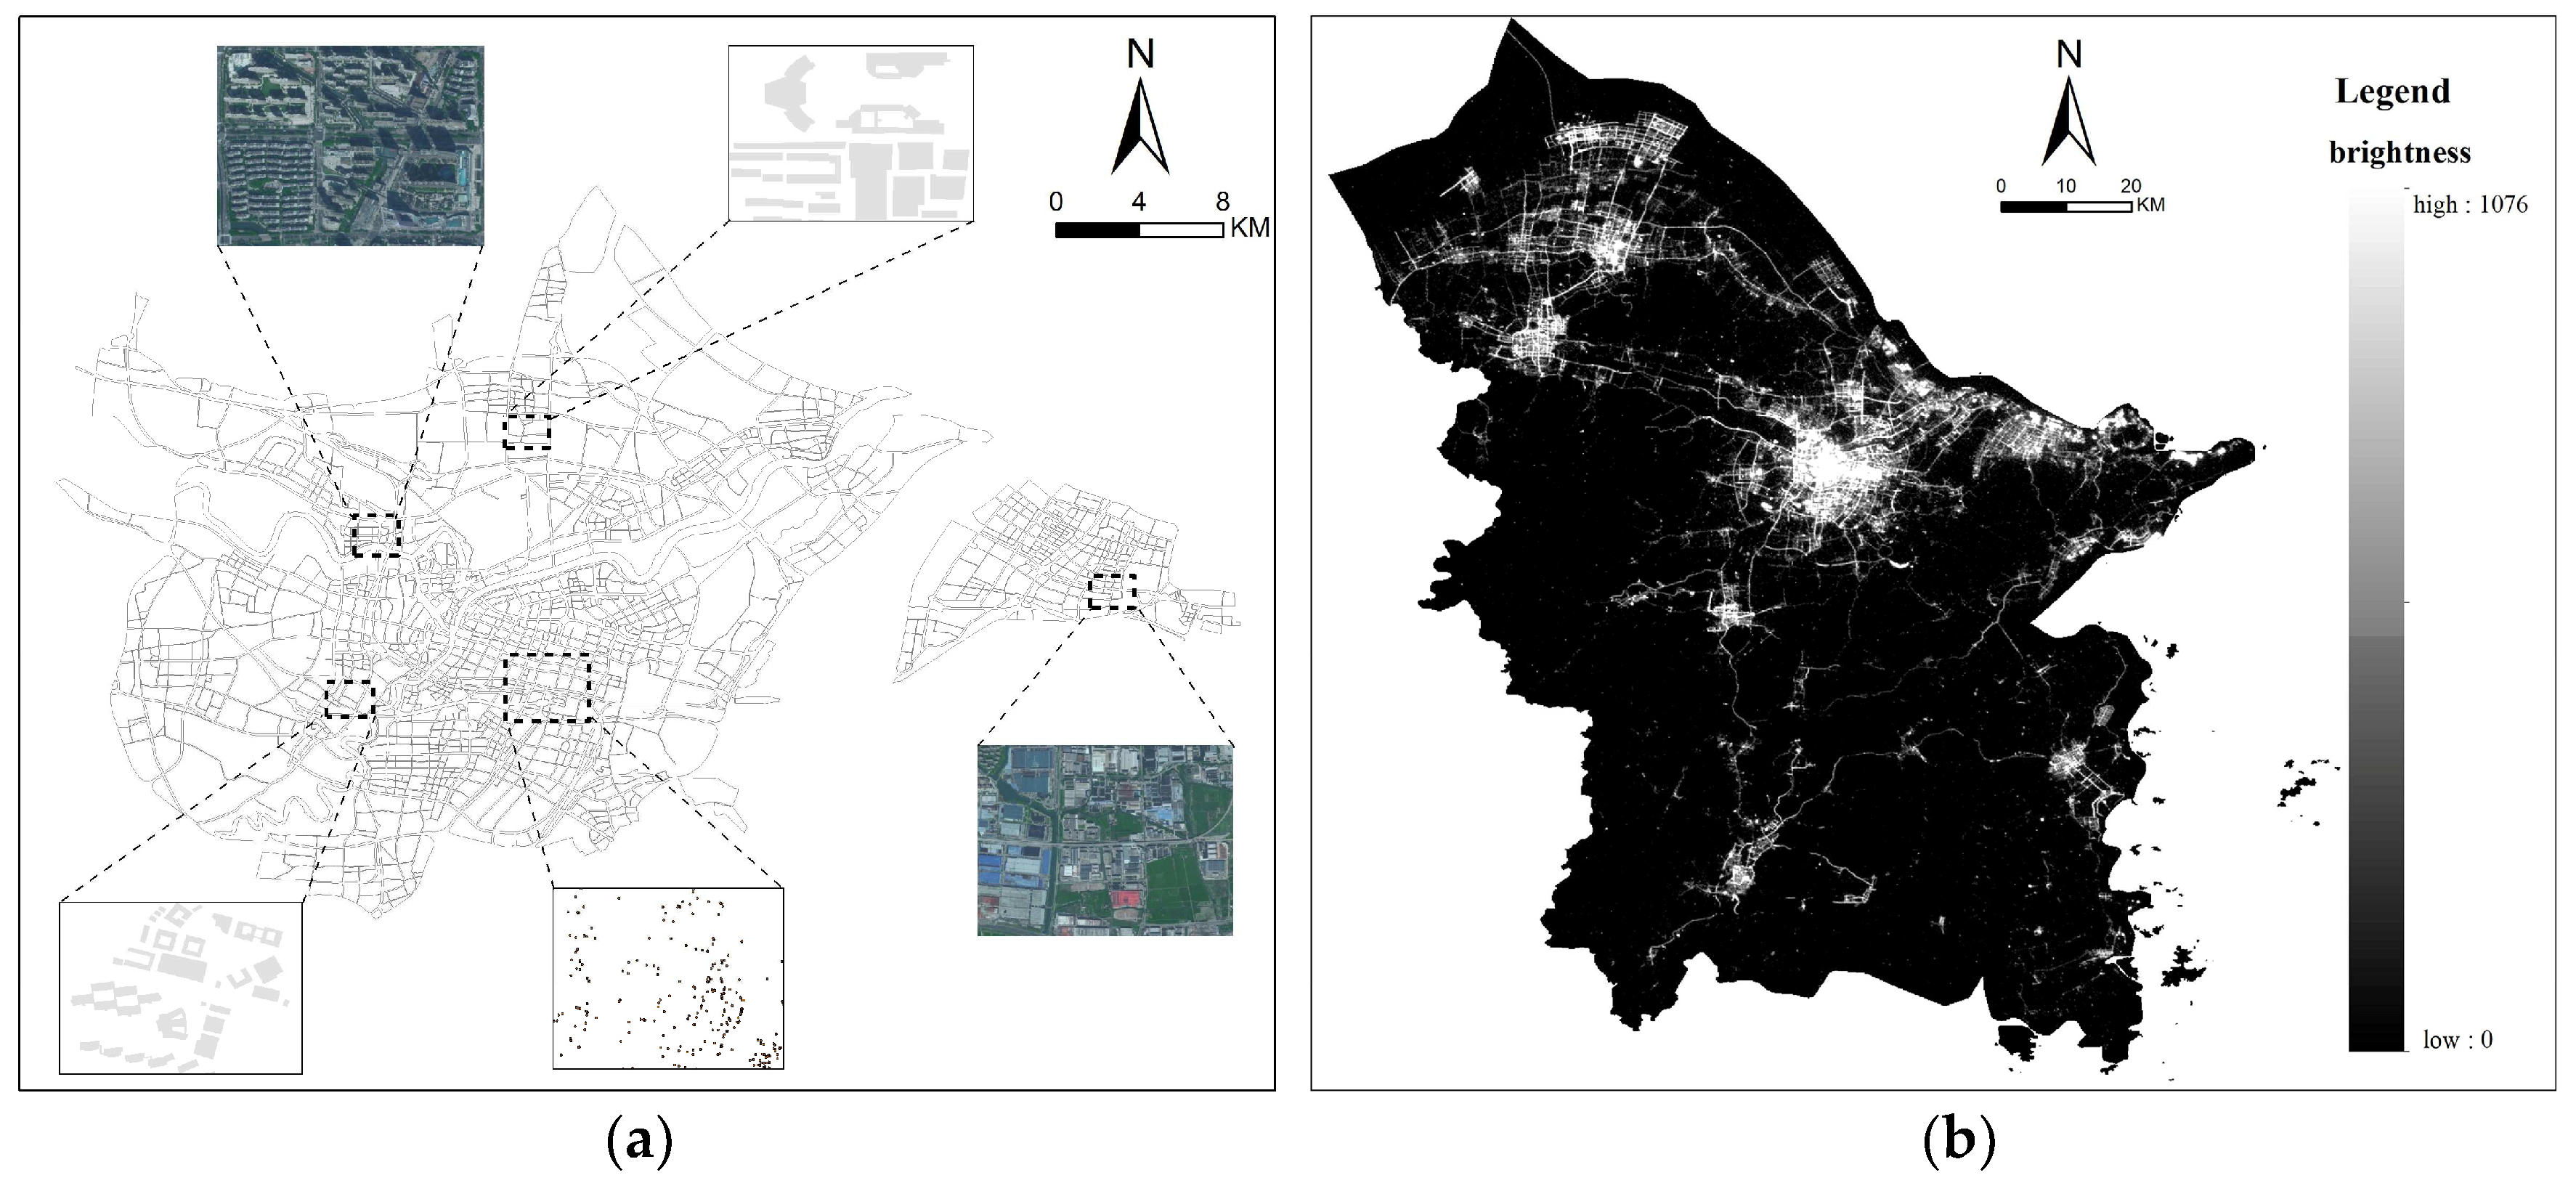
2.2. Research Data
2.3. Research Methods
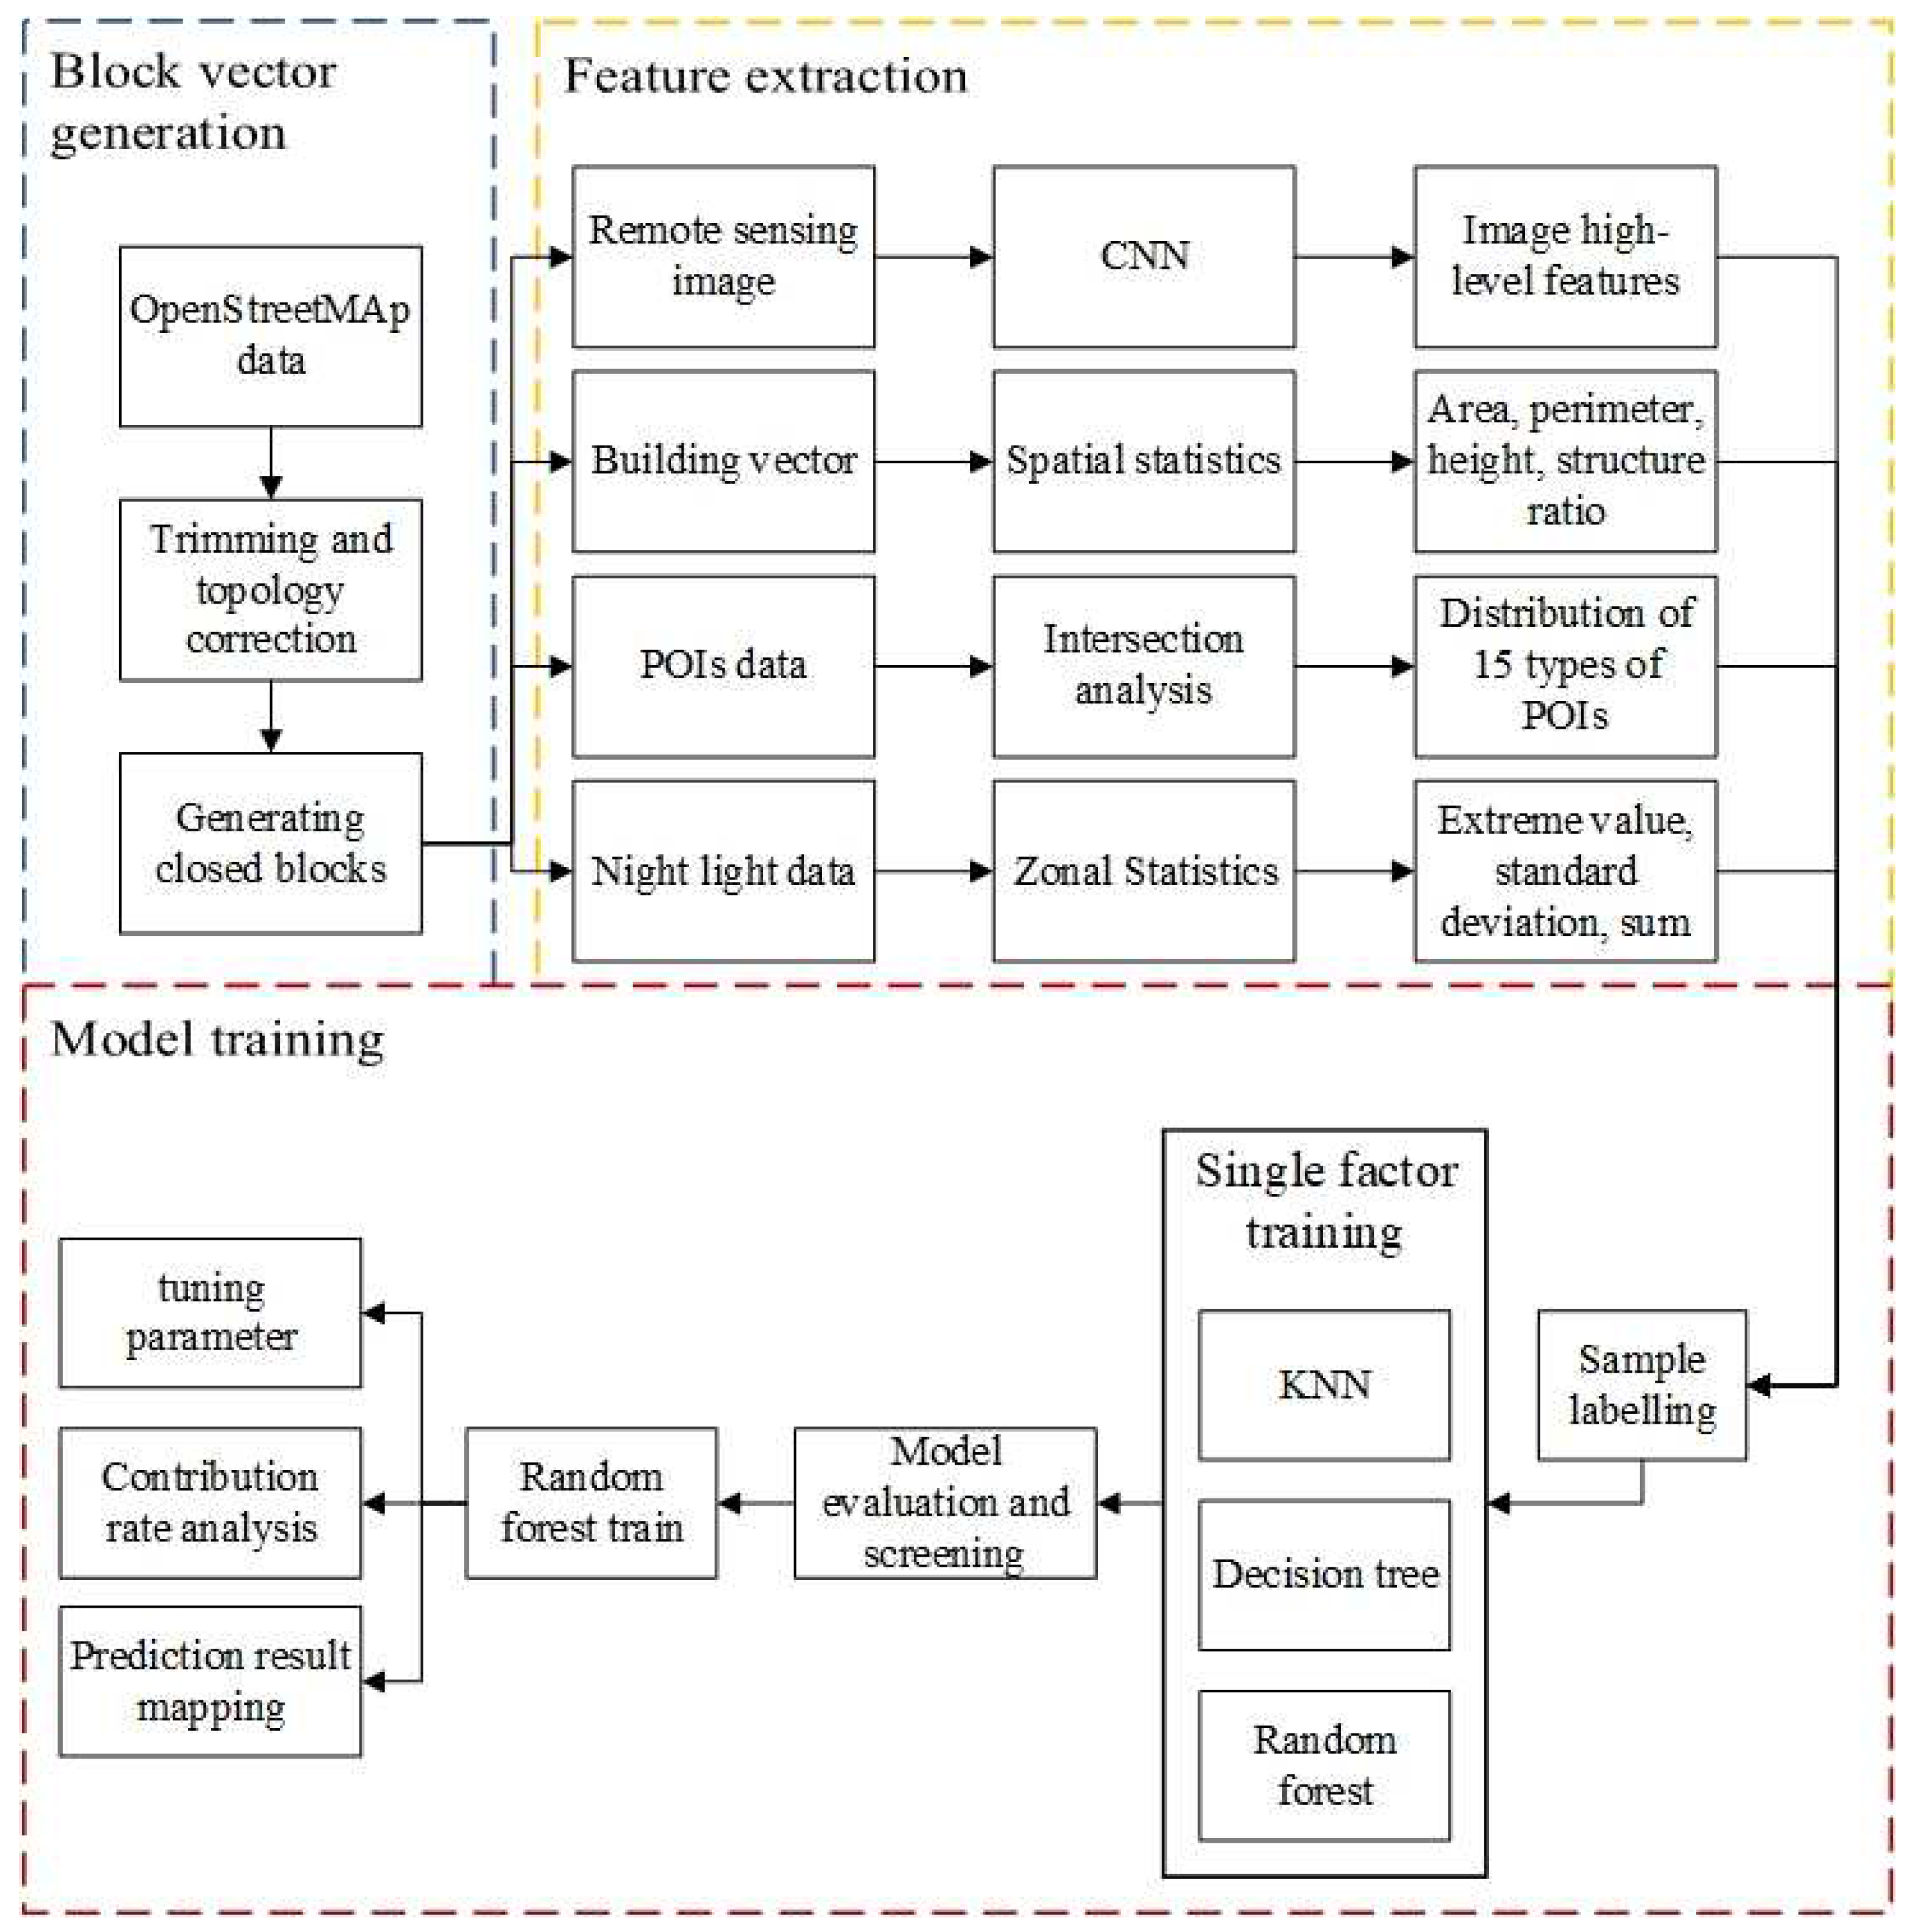
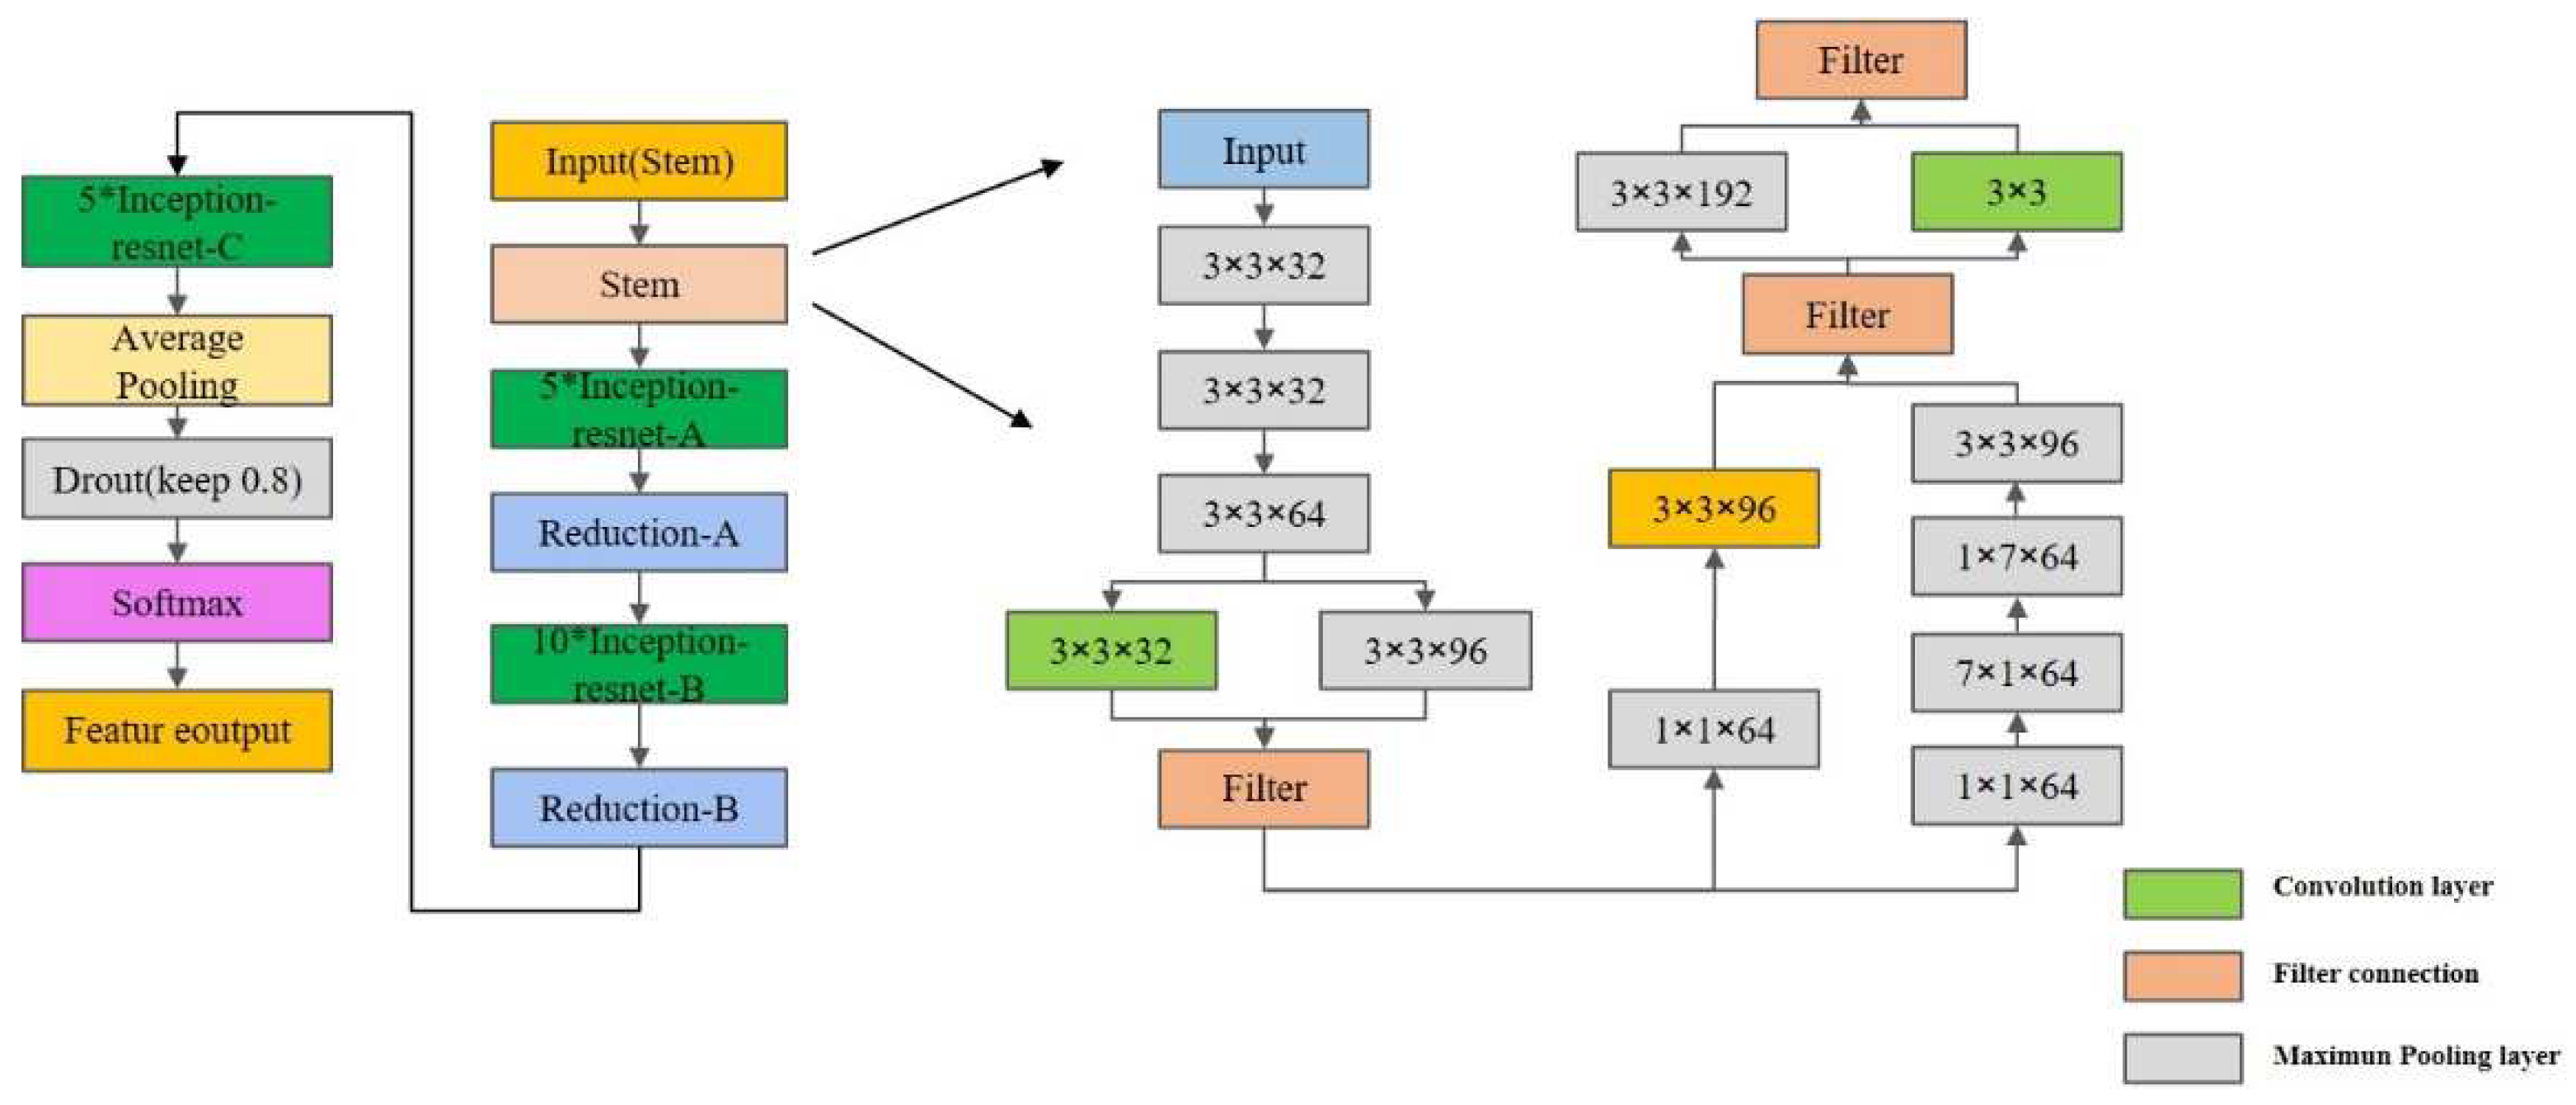
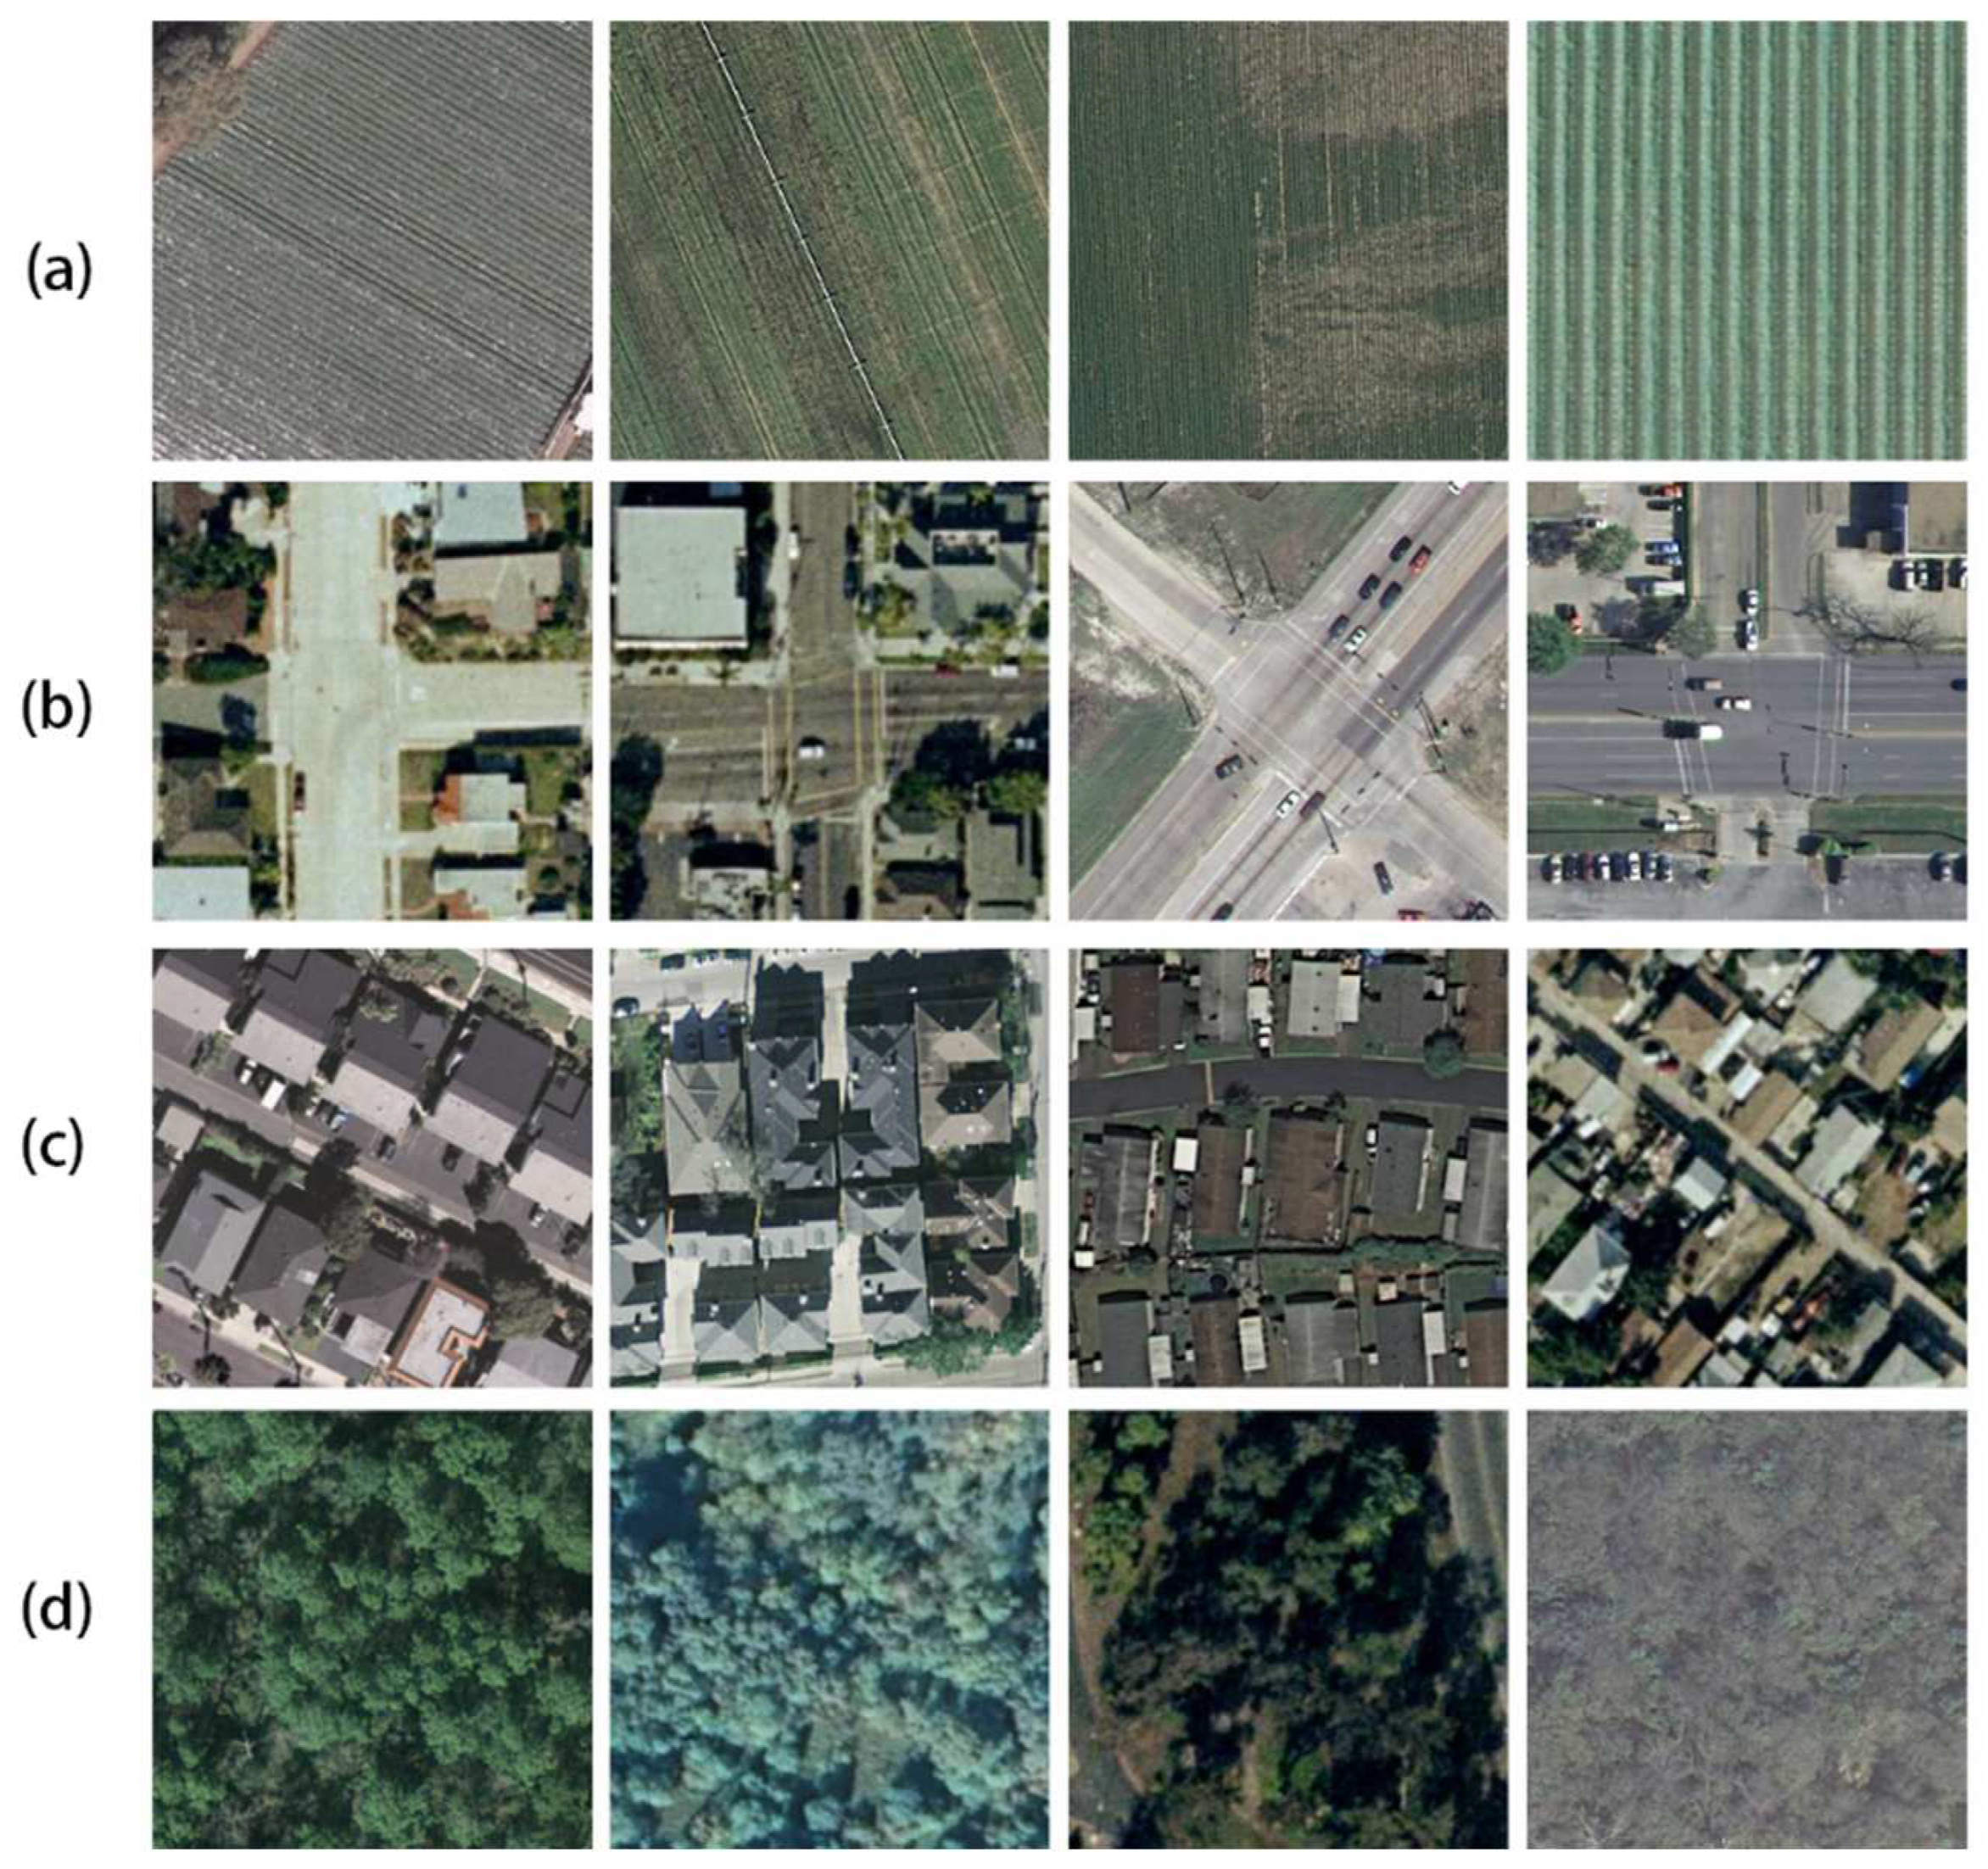
2.3.1. Feature Extraction of Urban Blocks
2.3.2. Construction of the Identification Model of Urban Spatial Functional Areas
- (1)
- Training data preparation
- (2)
- Machine learning approach
- (3)
- Model training
3. Results
3.1. Classification Results of Multisource Features Based on Different Models
3.2. Analysis of Comprehensive Prediction Results Based on Ensemble Learning
3.3. Analysis of the Spatial Pattern of PLES in Ningbo
4. Discussions
5. Conclusions
- (1)
- We collected high-resolution remote sensing image data, POI data, building vector data, and night light data that reflected the characteristics of Ningbo’s block scene and socioeconomic characteristics, and extracted multisource data features through convolutional neural network and GIS technology. The features extracted based on multisource data better reflected the characteristics of Ningbo city blocks from multiple dimensions, so were more effective for identifying urban PLES types.
- (2)
- We compared the accuracy of several commonly used machine learning models (nearest neighbor, decision tree, and random forest) for functional area classification. The random forest algorithm is a commonly used ensemble learning algorithm that can fuse features of different dimensions. Compared with the other two models, the prediction accuracy of random forest was greatly improved.
- (3)
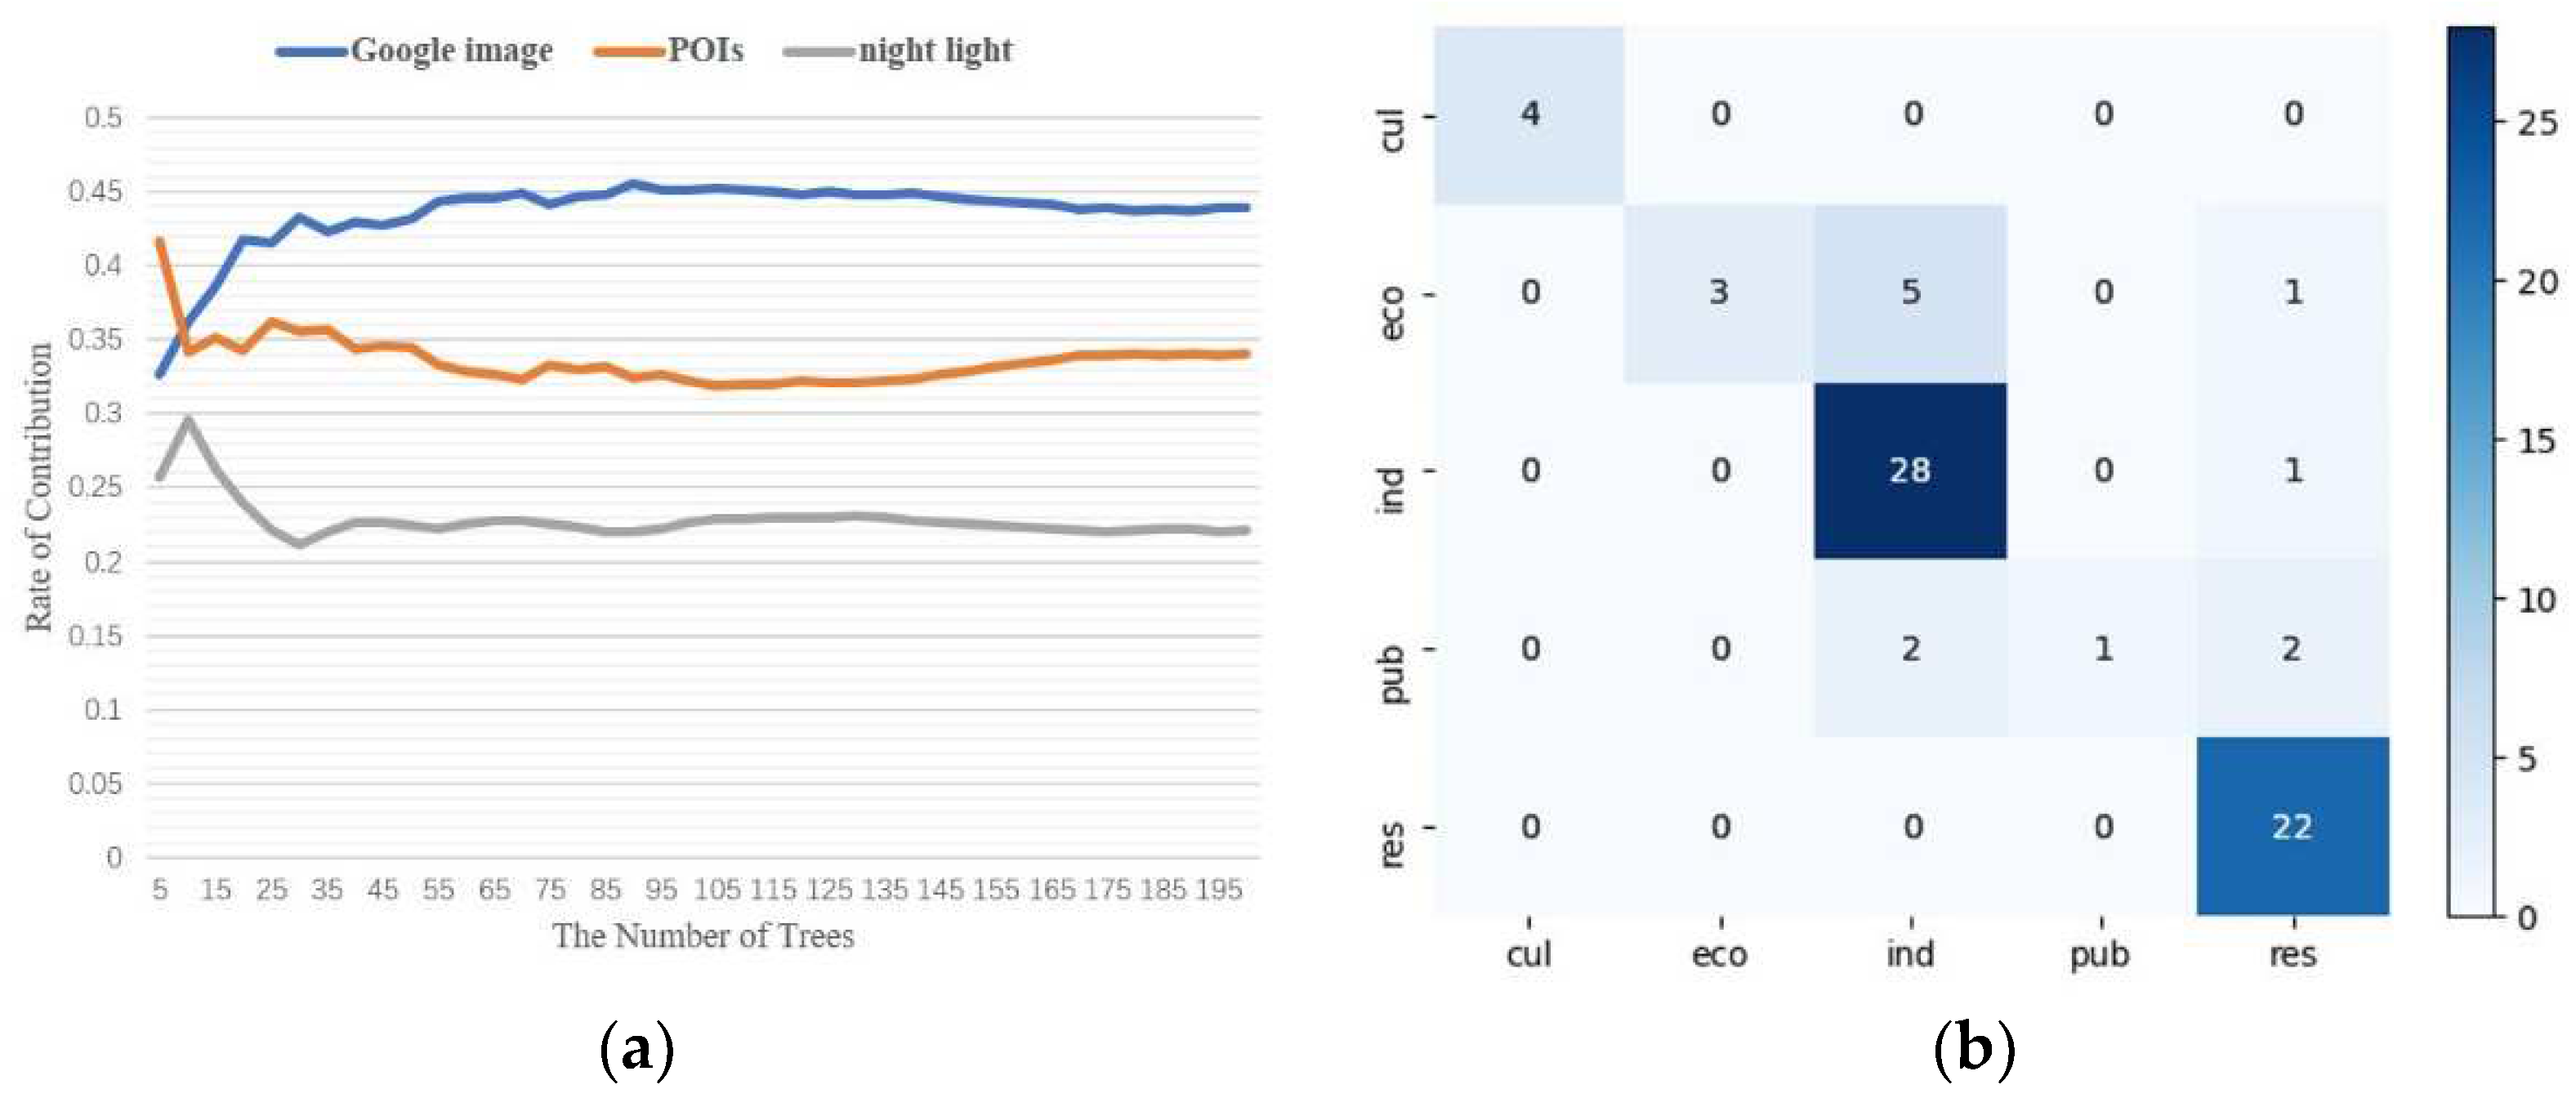
- The accuracy of the respective training models of the multisource data and the contribution rate in the integrated prediction model were compared: because the actual building vectors in some areas were not marked, the training accuracy of the building vector data was low. In addition, the number of different training data features was not balanced. There were only 10 features of night lights, which was much lower than the number of features for high-resolution remote sensing image data and POIs, so the prediction accuracy of night light data was also relatively low, but slightly higher than that of building vector data. The best training results were from high-resolution image data, whose prediction accuracy was over 85%. This proves that high-resolution remote sensing image data reflect comprehensive features such as texture features and spectral features in urban areas, and the process of feature extraction using deep learning models was efficient. Furthermore, from the perspective of multisource feature fusion learning, the training accuracy of different data corresponded to the contribution rate in the final prediction model, and the data with higher training accuracy made a higher contribution in the fusion model. Conversely, data with lower feature training accuracy will perform worse in the fusion training process, such as building footprint data, and could even play a negative role in comprehensive prediction, reducing the degree of matching between feature vectors and labels. This shows that, in the random forests and ensemble learning models, it is not the case that the more features there are, the better the fit.
- (4)
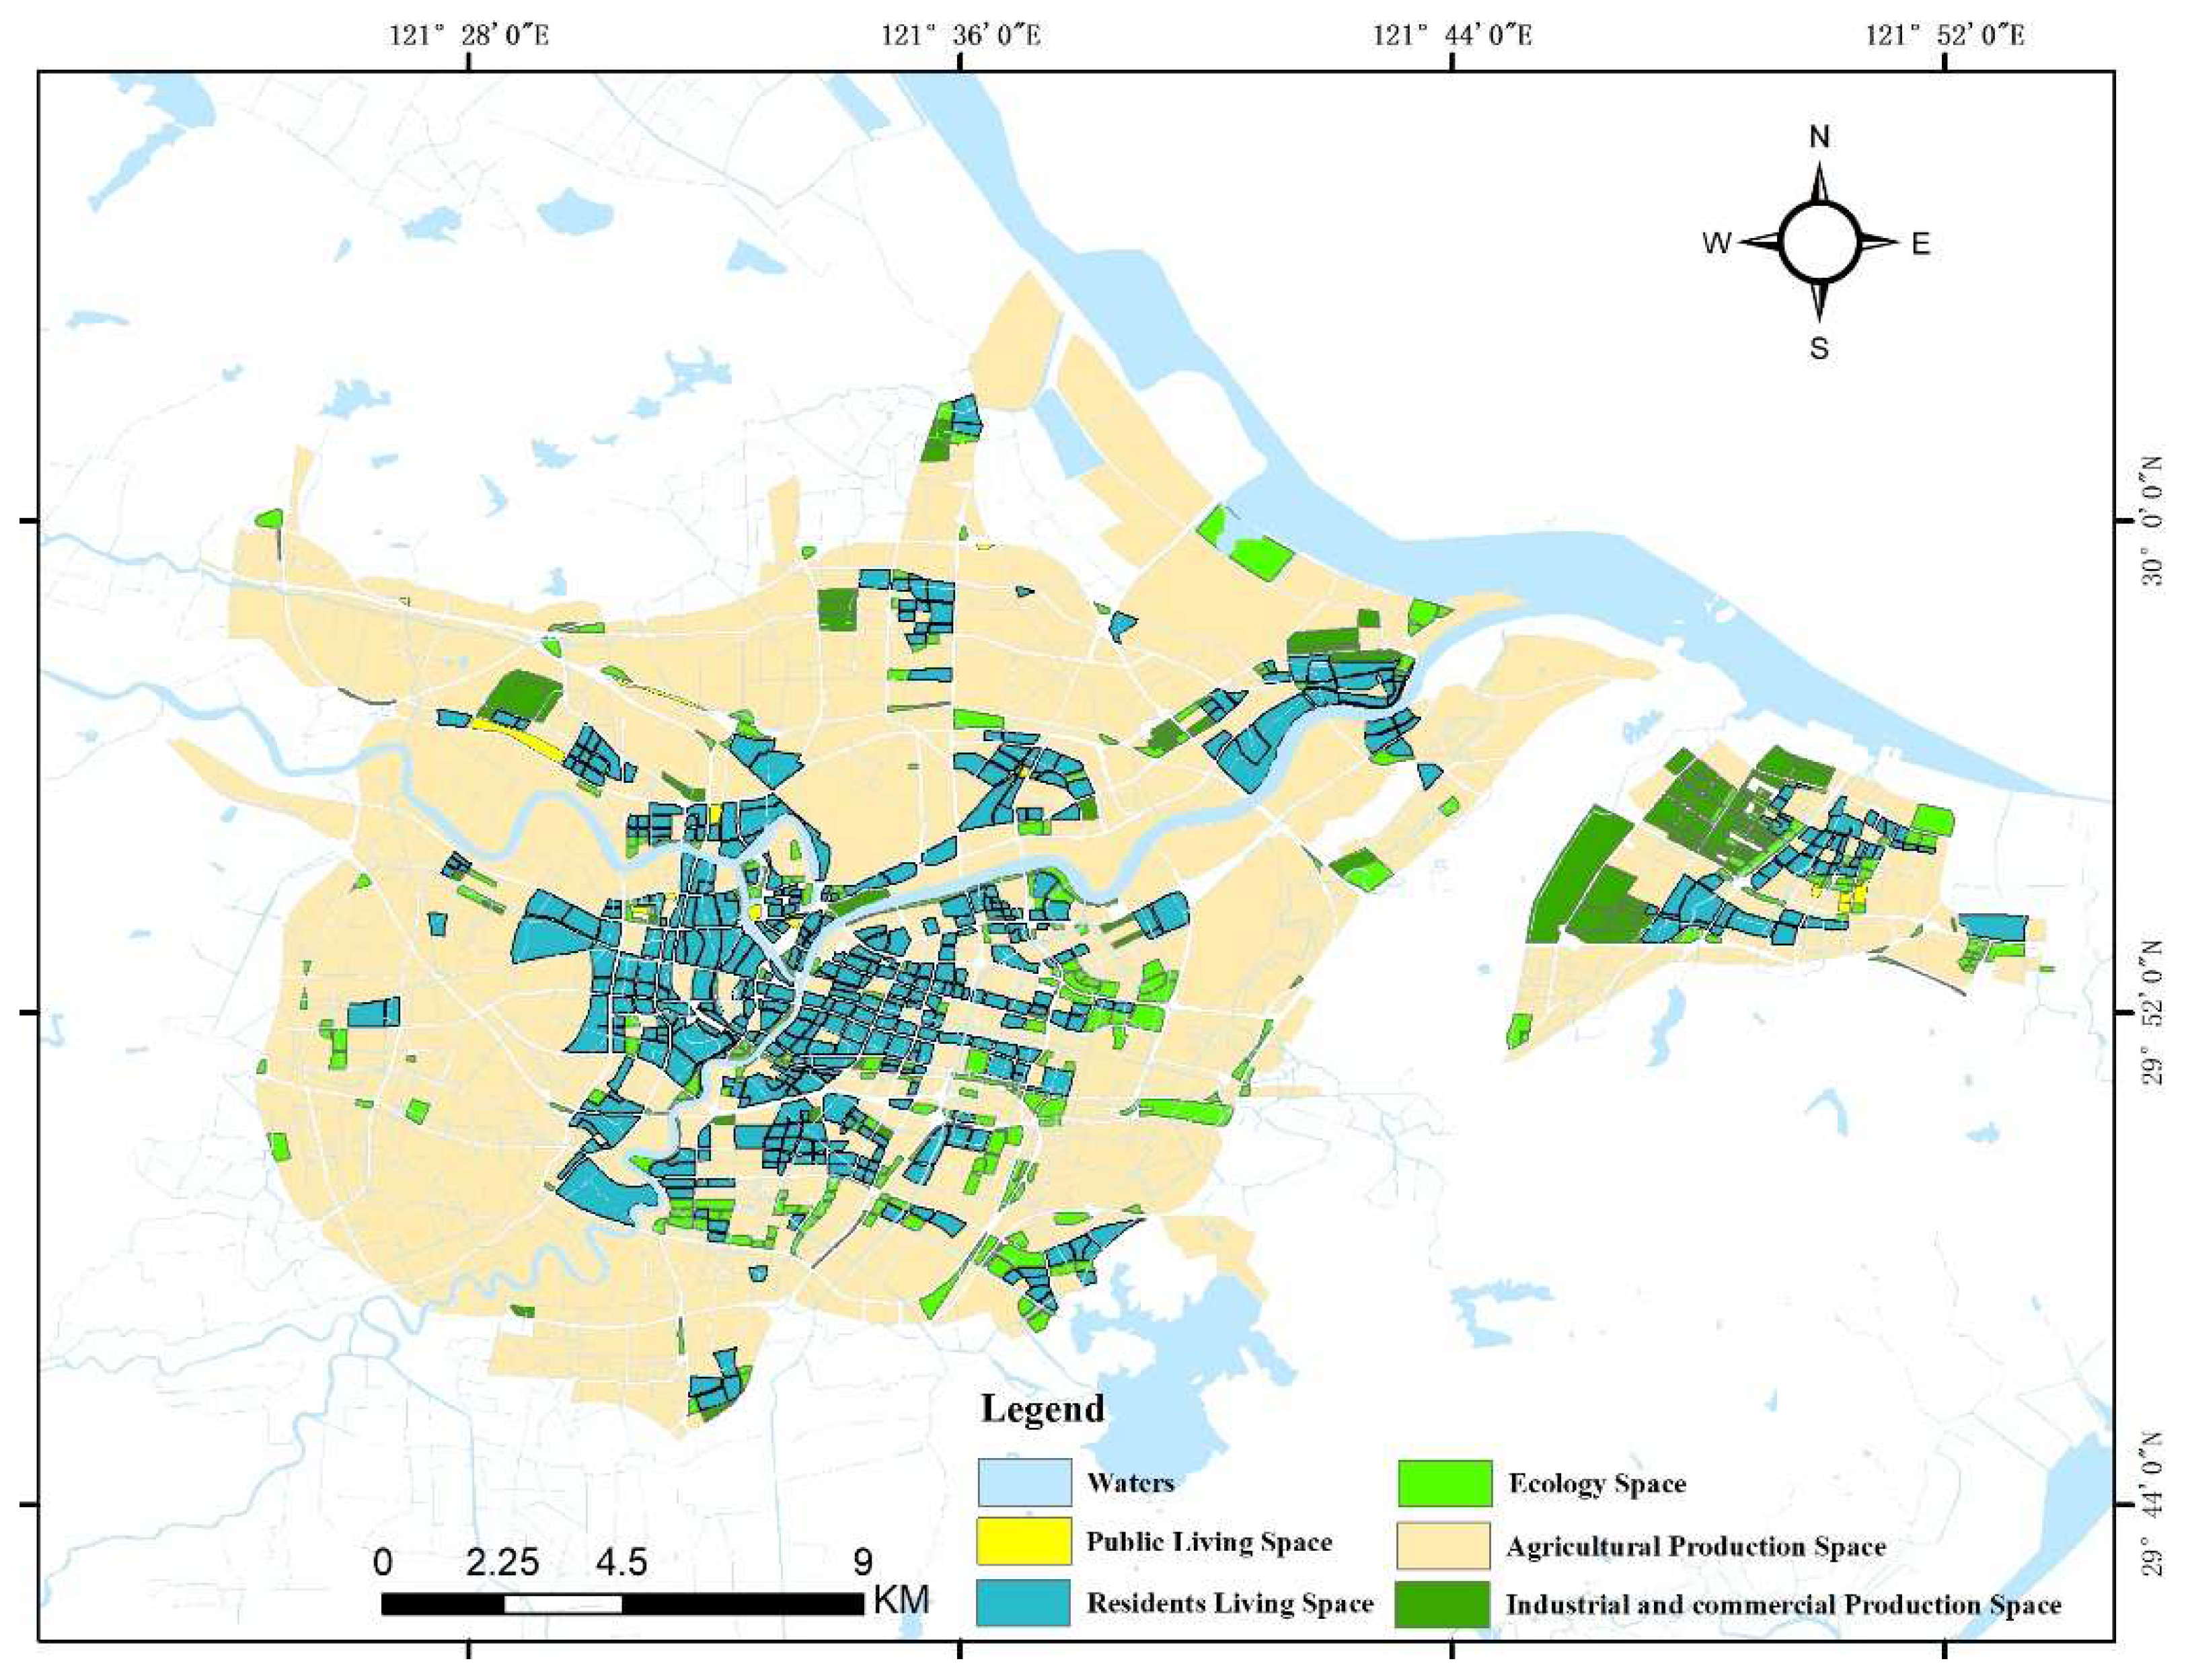
- The random forest algorithm, which had the best training effect, was used to identify the PLES function in Ningbo. From the identification results, it can be seen that the PLES in Ningbo was mainly distributed in concentric circles from the inside to the outside. The center of the city was dominated by residential living space, while a large area of agricultural production space, and industrial and commercial production space, were distributed on the periphery of the city center. However, the public living space and ecological space were small in area, and their distribution was relatively scattered, without obvious rules.
Author Contributions
Funding
Data Availability Statement
Conflicts of Interest
References
- Jiang, L.; Liu, Y.; Wu, S.; Yang, C. Analyzing ecological environment change and associated driving factors in China based on NDVI time series data. Ecol. Indic. 2021, 129, 107933. [Google Scholar] [CrossRef]
- Boess, E.R.; Kørnøv, L.; Lyhne, I.; Partidario, M.R. Integrating SDGs in environmental assessment: Unfolding SDG functions in emerging practices. Environ. Impact Assess. Rev. 2021, 90, 106632. [Google Scholar] [CrossRef]
- Bennett, E.M.; Carpenter, S.R.; Caraco, N.F. Human impact on erodable phosphorus and eutrophication: A global perspective: Increasing accumulation of phosphorus in soil threatens rivers, lakes, and coastal oceans with eutrophication. BioScience 2001, 51, 227–234. [Google Scholar] [CrossRef]
- Phalan, B.; Onial, M.; Balmford, A.; Green, R.E. Reconciling food production and biodiversity conservation: Land sharing and land sparing compared. Science 2011, 333, 1289–1291. [Google Scholar] [CrossRef] [PubMed]
- Zou, L.; Liu, Y.; Wang, J.; Yang, Y.; Wang, Y. Land use conflict identification and sustainable development scenario simulation on China’s southeast coast. J. Clean. Prod. 2019, 238, 117899. [Google Scholar] [CrossRef]
- Zou, L.; Liu, Y.; Wang, J.; Yang, Y. An analysis of land use conflict potentials based on ecological-production-living function in the southeast coastal area of China. Ecol. Indic. 2021, 122, 107297. [Google Scholar] [CrossRef]
- Yu, S.; Deng, W.; Xu, Y.; Zhang, X.; Xiang, H. Evaluation of the production-living-ecology space function suitability of Pingshan County in the Taihang mountainous area, China. J. Mt. Sci. 2020, 17, 2562–2576. [Google Scholar] [CrossRef]
- Li, J.; Sun, W.; Li, M.; Meng, L. Coupling coordination degree of production 2020, living and ecological spaces and its influencing factors in the Yellow River Basin. J. Clean. Prod. 2021, 298, 126803. [Google Scholar] [CrossRef]
- Wang, A.; Liao, X.; Tong, Z.; Du, W.; Zhang, J.; Liu, X.; Liu, M. Spatial-temporal dynamic evaluation of the ecosystem service value from the perspective of “production-living-ecological” spaces: A case study in Dongliao River Basin, China. J. Clean. Prod. 2022, 333, 130218. [Google Scholar] [CrossRef]
- Forestier, G.; Puissant, A.; Wemmert, C.; Gançarski, P. Knowledge-based region labeling for remote sensing image interpretation. Comput. 2012 Environ. Urban Syst. 2012, 36, 470–480. [Google Scholar] [CrossRef]
- Shahriari, M.; Bergevin, R. Land-use scene classification: A comparative study on bag of visual word framework. Multimed. Tools Appl. 2017, 76, 23059–23075. [Google Scholar] [CrossRef]
- Blaschke, T.; Hay, G.J.; Kelly, M.; Lang, S.; Hofmann, P.; Addink, E.; Tiede, D. Geographic object-based image analysis–towards a new paradigm. ISPRS J. Photogramm. Remote Sens. 2014, 87, 180–191. [Google Scholar] [CrossRef] [PubMed] [Green Version]
- Vogelmann, J.E.; Howard, S.M.; Yang, L.; Larson, C.R.; Wylie, B.K.; Van Driel, N. Completion of the 1990s National Land Cover Data Set for the conterminous United States from Landsat Thematic Mapper data and ancillary data sources. Photogramm. Eng. Remote Sens. 2001, 67, 650–662. [Google Scholar]
- Wulder, M.A.; White, J.C.; Cranny, M.; Hall, R.J.; Luther, J.E.; Beaudoin, A.; Dechka, J.A. Monitoring Canada’s forests. Part 1: Completion of the EOSD land cover project. Can. J. Remote Sens. 2008, 34, 549–562. [Google Scholar] [CrossRef]
- Zeferino, L.B.; de Souza, L.F.T.; do Amaral, C.H.; Fernandes Filho, E.I.; de Oliveira, T.S. Does environmental data increase the accuracy of land use and land cover classification? Int. J. Appl. Earth Obs. Geoinf. 2020, 91, 102128. [Google Scholar] [CrossRef]
- Ienco, D.; Interdonato, R.; Gaetano, R.; Minh, D.H.T. Combining Sentinel-1 and Sentinel-2 Satellite Image Time Series for land cover mapping via a multi-source deep learning architecture. ISPRS J. Photogramm. Remote Sens. 2019, 158, 11–22. [Google Scholar] [CrossRef]
- Chen, F.; Wang, K.; Van de Voorde, T.; Tang, T.F. Mapping urban land cover from high spatial resolution hyperspectral data: An approach based on simultaneously unmixing similar pixels with jointly sparse spectral mixture analysis. Remote Sens. Environ. 2017, 196, 324–342. [Google Scholar] [CrossRef]
- Cheng, G.; Xie, X.; Han, J.; Guo, L.; Xia, G.S. Remote sensing image scene classification meets deep learning: Challenges, methods, benchmarks, and opportunities. IEEE J. Sel. Top. Appl. Earth Obs. Remote Sens. 2020, 13, 3735–3756. [Google Scholar] [CrossRef]
- Ma, L.; Li, M.; Ma, X.; Cheng, L.; Du, P.; Liu, Y. A review of supervised object-based land-cover image classification. ISPRS J. Photogramm. Remote Sens. 2017, 130, 277–293. [Google Scholar] [CrossRef]
- Li, M.; Stein, A.; Bijker, W.; Zhan, Q. Urban land use extraction from Very High Resolution remote sensing imagery using a Bayesian network. ISPRS J. Photogramm. Remote Sens. 2016, 122, 192–205. [Google Scholar] [CrossRef]
- Liu, X.; He, J.; Yao, Y.; Zhang, J.; Liang, H.; Wang, H.; Hong, Y. Classifying urban land use by integrating remote sensing and social media data. Int. J. Geogr. Inf. Sci. 2017, 31, 1675–1696. [Google Scholar] [CrossRef]
- Liu, Y.; Liu, X.; Gao, S.; Gong, L.; Kang, C.; Zhi, Y.; Shi, L. Social sensing: A new approach to understanding our socioeconomic environments. Ann. Assoc. Am. Geogr. 2015, 105, 512–530. [Google Scholar] [CrossRef]
- Chen, Y.; Liu, X.; Li, X.; Liu, X.; Yao, Y.; Hu, G.; Pei, F. Delineating urban functional areas with building-level social media data: A dynamic time warping (DTW) distance based k-medoids method. Landsc. Urban Plan. 2017, 160, 48–60. [Google Scholar] [CrossRef]
- Zhang, W.; Li, W.; Zhang, C.; Hanink, D.M.; Li, X.; Wang, W. Parcel-based urban land use classification in megacity using airborne LiDAR, high resolution orthoimagery, and Google Street View. Comput. Environ. Urban Syst. 2017, 64, 215–228. [Google Scholar] [CrossRef] [Green Version]
- Steiniger, S.; Lange, T.; Burghardt, D.; Weibel, R. An approach for the classification of urban building structures based on discriminant analysis techniques. Trans. GIS 2008, 12, 31–59. [Google Scholar] [CrossRef]
- Tu, W.; Cao, J.; Yue, Y.; Shaw, S.L.; Zhou, M.; Wang, Z.; Li, Q. Coupling mobile phone and social media data: A new approach to understanding urban functions and diurnal patterns. Int. J. Geogr. Inf. Sci. 2017, 31, 2331–2358. [Google Scholar] [CrossRef]
- Liu, C.; Wang, Y.; He, R.; Wang, C. An analysis framework for identifying and optimizing ecological-production-living space based on resident behavior. J. Nat. Resour. 2019, 34, 2113–2122. [Google Scholar] [CrossRef]
- Wang, C.; Gao, F.; Zhou, J. The Spatio-temporal Differentiation Characteristics of “Production-Living-Ecological Space” in the Border Area of Guangzhou and Foshan with the Support of Multi-source Data: Taking the “Baiyun-Nanhai” Experimental Area as an Example. Huazhong Archit. 2022, 40, 119–125. [Google Scholar] [CrossRef]
- Han, Z.; Shi, J.; Wu, J.; Wang, Z. Recognition Method of “The Production, Living and Ecological Space” based on POI Data and Quad-tree Idea. J. Geo-Inf. Sci. 2022, 24, 1107–1119. [Google Scholar]
- Zhang, Y.; Luan, Q.; Xiong, C.; Liu, X. Spatial heterogeneity evaluation and zoning of production-living-ecological space based on multi-source spatial data. Trans. Chin. Soc. Agric. Eng. 2021, 37, 214–223. [Google Scholar] [CrossRef]
- Zhao, H.; Wei, J.; Sun, D.; Liu, Y.; Wang, S.; Tan, J.; Miao, C. Recognition and spatio-temporal evolution analysis of production-living-ecological spaces based on the random forest model: A case study of Zhengzhou city, China. J. Geomat. 2018, 40, 945–957. [Google Scholar] [CrossRef]
- Wang, Q.; Wang, C. Research on Spatial Identification and Distribution Characteristics of “Production—Living—Ecological” in Cities from the Perspective of Big Data—A Case Study of Urumqi City. Resour. Dev. Mark. 2022, 38, 142–147. [Google Scholar]
- Ottitsch, A. Land use potential analysis Achenkirch. Phyton 1996, 36, 119–130. [Google Scholar]
- Liu, D.; Ma, X.; Gong, J.; Li, H. Functional identification and spatiotemporal pattern analysis of production-living-ecological space in watershed scale: A case study of Bailongjiang Watershed in Gansu. Chin. J. Ecol. 2018, 37, 1490–1497. [Google Scholar]
- Liao, L.; Dai, W.Y.; Chen, J.; Huang, W.; Jiang, F.; Hu, Q. Spatial conflict between ecological-production-living spaces on Pingtan Island during rapid urbanization. Resour. Sci. 2017, 39, 1823–1833. [Google Scholar]
- Liang, H.; Guo, Z.; Wu, J.; Chen, Z. GDP spatialization in Ningbo City based on NPP/VIIRS night-time light and auxiliary data using random forest regression. Adv. Space Res. 2020, 65, 481–493. [Google Scholar] [CrossRef]
- Ningbo Municipal Statistics Bureau. Statistical Bulletin of National Economic and Social Development of Ningbo in 2020; Ningbo Municipal Statistics Bureau: Ningbo, China, 2021. [Google Scholar]
- Feng, Y.; Yang, Q.; Tong, X.; Wang, J.; Chen, S.; Lei, Z.; Gao, C. Long-term regional environmental risk assessment and future scenario projection at Ningbo, China coupling the impact of sea level rise. Sustainability 2019, 11, 1560. [Google Scholar] [CrossRef] [Green Version]
- Feng, Y.; Yang, Q.; Tong, X.; Chen, L. Evaluating land ecological security and examining its relationships with driving factors using GIS and generalized additive model. Sci. Total Environ. 2018, 633, 1469–1479. [Google Scholar] [CrossRef]
- Li, Y.; Wei, B.; Suo, A.; Zhang, Z.; Xu, Y.; Liang, Y. Spatial and Temporal Coupling Relationships of Coastline Exploitation and Environmental Carrying Safety in Ningbo, China. J. Coast. Res. 2020, 36, 1292–1301. [Google Scholar] [CrossRef]
- Liu, Q.; Zhan, Q.; Li, J.; Yang, C.; Liu, W. Extracting Built-up Areas Using Luojia⁃1A Nighttime Light Imageries in Wuhan, China. Geomat. Inf. Sci. Wuhan Univ. 2021, 46, 30–39. [Google Scholar] [CrossRef]
- LeCun, Y.; Bottou, L.; Bengio, Y.; Haffner, P. Gradient-based learning applied to document recognition. Proc. IEEE 1998, 86, 2278–2324. [Google Scholar] [CrossRef] [Green Version]
- Krizhevsky, A.; Sutskever, I.; Hinton, G.E. Imagenet classification with deep convolutional neural networks. Commun. ACM 2017, 60, 84–90. [Google Scholar] [CrossRef] [Green Version]
- Nazir, U.; Khurshid, N.; Ahmed Bhimra, M.; Taj, M. Tiny-Inception-ResNet-v2: Using deep learning for eliminating bonded labors of brick kilns in South Asia. In Proceedings of the IEEE/CVF Conference on Computer Vision and Pattern Recognition Workshops, Long Beach, CA, USA, 16–17 June 2019; pp. 39–43. [Google Scholar]
- Hand, D.J.; Vinciotti, V. Choosing k for two-class nearest neighbour classifiers with unbalanced classes. Pattern Recognit. Lett. 2003, 24, 1555–1562. [Google Scholar] [CrossRef]
- Moore, D.H. Classification and regression trees, by Leo Breiman, Jerome H. Friedman, Richard A. Olshen, and Charles J. Stone. brooks/cole publishing, monterey, 1984, 358 pages, $27.95. Cytometry 1987, 8, 534–535. [Google Scholar] [CrossRef]


| PLES | Land Use Type (Functional Description) | |
|---|---|---|
| Primary Classification | Secondary Classification | |
| Production space | Agricultural production space | Paddy fields, dry land |
| Industrial production space | Industry and mining, land use for transport construction | |
| Living space | Urban living space | Urban land |
| Rural living space | Rural residential land | |
| Ecological space | Forest ecological space | Woodland, shrub land, open forest land, other woodland |
| Grassland ecological space | Grassland with high, medium, and low coverage | |
| Aquatic ecological space | Canals, lakes, reservoir pit ponds, permanent glaciers and snowfields, tidal flats, bottomland | |
| Other ecological spaces | Sandy land, Gobi, saline alkali land, swamp land, bare land, bare rock land, and other unused land | |
| Google Image | POIs | Buildings | Night Light | |
|---|---|---|---|---|
| Nearest neighbor | 68.10% | 76.83% | 56.93% | 58.04% |
| Decision tree | 72.88% | 76.83% | 60.36% | 64.71% |
| Random forest | 78.95% | 71.91% | 55.91% | 69.44% |
Publisher’s Note: MDPI stays neutral with regard to jurisdictional claims in published maps and institutional affiliations. |
© 2022 by the authors. Licensee MDPI, Basel, Switzerland. This article is an open access article distributed under the terms and conditions of the Creative Commons Attribution (CC BY) license (https://creativecommons.org/licenses/by/4.0/).
Share and Cite
Fu, J.; Bu, Z.; Jiang, D.; Lin, G. Identification and Classification of Urban PLES Spatial Functions Based on Multisource Data and Machine Learning. Land 2022, 11, 1824. https://doi.org/10.3390/land11101824
Fu J, Bu Z, Jiang D, Lin G. Identification and Classification of Urban PLES Spatial Functions Based on Multisource Data and Machine Learning. Land. 2022; 11(10):1824. https://doi.org/10.3390/land11101824
Chicago/Turabian StyleFu, Jingying, Ziqiang Bu, Dong Jiang, and Gang Lin. 2022. "Identification and Classification of Urban PLES Spatial Functions Based on Multisource Data and Machine Learning" Land 11, no. 10: 1824. https://doi.org/10.3390/land11101824