
Analysis of landslide Susceptibility and Tree Felling Due to an Extreme Event at Mid-Latitudes: Case Study of Storm Vaia, Italy


Abstract
:1. Introduction
2. Materials and Methods
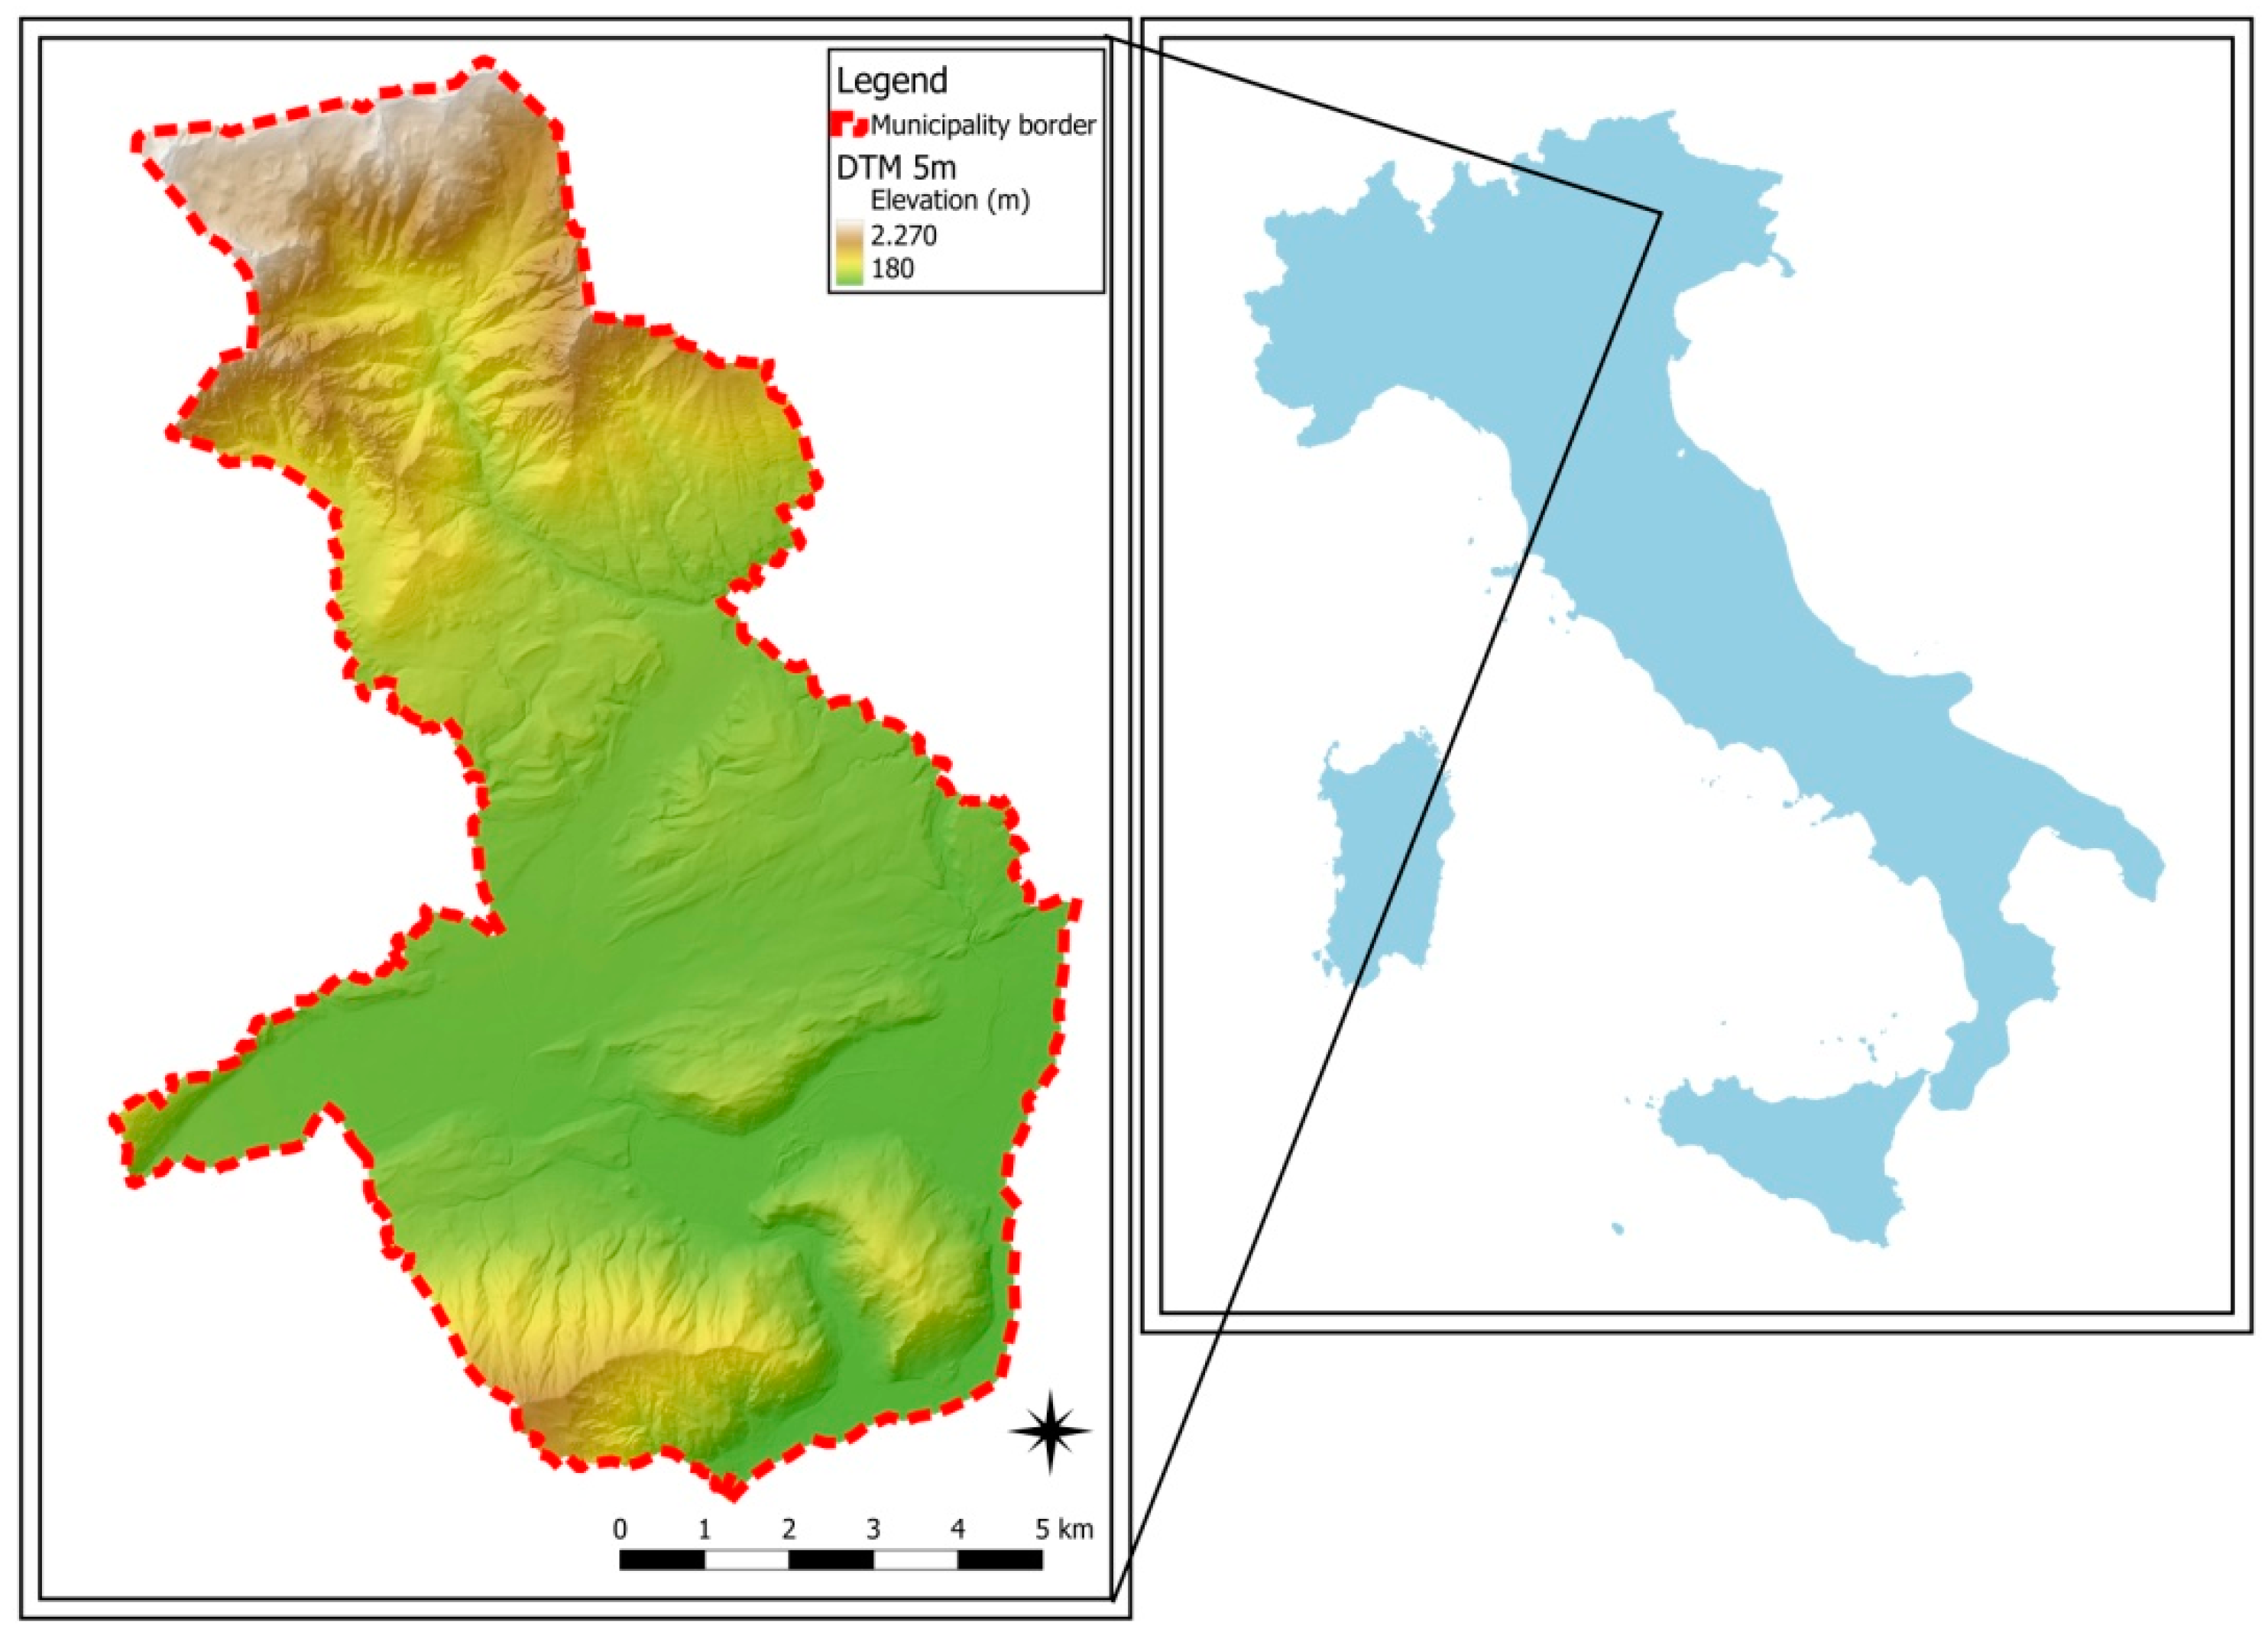
2.1. Study Area
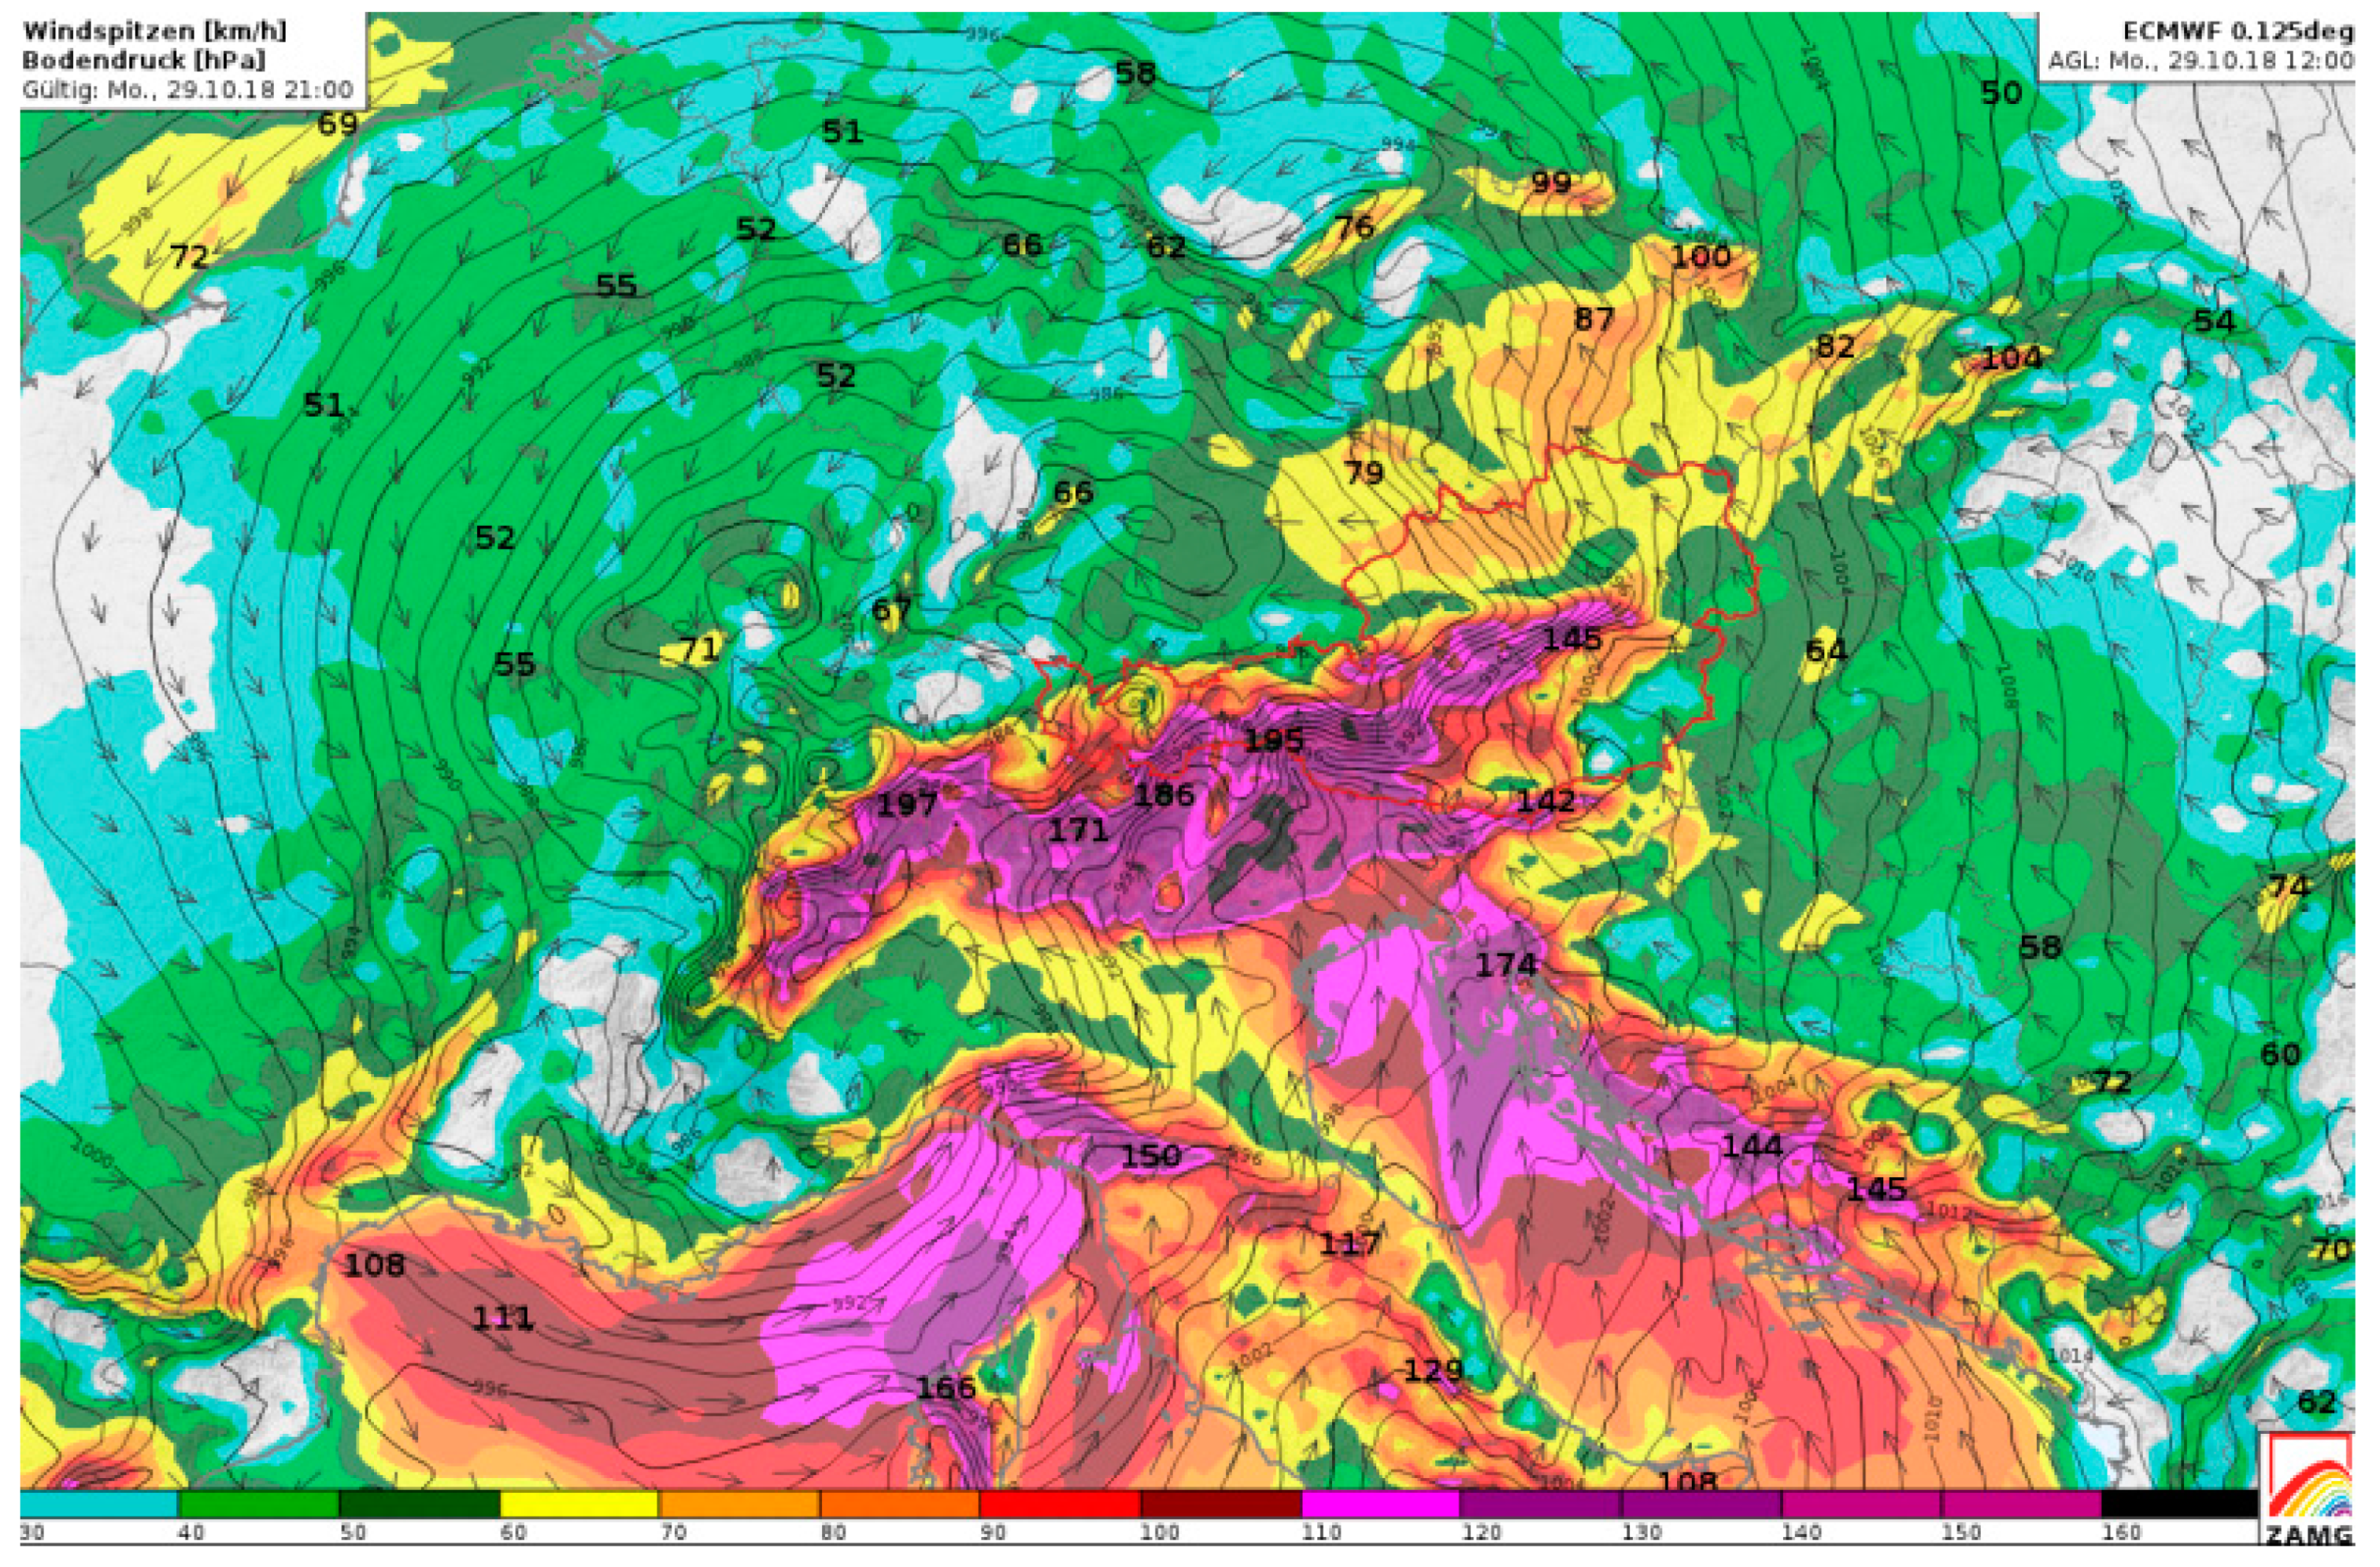
2.2. Storm Vaia
2.3. Landslides Activated during the Event
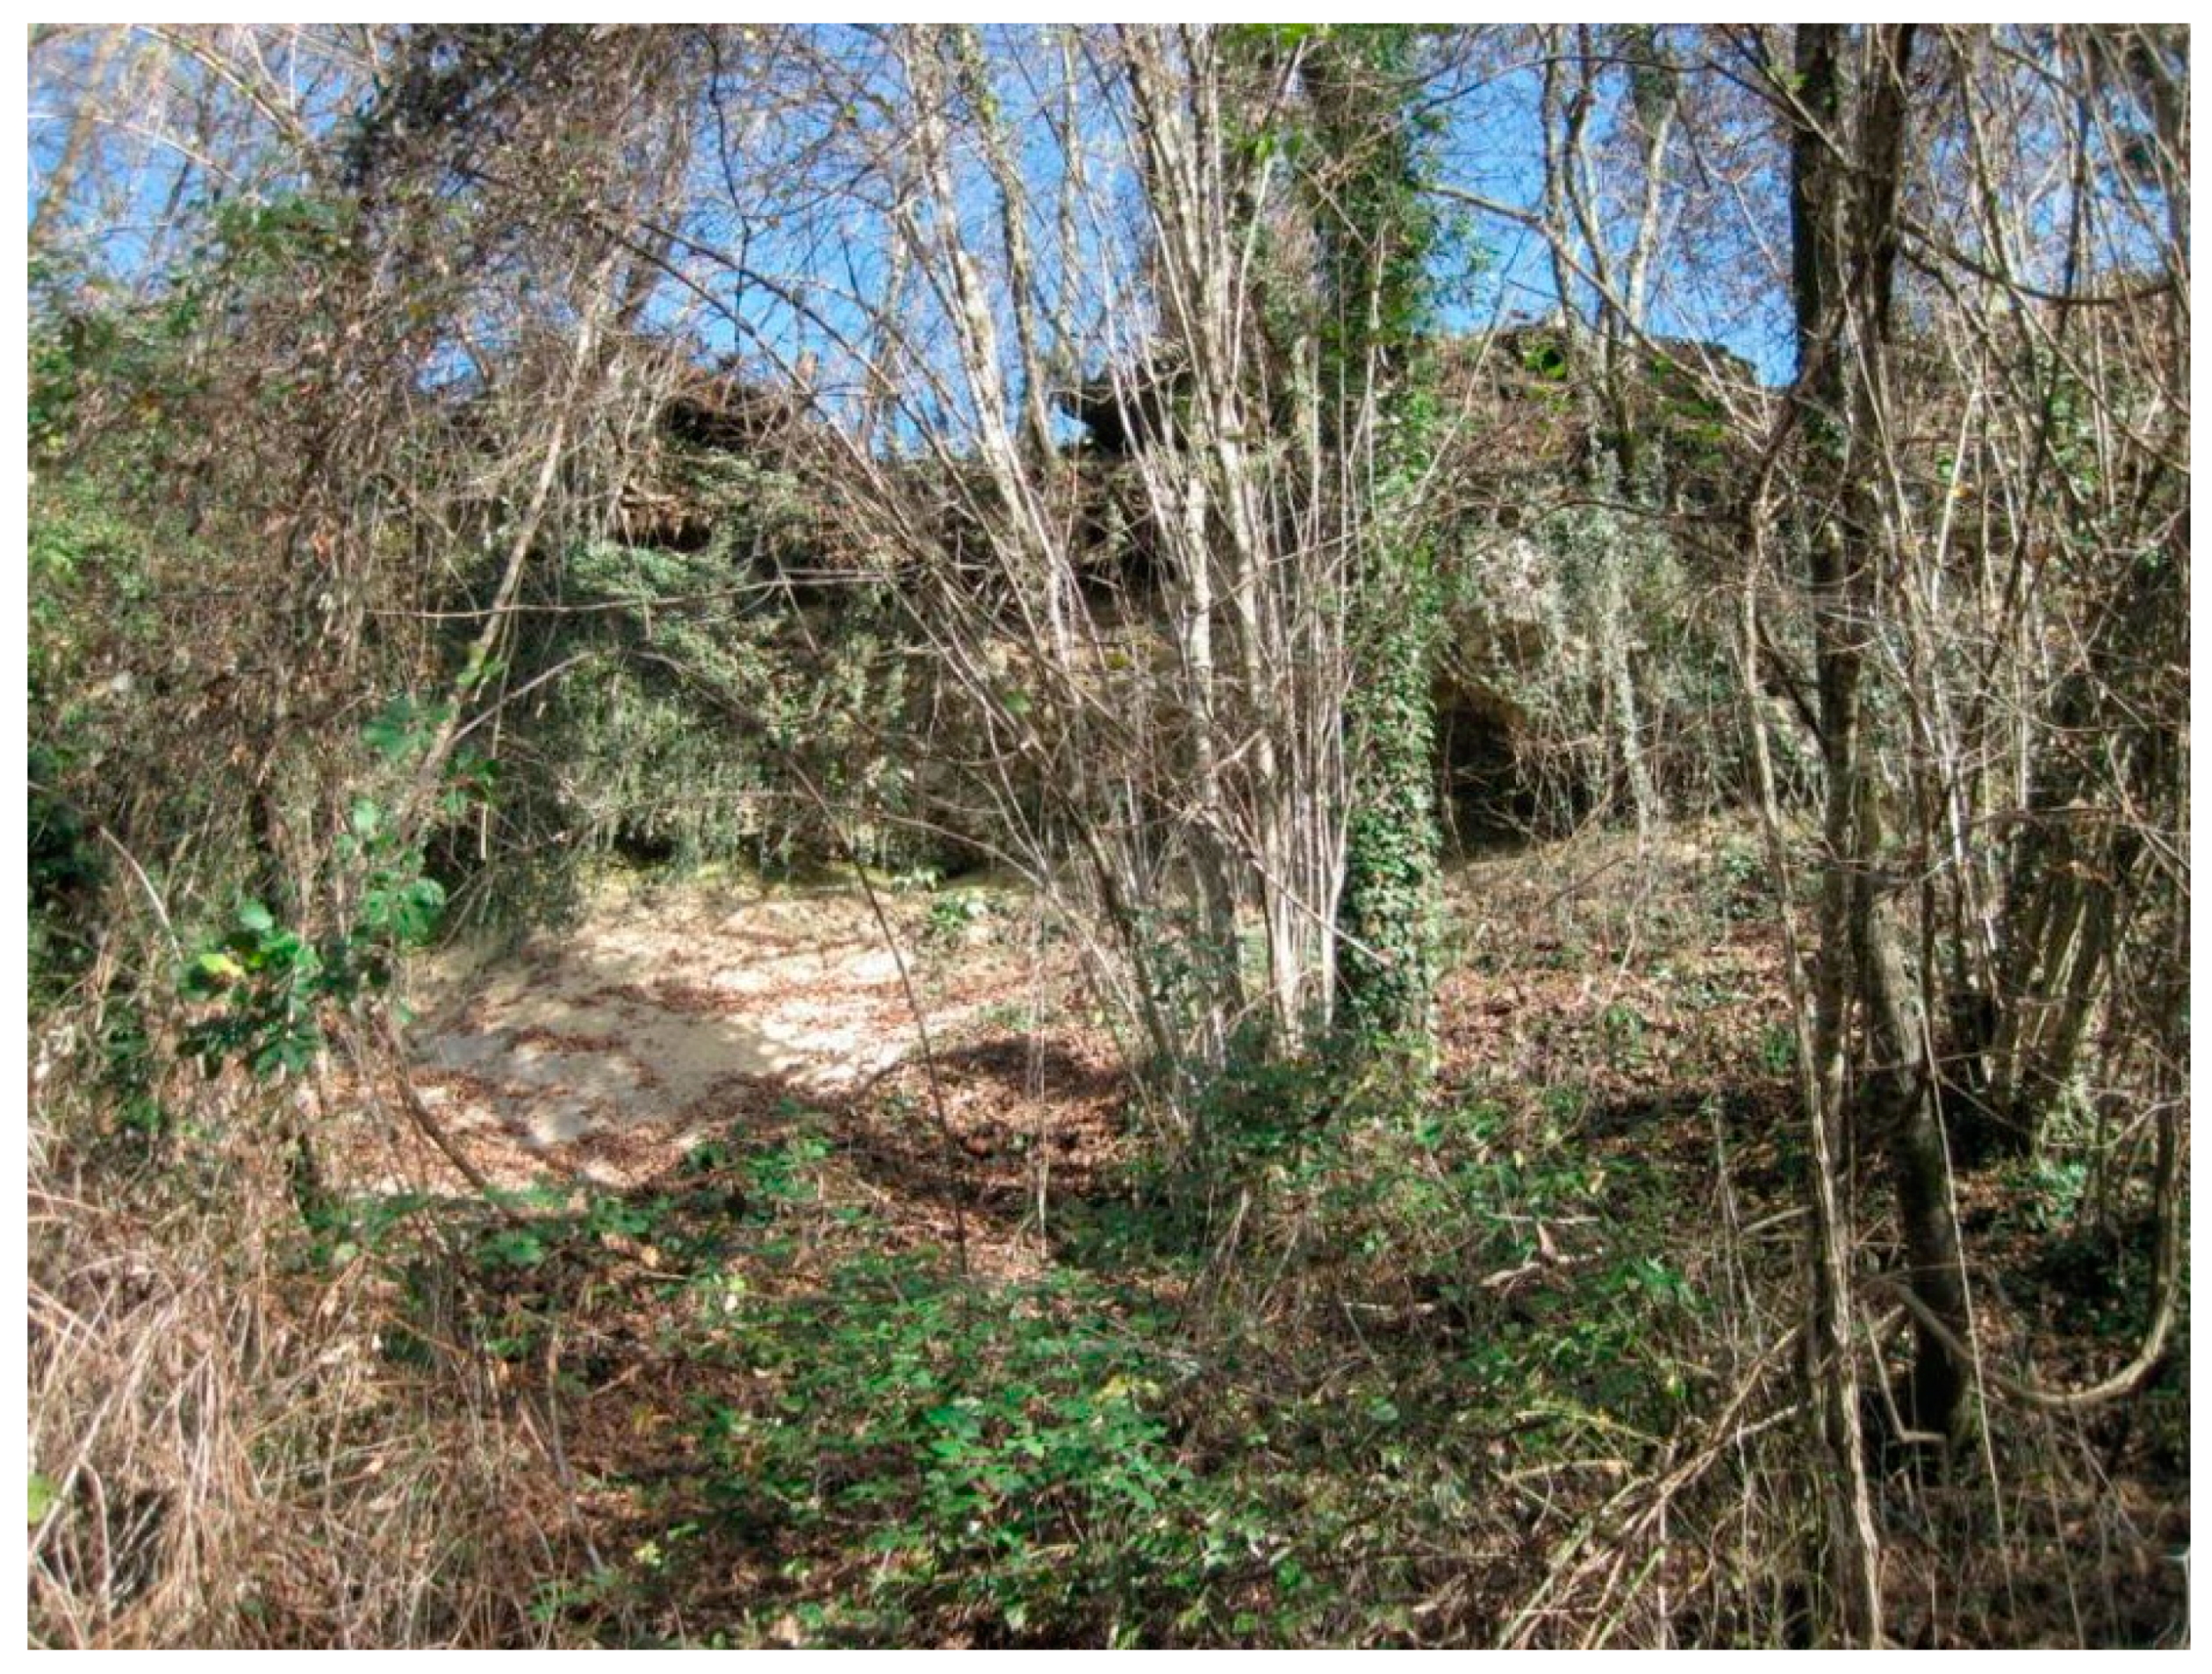
- Code 025021_01c: Rotational slip with retrogressive evolution due to water concentration. Landslide in overconsolidated moraine materials (Figure 3).
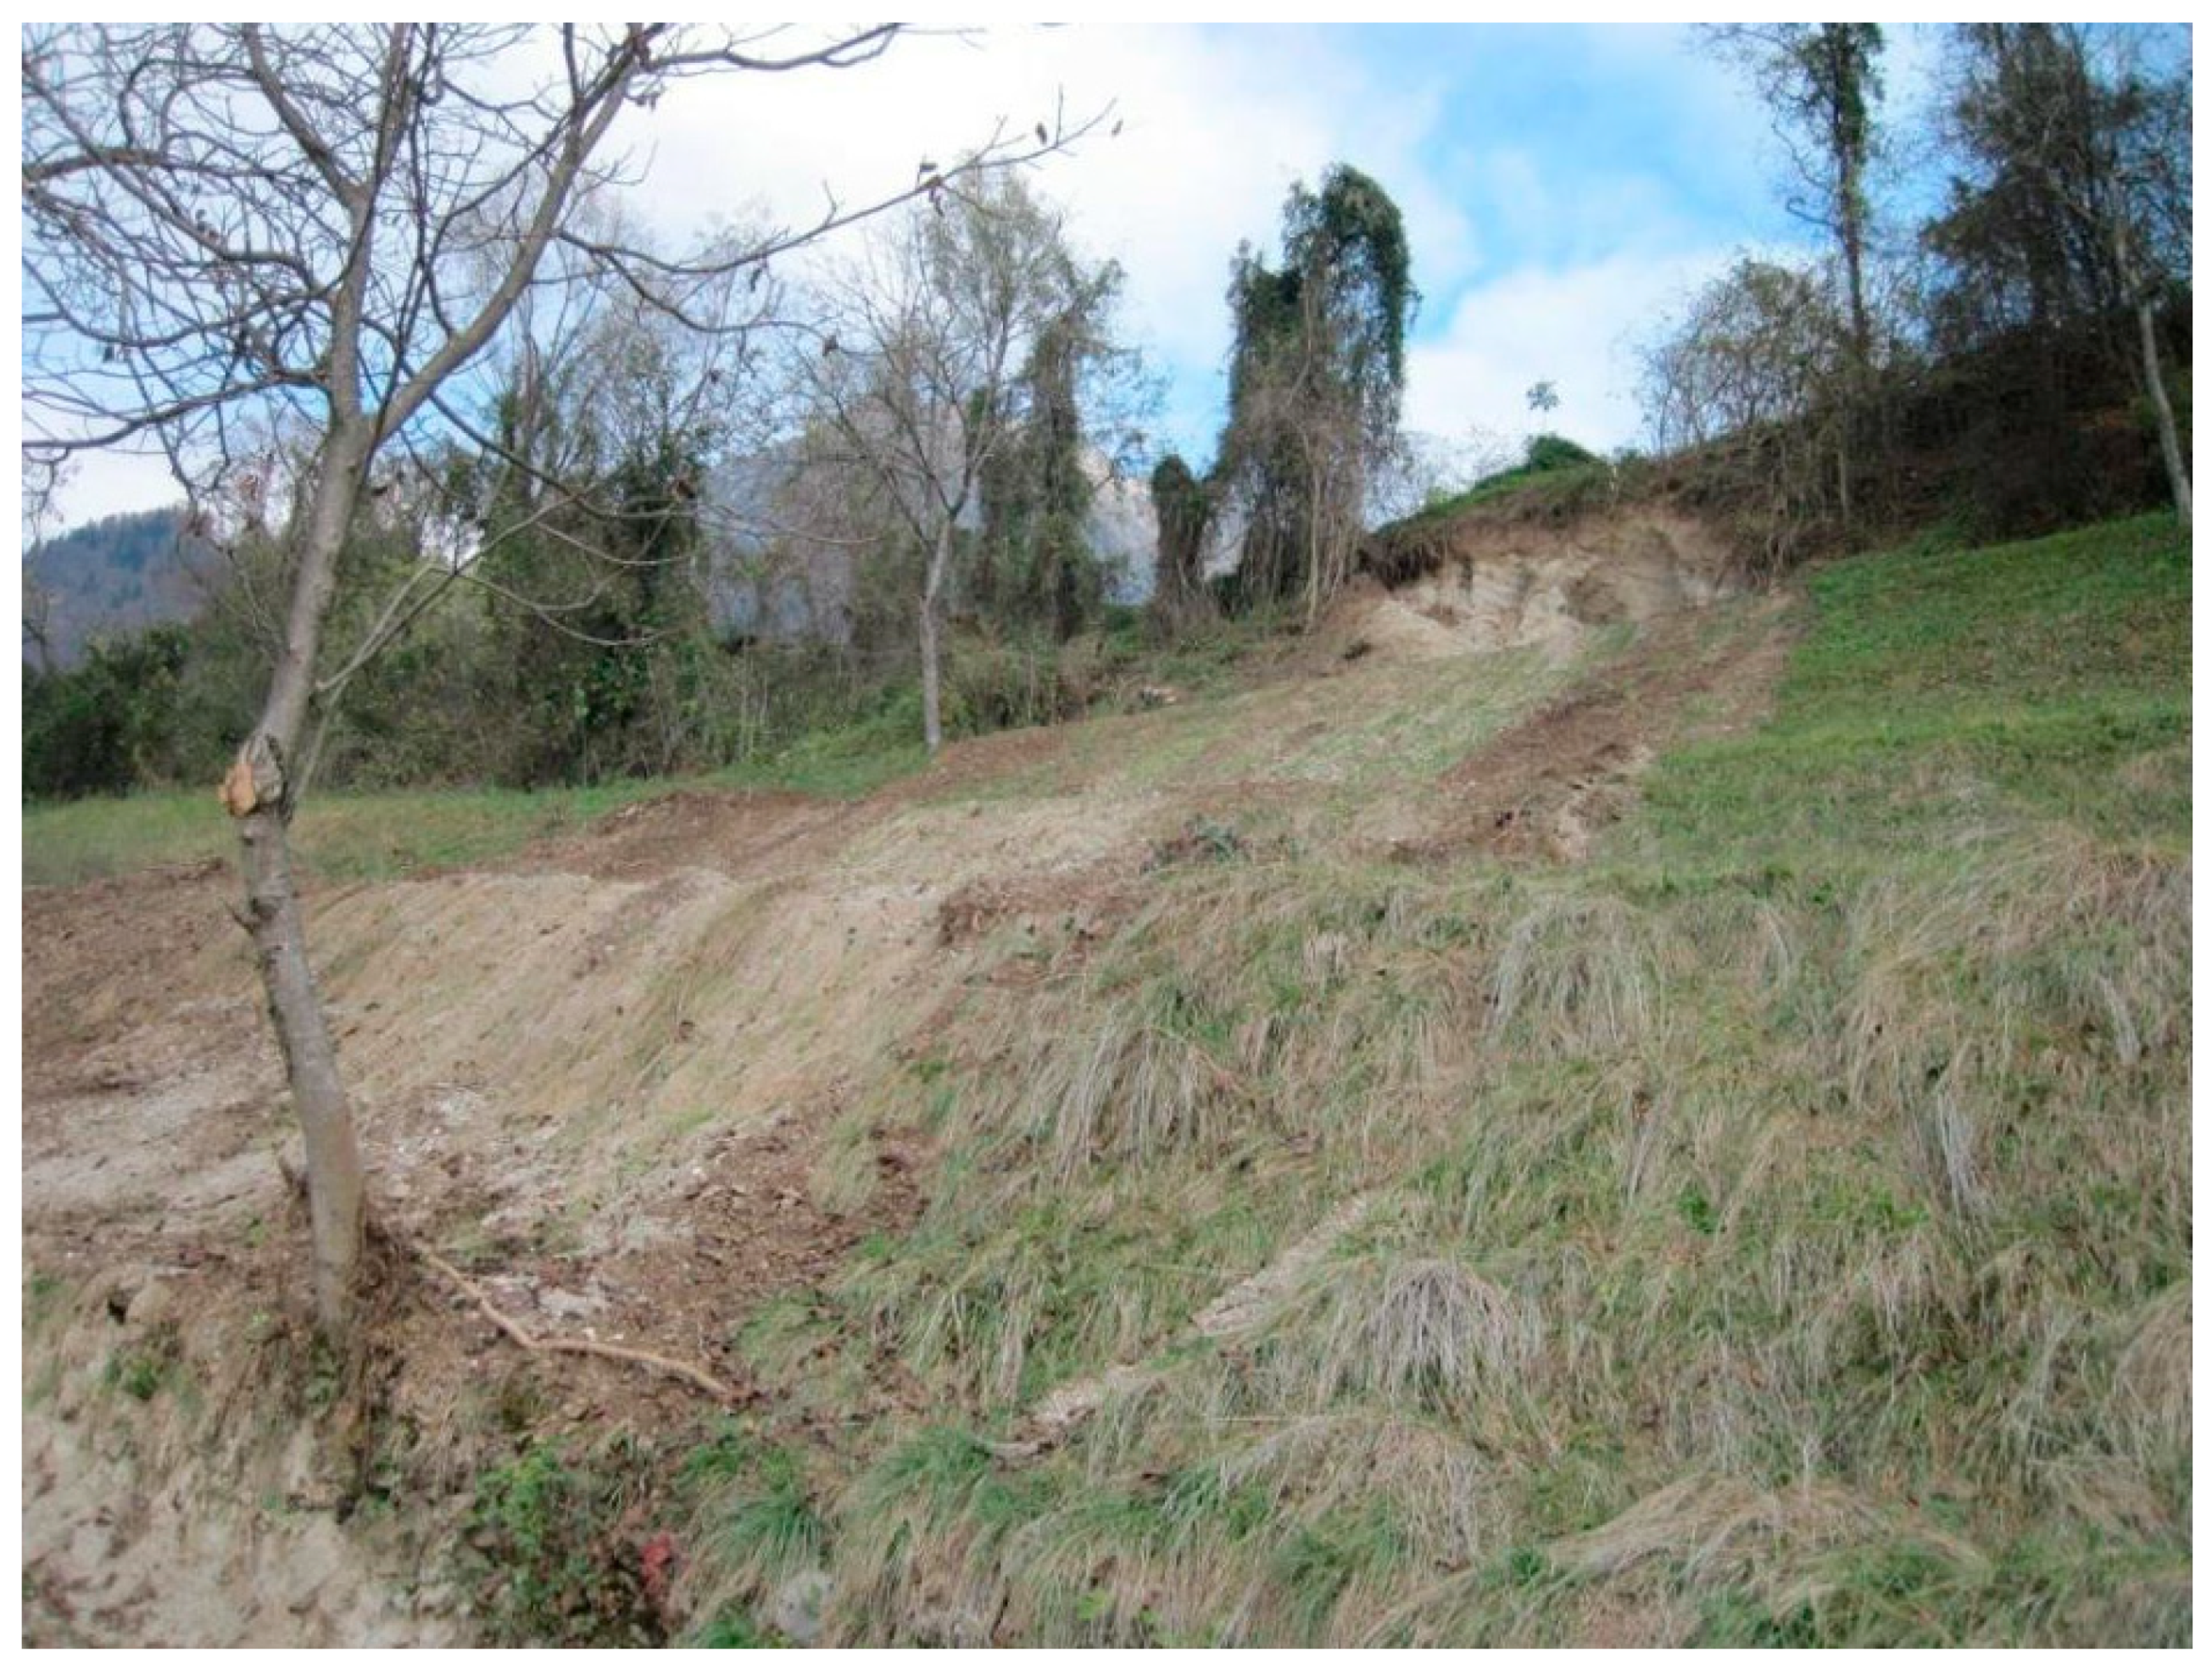
- Code 025021_02c: Rotational slip due to water overpressure, with erosion and debris flow to the underlying road section. Face L = 10 m, H = 5 m, Sp = 2–3 m. These are well-graded sands and gravels of fluvio-glacial origin, very compact and fairly permeable (Figure 4).
- Code 025021_03c: Rotational sliding with retrogressive evolution due to water concentration of road water (Figure 5). Landslide in conglomeric and fluvioglacial materials. Face L = 10 m, H = 10 m, Sp = 1–2 m.
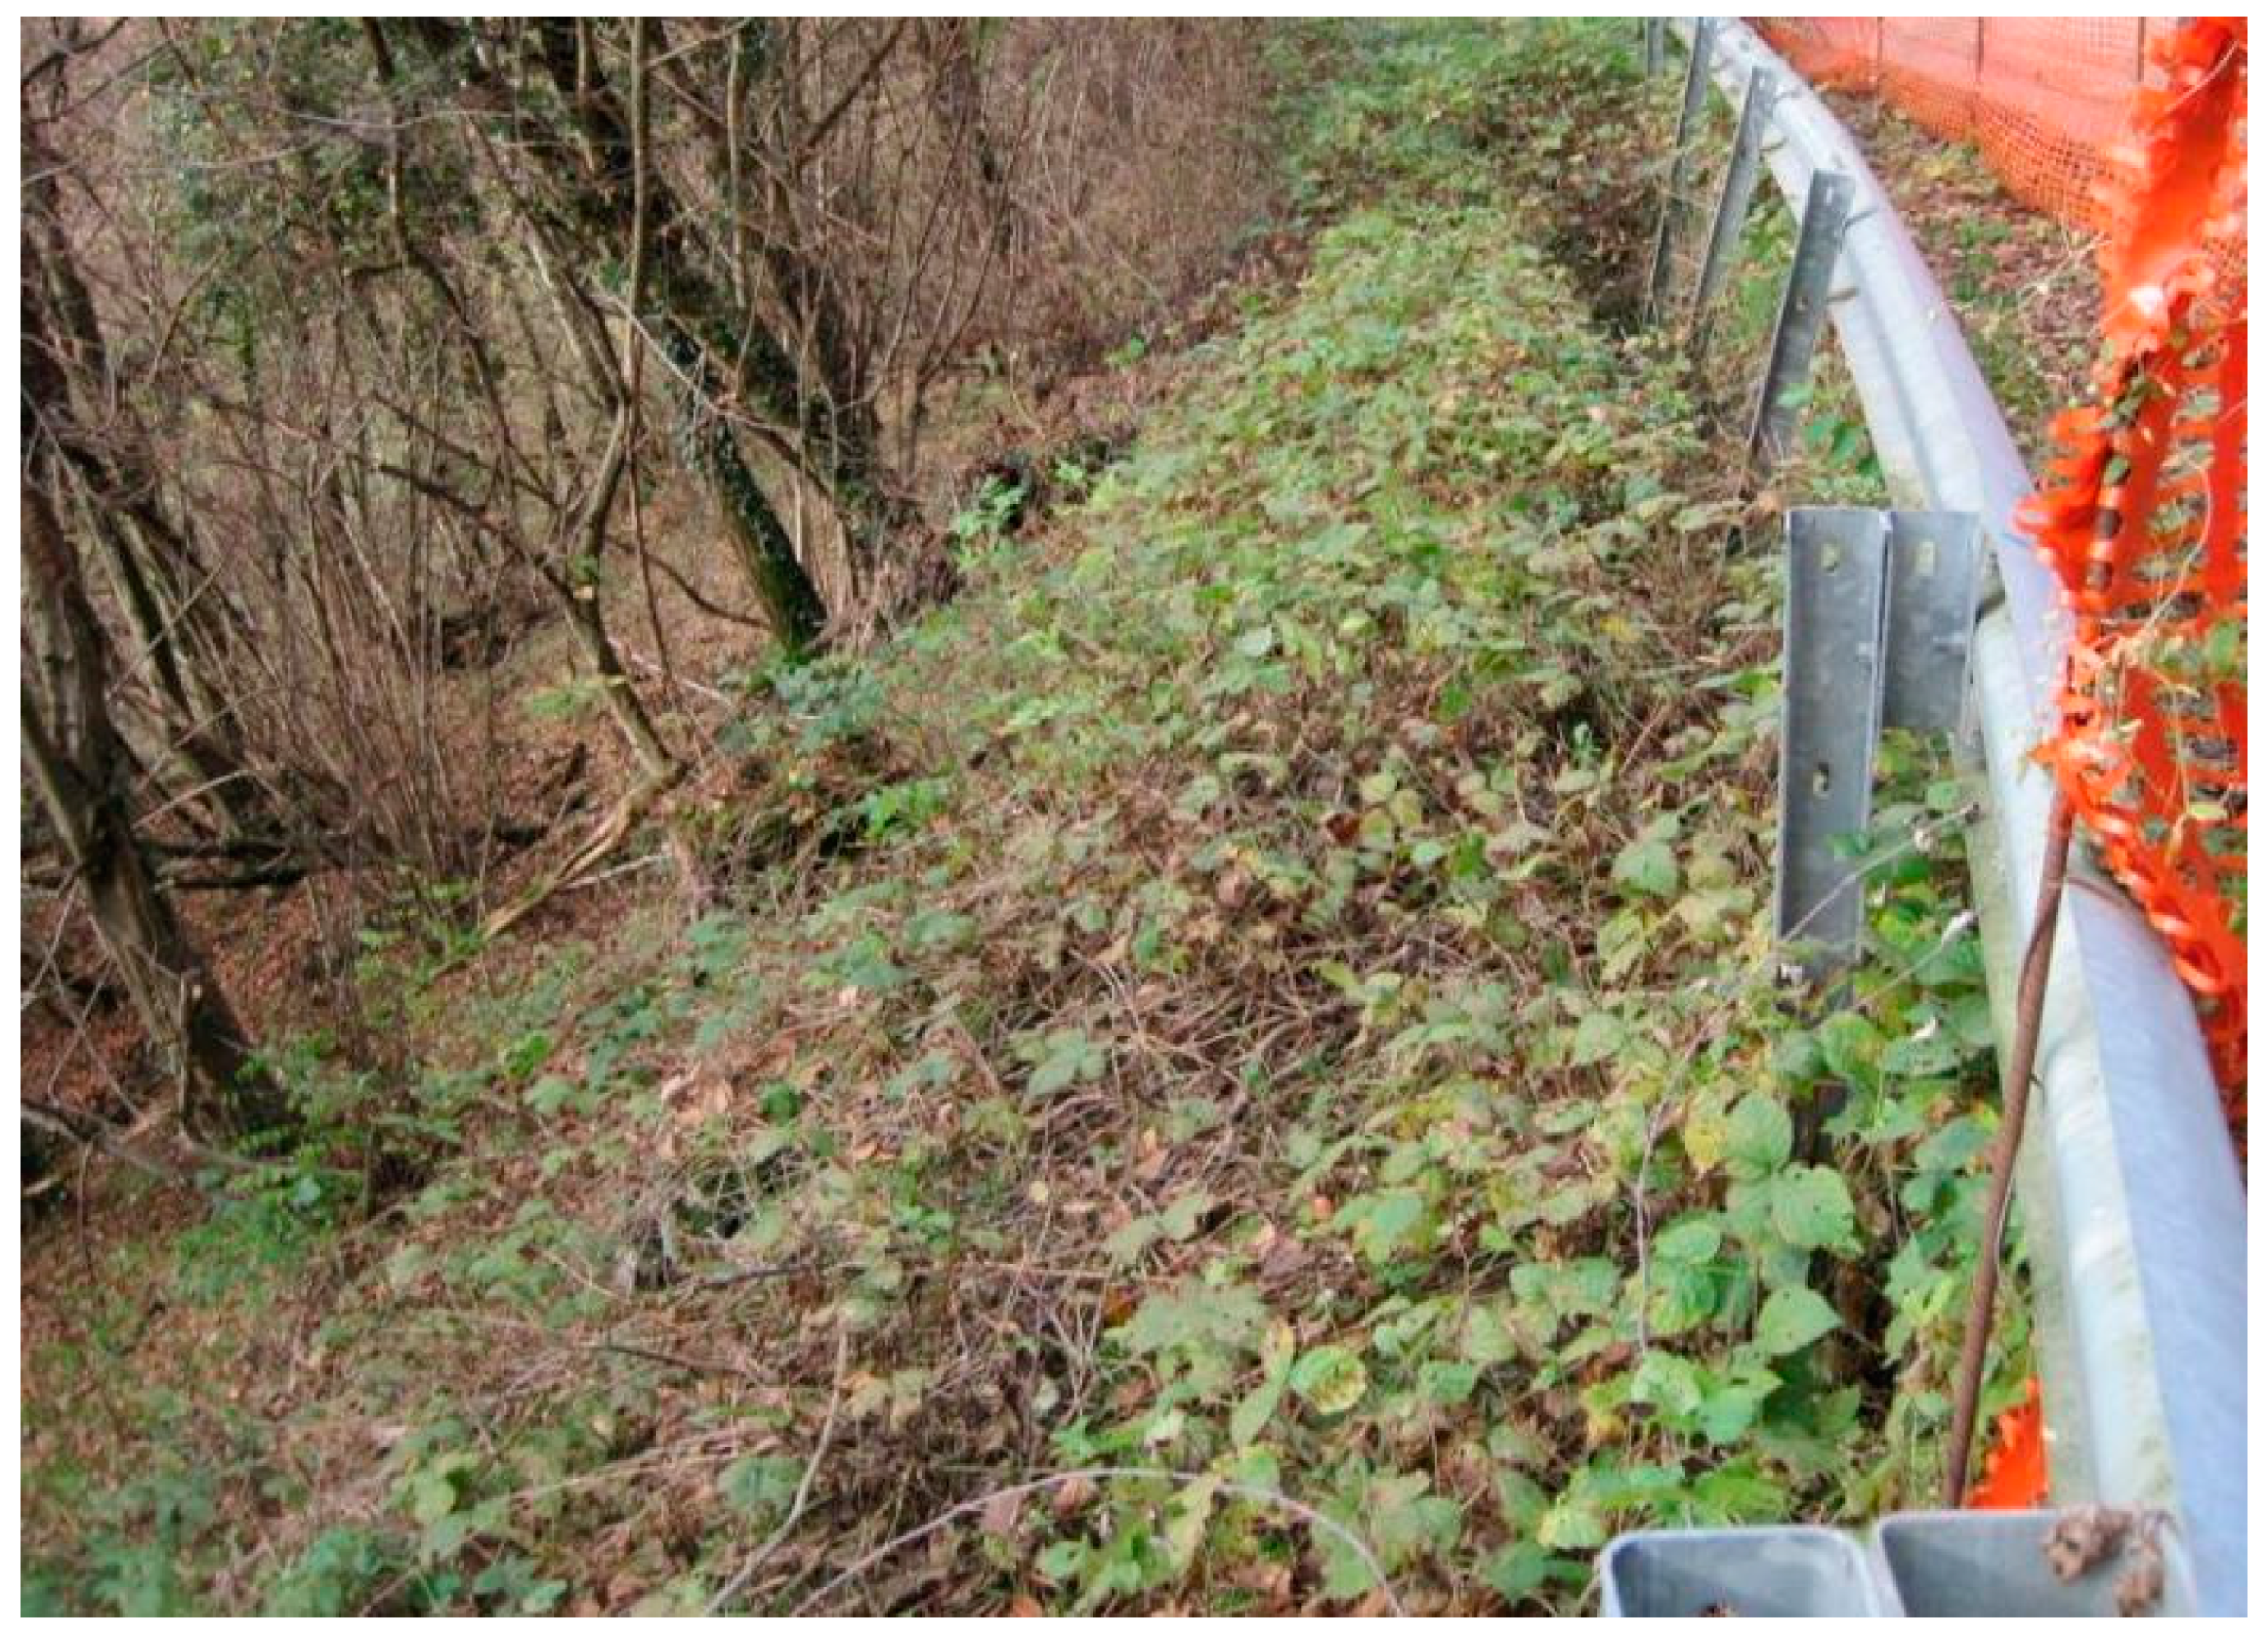
- Code 025021_04c: Landslide of loose cover downstream of the roadway due to over-saturation of soils rich in silty-clay matrix (Figure 6). The roadbed collapsed over a length of approximately 20 m. The gabion walls built in the past have shifted about 1 m downstream.
- Code 025021_05c: This landslide is characterised by two different movements at short distances: one (visible in Figure 7) a rotational sliding landslide, due to water concentration on fluvioglacial materials, with abundant silty–clay matrix and highly variable permeability, the other (Figure 8) a translational sliding landslide affecting a large arenaceous–siltitic mass.
- Code 025021_06c: Rotational slip at a moraine terrace, due to hypodermic water concentrations in the most permeable levels that saturated the material with a high silt–clay matrix (Figure 9). The moraine material is normally overconsolidated, with stable 35–40° slopes. Landslide face L = approx. 20 m, H = 4–5 m, thickness = 1–2 m.
- Code 025021_07c: Landslide of the roadside due to subsurface slope failure caused due to erosion of the river Sonna at the foot. Short slope in loose gravelly materials (Figure 10).
- Code 025021_08c: Sliding landslide of loose cover from water concentration during recent events (Figure 11).
2.4. Landslide Susceptibility Analysis Method
2.5. Tree Felling Susceptibility Analysis Method
3. Results
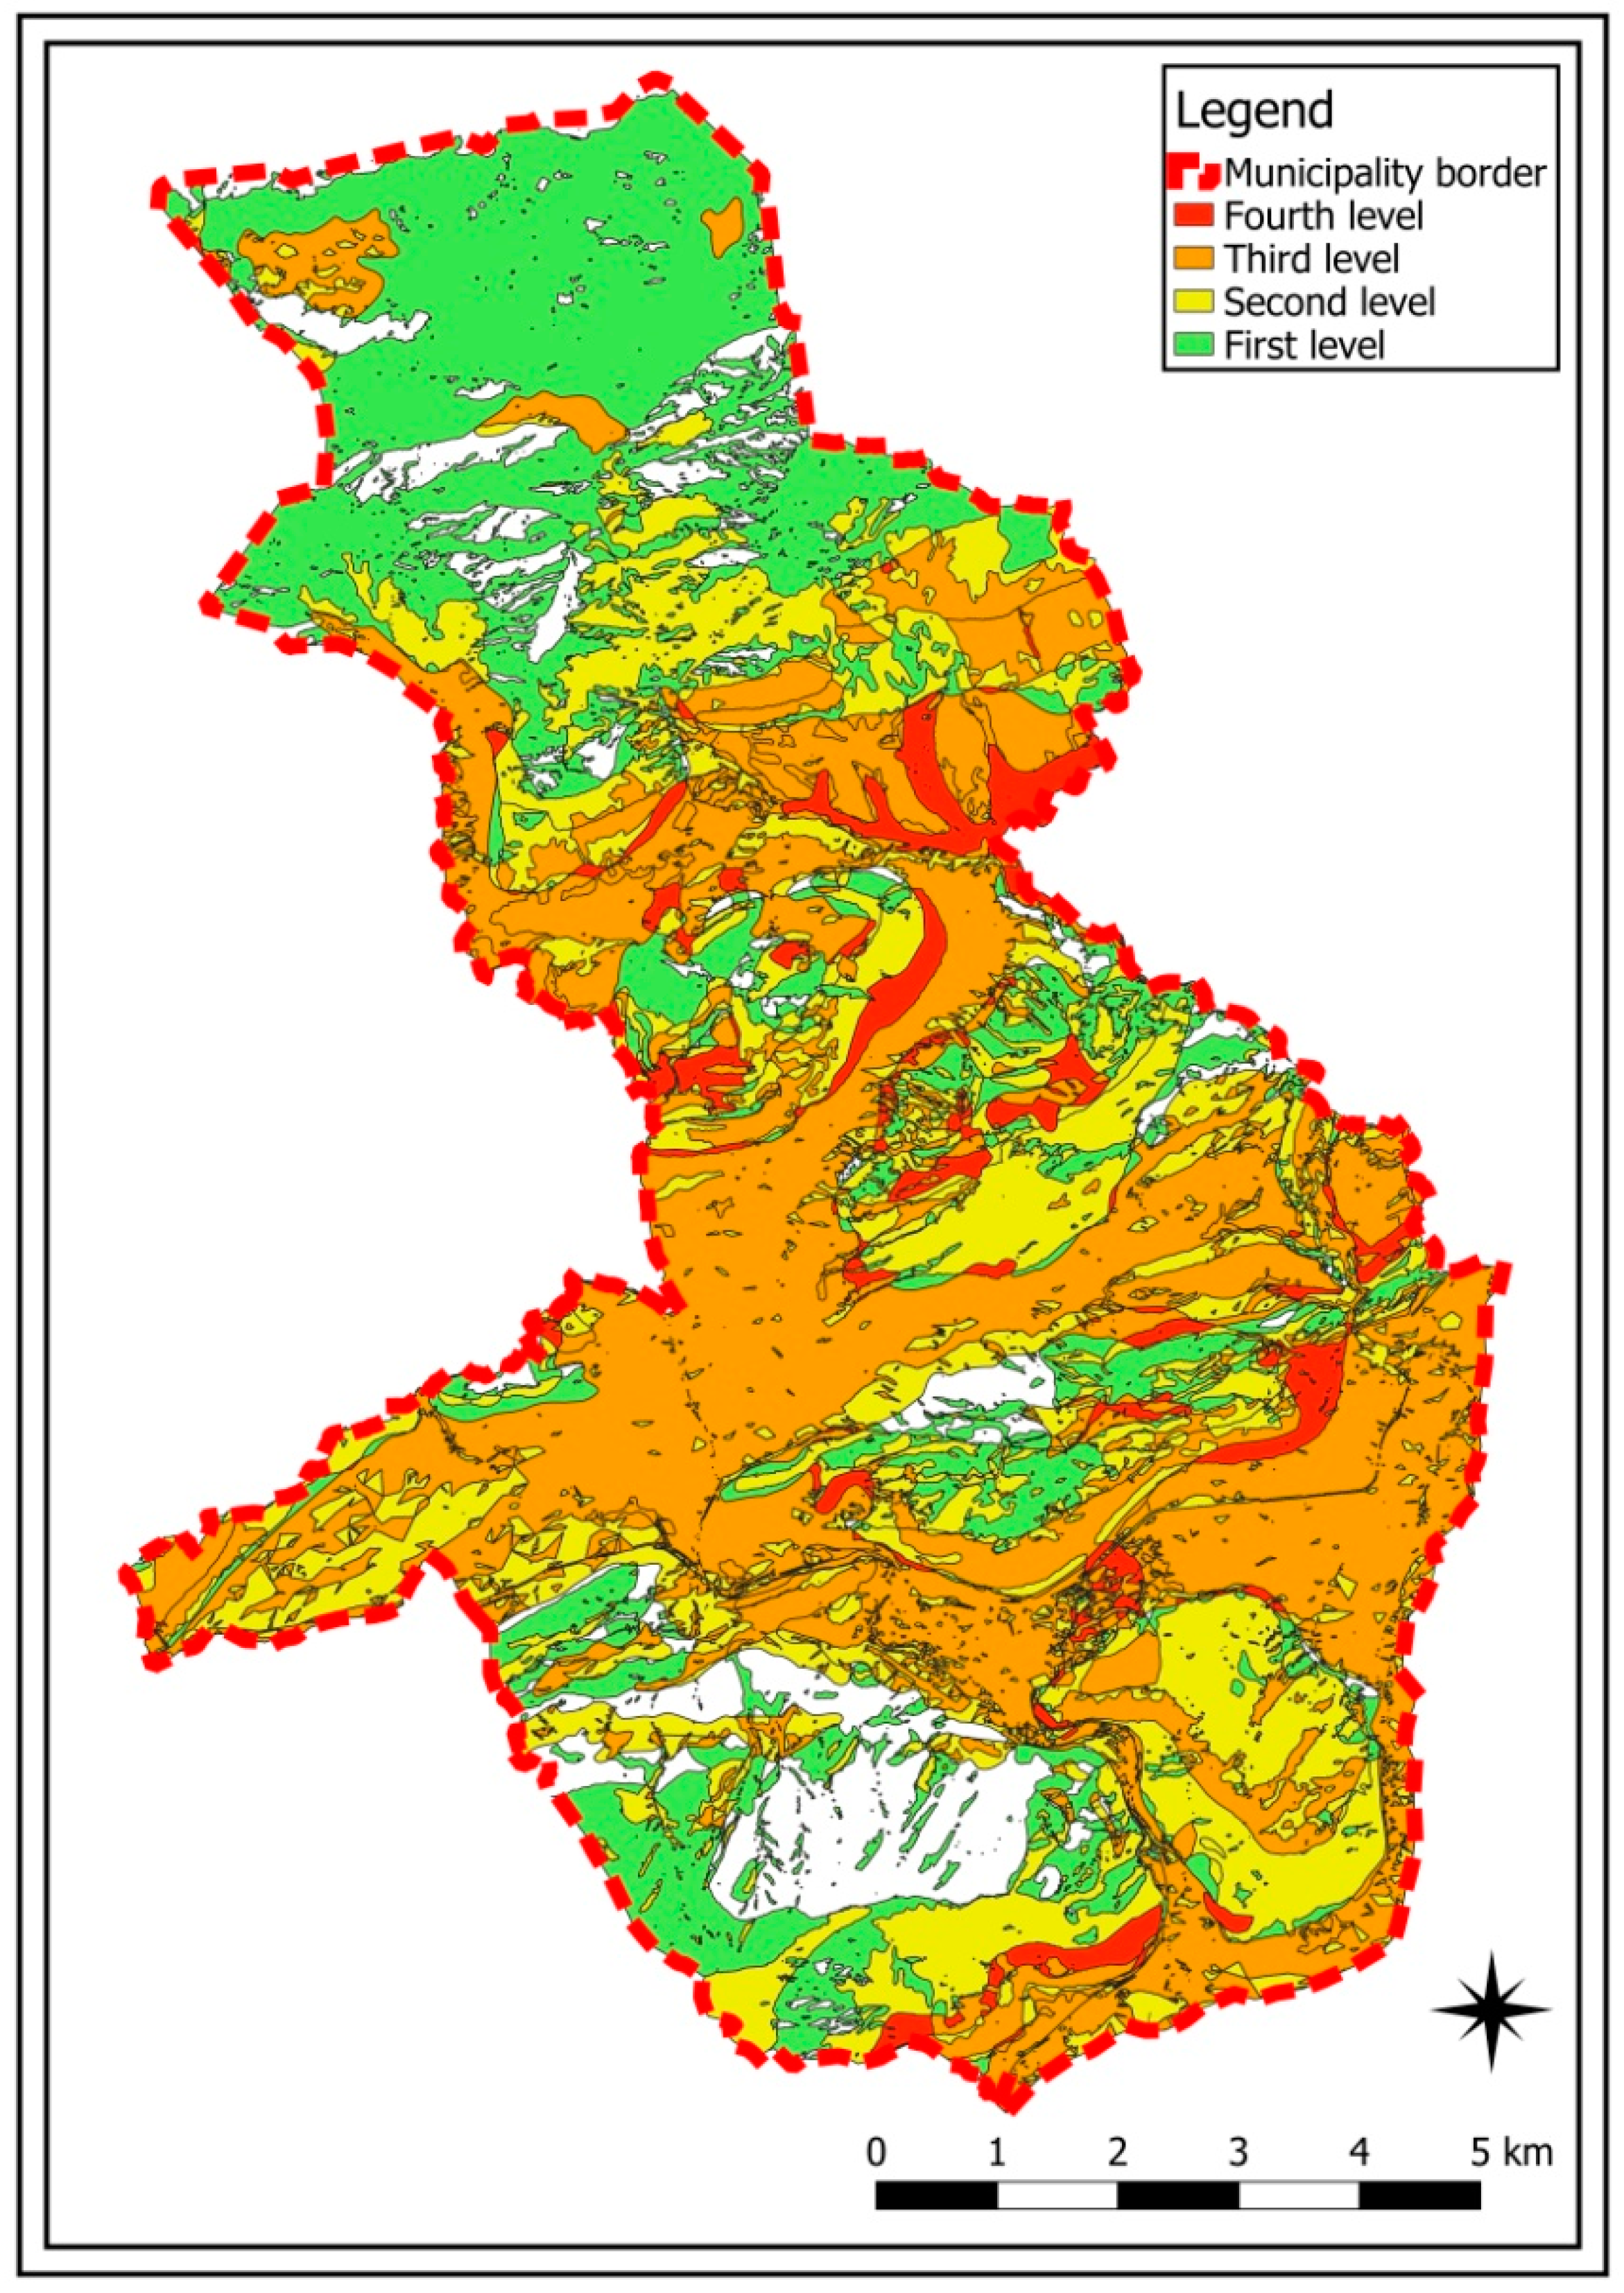
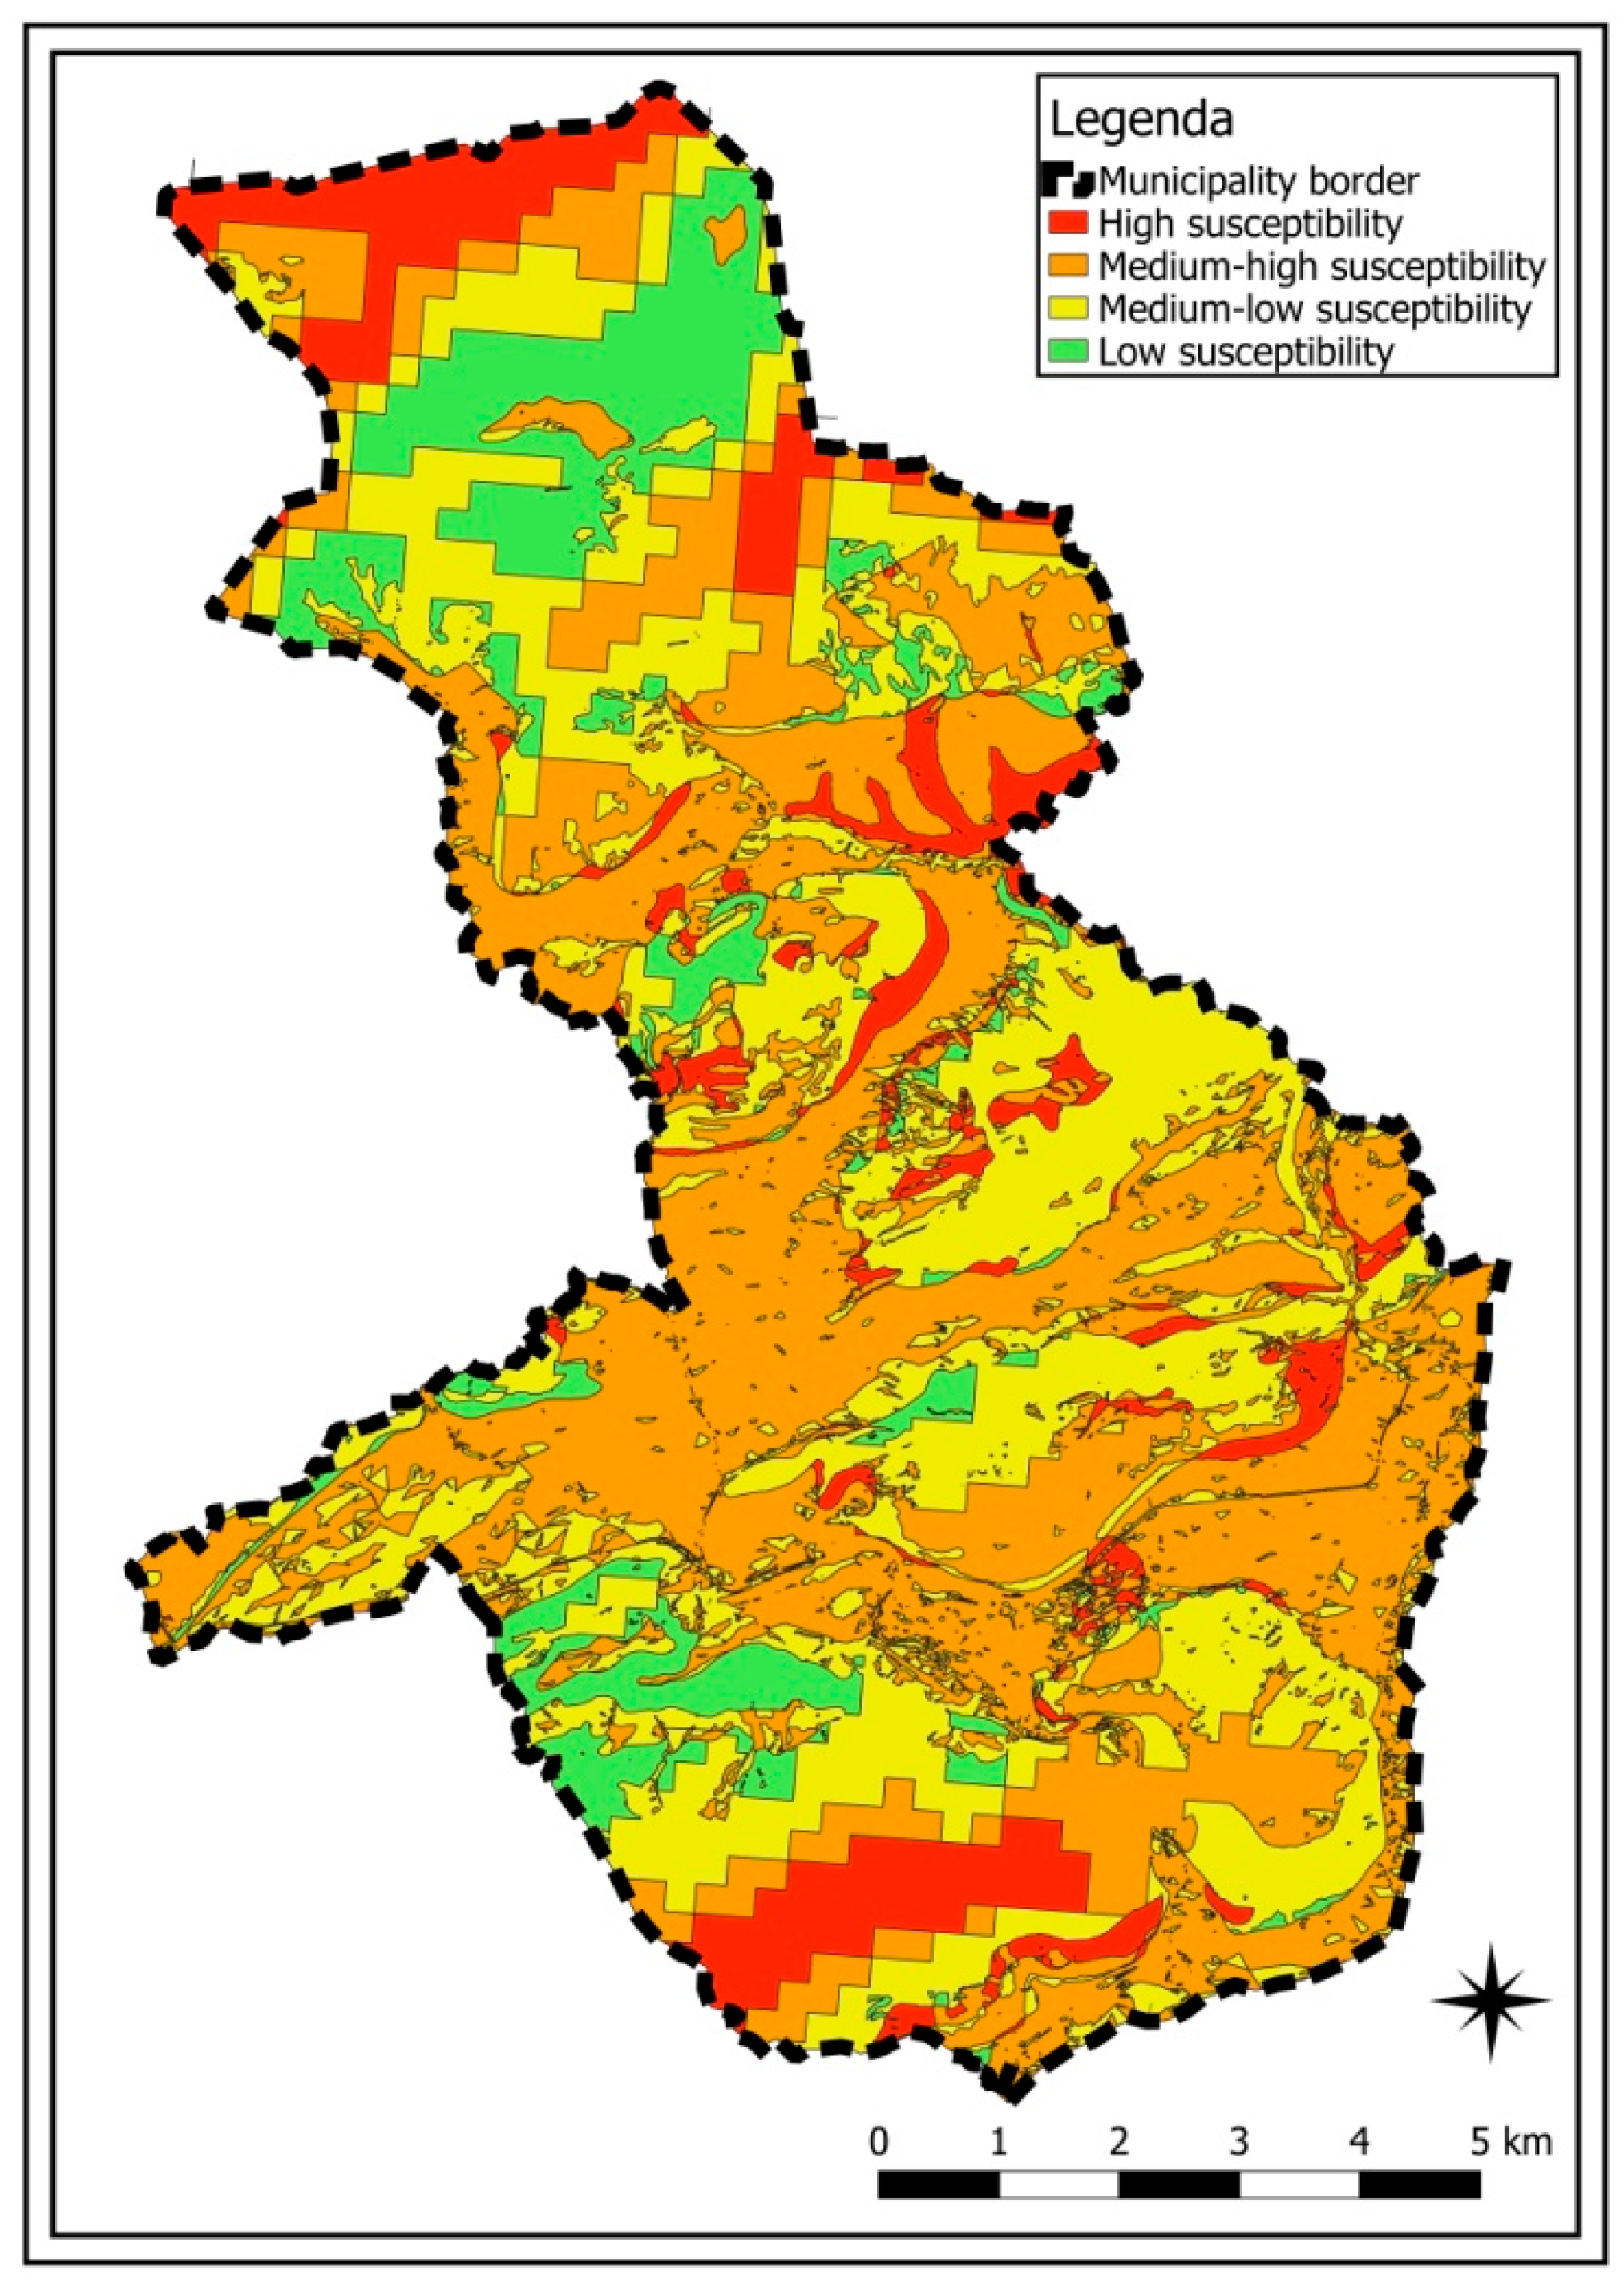
3.1. Landslide Susceptibility Analysis
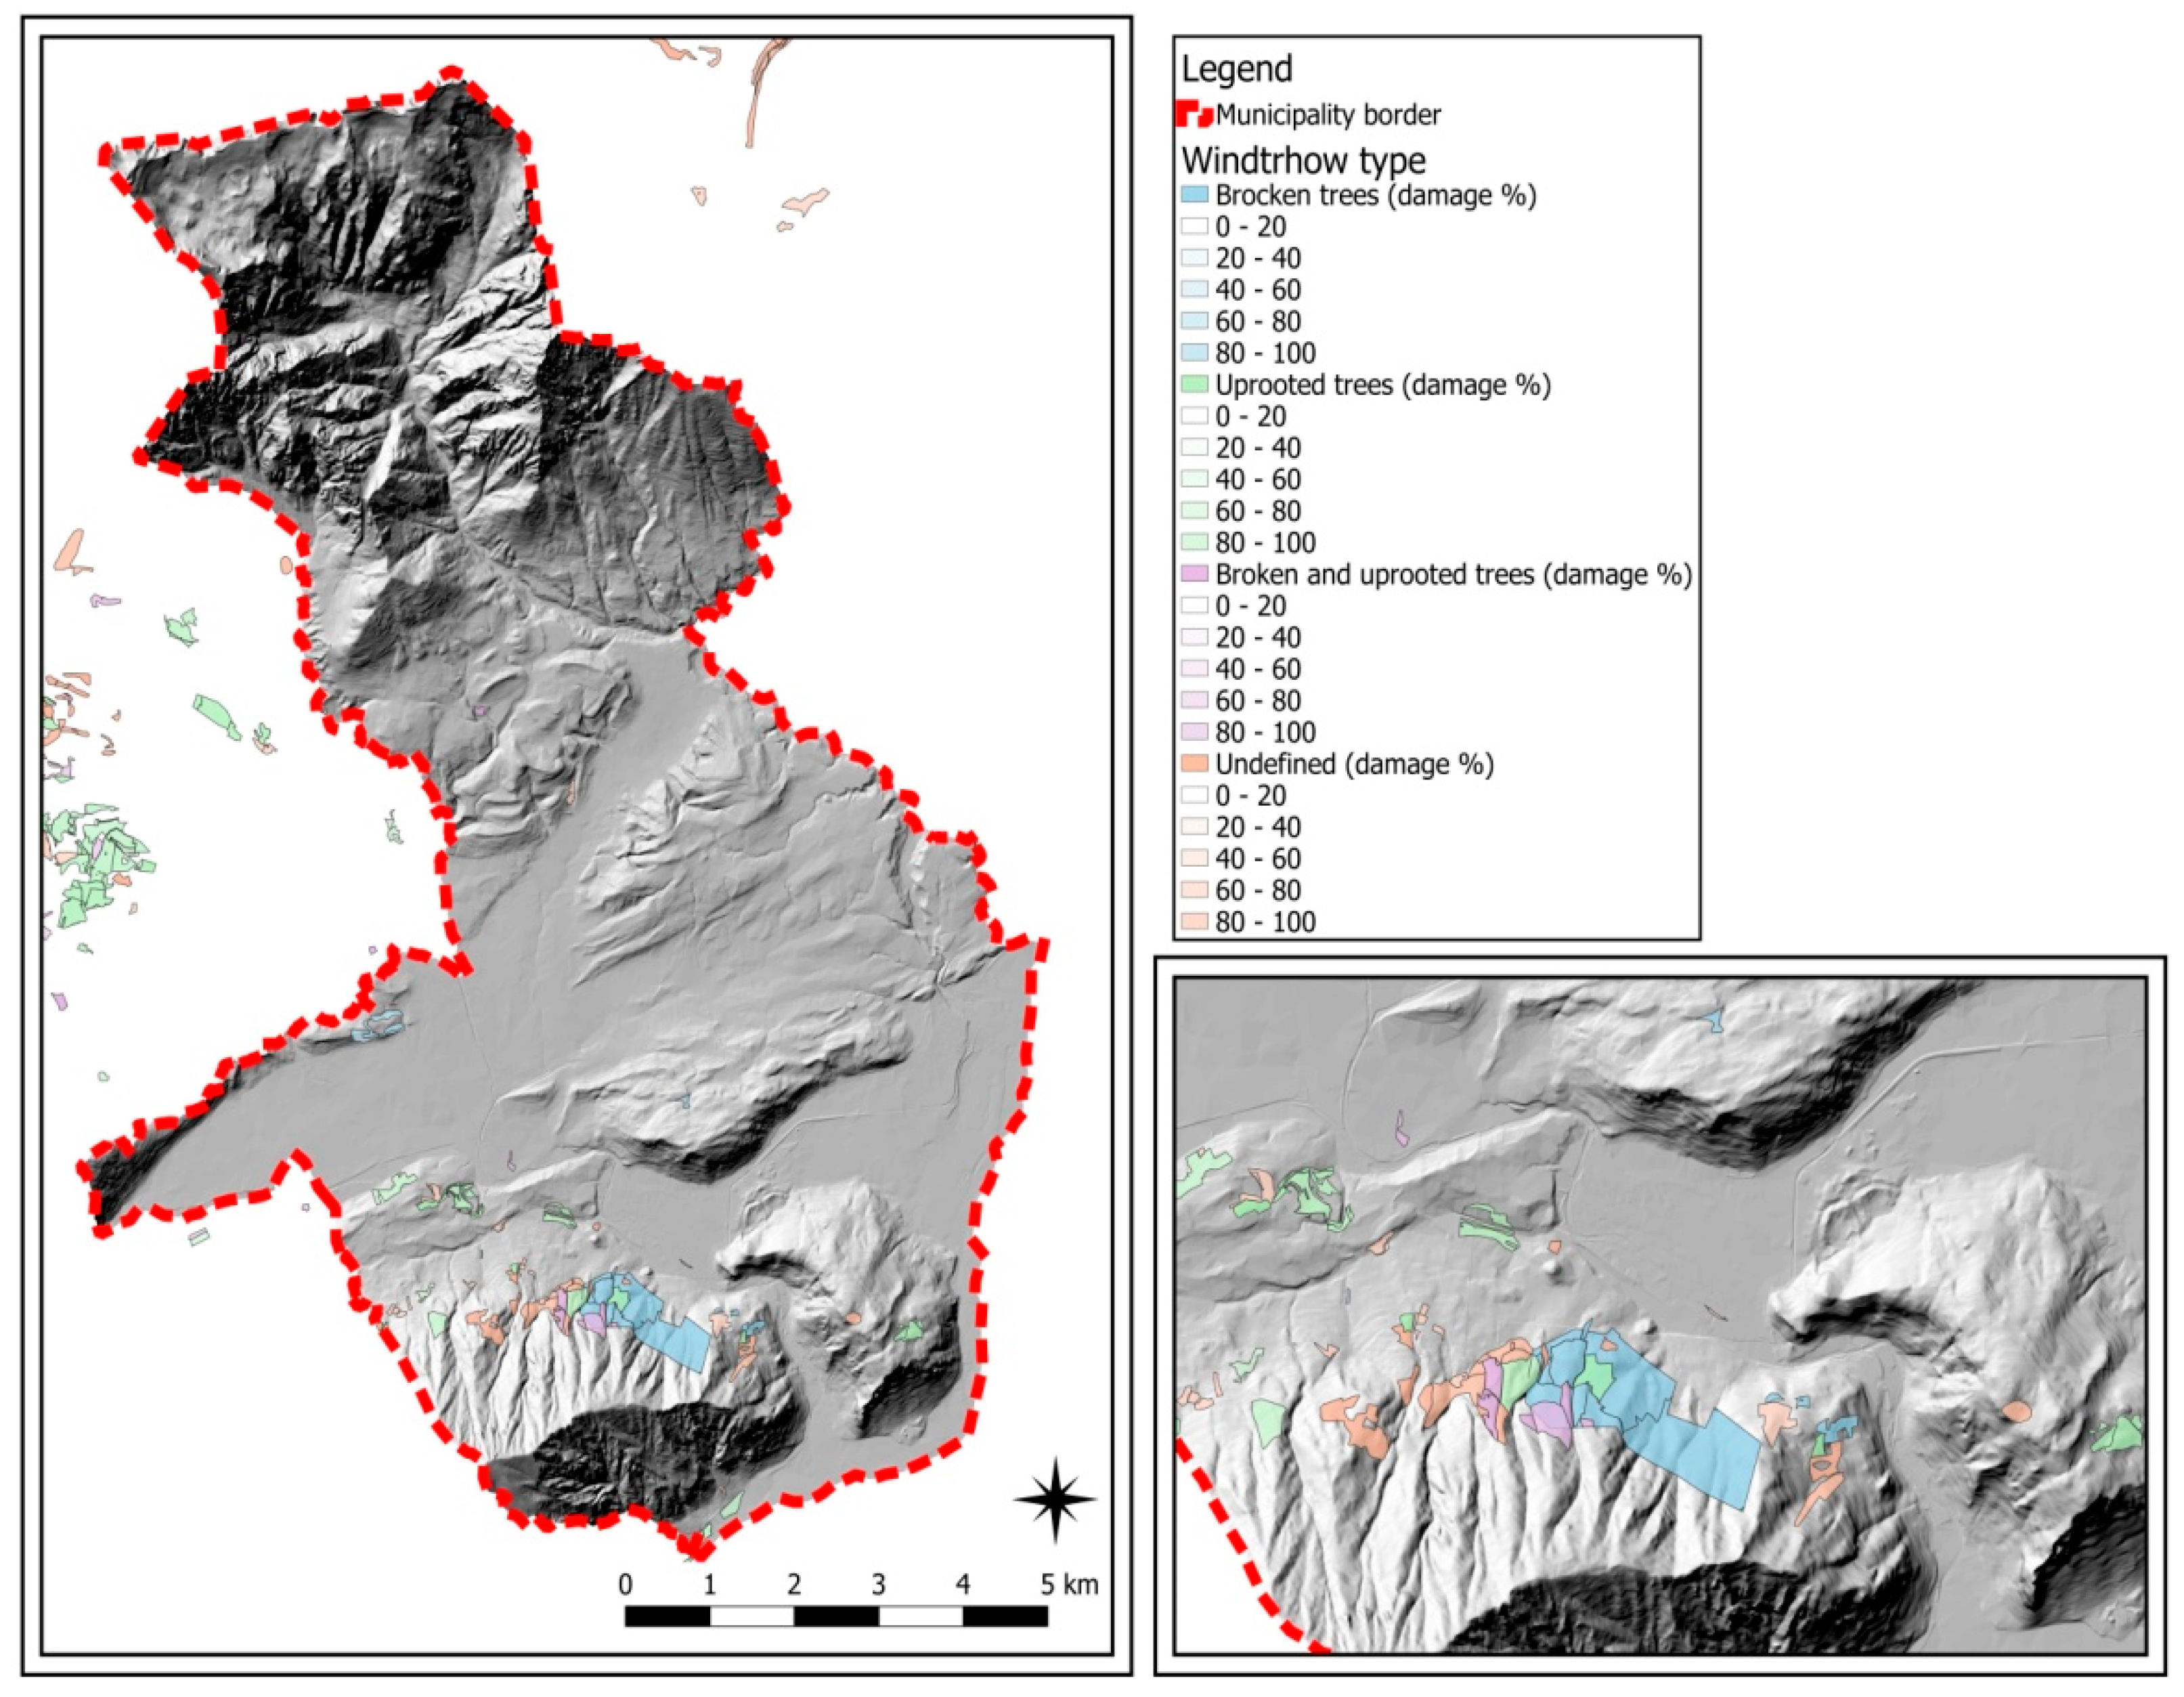
3.2. Analysis of the Susceptibility of Forest Species to Felling
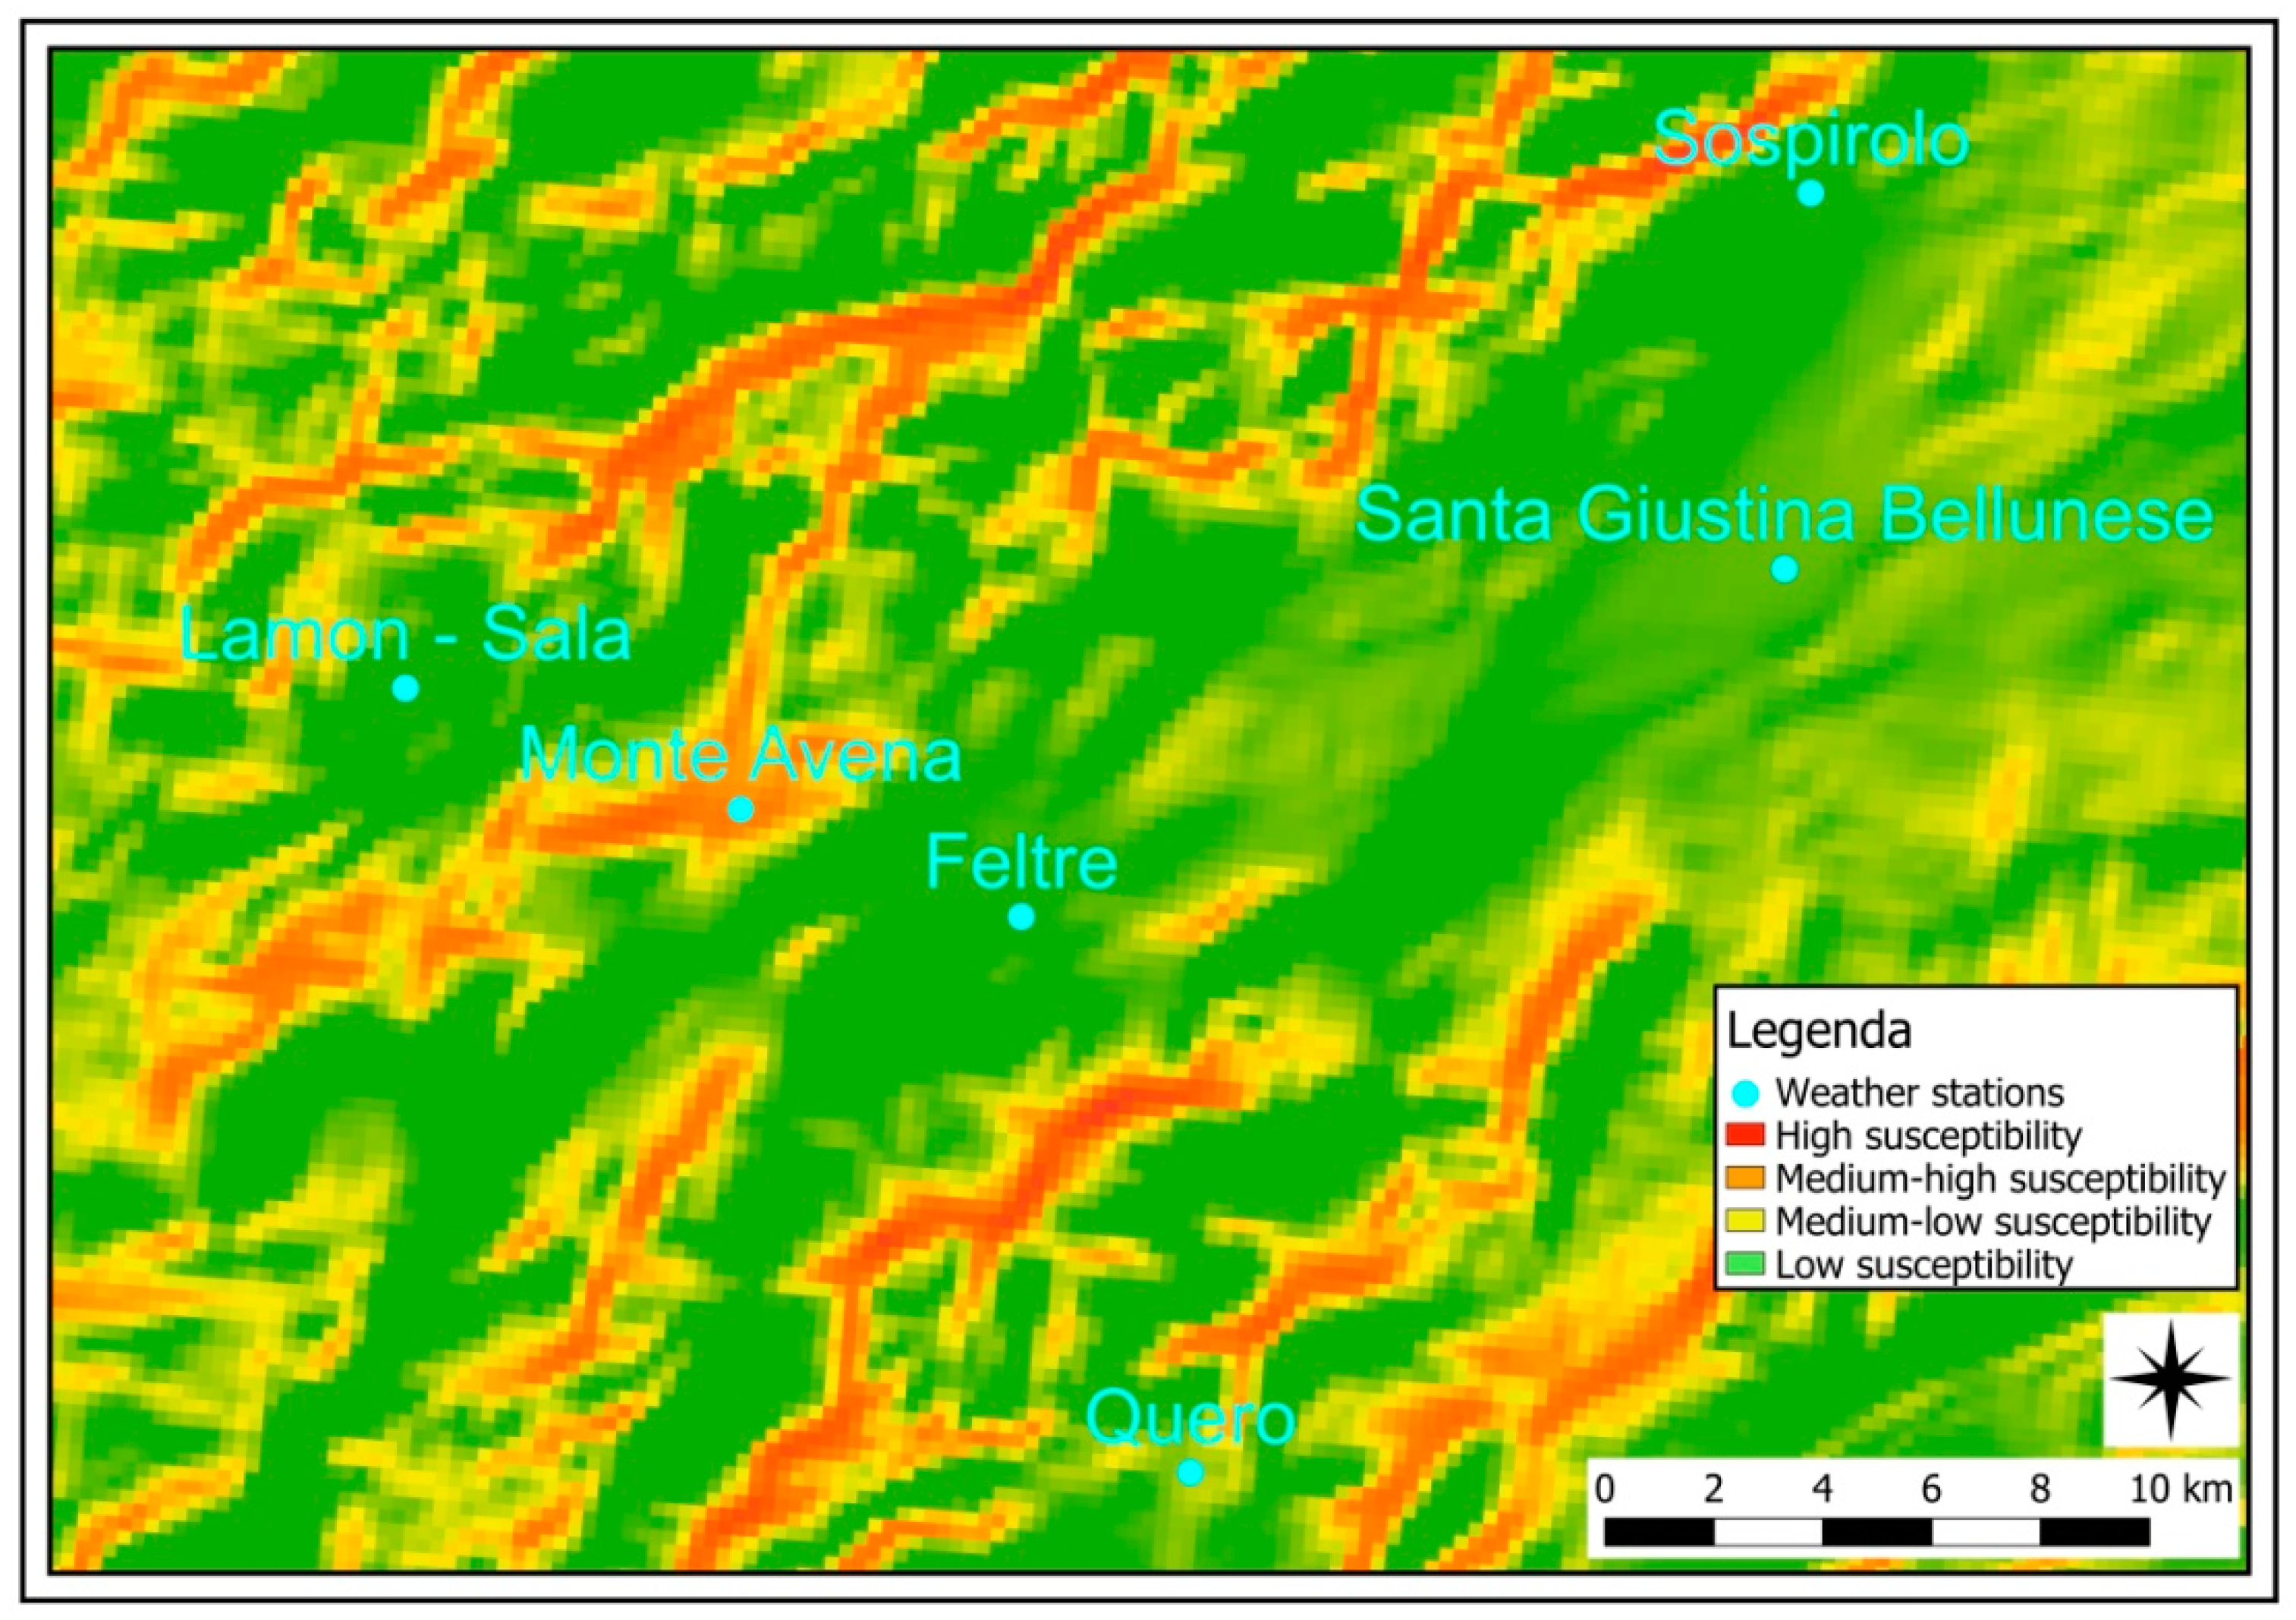
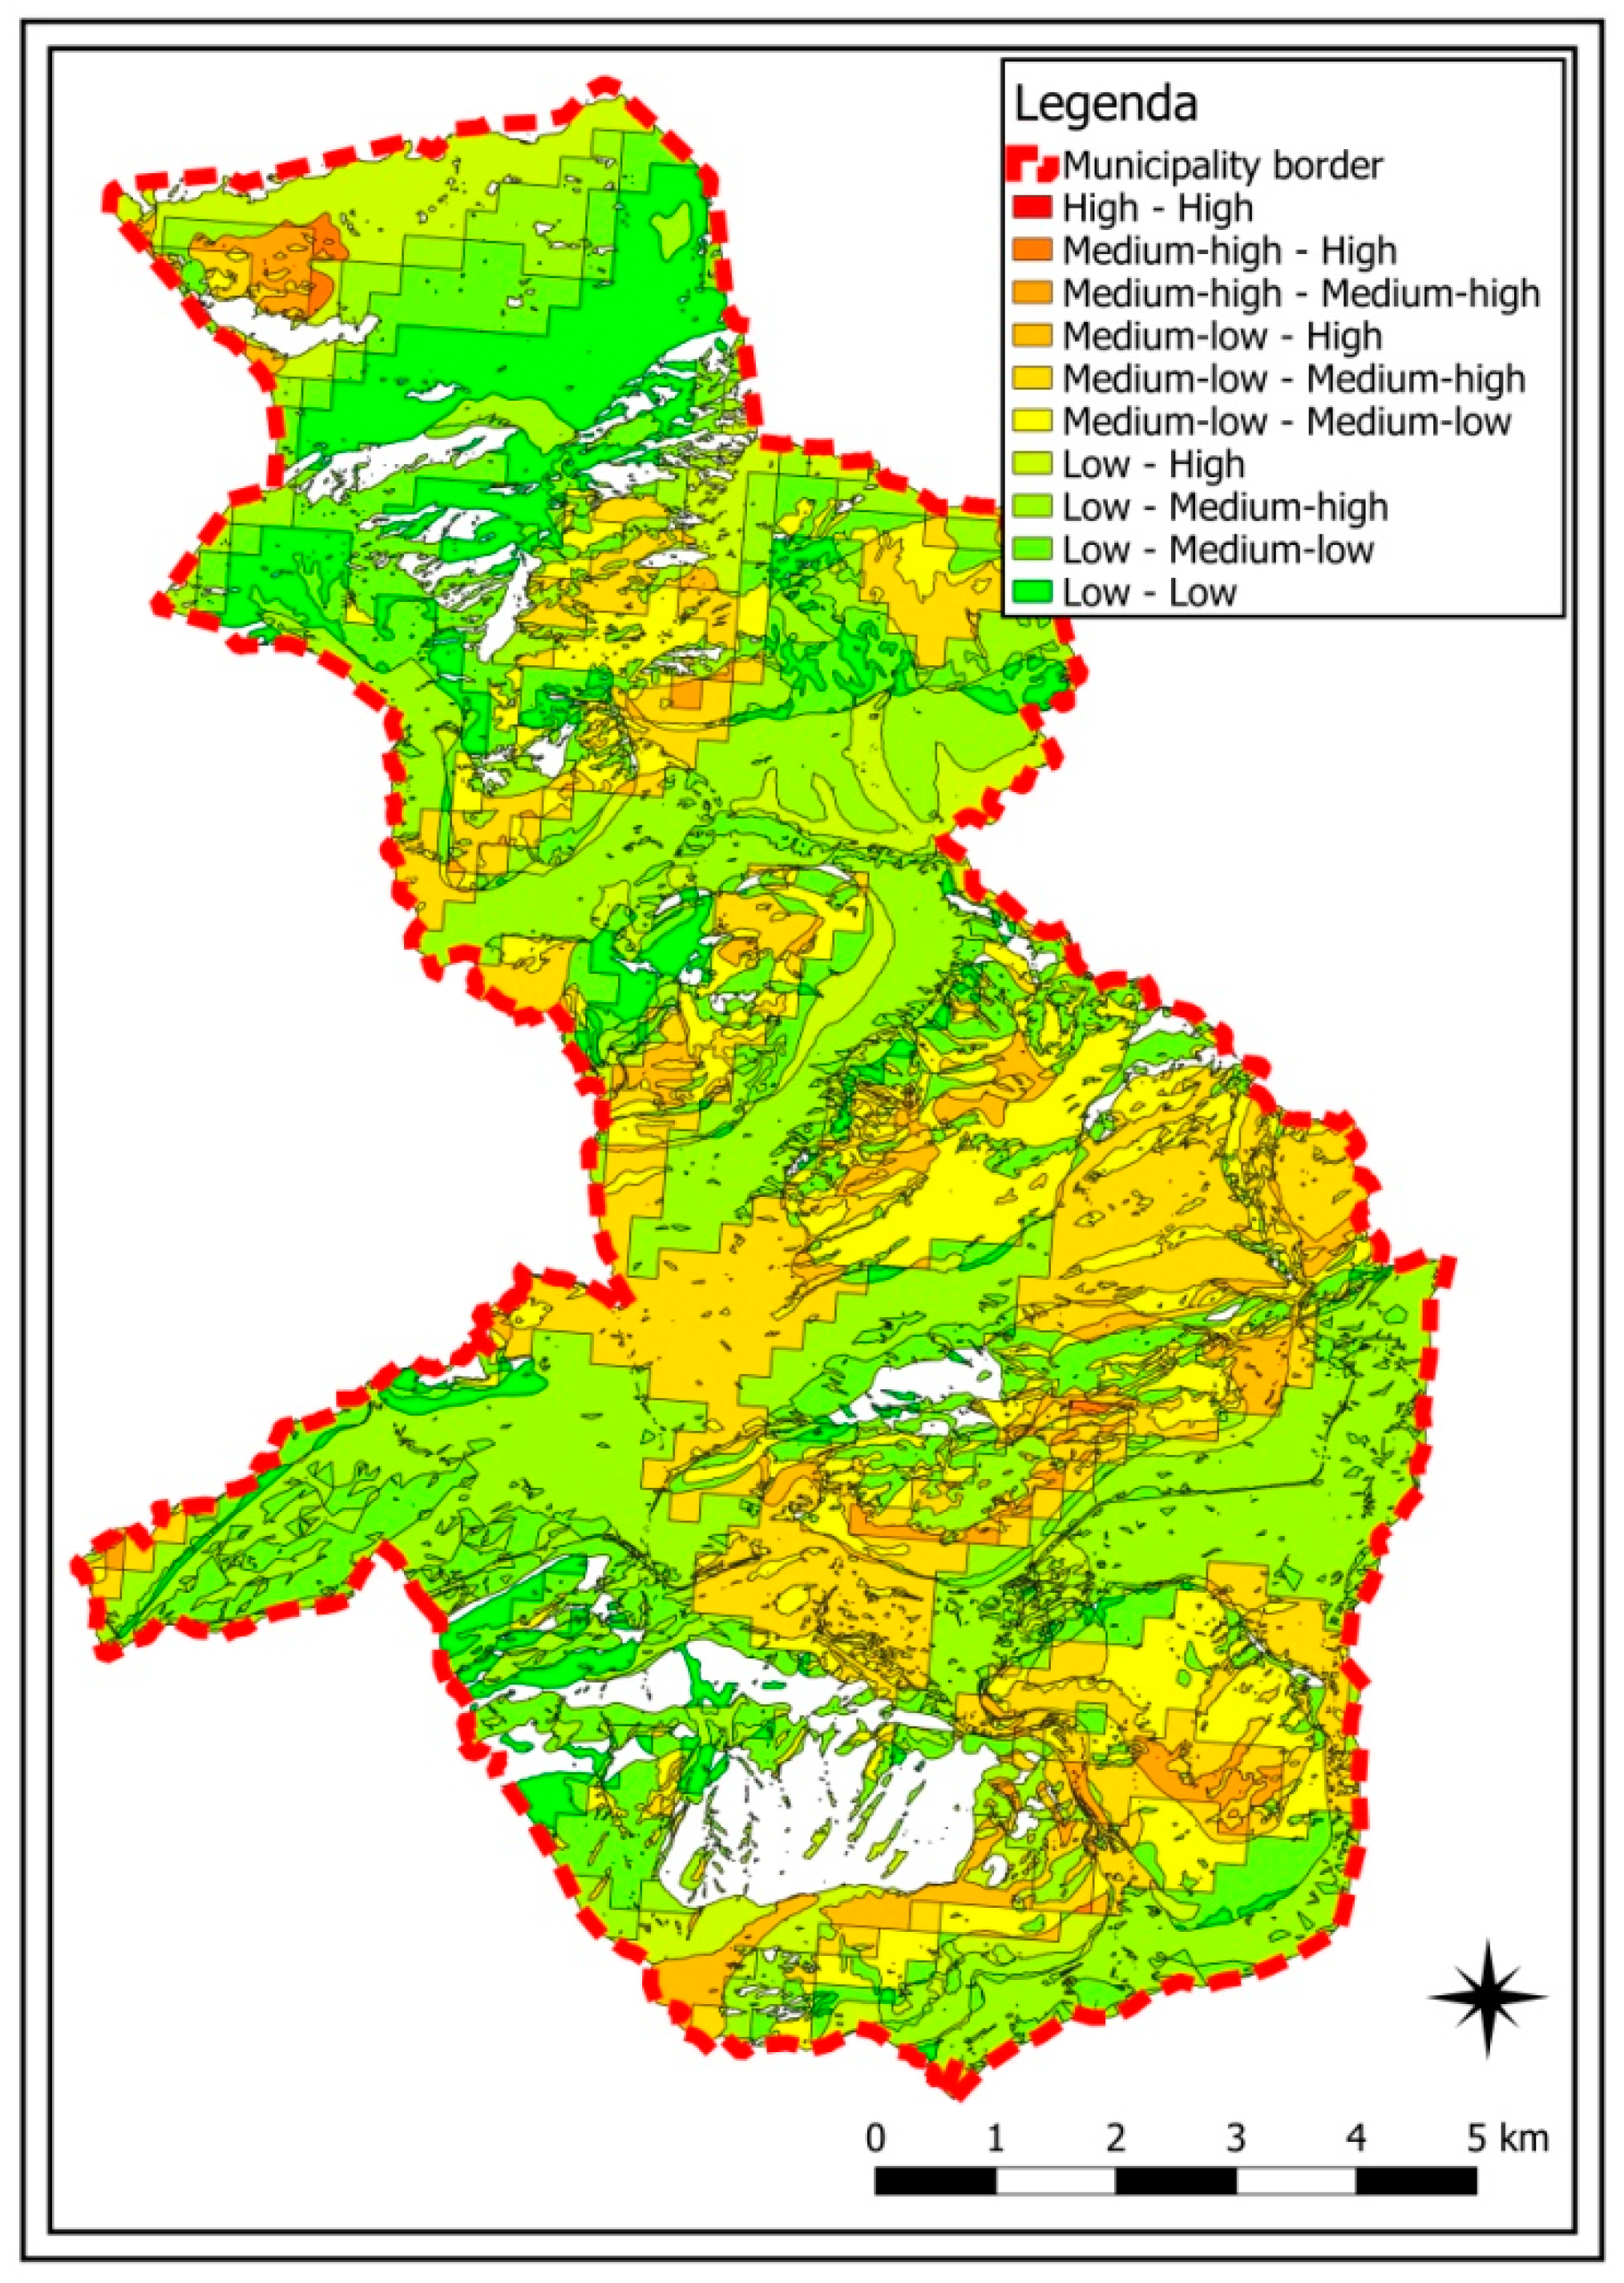
3.3. Susceptibility of the Municipality of Feltre to an Extreme Event
4. Discussion
5. Conclusions
Author Contributions
Funding
Institutional Review Board Statement
Informed Consent Statement
Data Availability Statement
Conflicts of Interest
References
- Rahmstorf, S.; Coumou, D. Increase of extreme events in a warming world. Proc. Natl. Acad. Sci. USA 2011, 108, 17905–17909. [Google Scholar] [CrossRef] [PubMed] [Green Version]
- Gentilucci, M.; Ghanem, M.; Barbieri, M. Statistical Analysis of Wind to Assess Climate Change (Central Italy). In Conference of the Arabian Journal of Geosciences; Springer: Berlin/Heidelberg, Germany, 2019; pp. 11–13. [Google Scholar]
- Hwang, Y.T.; Frierson, D.M. Increasing atmospheric poleward energy transport with global warming. Geophys. Res. Lett. 2010, 37, L24807. [Google Scholar] [CrossRef]
- Pithan, F.; Svensson, G.; Caballero, R.; Chechin, D.; Cronin, T.; Ekman, A.M.; Neggers, R.; Shupe, M.; Solomon, A.; Tjernstrom, M.; et al. Role of air-mass transformations in exchange between the Arctic and mid-latitudes. Nat. Geosci. 2018, 11, 805–812. [Google Scholar] [CrossRef]
- Trinh, M.T.; Lee, G.; Oh, S.; Nguyen, T.H.V. Effect of extreme rainfall on cut slope stability: Case study in Yen Bai City, Viet Nam. J. Korean GEO-Environ. Soc. 2015, 16, 23–32. [Google Scholar]
- Wong, J.L.; Lee, M.L.; Teo, F.Y.; Liew, K.W. A Review of Impacts of Climate Change on Slope Stability. In Climate Change and Water Security. Lecture Notes in Civil Engineering; Kolathayar, S., Mondal, A., Chian, S.C., Eds.; Springer: Singapore, 2022; Volume 178. [Google Scholar]
- Zimmerman, J.K.; Everham III, E.M.; Waide, R.B.; Lodge, D.J.; Taylor, C.M.; Brokaw, N.V. Responses of tree species to hurricane winds in subtropical wet forest in Puerto Rico: Implications for tropical tree life histories. J. Ecol. 1994, 82, 911–922. [Google Scholar] [CrossRef]
- Rossi, G.; Cancelliere, A. Managing drought risk in water supply systems in Europe: A review. Int. J. Water Resour. Dev. 2013, 29, 272–289. [Google Scholar] [CrossRef]
- Rosenzweig, C.; Tubiello, F.N.; Goldberg, R.; Mills, E.; Bloomfield, J. Increased crop damage in the US from excess precipitation under climate change. Glob. Environ. Chang. 2002, 12, 197–202. [Google Scholar] [CrossRef] [Green Version]
- Gentilucci, M.; Barbieri, M.; Burt, P. Climate and territorial suitability for the Vineyards developed using GIS techniques. In Conference of the Arabian Journal of Geosciences; Springer: Berlin/Heidelberg, Germany, 2018; pp. 11–13. [Google Scholar]
- Gentilucci, M.; Moustafa, A.A.; Abdel-Gawad, F.K.; Mansour, S.R.; Coppola, M.R.; Caserta, L.; Inglese, S.; Pambianchi, G.; Guerriero, G. Advances in Egyptian mediterranean coast climate change monitoring. Water 2021, 13, 1870. [Google Scholar] [CrossRef]
- Ayalew, L.; Yamagishi, H. The application of GIS-based logistic regression for landslide susceptibility mapping in the Kakuda-Yahiko Mountains, Central Japan. Geomorphology 2005, 65, 15–31. [Google Scholar] [CrossRef]
- Wang, Y.; Fang, Z.; Hong, H. Comparison of convolutional neural networks for landslide susceptibility mapping in Yanshan County. China. Sci. Total Environ. 2019, 666, 975–993. [Google Scholar] [CrossRef]
- Shit, P.K.; Bhunia, G.S.; Maiti, R. Potential landslide susceptibility mapping using weighted overlay model (WOM). Model. Earth Syst. Environ. 2016, 2, 21. [Google Scholar] [CrossRef]
- Goyes-Peñafiel, P.; Hernandez-Rojas, A. Landslide susceptibility index based on the integration of logistic regression and weights of evidence: A case study in Popayan, Colombia. Eng. Geol. 2021, 280, 105958. [Google Scholar] [CrossRef]
- Gentilucci, M.; Materazzi, M.; Pambianchi, G. Statistical Analysis of Landslide Susceptibility, Macerata Province (Central Italy). Hydrology 2021, 8, 5. [Google Scholar] [CrossRef]
- Marjanović, M.; Kovačević, M.; Bajat, B.; Voženílek, V. Landslide susceptibility assessment using SVM machine learning algorithm. Eng. Geol. 2011, 123, 225–234. [Google Scholar] [CrossRef]
- Gassner, C.; Promper, C.; Beguería, S.; Glade, T. Climate change impact for spatial landslide susceptibility. In Engineering Geology for Society and Territory; Springer: Berlin/Heidelberg, Germany, 2015; Volume 1, pp. 429–433. [Google Scholar]
- Sabatakakis, N.; Koukis, G.; Vassiliades, E.; Lainas, S. Landslide susceptibility zonation in Greece. Nat. Hazards 2013, 65, 523–543. [Google Scholar] [CrossRef]
- Lombardo, L.; Cama, M.; Maerker, M.; Rotigliano, E. A test of transferability for landslides susceptibility models under extreme climatic events: Application to the Messina 2009 disaster. Nat. Hazards 2014, 74, 1951–1989. [Google Scholar] [CrossRef]
- Martin, T.J.; Ogden, J. Wind damage and response in New Zealand forests: A review. N. Z. J. Ecol. 2006, 30, 295–310. [Google Scholar]
- Quine, C.P.; Gardiner, B.A.; Moore, J. Wind disturbance in forests: The process of wind created gaps, tree overturning, and stem breakage. In Plant Disturbance Ecology; Academic Press: Cambridge, MA, USA, 2021; pp. 117–184. [Google Scholar]
- Peterson, C.J. Change in tree spatial pattern after severe wind disturbance in four North American northern hardwood and sub-boreal forests. Front. For. Glob. Chang. 2020, 3, 57. [Google Scholar] [CrossRef]
- Zhou, B.; Wang, X.; Cao, Y.; Ge, X.; Gu, L.; Meng, J. Damage assessment to subtropical forests following the 2008 Chinese ice storm. Iforest-Biogeosciences For. 2017, 10, 406. [Google Scholar] [CrossRef] [Green Version]
- Bonazountas, M.; Kallidromitou, D.; Kassomenos, P.A.; Passas, N. Forest fire risk analysis. Hum. Ecol. Risk Assess. 2005, 11, 617–626. [Google Scholar] [CrossRef]
- Campisano, A.; Gnecco, I.; Modica, C.; Palla, A. Designing domestic rainwater harvesting systems under different climatic regimes in Italy. Water Sci. Technol. 2013, 67, 2511–2518. [Google Scholar] [CrossRef] [PubMed]
- Offenthaler, I.; Felderer, A.; Formayer, H.; Glas, N.; Leidinger, D.; Leopold, P.; Schmidt, A.; Lexer, M.J. Threshold or Limit? Precipitation Dependency of Austrian Landslides, an Ongoing Challenge for Hazard Mapping under Climate Change. Sustainability 2020, 12, 6182. [Google Scholar] [CrossRef]
- ARPAV (Agenzia Regionale per la Protezione dell’Ambiente Veneto). Carta Della Natura del Veneto Alla Scala 1:50.000; Rapporti No. 106/2010; ISPRA: Roma, Italy, 2010. [Google Scholar]
- Costa, V.; Doglioni, C.; Grandesso, P.; Masetti, D.; Pellegrini, G.B.; Tracanella, E. Carta Geologica d’Italia alla scala 1:50.000. Note Illustrative del F°63 Belluno, 74; 1979. Available online: https://www.isprambiente.gov.it/Media/carg/note_illustrative/63_Belluno.pdf (accessed on 1 August 2022).
- Tarquini, S.; Isola, I.; Favalli, M.; Battistini, A. TINITALY, A Digital Elevation Model of Italy with a 10 Meters Cell Size (Version 1.0) [Data Set]. Istituto Nazionale di Geofisica e Vulcanologia (INGV). 2007. Available online: https://data.ingv.it/dataset/185#additional-metadata (accessed on 1 August 2022).
- Ehsan, S.; Kazem, D. Analysis of land use-land covers changes using normalized difference vegetation index (NDVI) differencing and classification methods. Afr. J. Agric. Res. 2013, 8, 4614–4622. [Google Scholar] [CrossRef] [Green Version]
- Forthofer, J.M.; Butler, B.W.; Wagenbrenner, N.S. A comparison of three approaches for simulating fine-scale surface winds in support of wildland fire management. Part I. Model formulation and comparison against measurements. Int. J. Wildland Fire. 2014, 23, 969–981. [Google Scholar] [CrossRef]
- Phien-Wej, N.; Nutalaya, P.; Aung, Z.; Zhibin, T. Catastrophic landslides and debris flows in Thailand. Bull. Int. Assoc. Eng. Geol.-Bull. De L’assoc. Int. De Géologie De L’ingénieur 1993, 48, 93–100. [Google Scholar] [CrossRef]
- Chen, X.; Chen, W. GIS-based landslide susceptibility assessment using optimized hybrid machine learning methods. Catena 2021, 196, 104833. [Google Scholar] [CrossRef]
- Jones, J.N.; Boulton, S.J.; Bennett, G.L.; Stokes, M.; Whitworth, M.R. Temporal variations in landslide distributions following extreme events: Implications for landslide susceptibility modeling. J. Geophys. Res. Earth Surf. 2021, 126, e2021JF006067. [Google Scholar] [CrossRef]
- Guri, P.K.; Patel, R.C. Spatial prediction of landslide susceptibility in parts of Garhwal Himalaya, India, using the weight of evidence modelling. Environ. Monit. Assess. 2015, 187, 1–25. [Google Scholar] [CrossRef] [PubMed]
- Baker, W.L.; Flaherty, P.H.; Lindemann, J.D.; Veblen, T.T.; Eisenhart, K.S.; Kulakowski, D.W. Effect of vegetation on the impact of a severe blowdown in the southern Rocky Mountains, USA. For. Ecol. Manag. 2002, 168, 63–75. [Google Scholar] [CrossRef]
- Zielonka, T.; Holeksa, J.; Fleischer, P.; Kapusta, P. A tree-ring reconstruction of wind disturbances in a forest of the Slovakian Tatra Mountains, Western Carpathians. J. Veg. Sci. 2010, 21, 31–42. [Google Scholar] [CrossRef]
- Foran, C.M.; Baker, K.M.; Narcisi, M.J.; Linkov, I. Susceptibility assessment of urban tree species in Cambridge, MA, from future climatic extremes. Environ. Syst. Decis. 2015, 35, 389–400. [Google Scholar] [CrossRef]
- Sanjuan, G.; Brun, C.; Margalef, T.; Cortés, A. Wind field uncertainty in forest fire propagation prediction. Proc. Comput. Sci. 2014, 29, 1535–1545. [Google Scholar] [CrossRef]
- Navarro, A.; Catalao, J.; Calvao, J. Assessing the use of Sentinel-2 time series data for monitoring Cork Oak decline in Portugal. Remote Sens. 2019, 11, 2515. [Google Scholar] [CrossRef] [Green Version]
- Fiore, N.M.; Goulden, M.L.; Czimczik, C.I.; Pedron, S.A.; Tayo, M.A. Do recent NDVI trends demonstrate boreal forest decline in Alaska? Environ. Res. Lett. 2020, 15, 095007. [Google Scholar] [CrossRef]
- Gentilucci, M.; Barbieri, M.; Materazzi, M.; Pambianchi, G. Effects of Climate Change on Vegetation in the Province of Macerata (Central Italy). In Advanced Studies in Efficient Environmental Design and City Planning; Springer: Berlin/Heidelberg, Germany, 2021; pp. 463–474. [Google Scholar]
- Camarero, J.J.; Colangelo, M.; Gazol, A.; Pizarro, M.; Valeriano, C.; Igual, J.M. Effects of windthrows on forest cover, tree growth and soil characteristics in drought-prone pine plantations. Forests 2021, 12, 817. [Google Scholar] [CrossRef]
- Lewis, M.E. Windfall disturbance in a piedmont uplands forest. Southeast. Geogr. 1991, 31, 1–14. [Google Scholar] [CrossRef]


| Slope | Aspect | Permeability | Vegetational Cover | Geological Formation | Deposits | Recent Deposits | Landslide Map | |
|---|---|---|---|---|---|---|---|---|
| 0–3° | 338–22° | Porosity in deposits | Very low | Salix | Vajont limestone | Thickened granular materials of ancient fluvial and/or fluvioglacial terraces with a predominantly gravelly and sandy texture | Alluvial and conoid deposits | Present |
| 4–9° | 23–67° | From low to medium | Quercus robur, Quercus petraea, and Carpinus betulus | Dolomia of St. Boldo | Heterogeneous-textured materials from torrential dejection cone deposits | Slopes and debris cones | Not present | |
| 10–18° | 68–112° | From medium to high | Pinus sylvestris | Main Dolomia | Loose material from recent and current deposition of the mobile riverbed and recent flooding areas | Moraine deposits | ||
| 18–27° | 113–157° | Very high | Picea abies | Igne formation | Coarse fluvioglacial or moraine accumulation materials in a fine sandy matrix | |||
| 27–45° | 158–202° | Cracking in solid rock | Very low | Quercus petraea, Carpinus betulus | Formation of Soverzene | Colluvial and eluvial debris cover | ||
| >45° | 203–247° | From low to medium | Pinus mugo | Schiara Dolomia | ||||
| 248–292° | From medium to high | With high human influence | Ammonitic Red | |||||
| 293–337° | Very high | Fagus | Limestone of Campotorondo | |||||
| Castanea sativa and Quercus Petraea | Formation of Fonzaso | |||||||
| Shrubby areas | Biancone | |||||||
| Grassland and elevated plateau | Soccher limestone | |||||||
| Maple, ash, and linden | St. Vigilio Group | |||||||
| Grey limestones | ||||||||
| N. Dolomia | ||||||||
| Bellunese flysch | ||||||||
| Red flake | ||||||||
| Cinereous flake | ||||||||
| Marl of the Golden Vein | ||||||||
| Glauconitic sandstone of Belluno | ||||||||
| S. Gregorio sandstone | ||||||||
| Sandstone of M. Baldo | ||||||||
| Code Landslide | NDVI Before | NDVI After |
|---|---|---|
| 025021_01c | 0.70 | 0.50 |
| 025021_02c | 0.60 | 0.40 |
| 025021_03c | 0.70 | 0.20 |
| 025021_04c | 0.60 | 0.20 |
| 025021_05c | 0.60 | 0.20 |
| 025021_05c | 0.60 | 0.20 |
| 025021_06c | 0.60 | 0.50 |
| 025021_07c | 0.60 | 0.30 |
| 025021_08c | 0.40 | 0.30 |
Publisher’s Note: MDPI stays neutral with regard to jurisdictional claims in published maps and institutional affiliations. |
© 2022 by the authors. Licensee MDPI, Basel, Switzerland. This article is an open access article distributed under the terms and conditions of the Creative Commons Attribution (CC BY) license (https://creativecommons.org/licenses/by/4.0/).
Share and Cite
Antonetti, G.; Gentilucci, M.; Aringoli, D.; Pambianchi, G. Analysis of landslide Susceptibility and Tree Felling Due to an Extreme Event at Mid-Latitudes: Case Study of Storm Vaia, Italy. Land 2022, 11, 1808. https://doi.org/10.3390/land11101808
Antonetti G, Gentilucci M, Aringoli D, Pambianchi G. Analysis of landslide Susceptibility and Tree Felling Due to an Extreme Event at Mid-Latitudes: Case Study of Storm Vaia, Italy. Land. 2022; 11(10):1808. https://doi.org/10.3390/land11101808
Chicago/Turabian StyleAntonetti, Guido, Matteo Gentilucci, Domenico Aringoli, and Gilberto Pambianchi. 2022. "Analysis of landslide Susceptibility and Tree Felling Due to an Extreme Event at Mid-Latitudes: Case Study of Storm Vaia, Italy" Land 11, no. 10: 1808. https://doi.org/10.3390/land11101808