Article

Assessing Urban Resilience from the Perspective of Scaling Law: Evidence from Chinese Cities

1
School of Urban Economics and Public Administration, Capital University of Economics and Business, Beijing 100070, China
2
Key Laboratory of Land Surface Pattern and Simulation, Institute of Geographic Sciences and Natural Resources Research, Chinese Academy of Sciences, Beijing 100101, China
3
Beijing Key Laboratory of Megaregions Sustainable Development Modeling, Capital University of Economics and Business, Beijing 100070, China
4
State Key Laboratory of Resources and Environmental Information System, Institute of Geographic Sciences and Natural Resources Research, Chinese Academy of Sciences, Beijing 100101, China
5
College of Resources and Environment, University of Chinese Academy of Sciences, Beijing 100049, China
6
College of Agronomy and Biotechnology, Hebei Normal University of Science & Technology, Qinhuangdao 066104, China
*
Authors to whom correspondence should be addressed.
Land 2022, 11(10), 1803; https://doi.org/10.3390/land11101803
Submission received: 31 August 2022 / Revised: 9 October 2022 / Accepted: 13 October 2022 / Published: 14 October 2022
(This article belongs to the Special Issue Urban Resilience and Urban Sustainability under Climate Change)

Abstract

:
Urban resilience, as an emerging research focus in urban studies, is the capability of an urban system to adapt to the uncertainties and disturbances faced by modern cities. Numerical characterization of an urban system’s resilience can be performed with urban resilience indicators. Moreover, as cities evolve with intensive socio-economic interactions, the performances of urban indicators are heavily dependent on the scale of these interactions; these relationships are conceptualized as urban scaling laws. Therefore, this study explores the scaling patterns of urban resilience, analyzing the scaling relationship between different resilience indicators and urban population size, as well as the spatial–temporal evolutions of the scaling patterns. The empirical case is based on 267 prefectural-level cities in China. The results show resilience indicators demonstrate scaling patterns on both spatial and temporal scales. Moreover, the scale-adjusted metropolitan indicator (SAMI) differs from the commonly used per capita indicator. Therefore, the scale needs to be considered when assessing urban resilience performance. Findings in this study indicate that moderate scale enhances resilience, enriching urban resilience theorization and urban scaling laws application. The empirical results in the case study also provide a reference for future urban resilience planning and management.

1. Introduction

Modern cities face threats from natural disasters, security accidents, public health events, etc. Stakeholders, including governments, private-sector actors, multilateral organizations, nonprofits, and philanthropic foundations worldwide, are gradually strengthening their risk awareness, paying increasing attention to a broader range of uncertainties, including climate change, globalization, and economic crises [1]. Urban resilience has recently received much attention in urban studies as a concept to deal with urban risks [2]. The United Nations Sustainable Development Goals call for sustainable cities and communities that address the risks of climate and ecological change, which signal the importance of increasing urban resilience. Resilience is considered an expression of sustainability and is compared to the emergency room of sustainability [3]. For cities to be sustainable, firstly, they should be able to cope with, resist, and not be overcome by risks, which is the first level of meaning expressed by urban resilience; secondly, they should also be able to recover and adapt in the face of risks or disturbances, which is a further expression of urban resilience; furthermore, cities could anticipate and prevent risks or disorders, which is a higher level of urban resilience. Combining these three aspects, resilience building has become fundamental for cities aiming to achieve sustainable development.
Cities are complex adaptive systems with many moving and interacting elements along with urban expansion or shrinkage. People/elements in cities are connected by physical space (road networks) or social space (social networks). The non-linear social connections are the driving force behind the creation and development of cities, resulting in urban hierarchies, polycentric urban forms, and urban scaling laws. There is a non-linear relationship between many urban attributes and urban population size, theorized as urban scaling laws. The scaling law is a universal law in complex systems such as biology, physics, network sciences, etc. For example, Kleiber’s Law in biology states that the metabolic rate of adult mammals is related to body weight as a 3/4 power function [4]. Similarly, Zipf’s law is the rank-size distribution of the urban population [5]. Scaling law is one of the simple laws behind complex urban systems.
As a new paradigm for urban attributes assessment, and in contrast to previous studies that used per capita value to measure a particular aspect of urban resilience performance, this study aims to assess urban resilience from the perspective of scaling laws to better understand the concept and empirics of urban resilience. The empirical case study is based on prefectural-level cities in China. China is a vast country with significant spatial heterogeneity. With rapid urbanization over the past decades, urban performance has also shown significant temporal differences. Evidence from China could reveal both scaling pattern and allometric growth [4]. Clarifying these is beneficial for future urban development and resilience management.
Therefore, this study assesses urban resilience through the lens of urban scaling laws in the case of prefectural cities in China. While this section introduces the research background, research aim and content, the following sections of this paper are structured as follows. Section 2 reviews the two schools of literature from which this study originates: urban resilience and urban scaling laws. Section 3 presents the overall methodology of this study with the resilience assessment index and scaling pattern characterization, including the calculation method of scaling exponents, allometric growth, and scale-adjusted metropolitan indicator (SAMI), as well as the case study and data source. Section 4 is the results section, with findings on the scaling laws and allometric growth of resilience indicators in China, together with urban resilience assessment based on SAMI. Section 5 concludes this paper, with its theoretical, methodological, and empirical implications, and the potential limitations of this study.

2. Literature Review

2.1. Urban Resilience

Resilience was originally a physical concept that represented the ability of a material to absorb energy during plastic deformation and fracture. It was introduced to ecology by Holling in 1973, who defined it as the ability of an ecosystem to return to a stable state after disturbance [6]. Before that, the concept was also utilized in psychology and engineering. Resilience was then introduced into the social sciences along with the updated knowledge of academia on complex systems mechanisms and sustainable development models. Afterward, a more integrated socio-ecological perspective of resilience theory was proposed and promoted by environmental and social scientists. Folke further distinguished the concept of “resilience” into three different types: engineering resilience, ecological resilience, and socio-ecological resilience [7]. Current research on urban resilience is more focused on “social-ecological systems”, emphasizing the interrelationship between social disruptions and restructuring and exploring the capacity for organizational reengineering, learning, and innovation [8]. Socio-ecological resilience underscores the need for systems to break equilibrium and evolve with the changing internal and external environment to achieve sustainable system development, which provides a new perspective to understand and respond to global changes [9].
Currently, there is a vast amount of literature on urban resilience, focusing on the conceptualization and theorization of resilience [2,8,10], assessment framework [11,12,13], planning and management strategies [14,15,16], and governance practice [17,18,19]. There are also quantitative studies on assessing the level of resilience of specific urban systems using a single or a set of indicators [20,21,22], as well as using social surveys and statistical methods to study the influencing factors that cause differences in resilience levels [23,24,25]. Resilience quantification can be generalized into two major approaches, namely resilience process and system states evaluation, depending on the conceptualization of resilience [26]. When urban resilience is conceptualized as a process, it mainly reflects the dynamic process of adaptation and recovery of the system after a shock. Its measurement is numerically characterized by the dynamic process of specific performance of the system over time, focusing on the analysis of the continuous change process of system recovery [27,28,29]. For example, one empirical work in China used a resilience calculation method based on the urban indicator as a resilience surrogate, but measured the change of indicator, which reflected the adaptation process of the system [24]. After all, resilience is a process with threshold crossing [30].
Urban resilience as a state is conceptualized as the capacity inherent in the system itself, and its measurement is characterized by the value of this capacity [31]. The characterization of resilience under such a connotation is further divided into two categories: one is represented by the time required to recover to a given performance level or the degree of performance recovery within a given time [27,29,32]; the second can be calculated using an index system, with functions constructed based on a series of resilience factors [22,31,33]. Due to the different resilience evaluation dimensions in different studies, contingencies of the case areas, and availability of data, different index systems have been constructed, with common resilience evaluation dimensions being social, economic, and environmental dimensions, and so on [20,26,34,35]. For compound index evaluation, not only in urban resilience evaluation but also in other urban indexes, such as urban livability or urban sustainability, the most used weighting assigning method is the entropy method, which is favored for its objectivity [36,37,38]. There are also different topologies for resilience measurement; for example, resilience capability [39] and resilience performance [21]. In this research, we are mainly measuring resilience performance with urban indicators.

2.2. Urban Scaling Laws

Cities are typical complex systems. Traditional linear theories of system science are inadequate for exploring cities. However, a new research paradigm of urban science has emerged that focuses on the shared nature of cities across historical, geographical, cultural, and institutional contingencies [40]. Scaling law is one of the simple mechanisms behind complex urban systems. Urban scaling law is the scaling relationship between urban indicators and population size within an urban system, reflecting the state and characteristics of the urban system rather than individual cities [41,42]. The urban scaling law is a power function of population size with scaling exponents in the form:
Y t = Y 0 N t β
where Y t is the city index at time t , N t is the population size, and β is the scaling exponent, reflecting generic dynamic rules across the urban system [43]. Urban indicators can be classified into three categories according to the taxonomic universality of the scaling exponent β : (1) when β > 1 , there is a superlinear relationship between the urban indicator and population size. Urban indicators with superlinear scaling exponents are usually related to social interactions, for example, GDP, income, bank deposits, patents, housing cost, etc., as social interactions increase superlinearly with population, reflecting the increasing returns to scale; (2) when β = 1 , these are linear urban indicators, usually associated with basic human needs, for example, employment, housing, and household water consumption; (3) when β < 1 , these are usually infrastructure-related urban indicators, such as area of road and number of gas stations; these indicators increase sublinearly with population size, with large cities having more residents sharing urban infrastructure, reflecting economies of scale [43].
In reality, we also find that as a city’s population grows, the city’s infrastructure, such as the number of gas stations, length of roads, and total electricity consumption, does not grow at an equal rate, but at a slower rate than the population, which reflects the diminishing returns to scale effect of the city; that is, the larger the city, the more efficient the use of infrastructure will be. In addition, as a city’s size (population) grows, the effects of human interaction and cooperation become more pronounced, creating more wealth. For example, the population of Beijing is almost twice as large as that of Shijiazhuang, which is also one of the cities in the Beijing–Tianjin–Hebei Urban Agglomeration. Still, the wealth (GDP) generated in Beijing is six times larger than that of Shijiazhuang. Therefore, according to urban scaling law, it would be inappropriate to evaluate the performance of a particular perspective of a city with a per capita indicator, as per capita value itself assumes that the urban indicator in question is linearly related to city size [44]. To evaluate city performance, the effects of city size should be eliminated. As a result, Bettencourt et al. proposed the scale-adjusted metropolitan indicator based on the urban scaling law theory [45].
To date, urban scaling law has received extensive attention from multiple disciplines, including urban science, complexity science, geography, physics, and mathematics, and scholars have conducted research on the empirical and theoretical mechanisms of the universality of urban scaling law by integrating geographic, traffic, social, and economic data from multiple sources. Studies have applied scaling analysis with a set of urban indicators [46,47], made an improvement to the SAMI [48], and explained scaling laws and predicted urban activities [49]. Urban scaling law theories and analytics have been applied in the evaluation of cities in the areas of economic productivity [50,51], urban crime [52,53], pollution [54], land use efficiency [55], sustainable development [56], and so on, yet not in urban resilience assessment. Resilience building requires a scientific method of measurement acknowledging the relationship between urban size and resilience elements to guide resilience governance and decision-making. In this study, we applied urban scaling laws analysis on urban resilience indicators to explore the resilience performance of cities.
A concept similar to urban scaling law is allometric growth, originating from the fractal theory with a biological basis [57]. Urban allometric growth is the study of the magnitude of a constant ratio of the relative growth rates of population and urban attributes in a region. The ratio varies from region to region, and the allometric growth coefficient varies. The relationship between population and urban attributes can be further examined by combining the allometric growth coefficients. Empirical studies show that there are differences in the cross-sectional and time-series growth between built-up areas and urban population, suggesting that there is a difference between the urban scaling law and the allometric growth [58,59]. To predict the future growth of individual cities, allometric growth theory is needed instead of urban scaling law [60]. In this study, we also calculated the allometric growth coefficients of resilience indicators in cities.
Moreover, there is another important urban concept related to scaling laws that is important in this study, namely, urban agglomeration [61]. Agglomeration economies, also referred to as external economies of scale, relate to market efficiencies and non-traded “spillovers” between firms and other institutions that develop as cities grow in size, which is pertinent to the “scaling” concept [40,45,62].

3. Methodology

As this research aims to investigate resilience performance in cities, an urban resilience index is adopted to assess resilience (Section 3.1). Urban scaling law methods, including the calculation of the scaling exponent, allometric growth exponent (Section 3.2), and scale-adjusted metropolitan indicator (Section 3.3) are used to facilitate such investigation in the case area (Section 3.4).

3.1. Resilience Index

In selecting urban resilience indicators, we adopted the urban resilience index proposed by Shi et al. [26], which characterized the resilient nature of Chinese cities from three dimensions: economic prosperity, social well-being, and a clean environment. One reason for adopting this index set was that the indicator data are retrievable from official statistical yearbooks that are publicly available. In the original resilience index of Shi et al., there are 21 indicators. We excluded the population indicator in the social dimension, using it instead as the indicator of urban scale, and using the three environmental pollutants treatment rate indicators in the environmental dimension, which were found to have no scaling characteristic in preliminary data analysis. In the end, there were 17 resilience indicators analyzed in this study (Table 1).

3.2. Scaling Exponent and Allometric Growth Exponent Calculation

As illustrated in the previous sections, urban scaling law reflects the quantitative scaling relationship between urban indicators and population size within the urban system at time t and takes the form of a power function (Equation (1). For the scaling exponent β , if both sides of Equation (1) are taken logarithmically, the following linear function is generated:
log Y = β × log N + log Y 0
The slope of the fitted straight line is the scaling exponent β. The linear fitting method in double logarithmic coordinates is simple and easy to use and is, therefore, the most common fitting method for urban scaling law studies [43,45]. Calculating the scaling exponent β will be one of the significant empirical pursuits in this study to characterize the scaling pattern of resilience indicators.
In addition to the scaling exponent β that captures the changes in urban indicators along with changes in city size at the cross-sectional level, allometric growth [57] captures changes in urban indicators with changes in city size over time, which operates also as a power function. The former indicates the spatial differences, while the latter indicates the temporal discrepancies. We calculate the scaling exponent and allometric growth in the empirical analysis to reflect both impacts.

3.3. Scale-Adjusted Metropolitan Indicator (SAMI)

The urban scaling law is a law of the performance of the urban system, and its specific application in urban studies is of interest to researchers. Traditionally, city performance has been measured using per capita urban indicators, such as GDP per capita and income per capita. However, this ignores the non-linear scaling relationship between urban indicators and population size emphasized in the urban scaling law. Large cities, for example, rank high in GDP per capita because of their inherent scale advantages. To eliminate the effect of city population size, Bettencourt et al. [45] propose a scale-adjusted metropolitan Indicator, which is defined as follows:
S A M I i = log Y i Y N i = log Y i Y 0 N i β
where S A M I i   is the urban indicator (e.g., GDP) of city i that eliminates the effect of size, which is essentially the residual of the fitted equation for the urban indicator on population size, indicating the degree of deviation from its expected value; Y i is the actual value of the indicator of city i ; Y 0 N i β is the estimated value of the indicator of city i ; N i is the resident population size of city i ; and Y 0 and β   are the fitted parameters of Equation (3). SAMI based on urban scaling law theory eliminates city size’s effect and allows for more objective comparisons of city performance.

3.4. Case Study and Data Source

This paper collected data on population and resilience indicators for 267 prefecture-level cities in China from 2006–2019 (Figure 1). The data were obtained from Government Statistical Yearbook to unify the data caliber. The urban resilience indicator data used in this study were from the China City Statistical Yearbook 2007–2020, Beijing Statistical Yearbook 2007–2020, Fuzhou Statistical Yearbook 2007–2020, and Urumqi Statistical Yearbook 2007–2020. Data in the three prefectural cities of Beijing, Fuzhou, and Urumqi were used to calculate the allometric growth index. The rationales for choosing these three cities lay in that they are cities in three urban agglomerations belonging to the three categories of different development phases according to China’s 14th Five-Year-Plan (FYP). For Beijing in the Beijing–Tianjin–Hebei urban agglomeration, the current level of socio-economic development is relatively mature and needs to be optimized and enhanced. For Fuzhou in the Guangdong–Fujian–Zhejiang urban agglomeration with a rather promising urban cluster, the future development priority is to grow and expand. For Urumqi on the northern slope of the Tianshan Mountain urban agglomeration in the third tier, the urban cluster has not taken shape yet and is still in the “cultivation and development” phase. We believe that comparing these three cities could shed light on China’s national urban development strategies. In addition, the study period covers three FYP periods in China, with the results expected to show urban evolution reflected in urban resilience over the three national planning periods. It is worth mentioning that the methodologies in this research, no matter the resilience index, the scaling exponent and allometric growth exponent calculation, or the SAMI, are not exclusive to this case study, but can be applied to other global cities/regions outside the case study areas.

4. Scaling Laws of Resilience Indicators in China

4.1. Scaling Exponents of Resilience Indicators

We used the data from 2019 to perform the urban scaling law fitting of urban resilience indicators. Results show that the 17 resilience indicators in the 267 cities in 2019 demonstrate specific scaling patterns (Table 2 and Figure A1). For the seven economic resilience indicators, five have a superlinear relationship with population size, and the other two have a sublinear relationship. Among them, the scale effect of fixed assets in industrial enterprises is significant ( β = 0.69 ), and industry enterprises show an intensive development pattern. From small cities to big cities, the saving deposit increase rate is less than the population increase rate ( β = 0.93 ); this can be attributed to the high living expenses in large cities in China, which reduces the economic resilience of urban residents in big cities once there are losses of income induced by crises, for example, the COVID strike. For the superlinear indicators, the relationship between GDP and population is almost linear ( β = 1.01 ), and the increasing returns to scale are not significant for GDP in Chinese cities in 2019. The increasing returns to scale are more significant in secondary ( β = 1.03 ) and tertiary industry ( β = 1.06 ), especially tertiary industry. Foreign capital ( β = 1.77 ) and expenditure for science and technology ( β = 1.39 ), which are essential sources of economic openness and economic growth driver, are significantly superlinear to population size, indicating that foreign and R&D investment are clustering in big cities, affording them more competitive advantages.
The six social resilience indicators are in a sublinear relationship with population size, except for “Undergraduate in Regular HEIs”, indicating that the provision of higher education and educated laborers are clustering in big cities. The sublinear relationship between unemployment and population size suggests that big cities correspondingly offer more job opportunities. The infrastructural indicators, including “Number of Beds in Medical Institutions”, “Collections of Public Libraries”, “Area of Road” and “Number of Buses” are sublinear, indicating pronounced economies of scale. As for the four environmental resilience indicators, the fitting results for “Sulphur Dioxide Emission” and “Industrial Soot(dust) Emission” are not significant, with the value of R square below 0.1. This can be explained by the fact that air pollutant emission is subject to strict environmental regulations that are not directly related to population size, and therefore do not exhibit a scaling pattern. The “Area of Green Land” in the environmental dimension is similar to the infrastructural indicators with economies of scale. For “Industrial Wastewater Discharged” ( β = 0.77 ), the efficiency of wastewater treatment increases with the increase in city scale.

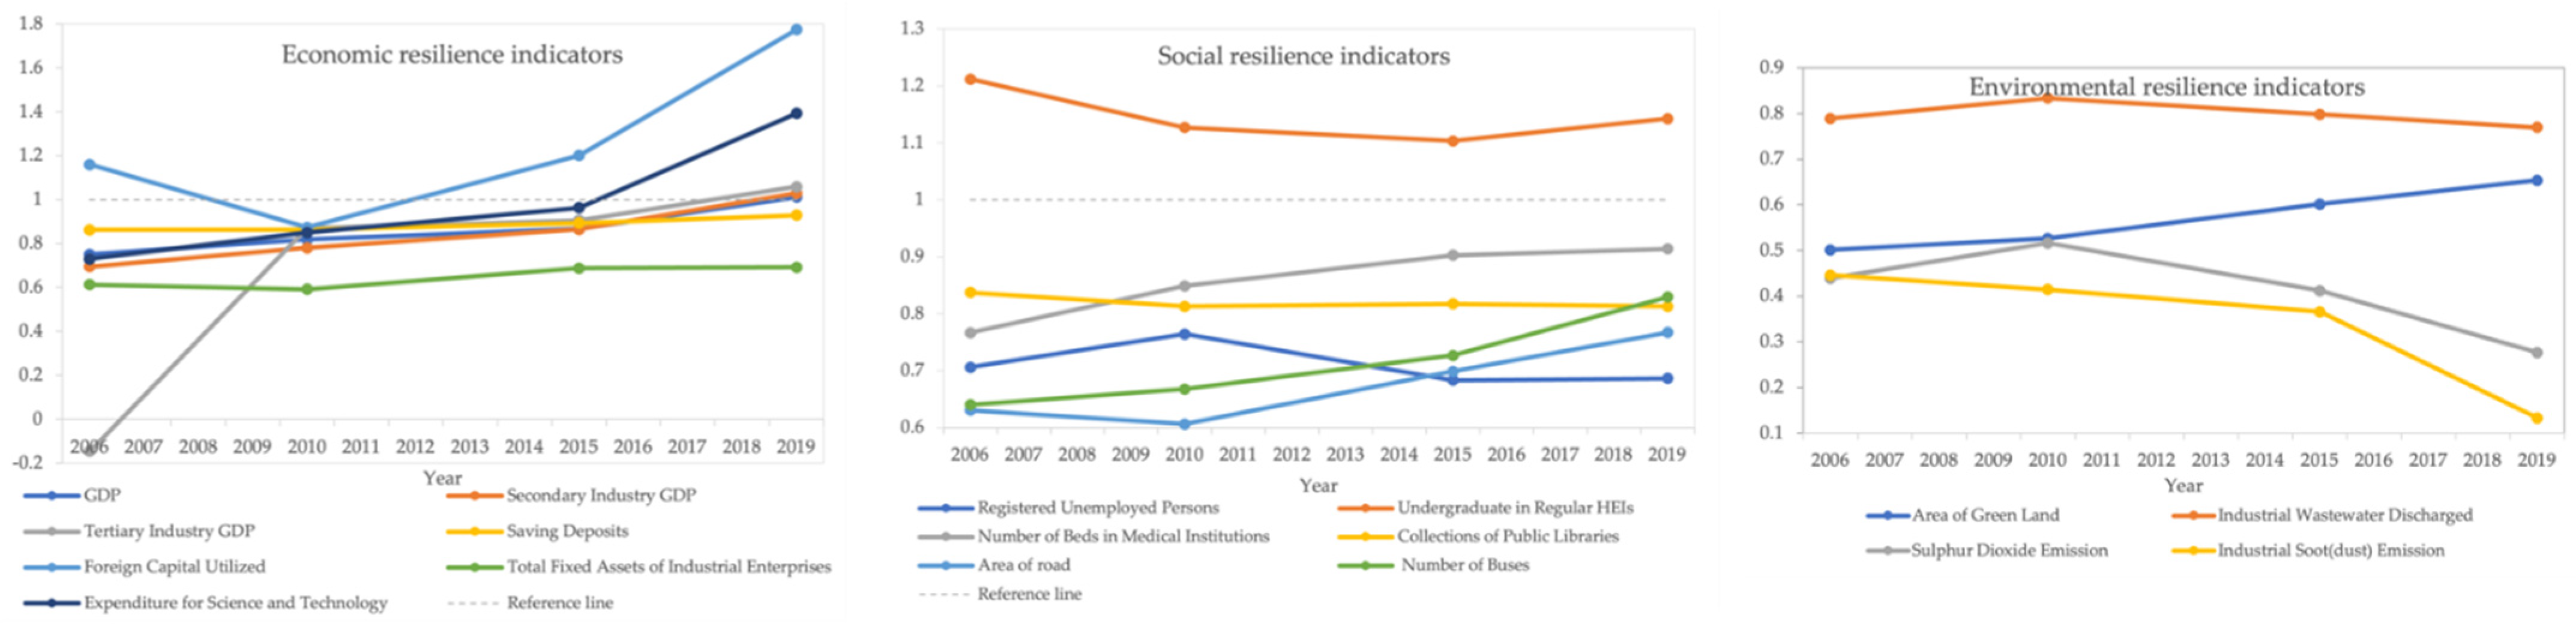
4.2. Temporal Variations of Scaling Exponents

The change of scaling exponents over time reflects the evolution of system resilience (Figure 2). For the scaling exponents of economic resilience indicators, from 2006 to 2019, the exponents of GDP, GDP in the secondary industry, and GDP in the tertiary sector demonstrate an increasing trend, surpassing 1 in 2019, showing the increasing returns to scale effect. Specifically, in 2006, the scaling exponent for tertiary industry GDP was a negative value. This indicates that tertiary industry GDP decreased in 2006 with the increased urban population. From 2006 to 2010, during the 11th FYP period, the proportion of the tertiary industry grew significantly. The change in saving deposits and fixed assets exponents remain relatively stable, showing a sublinear relationship with the population during the study period. Change in foreign capital and expenditure for science and technology exponents is pronounced; by 2019, they were both superlinearly related to urban size.
Social resilience indicator exponents increased in medical care (number of beds in medical institutions) and transportation provision (area of road and number of buses) and decreased in education (undergraduate in higher education and collections of public libraries) and unemployment. For environmental indicator exponents, the area of green land increased from 2006 to 2019, indicating the increased green land area in big cities. The exponents for industrial wastewater discharge fluctuated slightly over the study period and remained around 0.8. To further explore the change over time, we calculated the allometric growth of resilience indicators in China’s Beijing, Fuzhou, and Urumqi cities. Results are presented in the following subsection.

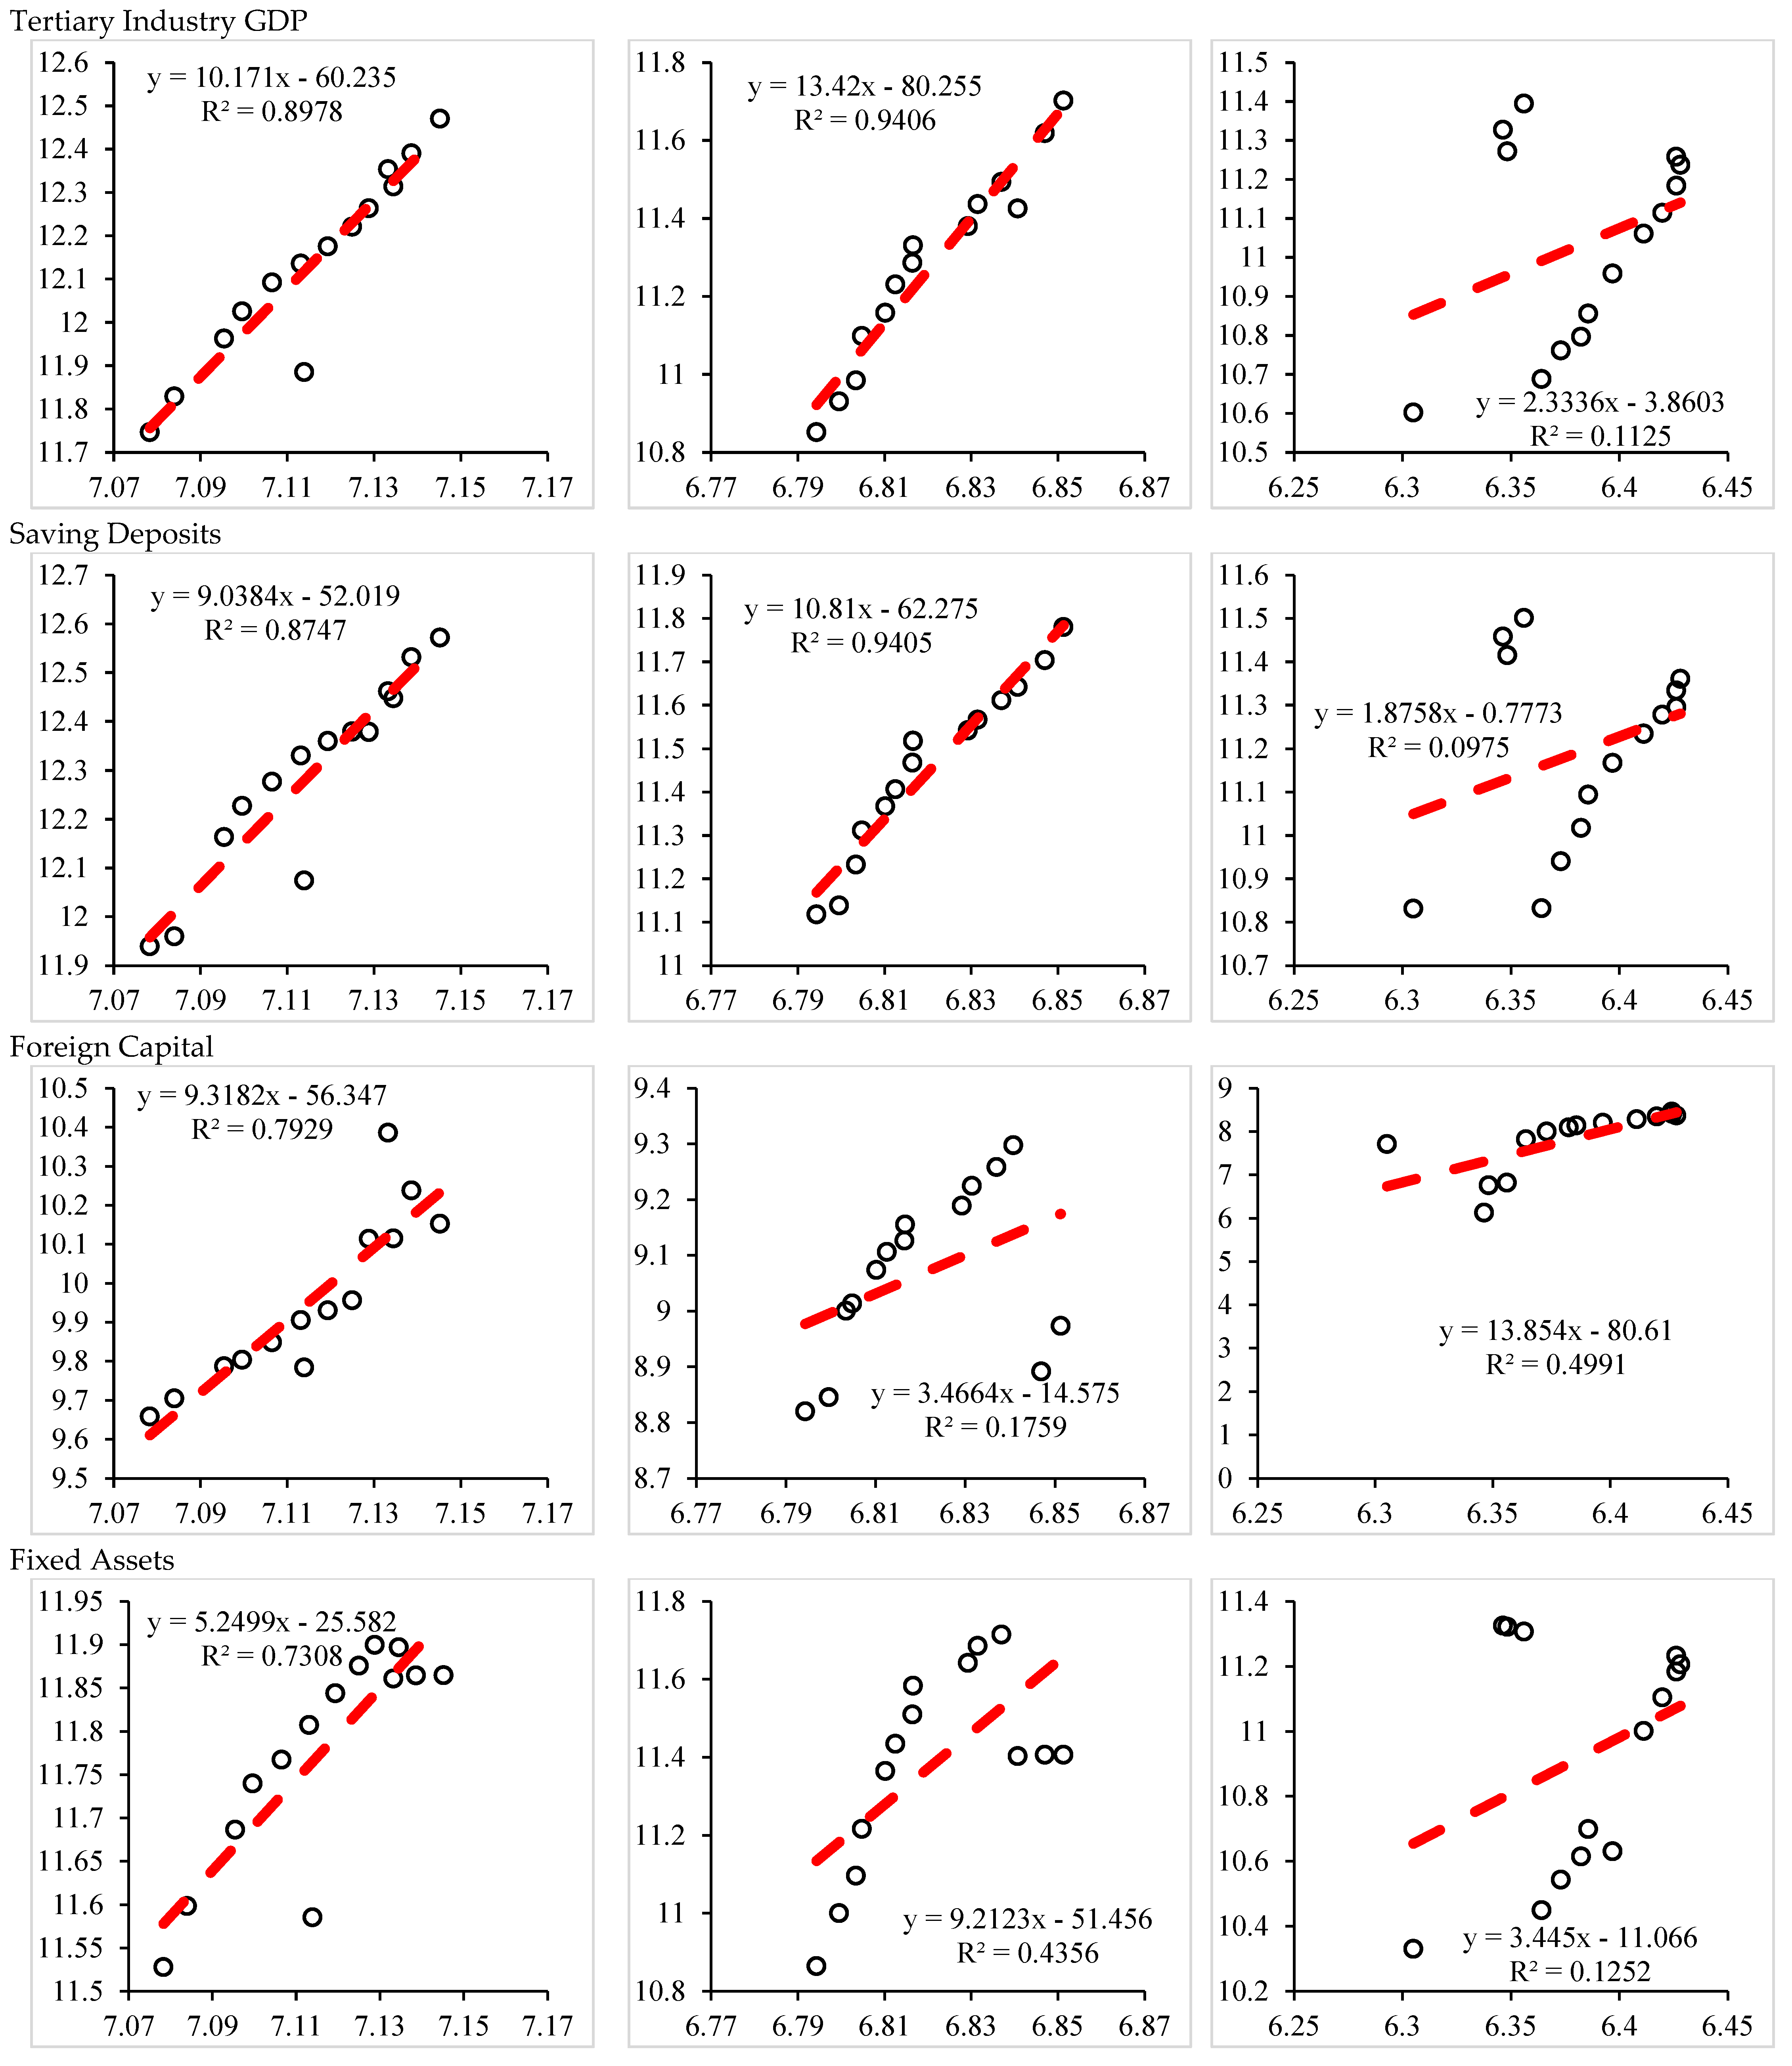
4.3. Allometric Growth of Resilience Indicators in China

The allometric growth fitting results of resilience indicators in Beijing, Fuzhou, and Urumqi, representing cities from the first, second, and third-tier urban agglomerations of China from 2006 to 2019, are shown in Table 3 and Figure A2. The populations in these three cities by the end of 2019 were 21.89 million, 7.80 million, and 3.55 million, respectively. In the economic dimension, GDP indicators increased with urban expansion, with the increasing rate in tertiary industry higher than that in the secondary sector in Beijing and Fuzhou. In comparison, in Urumqi, the growing rate of secondary industry GDP was more elevated. For saving deposits, doubling the population increased the number of deposits in Fuzhou tenfold. As for the utilization of foreign capital, Urumqi had the highest increasing rate along with urban expansion. At the same time, Fuzhou excelled in fixed assets and science and technology expenditure. For social resilience indicators, with population growth, unemployment decreased in Beijing and Fuzhou and increased in Urumqi. This indicates that Xinjiang’s economy needs further development to create more job opportunities for the increased population. For “Undergraduate in Regular HEIs”, the increasing rate was higher in Fuzhou and Urumqi, indicating greater room for higher education development in these two cities. For the public provision of medical care, cultural facilities, road, and transportation, Beijing has more advantages than Fuzhou, and Urumqi is relatively disadvantaged. In the environmental resilience dimension, the area for green land increases drastically with urban expansion in Fuzhou, while the increase rate is lower in Beijing and Urumqi. Along with population growth, industrial wastewater discharged decreased in Beijing and Fuzhou and increased in Urumqi. This highlights the need for Urumqi to green its industrial development as part of the urbanization process.

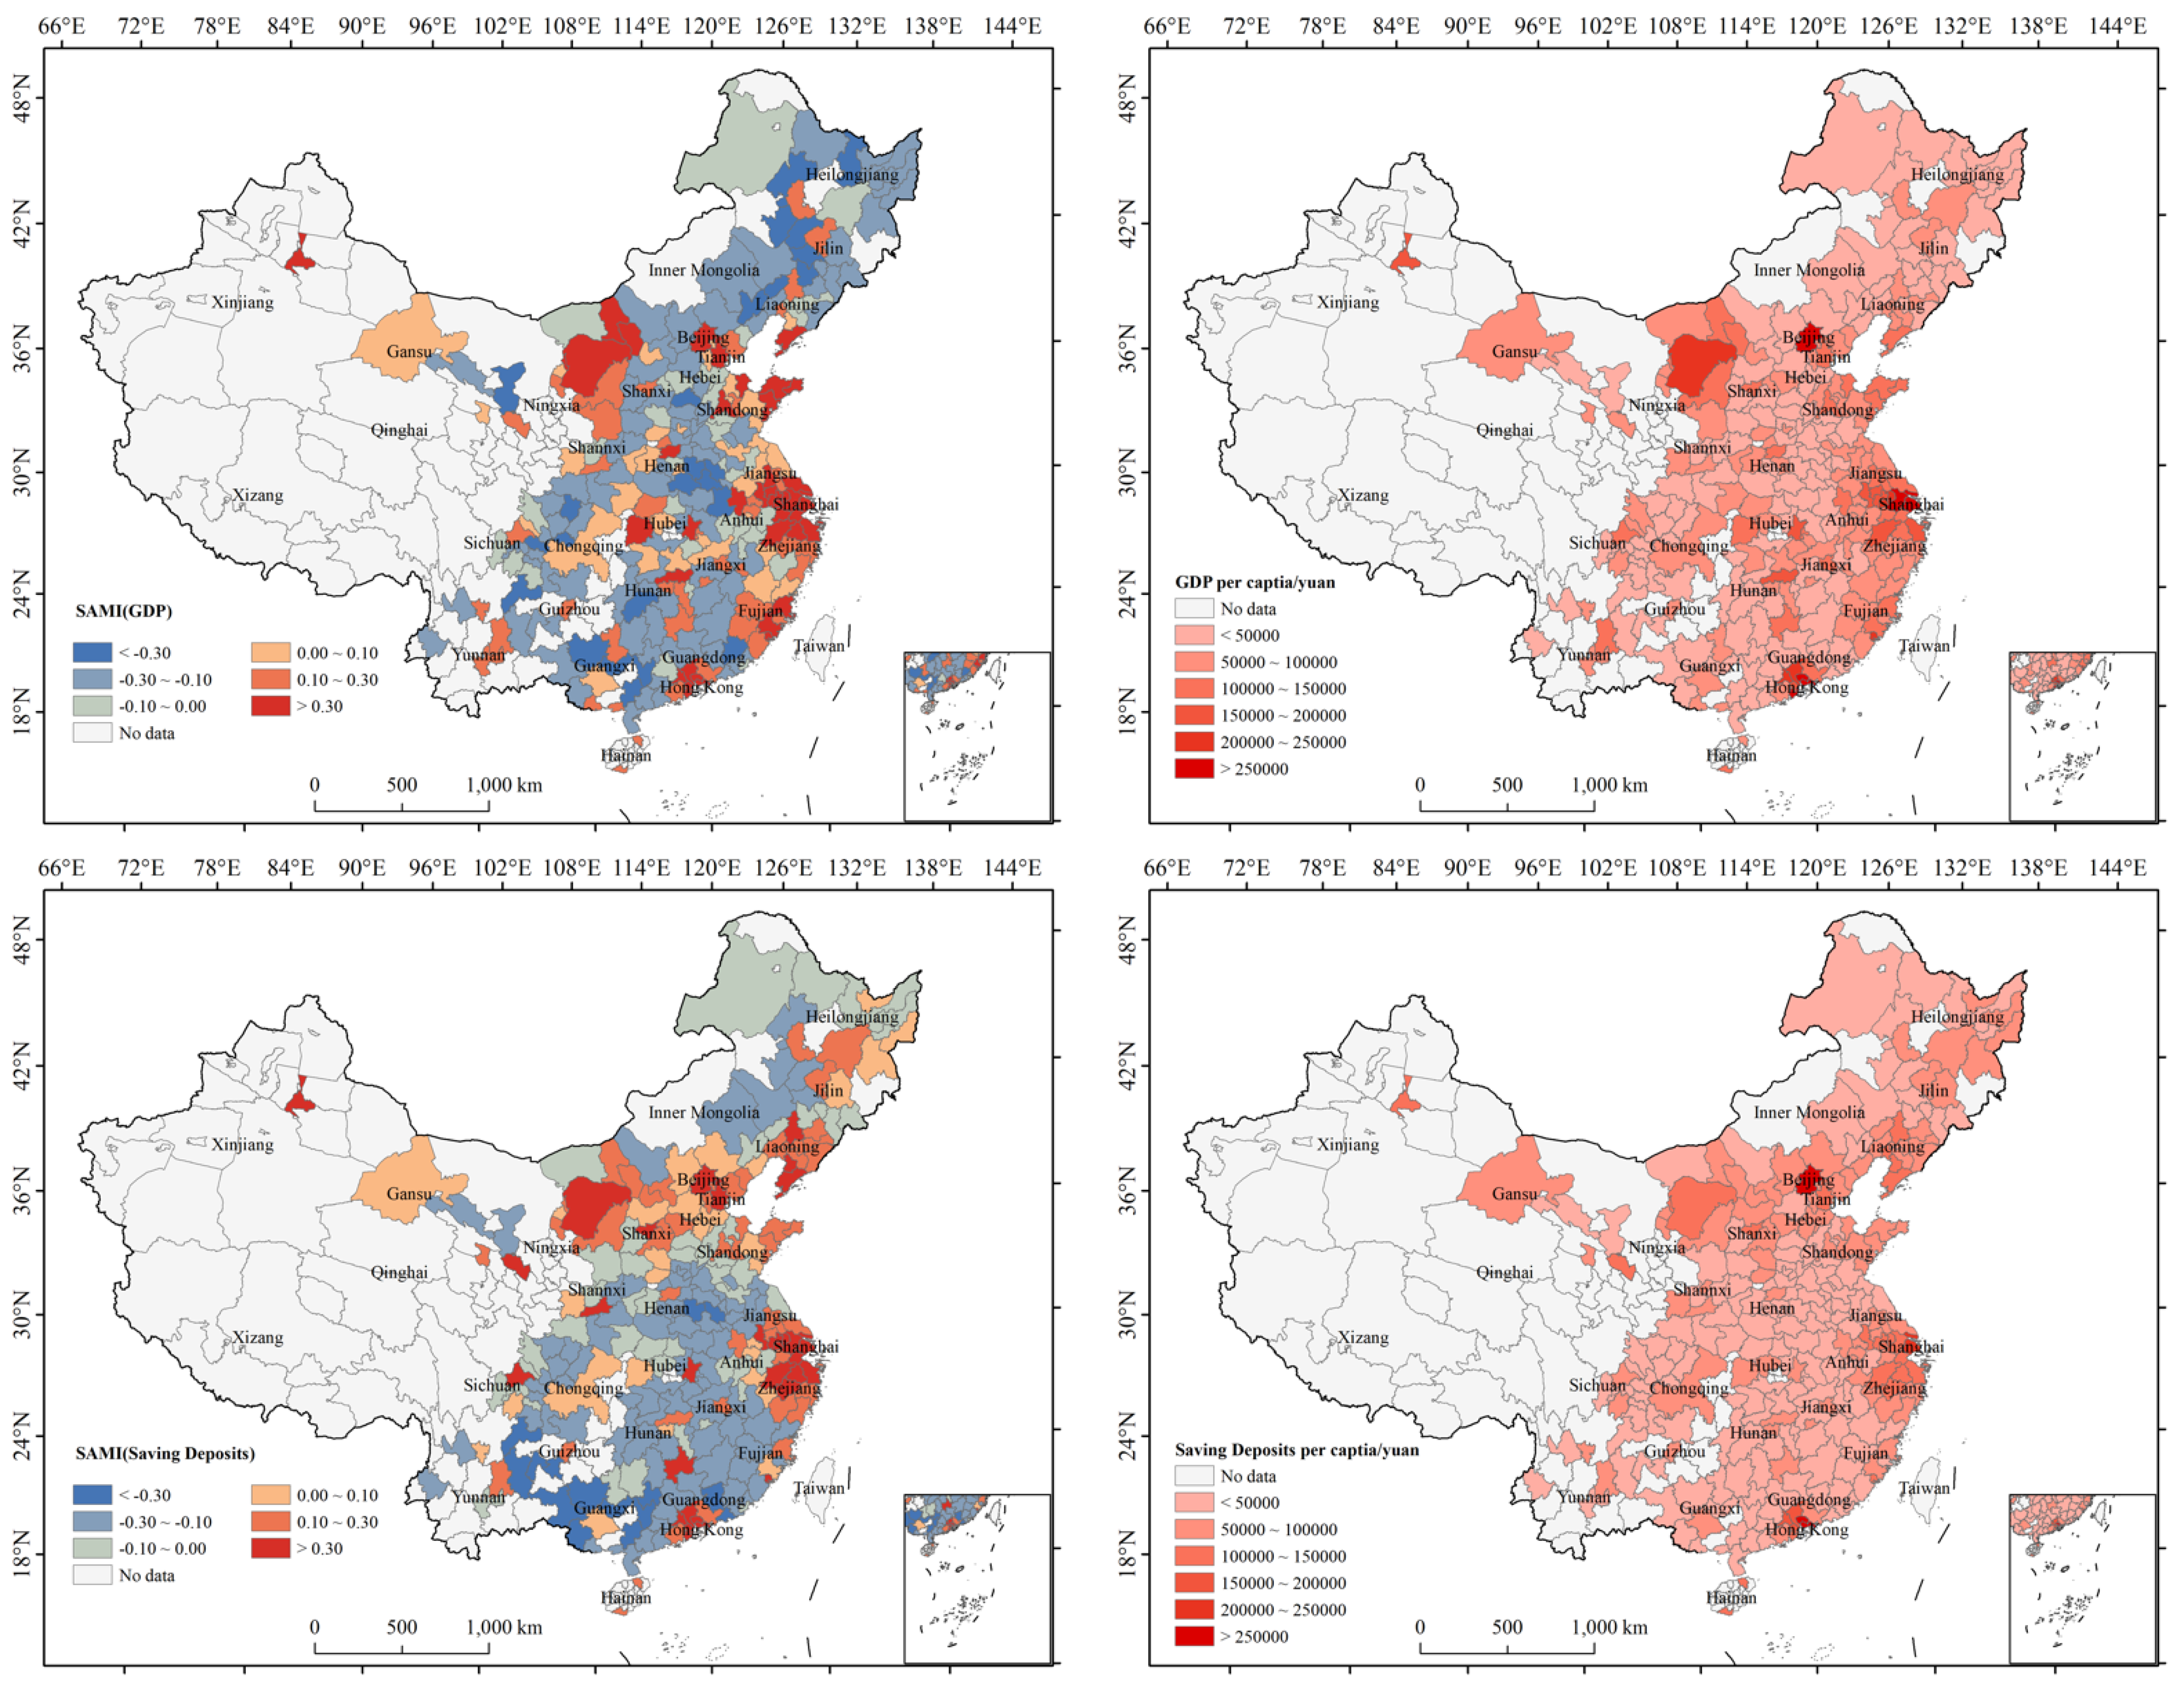
4.4. Spatial Pattern of Urban Resilience SAMI and Comparison with per Capita Indicators

In this subsection, we selected two indicators from each resilience dimension to calculate the scale-adjusted metropolitan indicator, and compared it with the per capita value (Figure 3) to show that when assessing urban resilience performance, it is essential to recognize the nonlinear scaling relationship between urban indicators and population size. In the economic dimension, cities with positive GDP SAMI are mainly located in the Eastern and Southern coastal regions of China, the middle reaches of the Yangtze River, Inner Mongolia, and Xinjiang, indicating that these cities have more economic output and more efficient economic operations among cities of the same size. Cities with negative GDP SAMI are mainly located in the inland regions of Northeast, Central, and Southwest China. These cities’ economies operate less efficiently than cities of the same size. The cities with positive saving deposit SAMI are mainly located in the Bohai Economic Circle, Yangtze River Delta, and Pearl River Delta, which have higher deposits among cities of the same size. The cities with a negative saving deposit SAMI are mainly located in the Northeast and Central regions, and these cities hold fewer deposits than cities of the same size.
As for social resilience, cities with positive college student SAMI are mainly in municipalities, provincial capitals, and major cities, which is consistent with the fact that Chinese universities are primarily located in these cities. For the area of road as a representation of public provision indicator, among cities of the same size, cities with larger road areas are concentrated in the Eastern coastal regions. In comparison, cities with smaller road areas are mainly small cities in Northeast, Central, and South China, where the infrastructure needs further development. In the environmental dimension, among cities of the same size, there is more green land in Harbin, Changchun, Urumqi, Ordos, Chongqing, in cities in the Eastern coastal regions, and in cities in the Pearl River Delta. Cities with SAMI values less than 0 need to develop urban green space further. For industrial wastewater discharge, among cities of the same size, Hulun Buir, Hegang, Jilin, Yinchuan, Tangshan, Tianjin, most cities on the East Coast, and most cities in the Guangxi, Guangdong, and Fujian provinces, have more emissions and need to green their industries further.
In addition, the spatial distribution of SAMI and the per capita value have particular distinctions (Figure 3). For example, The GDP SAMI for Urumqi is among the highest-ranking category, while the GDP per capita is in the third category. In Urumqi, good economic performance stands out when comparing GDP with cities of the same size. Another example would be the area of road in Beijing; its SAMI value is high, indicating better performance compared with cities of the same size. At the same time, the area of road per capita in Beijing is only in the fifth grade. Using the SAMI is equivalent to comparing cities of the same size, which is more scientific and reasonable. The resilience performance of different cities should be compared in urban evaluation studies after controlling for urban population size.

5. Discussion and Conclusions

Resilience planning and management require scientific quantification of urban resilience indicators. This study utilized the urban resilience index and assessed the non-linear scaling relationship between urban indicators and urban population, correcting the effects of scale, overcoming the deficiency of commonly used per capita indicators, and facilitating direct comparisons between cities of different sizes. Key findings include:
The scaling exponents indicate that economic resilience indicators in Chinese cities are mainly superlinearly related to the urban scale. In contrast, social and economic indicators are mainly sublinearly related to population size. The scaling patterns are consistent with other empirical works in China [47,56]. Specifically, in the economic dimension, GDP shows weak superlinearity; although secondary and tertiary sector GDP is higher, it is still not as high as for international cities with a GDP scaling exponent at around 1.15 [43]. This indicates that the increasing returns to scale effect in China’s economy are insignificant. There is still a gap in comparison to developed countries. In addition, the results also show that the major sources of economic resilience in big cities come from foreign capital and expenditure for science and technology (both with high scaling exponent value). This indicates that openness and technological advancement are crucial for economic development.
In the social dimension, variables related to infrastructure development (Number of Beds in Medical Institutions, Collections of Public Libraries, Area of Road, Number of Buses) are sublinearly related to urban population size, indicating that the factor increase rate is lower than the population increase rate from small cities to large cities because more residents in large cities share urban infrastructure, reflecting the economies of scale of urban attributes; usually, the scaling exponent value is around 0.85 [43]. Such scale and aggregation effects are more significant for “Collections of Public Libraries”, “Area of road”, and “Number of Buses” with an exponent value below 0.85, and for “Number of Beds in Medical Institutions” the scale effect is not significant ( β > 0.85 ). The wastewater discharged is sublinearly related to the urban scale in the environmental dimension. It contradicts Lei et al.’s [47] study in 2017 in China that shows wastewater discharged is superlinearly related to urban scale. This indicates increased wastewater treatment in big cities in recent years.
Changes in the scaling exponents of major urban resilience factors over time show that the agglomeration effect of economic resilience factors in China’s large cities has been reinforced from 2006 to 2019, driven by foreign capital and expenditure for science and technology (both have high change rate during the study period). The exponents of social and environmental indicators change relatively smoothly, and the correlation with population size does not change (whether sublinear or superlinear). This further indicates that urban resilience in China mainly comes from the economic dimension, consistent with other urban resilience studies in China, though with different assessment approaches [26]. The comparison of the three cities with the allometric growth rate shows that the medium-scaled city (in this case, Fuzhou, as compared to Beijing and Urumqi) might have certain advantages in urban development, with a high allometric growth rate in most resilience indicators in Fuzhou. This further indicates that rather than “the bigger, the better”, a moderate scale may enhance resilience. For cities in the third tier, Urumqi has a particular advantage in higher education development, while public service provision is still inadequate compared with the other two cities. Relatively backward cities still need to develop their economies and provide public services and facilities to enhance their comprehensive resilience. The findings in this study imply that future urban planning in China should try to prevent cities from becoming too big and that resilience-building policies may favor small and medium-sized cities. In addition, for small cities, public infrastructures and services need to be further strengthened.
The comparison between SAMI and per capita resilience indicator value shows that it is essential to compare the resilience performance of different cities after controlling for the city’s population size. In addition, the SAMI value is distinctive from the per capita value. Evaluating a city’s resilience performance on the same population scale is a scientifically sound approach. It should be promoted not only in urban resilience assessment but also in other urban assessment regimes, especially when city ranking and the subsequent decision-making tend to be criticized for failing to acknowledge the regional heterogeneities of various kinds (urban scale included), ending up with the one-size-fits-all types of policies. Using the SAMI value to evaluate cities recognizes the heterogeneity of cities in terms of size and can facilitate the formulation of policies for cities of the same size. Moreover, the methodologies in this research, no matter the resilience index, the scaling exponent and allometric growth exponent calculation, or the scale-adjusted metropolitan indicator (SAMI), are not exclusive to this case study, but can be applied to other global cities/regions outside the case study areas.
In summary, while research on urban resilience from the scaling law perspective is scarce, this study contributes to the literature by applying the urban scaling law theory and method in urban resilience evaluation, enriching the theory and practice of both urban scaling law and urban resilience studies. One of the key findings in this study is that a moderate scale enhances urban resilience, which should be kept in mind in urban planning and management. The study of urban scaling law helps understand the characteristics and evolution law of urban systems in rapidly urbanizing areas and provides a reference for urban development. There are, however, certain limitations of this study. Data in the three cities of Beijing, Fuzhou, and Urumqi were collected yearly from 2006 to 2019 to calculate the allometric growth rate, while for scaling exponent calculation, to reduce data collection and computational workload, analysis of scaling exponents was only conducted in 2006, 2010, 2015, and 2019 during the study period, which we believe may adequately reflect the change over the FYP periods of China. However, interannual variation might be observed if the calculation could be performed yearly with enriched data.

Author Contributions

Conceptualization, C.S. and F.W.; methodology, N.G. and C.S.; formal analysis, F.W. and C.S.; data curation, N.G. and F.W.; writing—original draft preparation, C.S. and X.Z.; writing—review and editing, C.S. and F.W.; visualization, N.G. All authors have read and agreed to the published version of the manuscript.

Funding

This research was funded by the National Natural Science Foundation of China, grant number 72104149; Academy of Metropolis Economic and Social Development at Capital University of Economics and Business, grant number ZSXM2021003; Capital University of Economics and Business: The Fundamental Research Funds for Beijing Universities, grant number XRZ2021048 and QNTD202009.

Institutional Review Board Statement

Not applicable.

Informed Consent Statement

Not applicable.

Data Availability Statement

All data and materials are available upon request.

Acknowledgments

We would like to thank the reviewers for their thoughtful comments that helped improve the quality of this work.

Conflicts of Interest

The authors declare no conflict of interest.

Appendix A

Note: In the following figures, X axis shows population (ln), and Y axis shows the resilience indicator (ln) in question.
Figure A1. Urban scaling law fitting results of urban resilience indicators in 2019.
Land 11 01803 g0a1aLand 11 01803 g0a1bLand 11 01803 g0a1c
Figure A2. Allometric growth fitting results of urban resilience indicators in Beijing, Fuzhou, and Urumqi from 2006 to 2019.
Land 11 01803 g0a2aLand 11 01803 g0a2bLand 11 01803 g0a2cLand 11 01803 g0a2dLand 11 01803 g0a2e

References

  1. Webber, S.; Leitner, H.; Sheppard, E. Wheeling Out Urban Resilience: Philanthrocapitalism, Marketization, and Local Practice. Ann. Am. Assoc. Geogr. 2021, 111, 343–363. [Google Scholar] [CrossRef]
  2. Büyüközkan, G.; Ilıcak, Ö.; Feyzioğlu, O. A Review of Urban Resilience Literature. Sustain. Cities Soc. 2022, 77, 103579. [Google Scholar] [CrossRef]
  3. Petit, E.P. Chapter 27—Smart City Technologies plus Nature-Based Solutions: Viable and Valuable Resources for Urban Resilience. In Smart Cities Policies and Financing; Vacca, R.J., Ed.; Elsevier: Amsterdam, The Netherlands, 2022; pp. 377–398. ISBN 978-0-12-819130-9. [Google Scholar]
  4. West, G.B.; Brown, J.H.; Enquist, B.J. A General Model for the Origin of Allometric Scaling Laws in Biology. Science 1997, 276, 122–126. [Google Scholar] [CrossRef] [PubMed]
  5. Gabaix, X. Zipf’s Law and the Growth of Cities. Am. Econ. Rev. 1999, 89, 129–132. [Google Scholar] [CrossRef]
  6. Holling, C.S. Resilience and Stability of Ecological Systems. Annu. Rev. Ecol. Syst. 1973, 4, 1–23. [Google Scholar] [CrossRef] [Green Version]
  7. Folke, C. Resilience: The Emergence of a Perspective for Social–Ecological Systems Analyses. Glob. Environ. Chang. 2006, 16, 253–267. [Google Scholar] [CrossRef]
  8. Meerow, S.; Newell, J.P.; Stults, M. Defining Urban Resilience: A Review. Landsc. Urban Plan. 2016, 147, 38–49. [Google Scholar] [CrossRef]
  9. Aldunce, P.; Beilin, R.; Howden, M.; Handmer, J. Resilience for Disaster Risk Management in a Changing Climate: Practitioners’ Frames and Practices. Glob. Environ. Chang. 2015, 30, 1–11. [Google Scholar] [CrossRef]
  10. Shamsuddin, S. Resilience Resistance: The Challenges and Implications of Urban Resilience Implementation. Cities 2020, 103, 102763. [Google Scholar] [CrossRef]
  11. Dianat, H.; Wilkinson, S.; Williams, P.; Khatibi, H. Choosing a Holistic Urban Resilience Assessment Tool. Int. J. Disaster Risk Reduct. 2022, 71, 102789. [Google Scholar] [CrossRef]
  12. Shi, Y.; Zhai, G.; Xu, L.; Zhou, S.; Lu, Y.; Liu, H.; Huang, W. Assessment Methods of Urban System Resilience: From the Perspective of Complex Adaptive System Theory. Cities 2021, 112, 103141. [Google Scholar] [CrossRef]
  13. Herrera, H.; Kopainsky, B. Using System Dynamics to Support a Participatory Assessment of Resilience. Environ. Syst. Decis. 2020, 40, 342–355. [Google Scholar] [CrossRef] [Green Version]
  14. Bush, J.; Doyon, A. Building Urban Resilience with Nature-Based Solutions: How Can Urban Planning Contribute? Cities 2019, 95, 102483. [Google Scholar] [CrossRef]
  15. Crowe, P.R.; Foley, K.; Collier, M.J. Operationalizing Urban Resilience through a Framework for Adaptive Co-Management and Design: Five Experiments in Urban Planning Practice and Policy. Environ. Sci. Policy 2016, 62, 112–119. [Google Scholar] [CrossRef]
  16. Mehmood, A. Of Resilient Places: Planning for Urban Resilience. Eur. Plan. Stud. 2015, 24, 407–419. [Google Scholar] [CrossRef] [Green Version]
  17. Duit, A.; Galaz, V.; Eckerberg, K.; Ebbesson, J. Governance, Complexity, and Resilience. Glob. Environ. Chang. 2010, 20, 363–368. [Google Scholar] [CrossRef]
  18. Lebel, L.; Anderies, J.M.; Campbell, B.; Folke, C.; Hatfield-Dodds, S.; Hughes, T.P.; Wilson, J. Governance and the Capacity to Manage Resilience in Regional Social-Ecological Systems. Ecol. Soc. 2006, 11, 19. [Google Scholar] [CrossRef] [Green Version]
  19. Boyd, E.; Juhola, S. Adaptive Climate Change Governance for Urban Resilience. Urban Stud. 2015, 52, 1234–1264. [Google Scholar] [CrossRef]
  20. Rockefeller Foundation. Arup City Resilience Index. In City Resilience Framework; Rockefeller Foundation: London, UK, 2014. [Google Scholar]
  21. Parsons, M.; Morley, P. The Australian Natural Disaster Resilience Index. Aust. J. Emerg. Manag. 2017, 32, 20–22. [Google Scholar] [CrossRef]
  22. Cutter, S.L.; Burton, C.G.; Emrich, C.T. Disaster Resilience Indicators for Benchmarking Baseline Conditions. J. Homel. Secur. Emerg. Manag. 2010, 7, 1–24. [Google Scholar] [CrossRef]
  23. Fastiggi, M.; Meerow, S.; Miller, T.R. Governing Urban Resilience: Organisational Structures and Coordination Strategies in 20 North American City Governments. Urban Stud. 2021, 58, 1262–1285. [Google Scholar] [CrossRef]
  24. Shi, C.; Zhu, X.; Wu, H.; Li, Z. Assessment of Urban Ecological Resilience and Its Influencing Factors: A Case Study of the Beijing-Tianjin-Hebei Urban Agglomeration of China. Land 2022, 11, 921. [Google Scholar] [CrossRef]
  25. Huang, G.; Li, D.; Zhu, X.; Zhu, J. Influencing Factors and Their Influencing Mechanisms on Urban Resilience in China. Sustain. Cities Soc. 2021, 74, 103210. [Google Scholar] [CrossRef]
  26. Shi, C.; Guo, N.; Gao, X.; Wu, F. How Carbon Emission Reduction Is Going to Affect Urban Resilience. J. Clean. Prod. 2022, 372, 133737. [Google Scholar] [CrossRef]
  27. Ouyang, M.; Dueñas-Osorio, L.; Min, X. A Three-Stage Resilience Analysis Framework for Urban Infrastructure Systems. Struct. Saf. 2012, 36–37, 23–31. [Google Scholar] [CrossRef]
  28. Hallegatte, S. Economic Resilience: Definition and Measurement; The World Bank: Washington, DC, USA, 2014. [Google Scholar]
  29. Simmie, J.; Martin, R. The Economic Resilience of Regions: Towards an Evolutionary Approach. Camb. J. Reg. Econ. Soc. 2010, 3, 27–43. [Google Scholar] [CrossRef] [Green Version]
  30. Carpenter, S.R.; Westley, F.; Turner, M.G. Surrogates for Resilience of Social–Ecological Systems. Ecosystems 2005, 8, 941–944. [Google Scholar] [CrossRef]
  31. Cutter, S.L. The Landscape of Disaster Resilience Indicators in the USA. Nat. Hazards 2016, 80, 741–758. [Google Scholar] [CrossRef]
  32. Francis, R.; Bekera, B. A Metric and Frameworks for Resilience Analysis of Engineered and Infrastructure Systems. Reliab. Eng. Syst. Saf. 2014, 121, 90–103. [Google Scholar] [CrossRef]
  33. Walker, B.; Holling, C.S.; Carpenter, S.R.; Kinzig, A. Resilience, Adaptability and Transformability in Social–Ecological Systems. Ecol. Soc. 2004, 9, 5. [Google Scholar] [CrossRef]
  34. Zheng, Y.; Xie, X.-L.; Lin, C.-Z.; Wang, M.; He, X.-J. Development as Adaptation: Framing and Measuring Urban Resilience in Beijing. Adv. Clim. Chang. Res. 2018, 9, 234–242. [Google Scholar] [CrossRef]
  35. Jha, A.K.; Miner, T.W.; Stanton-Geddes, Z. Directions in development. In Building Urban Resilience: Principles, Tools, and Practice; World Bank Group: Washington, DC, USA, 2013. [Google Scholar]
  36. Shi, C.; Guo, N.; Zeng, L.; Wu, F. How Climate Change Is Going to Affect Urban Livability in China. Clim. Serv. 2022, 26, 100284. [Google Scholar] [CrossRef]
  37. Lu, H.; Lu, X.; Jiao, L.; Zhang, Y. Evaluating Urban Agglomeration Resilience to Disaster in the Yangtze Delta City Group in China. Sustain. Cities Soc. 2022, 76, 103464. [Google Scholar] [CrossRef]
  38. Ding, L.; Shao, Z.; Zhang, H.; Xu, C.; Wu, D. A Comprehensive Evaluation of Urban Sustainable Development in China Based on the TOPSIS-Entropy Method. Sustainability 2016, 8, 746. [Google Scholar] [CrossRef] [Green Version]
  39. Martin, R. Regional Economic Resilience, Hysteresis and Recessionary Shocks. J. Econ. Geogr. 2012, 12, 1–32. [Google Scholar] [CrossRef] [Green Version]
  40. Rybski, D.; Arcaute, E.; Batty, M. Urban Scaling Laws. Environ. Plan. B Urban Anal. City Sci. 2019, 46, 1605–1610. [Google Scholar] [CrossRef]
  41. Bettencourt, L.M.A. The Origins of Scaling in Cities. Science 2013, 340, 1438–1441. [Google Scholar] [CrossRef] [Green Version]
  42. Bettencourt, L.; West, G. A Unified Theory of Urban Living. Nature 2010, 467, 912–913. [Google Scholar] [CrossRef]
  43. Bettencourt, L.M.A.; Lobo, J.; Helbing, D.; Kühnert, C.; West, G.B. Growth, Innovation, Scaling, and the Pace of Life in Cities. Proc. Natl. Acad. Sci. USA 2007, 104, 7301–7306. [Google Scholar] [CrossRef] [Green Version]
  44. Alves, L.G.A.; Mendes, R.S.; Lenzi, E.K.; Ribeiro, H.V. Scale-Adjusted Metrics for Predicting the Evolution of Urban Indicators and Quantifying the Performance of Cities. PLoS ONE 2015, 10, e0134862. [Google Scholar] [CrossRef]
  45. Bettencourt, L.M.A.; Lobo, J.; Strumsky, D.; West, G.B. Urban Scaling and Its Deviations: Revealing the Structure of Wealth, Innovation and Crime across Cities. PLoS ONE 2010, 5, e13541. [Google Scholar] [CrossRef] [Green Version]
  46. Arcaute, E.; Hatna, E.; Ferguson, P.; Youn, H.; Johansson, A.; Batty, M. Constructing Cities, Deconstructing Scaling Laws. J. R. Soc. Interface 2015, 12, 20140745. [Google Scholar] [CrossRef] [Green Version]
  47. Lei, W.; Jiao, L.; Xu, G.; Zhou, Z. Urban Scaling in Rapidly Urbanising China. Urban Stud. 2022, 59, 1889–1908. [Google Scholar] [CrossRef]
  48. Xiao, Y.; Gong, P. Removing Spatial Autocorrelation in Urban Scaling Analysis. Cities 2022, 124, 103600. [Google Scholar] [CrossRef]
  49. Li, R.; Dong, L.; Zhang, J.; Wang, X.; Wang, W.-X.; Di, Z.; Stanley, H.E. Simple Spatial Scaling Rules behind Complex Cities. Nat. Commun. 2017, 8, 1841. [Google Scholar] [CrossRef] [Green Version]
  50. Lobo, J.; Bettencourt, L.M.A.; Strumsky, D.; West, G.B. Urban Scaling and the Production Function for Cities. PLoS ONE 2013, 8, e58407. [Google Scholar] [CrossRef] [Green Version]
  51. Strano, E.; Sood, V. Rich and Poor Cities in Europe. An Urban Scaling Approach to Mapping the European Economic Transition. PLoS ONE 2016, 11, e0159465. [Google Scholar] [CrossRef]
  52. Ribeiro, H.V.; Hanley, Q.S.; Lewis, D. Unveiling Relationships between Crime and Property in England and Wales via Density Scale-Adjusted Metrics and Network Tools. PLoS ONE 2018, 13, e0192931. [Google Scholar] [CrossRef]
  53. Alves, L.G.A.; Ribeiro, H.V.; Lenzi, E.K.; Mendes, R.S. Distance to the Scaling Law: A Useful Approach for Unveiling Relationships between Crime and Urban Metrics. PLoS ONE 2013, 8, e69580. [Google Scholar] [CrossRef]
  54. Muller, N.Z.; Jha, A. Does Environmental Policy Affect Scaling Laws between Population and Pollution? Evidence from American Metropolitan Areas. PLoS ONE 2017, 12, e0181407. [Google Scholar] [CrossRef]
  55. Jiao, L.; Xu, Z.; Xu, G.; Zhao, R.; Liu, J.; Wang, W. Assessment of Urban Land Use Efficiency in China: A Perspective of Scaling Law. Habitat Int. 2020, 99, 102172. [Google Scholar] [CrossRef]
  56. Zhou, C.; Gong, M.; Xu, Z.; Qu, S. Urban Scaling Patterns for Sustainable Development Goals Related to Water, Energy, Infrastructure, and Society in China. Resour. Conserv. Recycl. 2022, 185, 106443. [Google Scholar] [CrossRef]
  57. Nordbeck, S. Urban Allometric Growth. Geogr. Ann. Ser. B Hum. Geogr. 1971, 53, 54–67. [Google Scholar] [CrossRef]
  58. Bettencourt, L.M.A.; Yang, V.C.; Lobo, J.; Kempes, C.P.; Rybski, D.; Hamilton, M.J. The Interpretation of Urban Scaling Analysis in Time. J. R. Soc. Interface 2020, 17, 20190846. [Google Scholar] [CrossRef] [Green Version]
  59. Ribeiro, F.L.; Meirelles, J.; Netto, V.M.; Neto, C.R.; Baronchelli, A. On the Relation between Transversal and Longitudinal Scaling in Cities. PLoS ONE 2020, 15, e0233003. [Google Scholar] [CrossRef]
  60. Depersin, J.; Barthelemy, M. From Global Scaling to the Dynamics of Individual Cities. Proc. Natl. Acad. Sci. USA 2018, 115, 2317–2322. [Google Scholar] [CrossRef] [Green Version]
  61. Fang, C.; Yu, D. Urban Agglomeration: An Evolving Concept of an Emerging Phenomenon. Landsc. Urban Plan. 2017, 162, 126–136. [Google Scholar] [CrossRef]
  62. Puga, D. The Magnitude and Causes of Agglomeration Economies. J. Reg. Sci. 2010, 50, 203–219. [Google Scholar] [CrossRef]
Figure 1. Population size in 267 prefectural cities in China in 2019. Note: The criteria for dividing city size by population are based on the “Notice on Adjusting the Criteria for Dividing City Size” issued by the State Council in 2014. Cities are divided into five categories. (1) Cities with a resident population of less than 500,000 in urban areas are small cities; (2) cities with a resident population of more than 500,000 and less than 1 million in urban areas are medium cities; (3) cities with a resident population of more than 1 million and less than 5 million in urban areas are large cities; (4) cities with more than 5 million and less than 10 million residents are supercities; (5) cities with more than 10 million residents are megacities.
Land 11 01803 g001
Figure 2. Temporal variation of scaling exponents of urban resilience indicators in China from 2006, 2010, 2015 and 2019.
Land 11 01803 g002
Figure 3. Spatial distribution of SAMI and per capita value of selected resilience indicators in 267 prefectural cities in China in 2019.
Land 11 01803 g003aLand 11 01803 g003bLand 11 01803 g003c
Table 1. Urban resilience index.
DimensionVariable
EconomyGDP (10,000 yuan)
Secondary Industry GDP (10,000 yuan)
Tertiary Industry GDP (10,000 yuan)
Saving Deposits (10,000 yuan)
Amount of Foreign Capital Actually Utilized (USD 10,000)
Total Fixed Assets of Industrial Enterprises above Designated Size (10,000 yuan)
Expenditure for Science and Technology (10,000 yuan)
SocietyRegistered Unemployed Persons
Undergraduate in Regular HEIs 1
Number of Beds in Medical Institutions
Collections of Public Libraries
Area of road (km2)
Number of Buses and Trolley Buses under Operation
EnvironmentArea of Green Land (hectare)
Volume of Industrial Wastewater Discharged (10,000 ton)
Volume of Sulphur Dioxide Emission (ton)
Volume of Industrial Soot(dust) Emission (ton)
1 Higher Education Institutions.
Table 2. Scaling parameters for urban resilience indicators in China in 2019.
Resilience IndicatorResilience DimensionScaling Law β R 2
GDPEconomysuperlinear1.01120.5394
Secondary Industry GDPEconomysuperlinear1.02870.4445
Tertiary Industry GDPEconomysuperlinear1.05860.5283
Saving DepositsEconomysublinear0.92950.5717
Foreign CapitalEconomysuperlinear1.77420.2832
Fixed AssetsEconomysublinear0.69230.2519
Expenditure for Science and TechnologyEconomysuperlinear1.39240.2216
Registered Unemployed PersonsSocietysublinear0.68640.3482
Undergraduate in Regular HEIsSocietysuperlinear1.14240.3805
Number of Beds in Medical InstitutionsSocietysublinear0.9140.7585
Collections of Public LibrariesSocietysublinear0.81310.3001
Area of roadSocietysublinear0.76690.2975
Number of BusesSocietysublinear0.82950.2737
Area of Green LandEnvironmentsublinear0.65390.2004
Industrial Wastewater DischargedEnvironmentsublinear0.76940.2042
Sulphur Dioxide EmissionEnvironmentsublinear0.27660.0324
Industrial Soot(dust) EmissionEnvironmentsublinear0.13290.0052
Table 3. Allometric growth of resilience indicators in Beijing, Fuzhou, and Urumqi from 2006 to 2019.
Resilience IndicatorResilience DimensionBeijingFuzhouUrumqi
GDPEconomy9.23 11.40 2.45
Secondary Industry GDPEconomy6.21 10.16 2.65
Tertiary Industry GDPEconomy10.17 13.42 2.33
Saving DepositsEconomy9.04 10.81 1.88
Foreign CapitalEconomy9.32 3.47 13.85
Fixed AssetsEconomy5.25 9.21 3.45
Expenditure for Science and TechnologyEconomy15.09 24.15 9.57
Registered Unemployed PersonsSociety−0.41 −0.38 0.57
Undergraduate in Regular HEIsSociety0.35 2.81 0.57
Number of Beds in Medical InstitutionsSociety3.28 4.75 0.67
Collections of Public LibrariesSociety4.14 5.67 1.14
Area of roadSociety2.79 6.48 0.98
Number of BusesSociety1.25 6.54 0.04
Area of Green LandEnvironment3.95 5.72 3.74
Industrial Wastewater DischargedEnvironment−0.81 −1.17 0.70
Sulphur Dioxide EmissionEnvironment−26.08 −10.05 1.19
Industrial Soot(dust) EmissionEnvironment−8.05 17.66 1.43
Publisher’s Note: MDPI stays neutral with regard to jurisdictional claims in published maps and institutional affiliations.

