Article

Citizen Science Approach for Assessing the Biodiversity and Ecosystem Service Potential of Urban Green Spaces in Ghana

by
Frederick Gyasi Damptey
1,2,*,
Nana Yeboaa Opuni-Frimpong
3,
Abdul Wahid Arimiyaw
2,4,
Felicity Bentsi-Enchill
5,
Edward Debrah Wiafe
6,
Betty Boante Abeyie
7,
Martin Kofi Mensah
8,
Daniel Kwame Debrah
9,
Augustine Oti Yeboah
10 and
Emmanuel Opuni-Frimpong
3,9
1
Department of Ecology, Brandenburg University of Technology Cottbus-Senftenberg, 03046 Cottbus, Germany
2
ForestAid Ghana, Accra 00233, Ghana
3
Department of Forest Science, School of Natural Resources, University of Energy and Natural Resources, Sunyani P.O. Box 214, Ghana
4
Department of Geography and Rural Development, Kwame Nkrumah University of Science and Technology, Kumasi 00233, Ghana
5
Department of Biology Education, Faculty of Science Education, University of Education, Winneba 00233, Ghana
6
School of Natural and Environmental Sciences, University of Environment and Sustainable Development, Somanya 00233, Ghana
7
Kumasi Wood Cluster Association, Kentinkrono, Kumasi 00233, Ghana
8
Institute of Surface Mining and Special Civil Engineering, Freiberg Technical University of Mining, 09599 Freiberg, Germany
9
Forestry Research Institute of Ghana, Council for Scientific and Industrial Research, Kumasi 00233, Ghana
10
Herp Conservation Ghana, Adum, Kumasi 00233, Ghana
*
Author to whom correspondence should be addressed.
Land 2022, 11(10), 1774; https://doi.org/10.3390/land11101774
Submission received: 8 September 2022 / Revised: 7 October 2022 / Accepted: 10 October 2022 / Published: 12 October 2022
(This article belongs to the Special Issue Ecosystem Services in Urban Contexts: Balancing City Environment)

Abstract

:
Urban green spaces are linked to good human health and well-being, sustainable cities and communities, climate action, life on land and under water, as well as offering a platform for quality nature-based education. Their efficient management will no doubt be necessary if strides are to be made in efforts to protect biodiversity and enhance ecosystem service delivery in urban areas. This will, in part, require building the capacity of community members as citizen scientists to take up conservation roles. This study explored the levels of biodiversity and the proxy-based ecosystem service potential of urban green spaces in Sunyani, Ghana, using citizen science approaches. The green spaces accessed were the University of Energy and Natural Resources Wildlife Sanctuary and Arboretum, the Sunyani Parks and Gardens, the Sunyani Residency Park, and the Sunyani Senior High School Woodlot. The different levels of biodiversity (trees, arthropods) and ecosystem services were observed for the five green spaces assessed, with a significant relationship observed between arthropod communities and vegetation variables. Our results showed that citizen scientists perceived urban green spaces to supply more significant provisioning and regulating services than any other ecosystem services, even though they were highly dissatisfied with how green spaces are managed. The children’s perception of the composition of nature was slightly narrow, as they largely centered on plants and animals only. Even so, their awareness of the value of nature was high, as were the threats of human activities to nature. Citizen science approaches could complement biodiversity studies in data-deficient regions; however, collected data may require additional verification and validation from experts for conclusive and better inferences.

1. Introduction

More than half of the world’s population (about 54%) presently lives in urban areas (cities and towns), a setting with incredible biodiversity, but sparsely explored in some regions in terms of biodiversity research and knowledge dissemination [1,2]. The urban population is projected to increase to about 66% by 2050, with most growth occurring in developing countries [3]. This growth is thus expected to present immediate and future challenges to urban ecosystems, as it can influence how people perceive, appraise, and interact, with green spaces within urban settings [4,5]. Approaches to counteract or minimize the anticipated urbanization challenges, while enhancing urban resilience, could embroil nature-based solutions (i.e., integrating ecosystem-based approaches to addressing societal issues such as climate change, human health and well-being [6]. This may include the creation of green facilities or the maintenance of existing ones in accordance with the United Nations Sustainable Development Goal 11 (Sustainable cities and communities [7])).
Urban green spaces (UGSs) are natural and semi-natural ecological systems that are either completely or partially covered with grass, trees, and other forms of vegetation, in urban areas [8,9]. Green spaces have long been recognized as having enormous benefits, from social vitalities to environmental well-being [10,11]. In addition, UGSs offer several ecosystem services to local human communities [12] through the direct mitigation of urban temperatures, improving overall air quality [13], mitigating floods and run-off [14], serving as recreation grounds, supporting biodiversity, and improving food security [10]. Hence, urban green spaces help in achieving critical sustainable development goals, including: good health and well-being (Goal 3); inclusive and equitable quality education, a platform for nature-based training programmes (Goal 4); sustainable cities and communities (Goal 11); climate action (Goal 13); life below water (Goal 14); and life on land (Goal 15) [7]. The capacity of UGSs to support biodiversity and provide ecosystem services is driven by factors including: their landscape configuration; the quality and quantity of green facilities; the effectiveness of management approaches; human population density; and the maintenance of functions and processes within such ecosystems [15,16].
Notwithstanding the socio-economic, cultural, and environmental contributions, of UGSs in most parts of the world, they remain marginalized in many national and regional management programmes, especially in developing countries [11], and suffer from encroachment, destruction, and land-use transformation, which limits their capacity to support biodiversity and ecosystem service provision [10,17]. For instance, a lack of coordination among stakeholders and land-tenure issues led to a remarkable reduction in the size of green spaces in Ghana’s garden city of Kumasi [18]. Similarly, Puplampu and Boafo [19] highlighted a lack of and/or poor planning by city authorities as the cause of the reduction in green spaces (dense vegetation and grassland) from about 59 km2 (1991) to about 21 km2 (2018) in the city of Accra. Likewise, Guenat et al. [20] identified the lack of coordination and community participation, as well as population growth, as some underlying factors impeding efficient UGS management and the services they provide in Malawi.
It is obvious that the effective management of UGSs in developing regions will no doubt be needed if strides are to be made in efforts to protect biodiversity and enhance ecosystem service delivery in urban areas. Management and planning should hence be community-focused, involving participatory community engagement, which could equip all communities with the relevant skills to make informed conservation decisions. Several forms of participatory community engagements in urban green space management have evolved, including citizen science. In citizen science, non-professional local volunteers collaborate with professional researchers to collect scientific data and carry out public outreach [21,22,23]. Most citizen science programmes aim to promote good environmental stewardship and enhance scientific literacy and social capital [22,24], while collaboratively addressing various societal challenges with scientists and non-scientific volunteers [25]. These volunteers usually help set the agenda for the project, contribute to the project design, and assist in data collection, result interpretation, and dissemination [21].
Individuals or the public tend to visualize, feel, and perceive nature in myriad ways, affecting how they value green spaces. People exposed to nature are more environmentally conscious than those isolated from nature [26]. People and nature are tied by interconnectivity that can be premised on affective and emotional responses, and ultimately reflected in people’s perceptions of their environment and their articulation of them [27]. In terms of understanding places, spaces, and their use, it is helpful to consider perceptual dimensions and to explore, for example, the user’s perceptions of places and preferences for places and landscape styles [28]. Exploring nature and how people perceive nature provide insights into human-nature integration [29].
Although several studies have been conducted on UGSs in Ghana and worldwide [11,30], most of these works have, in principle, utilized limited citizen science approaches. More importantly, there is a paucity of knowledge on citizen science research in most developing countries, including Ghana. To the best of our knowledge, this study represents the first assessment of the biodiversity and ecosystem service potential of urban green spaces in an understudied region of the world (Ghana) using a citizen science approach. Specifically, we: (i) assessed the levels of biodiversity and proxy-based ecosystem services of five green spaces in Ghana through field-based sampling approaches, (ii) explored the perception of the public of the state of UGSs as well as the ecosystem services derived from UGSs using the semi-structured questionnaire survey, and (iii) solicited children’s views of what nature means to them as well as their willingness to care and protect nature based on an environmental perception scale. Applying the citizen science approach may offer an in-depth understanding and practical experience of the biodiversity attributes and the various ecosystem services of UGSs, and how they can be sustainably managed for the perpetual flow of benefits to societies in this era of global climate change.

2. Materials and Methods
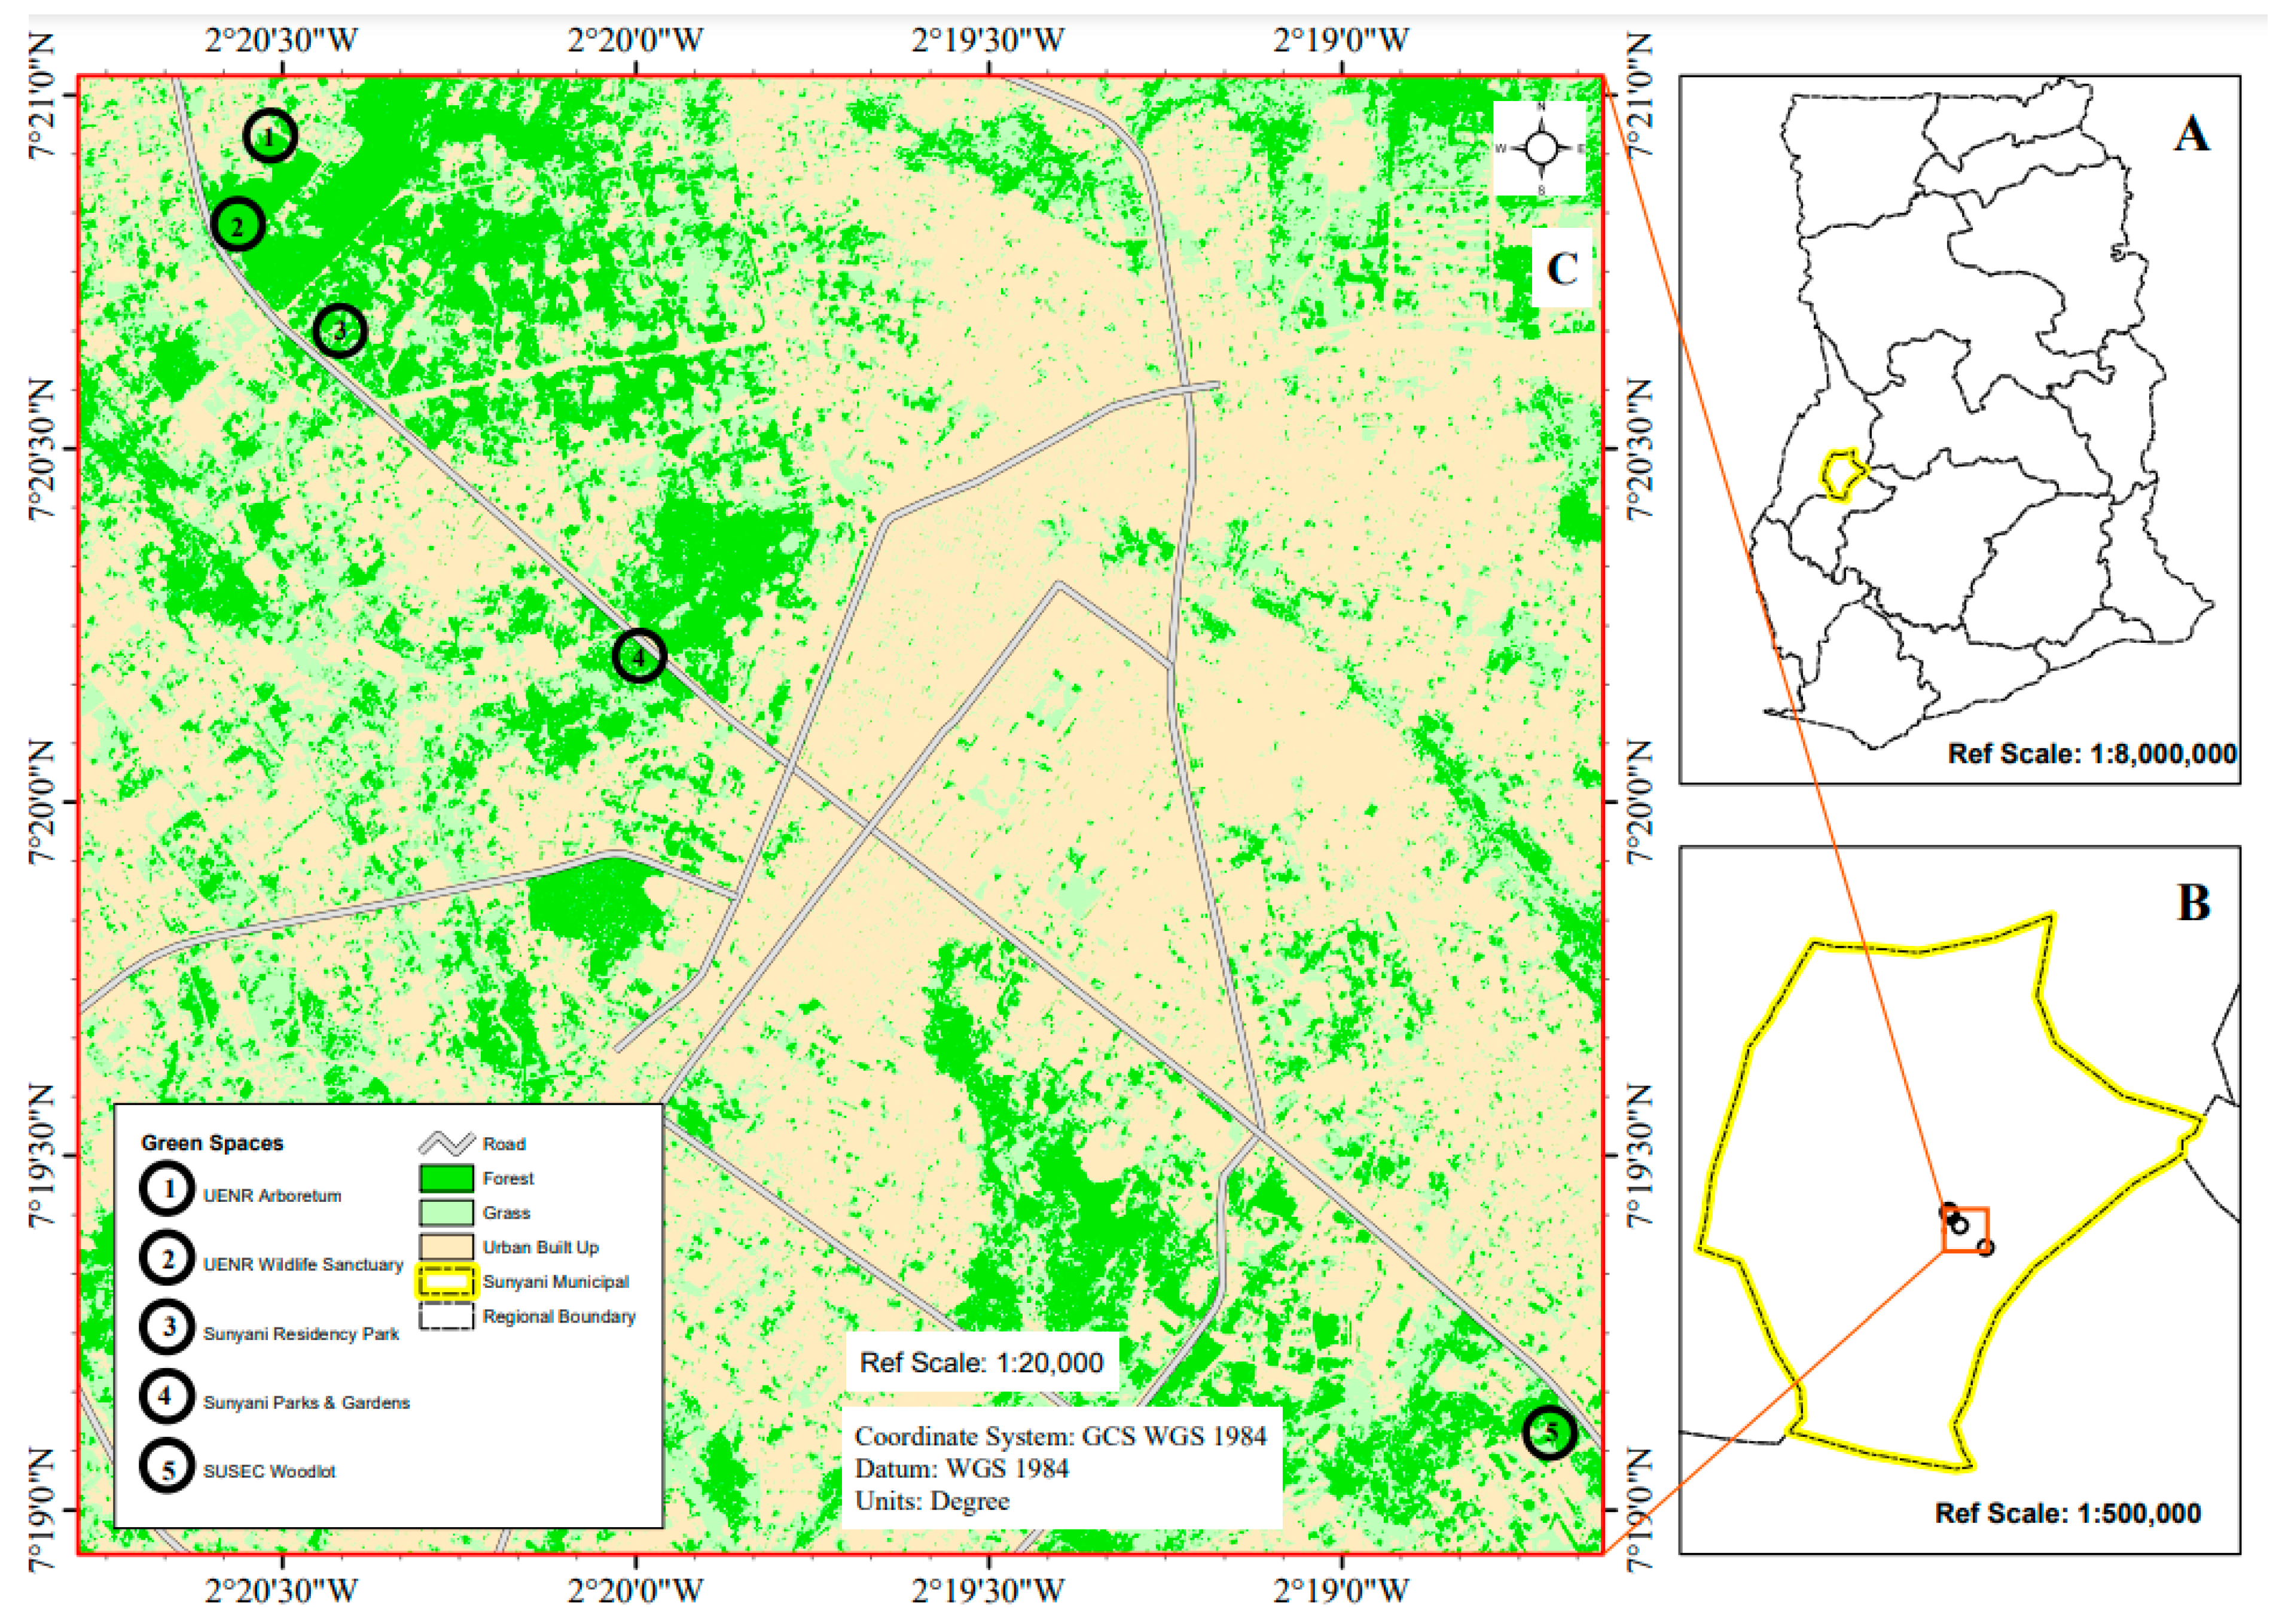
2.1. Study Area

The study was conducted in Sunyani, the capital of the Bono Region of Ghana. Sunyani is located on a transitional agro-ecological belt between latitude 7°55′51.53″ N and longitude 1°40′49.01″ W and covers an area of approximately 829.3 km2 [31]. Sunyani is one of the fastest growing cities in Ghana, with population growth increasing from 123,224 (2010) to 193,595 (2021) and approximately 59% of the population living in urban areas [32]. Sunyani is characterized by several patches of green spaces covered with grasses, lower structure vegetation and a mixture of indigenous and exotic tree species on the periphery and within the city. The green spaces studied within the city of Sunyani are: (1) the University of Energy and Natural Resources Arboretum, (2) the University of Energy and Natural Resources Wildlife Sanctuary, (3) the Sunyani Residency Park, (4) Sunyani Parks and Gardens, and (5) Sunyani Senior High School (SUSEC) Woodlot (Figure 1; Table 1). Because of the relatively high temperature and humidity of Sunyani [33], these green spaces are tipped to play several roles in climate change mitigation, while providing several ecosystem goods and services to residents.
The University of Energy and Natural Resources Wildlife Sanctuary (hereafter referred to as the UENR Wildlife Sanctuary; Green space 2) is located at latitude 7°20′49.01″ N, longitude 2°20′33.8″ W, and covers an area of approximately 3.67 hectares. Its tree composition includes both indigenous (e.g., Ceiba pentandra, Mansonia altissima, Griffonia simplicifolia, Terminalia superba, Triplochiton scleroxylon, Newbouldia laevis, Spathodia campanulata, Khaya senegalensis) and exotic (e.g., Tectona grandis, Senna siamia, Eucalyptus grandifolia) trees serving as habitats for several wildlife species (Table 1). Just adjacent to the Wildlife Sanctuary is a bat-colonized arboretum (hereafter referred to as the UENR Arboretum; Green space 1). The arboretum covers an area of approximately 0.68 hectares on latitude 7°20′56.55″ N, longitude 2°20′31.03″ W. In addition to the arboretum characteristic canopy tree cover (e.g., Solanum erianthum, Triplochiton scleroxylon, Ceiba pentandra, Deloniix regia, Holarrhena floribunda, Newbouldia laevis, Broussonetia papyrifera, Azadiractha indica, Ficus exasperata, Morus mesozygia), the understorey is predominantly covered with grasses and some flowers, giving some atheistic landscape appeal. The arboretum had the name “Bat-Colonised Arboretum” because most canopy trees are colonized by Eidolon helvum (Straw Colored Fruit Bats), which often defoliates tree bark, feeds on the fruits of trees and uses tree canopies as habitat [34]. The Sunyani Residency Park (Green space 3) covers an area of about 5.67 hectares, located on latitude 7°20′39.98″ N, longitude 2°20′25.11″ W, and characterized by multi-layered grass cover and avenue tree species (e.g., Albizia lebbeck, Eucalyptus camaldulensis, Pachira glabra, Khaya senegalensis, Allamanda cathartica, Tabernaemontana elegans, Hibiscus rosa-senensis, Phyllostachys aurea, Furcraea foetida). Sunyani Parks and Gardens (Green space 4) is a recreational park located in the middle of Sunyani township, closer to the Sunyani branch of the Bank of Ghana, and lies at latitude 7°20′12.72″ N longitude 2°19′57.85″ W covering an area of about 18.98 hectares. The Parks and Gardens are occupied by tree and shrub species such as Azadirachta indica, Gmelina arborea, Ficus vasta, Cedrela odorata, Pethecellobium dulce, Peltophorum pterocarpum, Blighia sapida, Millettia thonningii, Albizia saman, Lagerstroemia speciose, Cereus hexaqonus, and Bauhinia purpurea. At the entrance of Sunyani Senior High School is about 1.95 hectares of woodlot (Green space 5) consisting of Tectona grandis and Anacardium occidentale to provide shade and food resources and to meet the school’s energy needs. The woodlot is located at latitude 7°19′6.50″ N and longitude 2°18′42.33″ W.

2.2. Data Collection Procedure

Data collection was in two phases: a direct field sampling for biodiversity (based on tree species diversity and arthropod taxonomic richness) and ecosystem services potential (based on proxies) of the green spaces (Table 2), and an indirect perception survey where participant’s views about the potential ecosystem services they perceived to obtain from urban green spaces were solicited through semi-structured questionnaires.

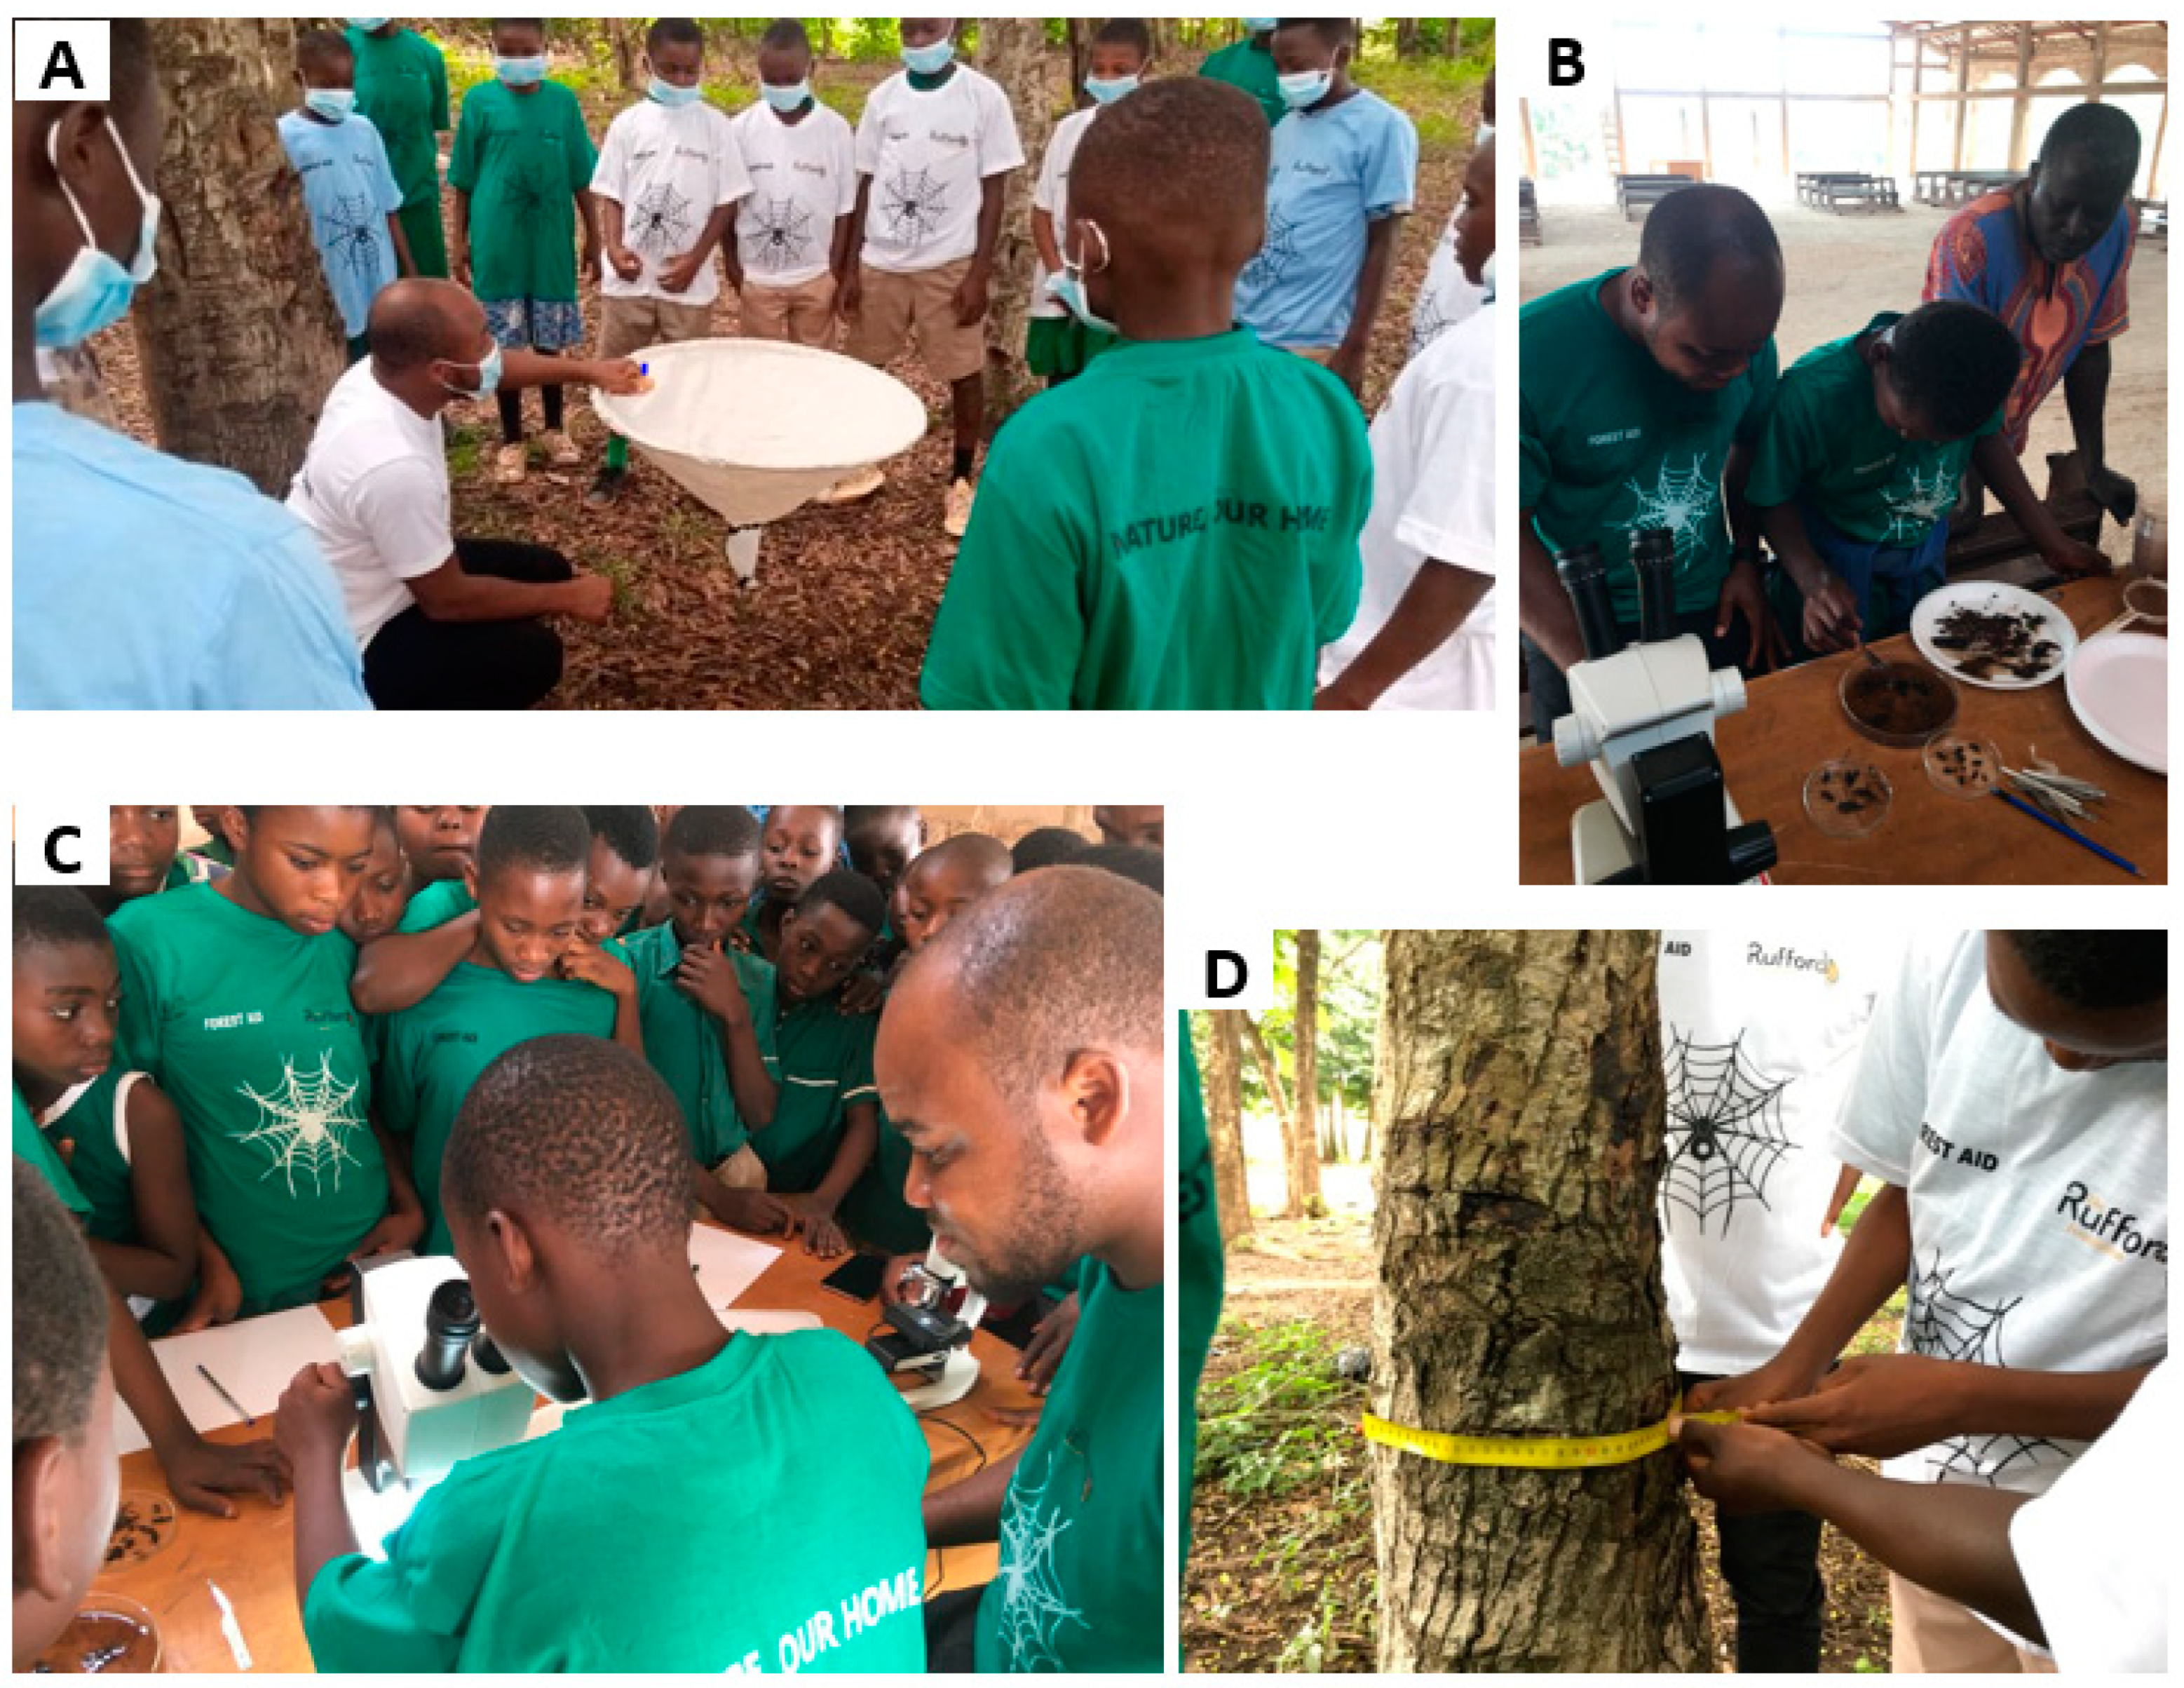
2.2.1. Participant Selection and Training

The selection of participants as citizen scientists started with a workshop (to introduce participants to the concept of biodiversity and citizen science), followed by focus group discussions (to solicit people’s indigenous views on the importance of nature). Citizen scientists comprised 150 adolescents and adults (high school, university, and nonstudents) and 120 children from six basic schools (participants selected from upper primary) in the Sunyani metropolis, Ghana. Head teachers of all primary schools gave informed consent for their pupils to participate in the survey. In addition, parents or guardians also gave written consent before their children were allowed to participate in the project. Schools were selected based on their location (close to Sunyani) and the availability and motivation of schools to host the citizen science project. Citizen scientists were then trained in plot demarcation and sampling for basic biodiversity attributes (trees and arthropods) and encouraged to adopt the principle of “do-it-yourself” to sampling biodiversity attributes (measuring tree diameter, height, canopy, among others) in urban green spaces. Citizen scientists were exposed to the decomposition experiment by burying tea bags for 90 days and monitoring, harvesting, drying, and weighing the tea bags for decomposition rate estimation. In addition, they were guided to carry out arthropod sampling using the beating tray, and pitfall traps, sorted arthropod samples into taxonomic groups, and measured tree diameter (Figure 2).

2.2.2. Biodiversity and Proxy-Based Ecosystem Services Data Collection

For each green space selected, citizen scientists demarcated six plots with sizes of 20 m × 20 m based on the standardized pacing method. Plot measurements were verified with a 50 m measuring tape by experts. Participants were trained and guided to sample biodiversity attributes (plants and arthropods) in the five urban green spaces. Based on indigenous knowledge and experience, we counted, recorded, and identified all trees with a diameter ≥ 10 cm at breast height (dbh) to species (based on local names), while assigning local uses to each identified tree. Local tree names were verified, each assigned a scientific name by an experienced botanist (taxonomy was after Hawthorne and Jongkind [36]). Individual tree dimensions were measured or estimated (diameter measured with either diameter tape or a digital caliper, height of trees estimated using a Nikon Forestry pro II Laser Rangefinder, percentage tree canopy openness estimated from pictures taken with a digital camera). Enumerated tree species were then classified into proxy-based ecosystem services following Damptey et al. [35]. Based on individual tree dimensions (measured diameter, estimated height and specific wood density values obtained from the Global Wood Density Database [37]), we estimated tree above-ground biomass using an improved allometric equation for the tropical region [ ( ln ( AGB )   =   α   +   β ln ( p   ×   D 2   ×   H )   +   ε ; [38]]. We then assumed 50% of the above-ground biomass of each tree as the carbon stock at the stand level [39]. Other plot scale variables, such as litter depth (measured with a 30 cm ruler at the corners and the center of the plot) and vegetation cover (analyzed from images taken with a digital camera on mid-sunny days), were also recorded on the plot level by citizen scientists.
Arthropods were sampled with pitfall traps (locally constructed from transparent disposable cups with sizes 400 × 518 mL) and covered with biodegradable plates with a 164 mL radius to prevent dilution of trap liquid by rain. Traps were also covered with a selective wire grid to avoid litter-fall and to minimize by-catch. For each plot, we installed five pitfall traps (four at the corners and one in the center) flush with the ground to sample the activity density of epigeal arthropod fauna. Pitfall traps were filled with a 50:50% mixture of propylene glycol and water, and samples were emptied weekly, with sampling lasting for 10 weeks. Catch samples were stored in 70% ethanol and later sorted into taxonomic groups (order, suborder) by citizen scientists (with guidance from experienced taxonomists) in the laboratory. Samples were classified into major feeding groups as proxies for ecosystem service-providing organisms (decomposers, predators) following Damptey et al. [35].
We quantified the rate of decomposition as a proxy for nutrient cycling in each green space using the tea bag index approach [40]. Thirty red (Lipton Rooibos Tea) and green (Lipton Green Tea Sencha) tea bags were buried in each urban green space for 90 days. We harvested 10 bags for each color per green space at 30-day intervals, followed by drying and weighing in the laboratory for specific weight loss and calculating the decomposition rate constant.

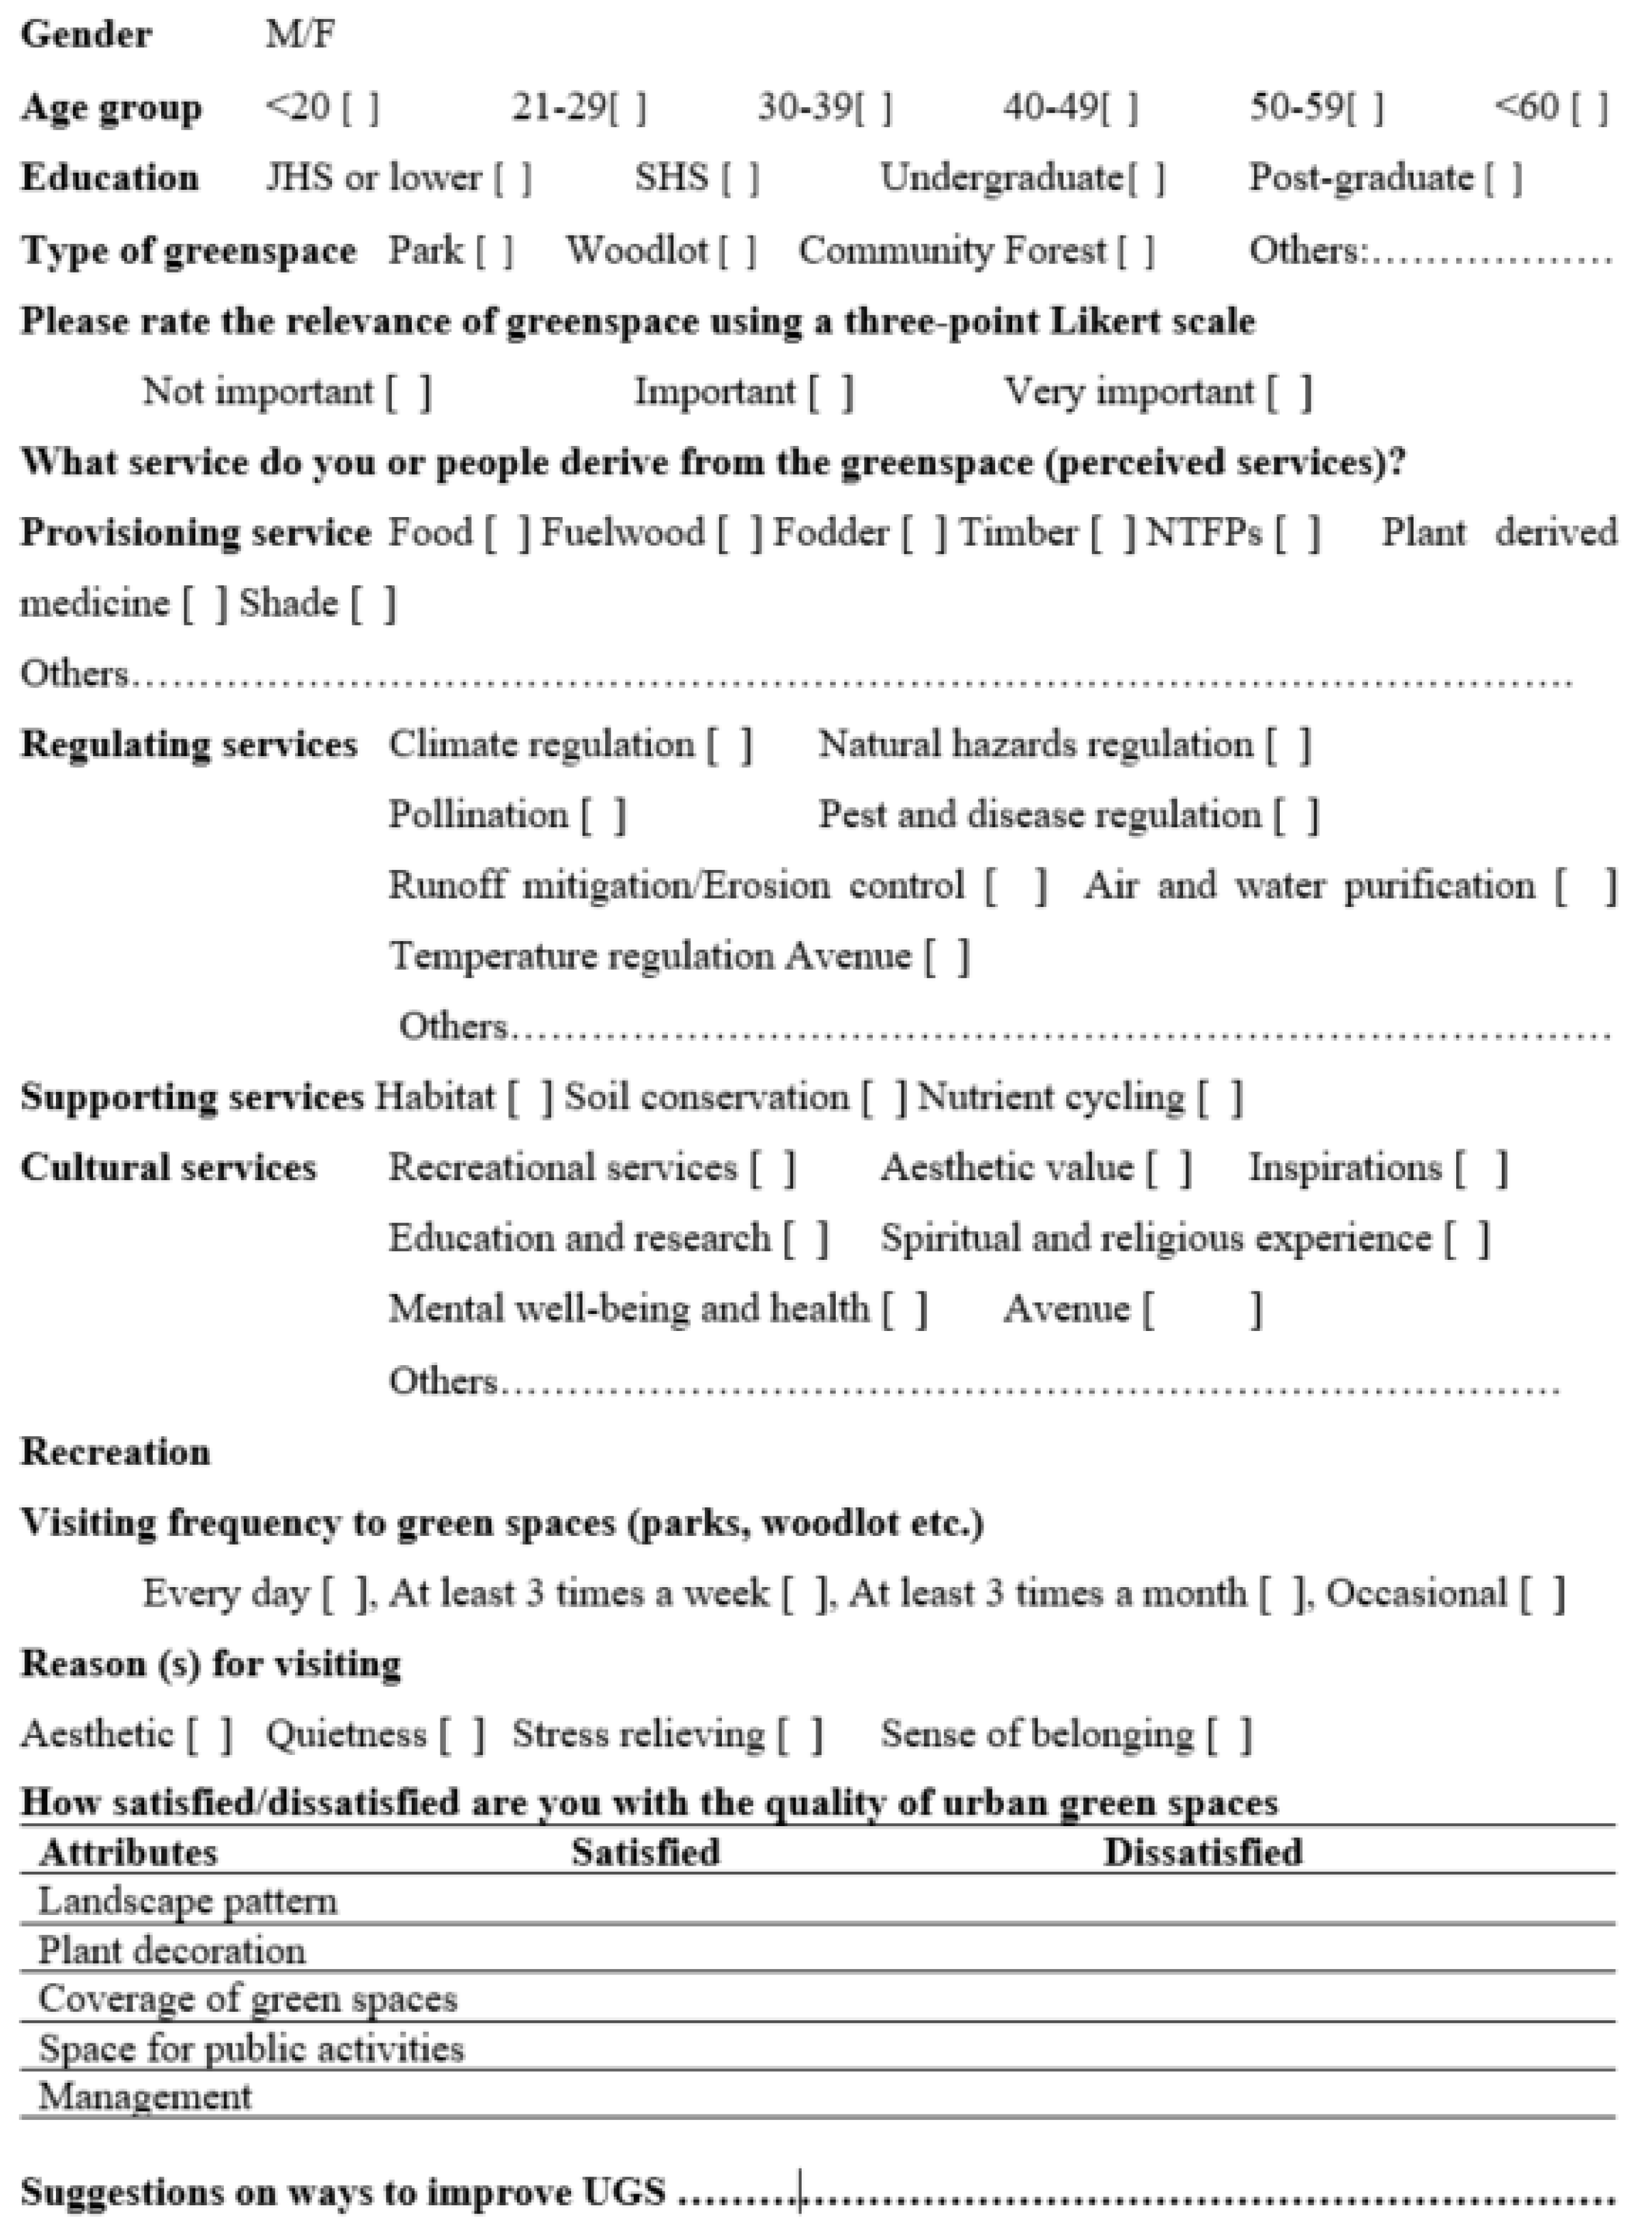
2.2.3. Perception-Based Ecosystem Services Data Collection

The citizen scientists’ perceptions of biodiversity attributes and the benefits of urban green spaces in terms of ecosystem service provision were revealed through semi-structured questionnaires comprising both closed and open-ended questions. In all, 150 questionnaires were distributed to citizen scientists to solicit their views on the importance of urban green spaces. Specific themes, including the type of green spaces, their level of relevance to people, the frequency at which they visit and their reasons for visiting green spaces, were revealed through a questionnaire survey. In addition, people’s perceptions about the types of ecosystem services offered by the urban green spaces were also revealed through similar questionnaires. Furthermore, people’s level of satisfaction with the quality and management of urban green spaces was revealed, in addition to some possible suggestions for improving urban green spaces to enhance their ecosystem service delivery.
Basic school children in the upper primary (from classes 4 to 6) between the ages of 8 and 14 were engaged to unravel their perceptions of nature and what nature means to them. Overall, 120 questionnaires were administered across six basic schools in the Sunyani metropolis. In assessing children’s interests, attitudes, perceptions, and concerns towards nature, we adopted the Children Environmental Perception Scale [41] and Love and Care for Nature Scale [42]. Accordingly, the Children Environmental Perception Scale measures children’s interests in nature and their attitudes and concerns about environmental issues based on 16 agree/disagree statements on a five-point scale (1; strongly disagree, 5; strongly agree; [41,43]). Similarly, the Love and Care for Nature Scale measures an individual’s emotions that translate into their responsibilities and commitments to protect nature based on selected statements on a seven-point scale (1; strongly disagree, 7; strongly agree; [42,43]. Each question was read aloud multiple times and translated into one of the most common local languages (Twi) to prevent any form of misunderstanding. Children were given ample time to respond to each statement and encouraged to ask questions and provide candid answers, as their anonymity was assured. The children confirmed their choices for each statement by thumb printing, circling, or crossing with a pen, which they feel relates to them most.

2.3. Data Analysis

The final analysis for the study was made based on 120 out of 150 questionnaires retrieved from citizen scientists and 120 retrieved from basic school children. The data obtained were transferred into Microsoft Excel for further processing. Descriptive statistics were used to summarize the data gathered from the respondents. The results were presented using tables, graphs, and radar plots. To ensure that our findings met the desired rigor, the preliminary results were shared with citizen scientists in participating schools for their input, feedback and clarification, which helped refine the results presented.
Biological data were log-transformed (log(x + 1)), and habitat attributes were normalized for further analysis. Significant differences for all attributes between green spaces were evaluated with a one-factorial permutation multivariate analysis of variance (PERMANOVA) design based on the Bray-Curtis similarity measure and unrestricted permutation (N = 9999) with “green space” as a fixed factor and plots nested in green space as random factors [44,45]. Multivariate relationships between plots and ecosystem service proxies were graphically represented with a non-metric multidimensional scaling ordination (NMDS) based on GOWER similarities. Significant proxies were further superimposed as vectors on the NMDS ordination based on Pearson correlation coefficients, and the goodness of fit of the ordination was evaluated using the stress value [44]. The explanatory power of vegetation attributes on the differences in arthropod communities was evaluated with a distance-based linear model (DistLM) using the BEST selection procedure and R2 criterion at a permutation of 9999 [46]. We performed all statistical analyses and visualized our results with the PRIMER version 7 [47], Microsoft Excel or the R software (version 2.15.3; [48]).

3. Results

3.1. Field Sampling of Biodiversity Attributes

Biodiversity Attributes of the Urban Green Spaces

Overall, 51 plant species were enumerated across the five green spaces and assigned to five uses (timber, food, fodder, fuelwood, and plant-derived medicine; Appendix A Table A1). Tree biodiversity differed significantly between the five UGS(s) (F4,25 = 12.53; p < 0.001; Figure 3A), with the Wildlife Sanctuary being the most diverse tree community characterised by the dominance of Ceiba pentandra, Triplochiton scleroxylon, Eucalyptus grandifolia, Tectona grandis and Senna siamea. On the other hand, Azadirachta indica and Gmelina arborea were the dominant trees in the Parks and Gardens, and only two tree species (Tectona grandis and Anacardium occidentale) were found in the Woodlot plots.
Arthropod taxonomic richness also differed significantly between the green spaces (F4,25 = 98.04; p < 0.001; Figure 3B). Similar to the tree diversity, the Wildlife Sanctuary has a significantly higher taxonomic richness compared to the other green spaces. However, lower taxonomic richness was recorded for the Woodlot and Parks and Gardens plots. The Residency Park plots were characterized by a higher activity density of Araneae and Orthoptera, Orthoptera and Hymenoptera characterized the Woodlot, Orthoptera and Coleoptera characterized the Wildlife Sanctuary, and Orthoptera and Araneae characterized the Parks and Gardens. In contrast, the Arboretum was characterized by higher activities of Orthoptera, Coleoptera and Hymenoptera. Arthropod community composition differed between the Arboretum and the Residency Park (t = 2.34; p = 0.004), Arboretum and Woodlot (t = 4.53; p = 0.006), Arboretum and Parks and Gardens (t = 3.66; p = 0.003), Residency Park and Woodlot (t = 6.01; p = 0.001), Residency Park and Wildlife Sanctuary (t = 2.56; p = 0.011), Residency Park and Parks and Gardens (t = 4.05; p = 0.003), Woodlot and Wildlife Sanctuary (t = 2.86; p = 0.012), Woodlot and Parks and Gardens (t = 2.26; p = 0.002) and Wildlife Sanctuary and Parks and Gardens plots (t = 2.80; p = 0.003). However, no statistically significant difference was observed between the Arboretum and the Wildlife Sanctuary (t = 1.19; p > 0.05).

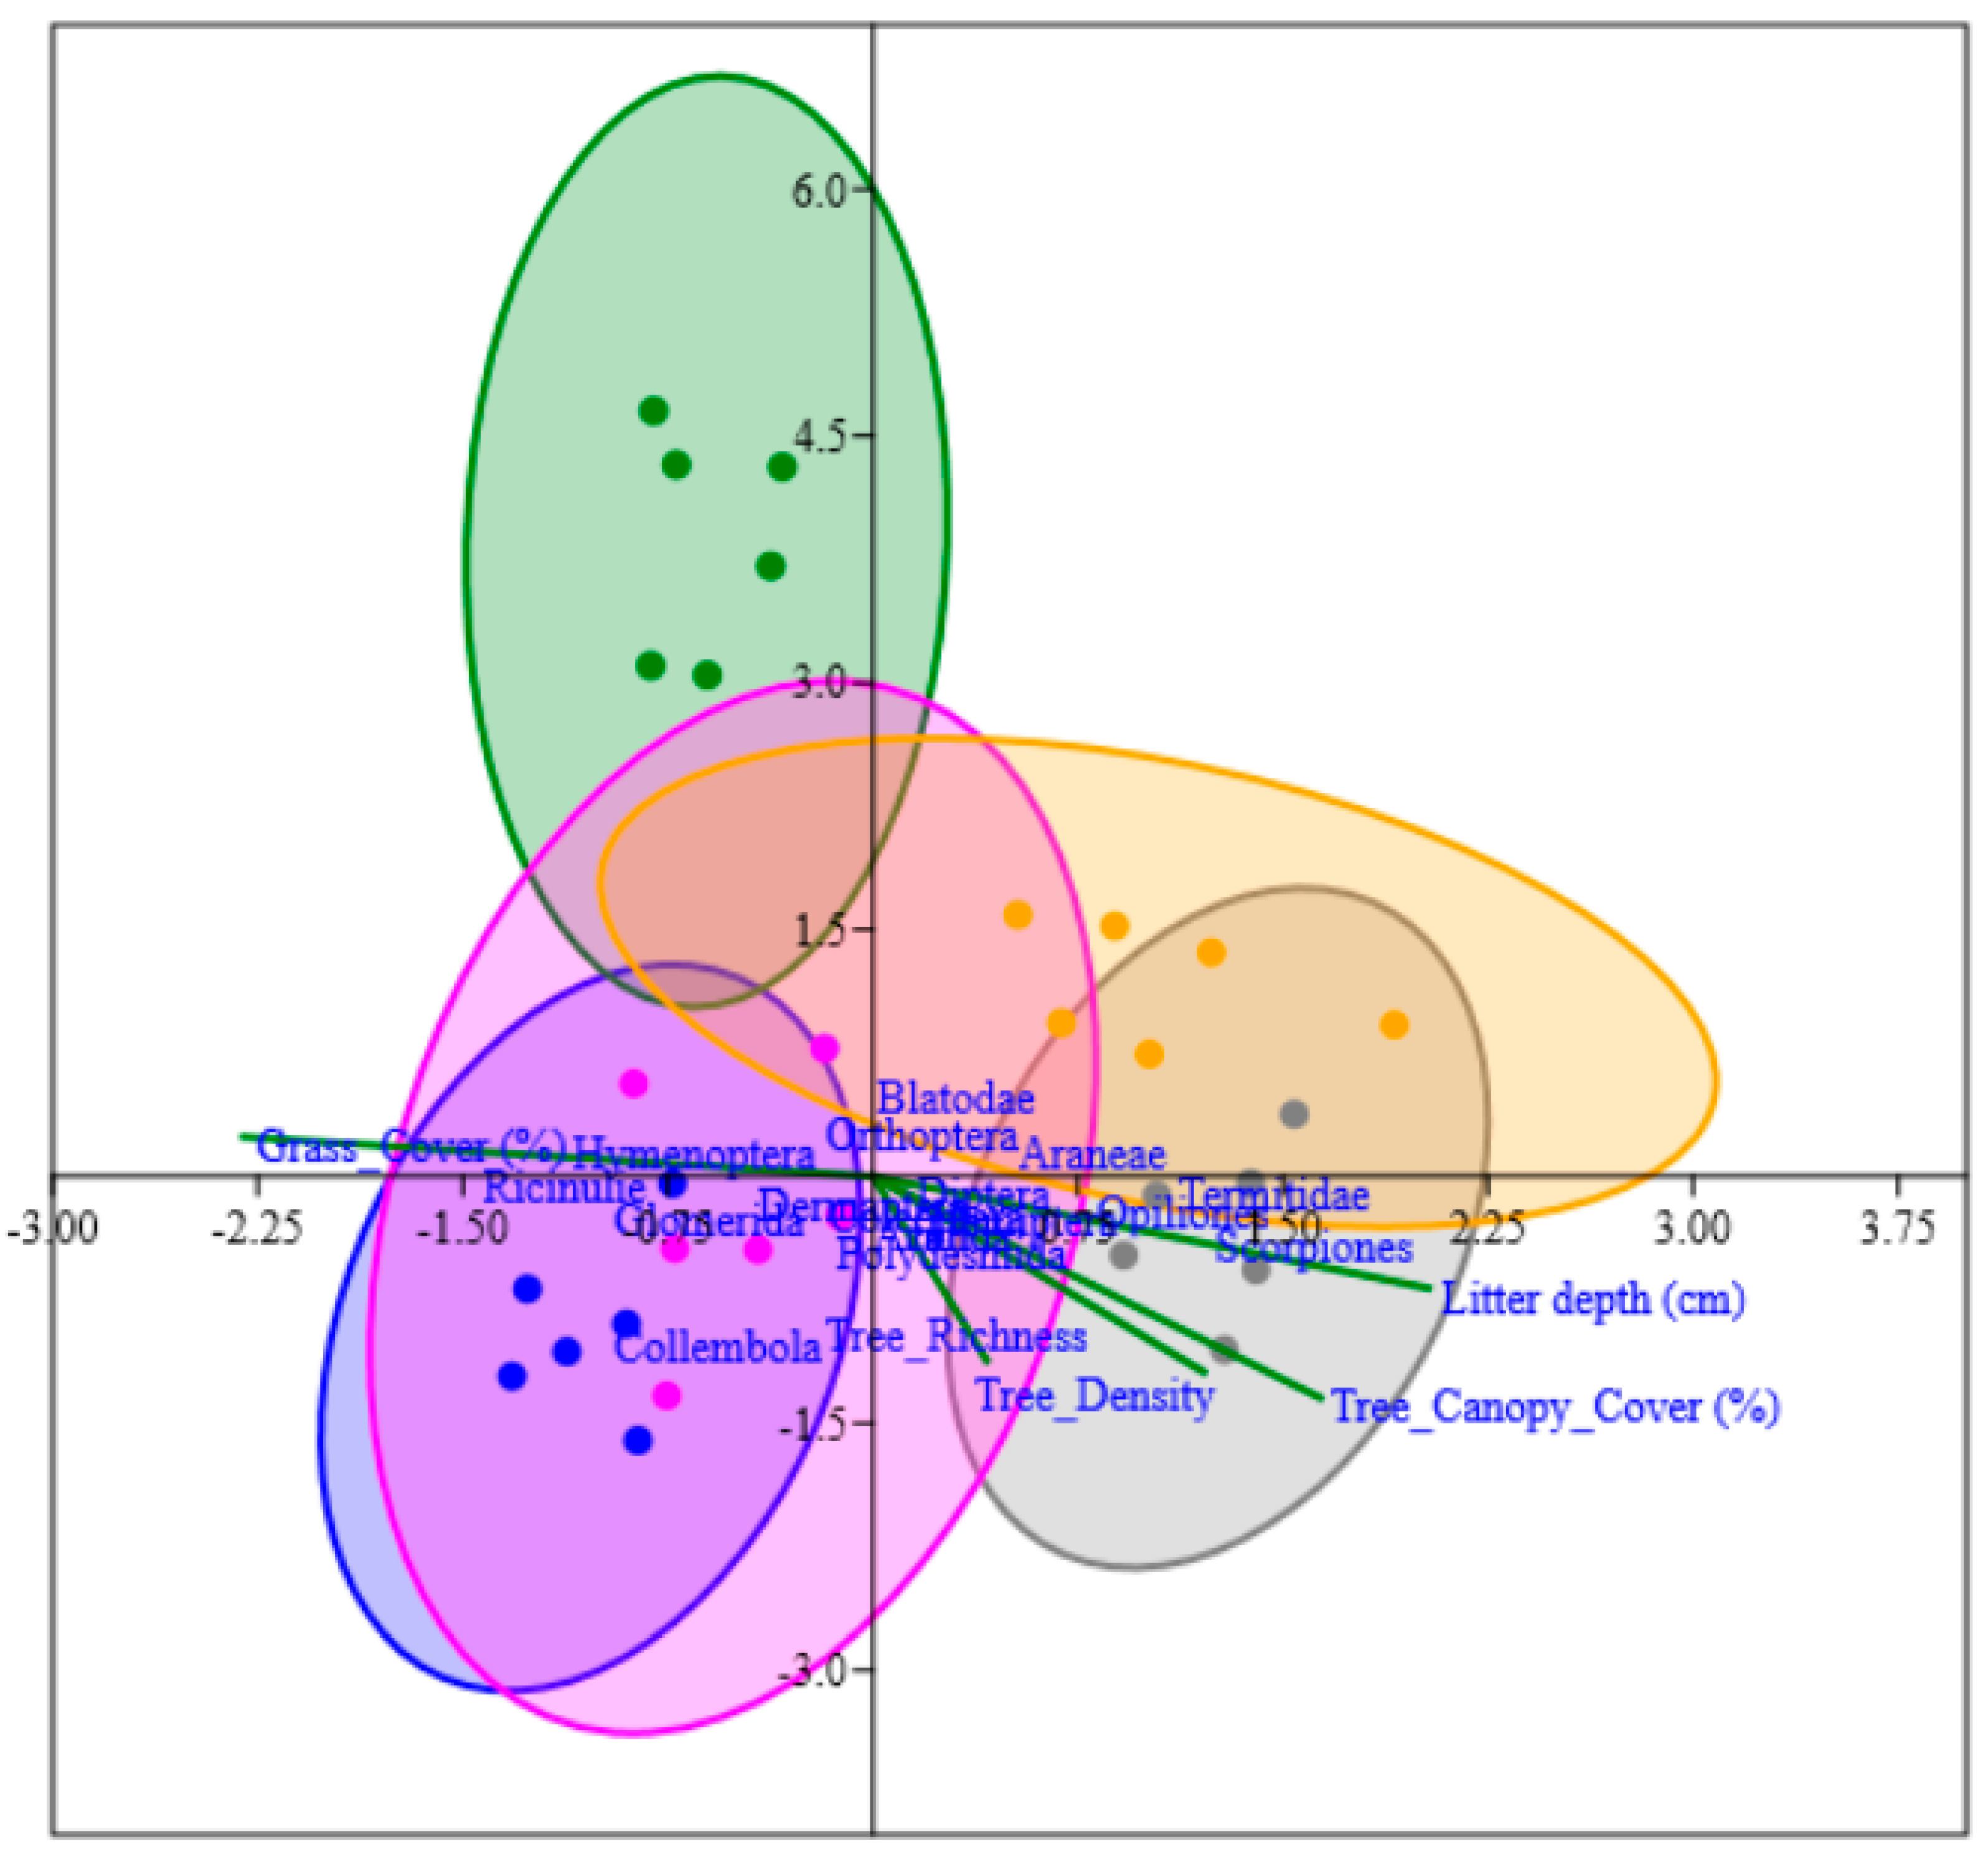
3.2. Relationship between Arthropod Taxonomic Groups and Vegetation Characteristics across the Green Spaces

A significant relationship was observed between arthropod communities and vegetation variables (p < 0.001), with the first principal axis explaining 74% of the variation (p < 0.001) and the second axis explaining 14% of the total variation (p = 0.004). The CCA triplot showed that Termitidae and Scopiones were closely associated with a higher proportion of litter depth and a higher percentage of canopy closure in the Wildlife Sanctuary. Hymenoptera and Orthoptera were also associated with higher percentages of grass cover in the Residency Park (Figure 4).

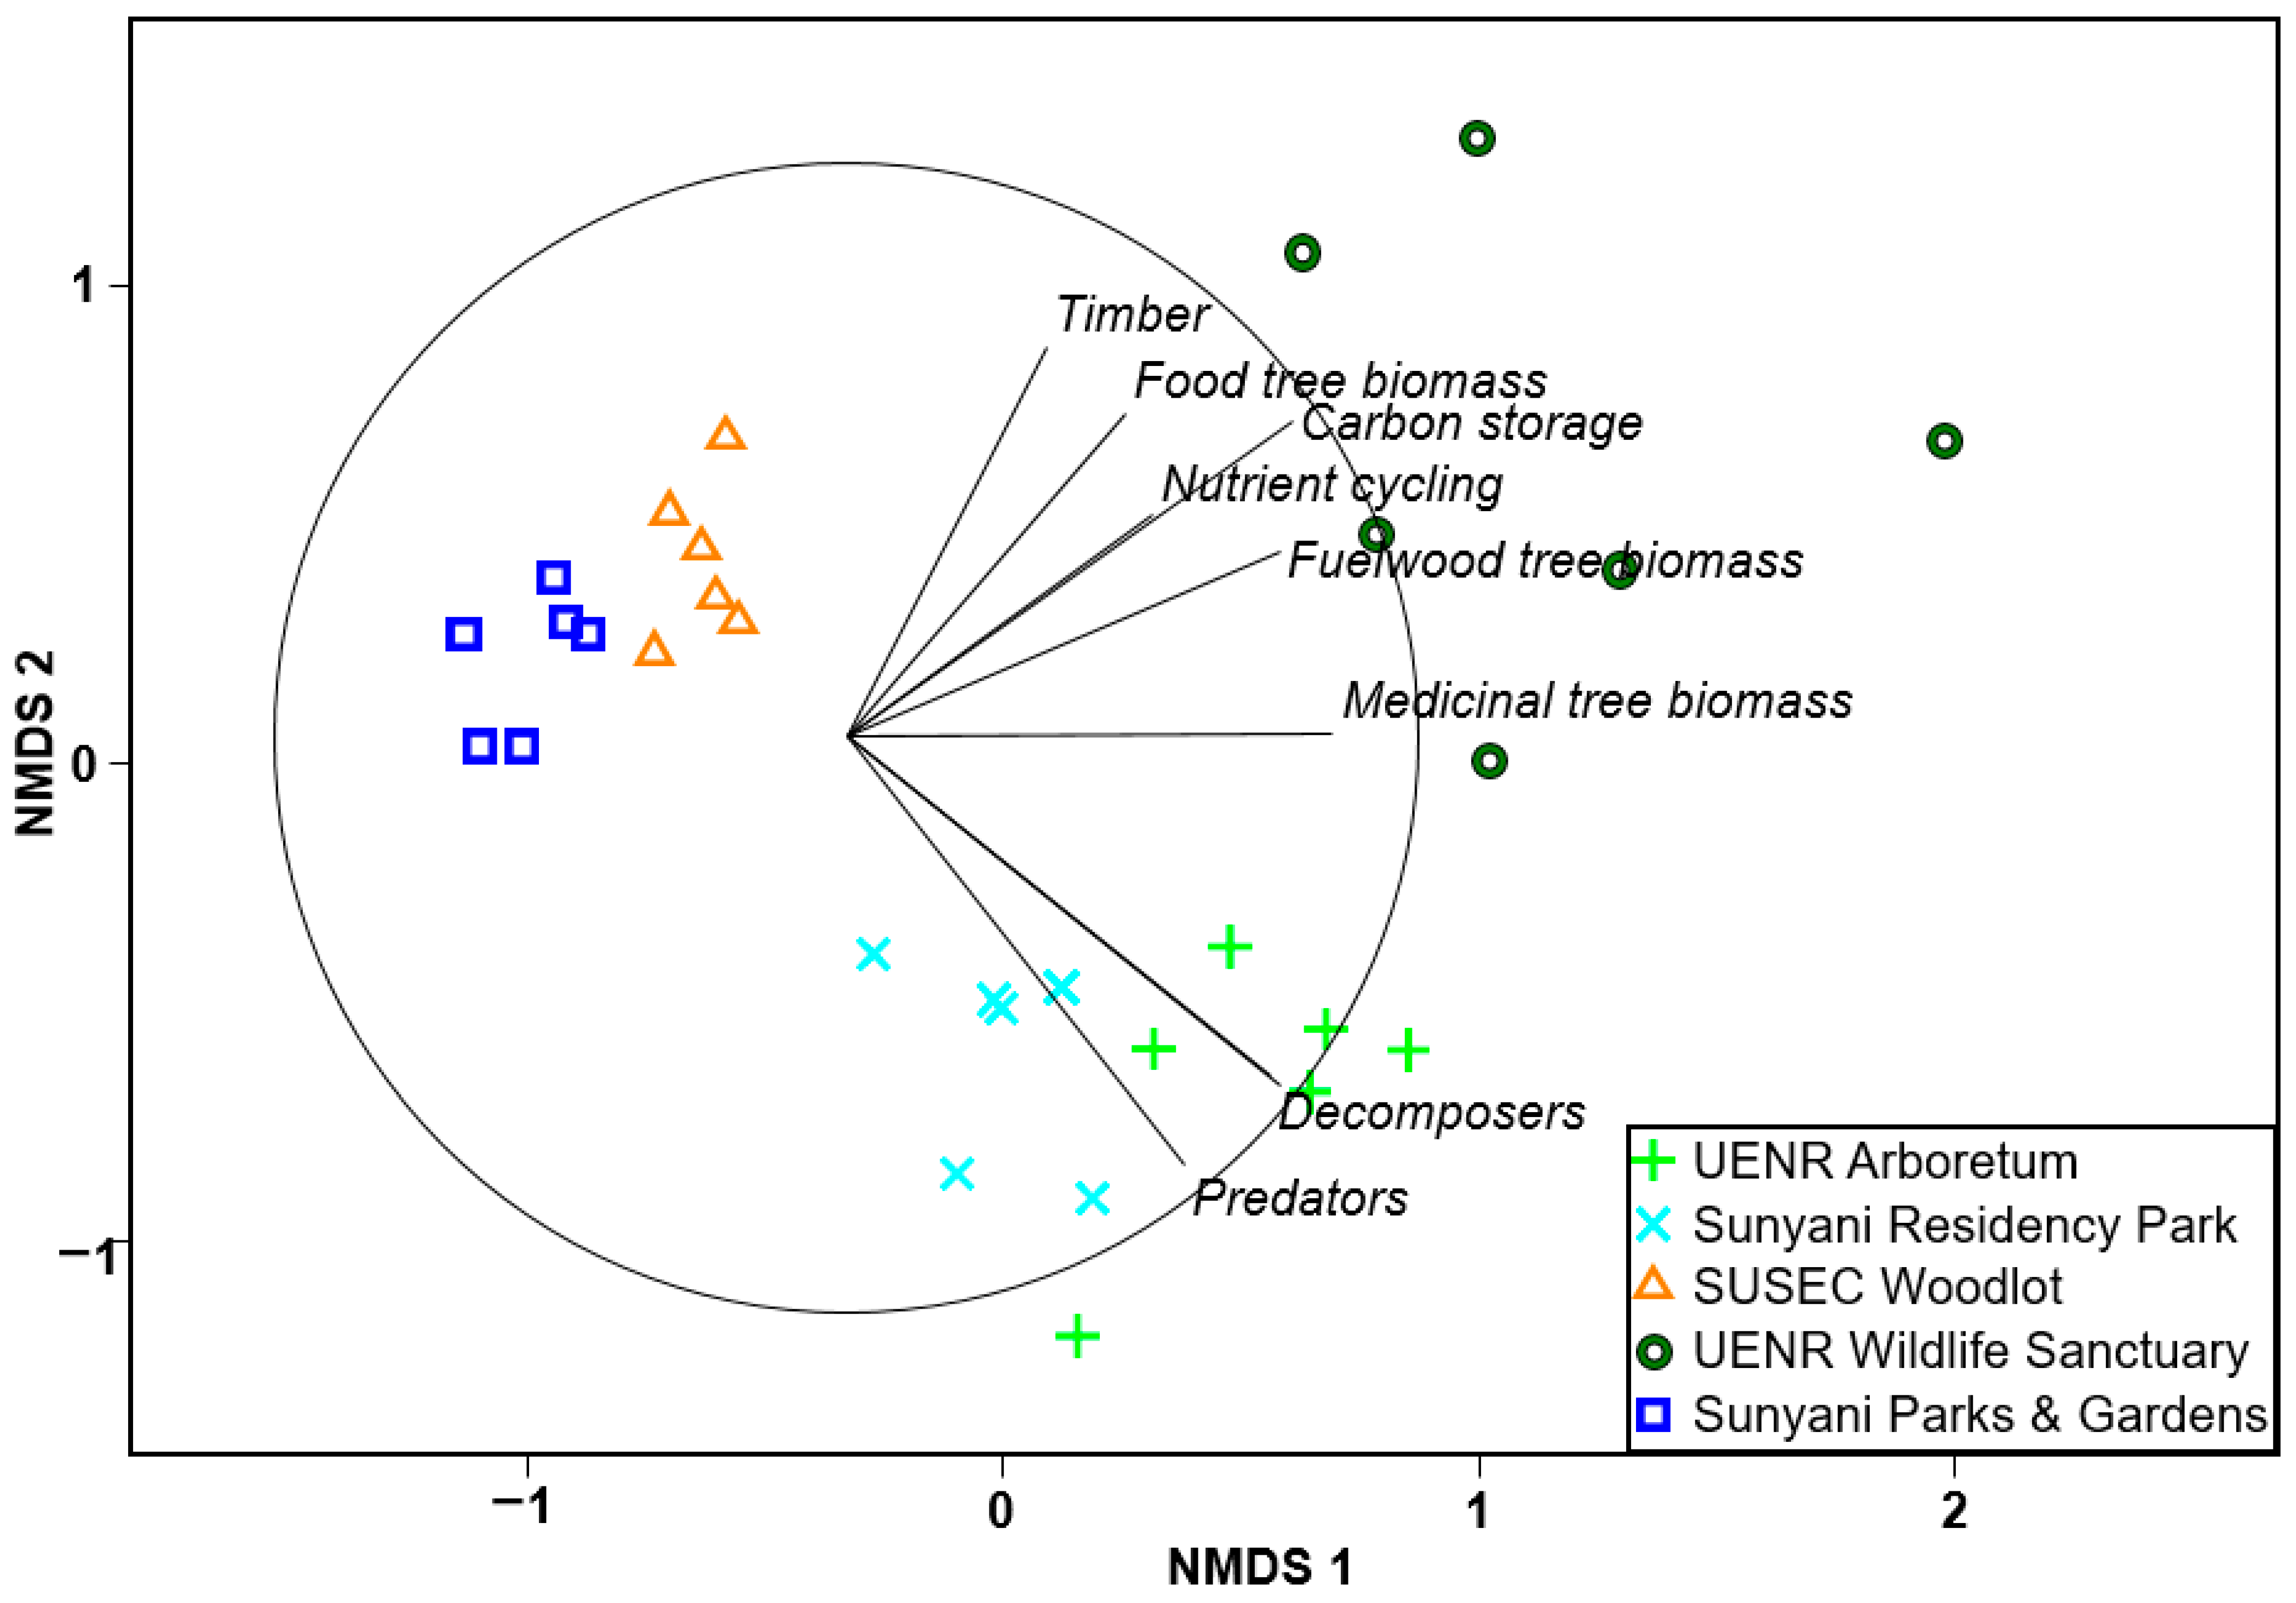
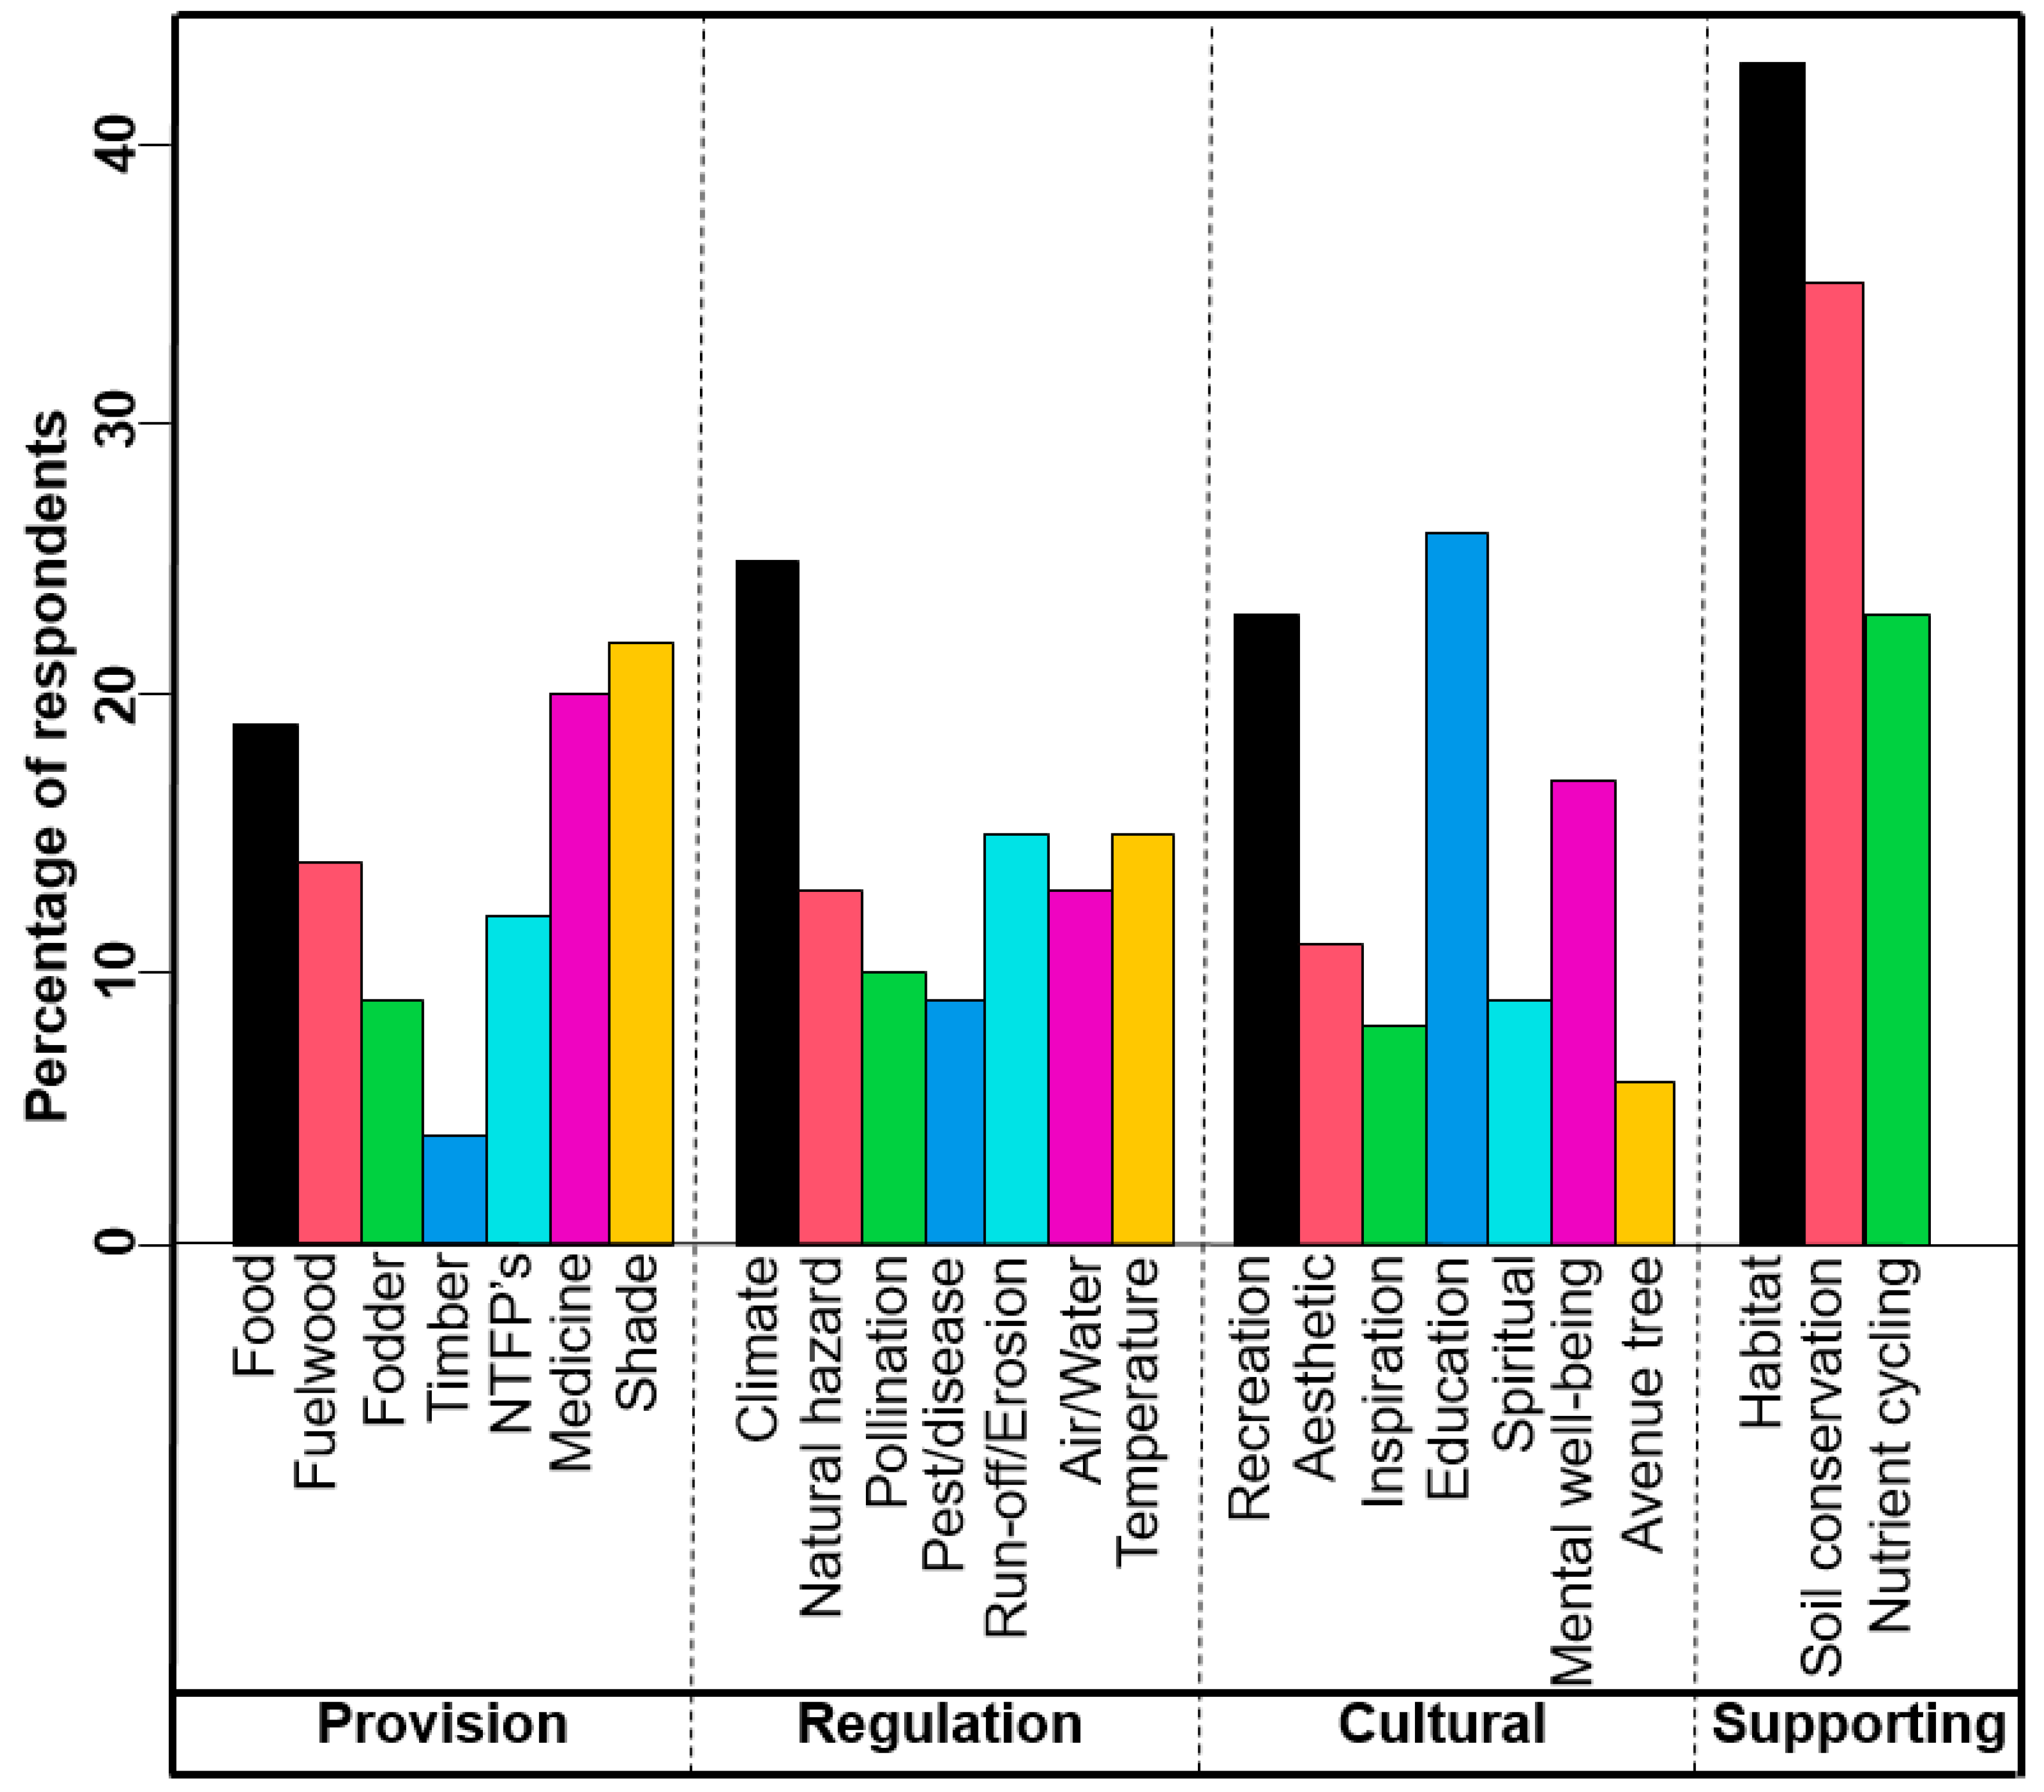
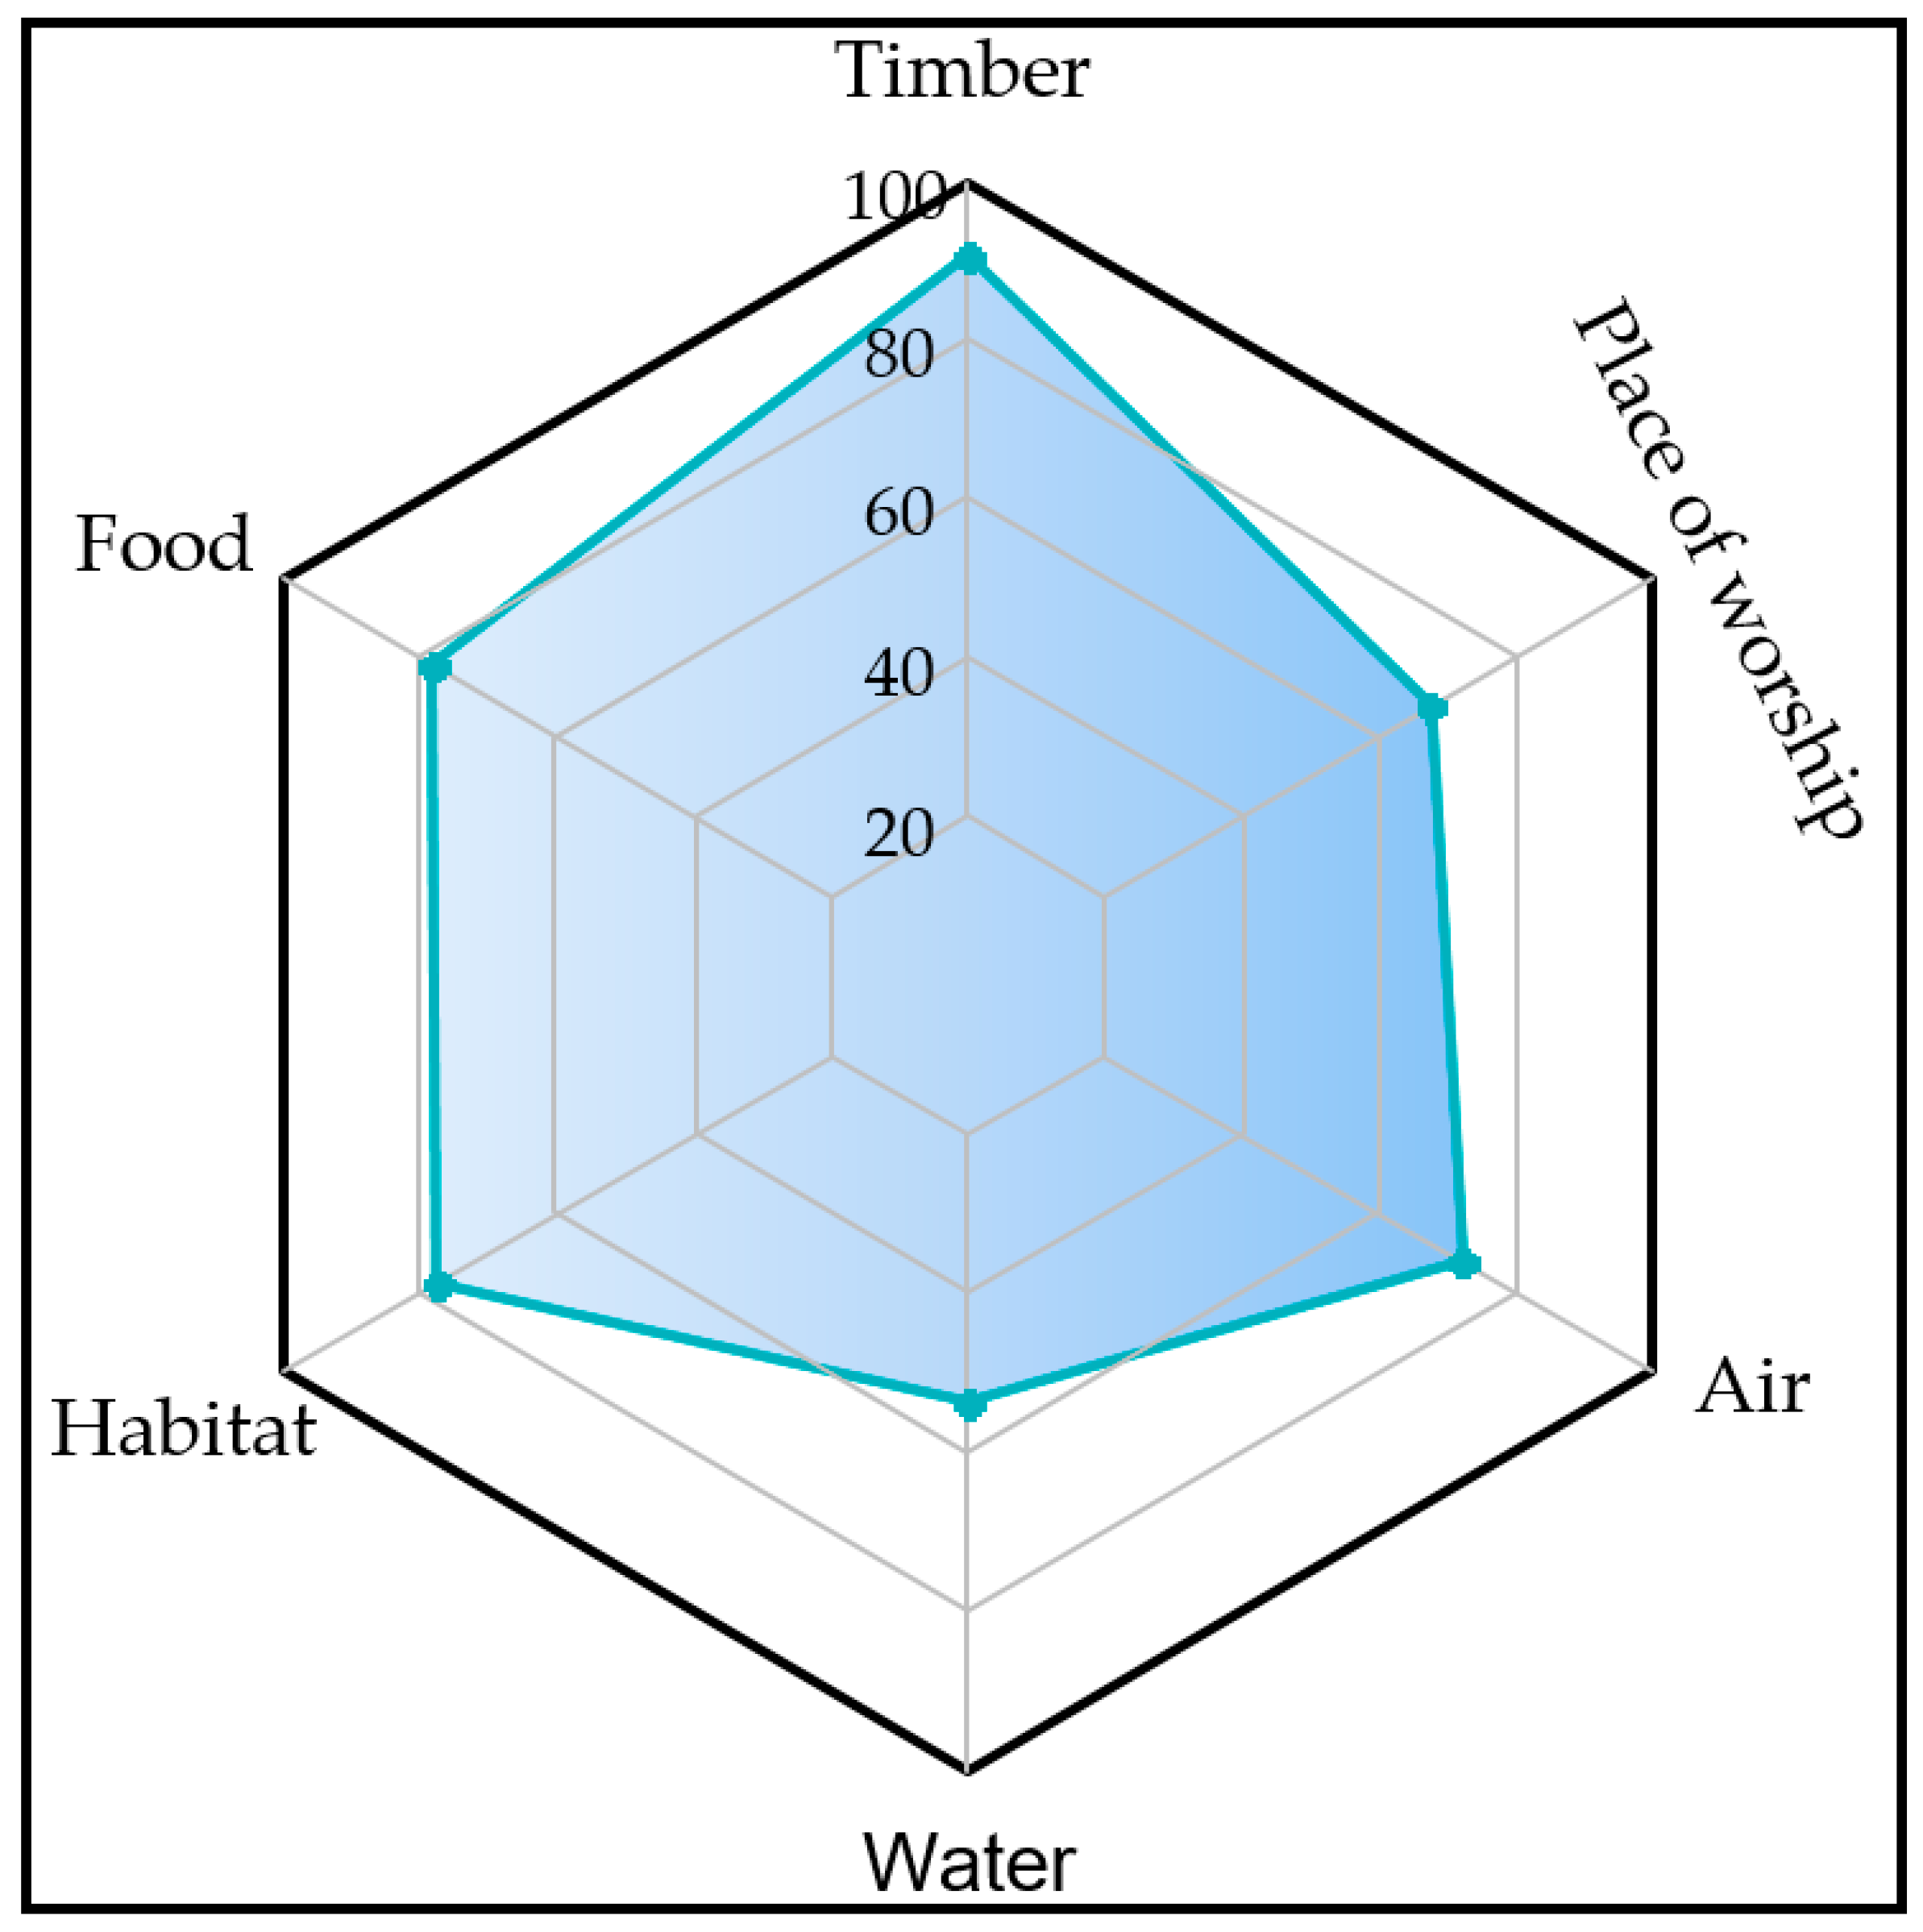
3.3. Ecosystem Services of the Urban Green Spaces

A joint multivariate analysis of all ecosystem service proxies revealed statistically significant differences between the green spaces (F4,25 = 26.78; p < 0.001). Three main clusters were observed, with Parks and Gardens and the Woodlot plots being uniquely separated from the other green spaces. Most of the ecosystem service proxies showed a higher affinity to the Wildlife Sanctuary, but ecosystem service-providing organisms (decomposers, predators) showed a higher affinity to the plots in the Arboretum and the Residency Park (Figure 5).

3.4. Citizen’s Perception of Ecosystem Services Provisioning of Urban Green Spaces

Respondent Demographic and Social Profile

Out of the 150 questionnaires distributed to citizen scientists, 120 were retrieved, representing an approximately 80% response rate. Of these, 48% were male, and 52% were females, with ages ranging from 18 to 65, with the dominant participant’s age ranging between 20 to 29 years (73%) and under 20 years (11%). Approximately 83% of the respondents had some level of education, with the majority being undergraduate students (50%; Table 3). Most respondents (98%) find the UGS to be relevant, with most of them preferring community forest (57%) to either park (38%) or woodlot (4%). However, the majority of respondents visit their preferred UGS occasionally (56%) to relieve stress (45%), to have some quietness (26%), for its aesthetic nature (17%), or as a sense of belonging (12%; Figure 6).

3.5. Citizen Scientists’ Perception of ES(s) Derived from UGSs

In terms of ecosystem services, respondents perceived UGSs to supply significantly higher provisioning services (44%) than cultural (32%), regulation (18%), or supporting (6%) services (p < 0.041). Most respondents perceived shade provision (22%) as the most important provisioning service derived from UGSs. Plant-derived medicine (20%) and food (19%) were other provisioning services respondents perceived to derive from UGSs. In terms of regulation services, climate (25%), run-off/erosion control (15%), and temperature regulation (15%), were perceived to be the most important services provided by UGSs. A greater proportion of respondents perceived habitat (43%), soil conservation (35%), and nutrient cycling (22%), as the most important supporting services provided by UGSs. Most respondents perceived education (26%), recreation (23%), and mental well-being (17%), as the most important cultural services provided by UGSs (Figure 7).

3.6. Quality of UGSs

In general, 66% of the respondents were satisfied, and 34% were dissatisfied with the quality of UGS(s). Specifically: 69% were satisfied, 31% were dissatisfied with landscape patterns; 82% were satisfied, 18% were dissatisfied with plant decorations; 68% were satisfied with the coverage of green spaces, 32% were dissatisfied; 71% were satisfied with the spaces available for public activities and 29% were dissatisfied. However, the majority (61%) were dissatisfied with the management of the UGSs (Table 4).

3.7. Suggested Ways of Improving the Quality of UGS(s)

Respondents indicated six management options to improve UGSs capacity to continue supplying their perceived services to society. While most respondents believed that better management and supervision (59%) was the way to improve the quality of UGSs, others were of the view that tree planting (20%), specifically multi-purpose tree species, community engagement and education (16%), law implementation and enforcement (4%), as well as pest control (1%), could be sustainable options to enhance the quality of UGSs.

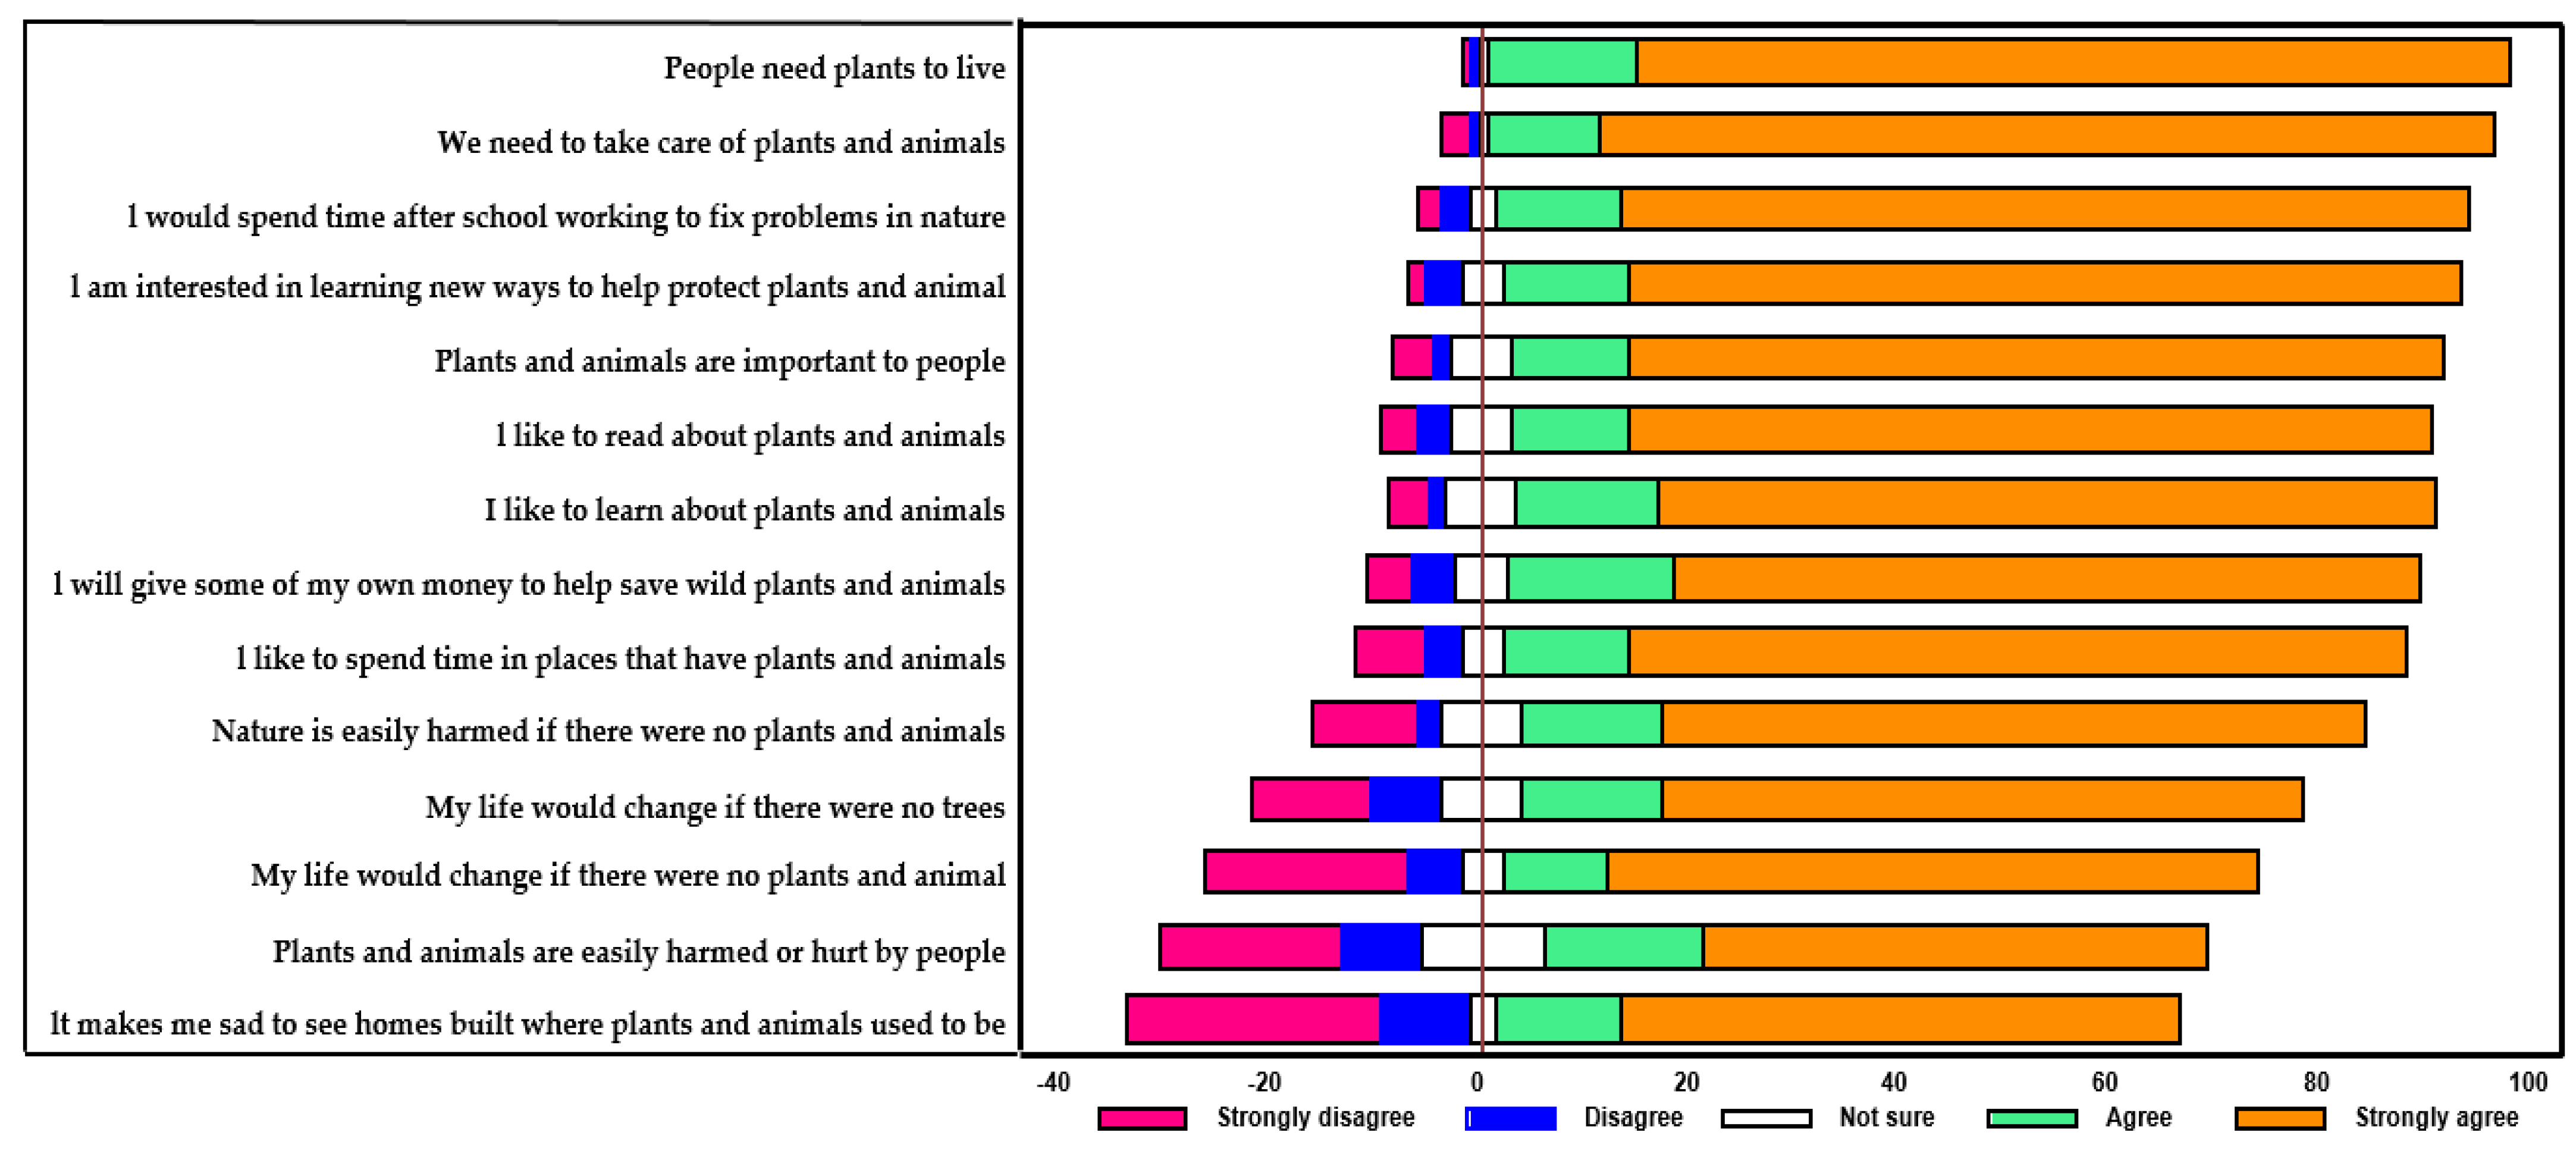
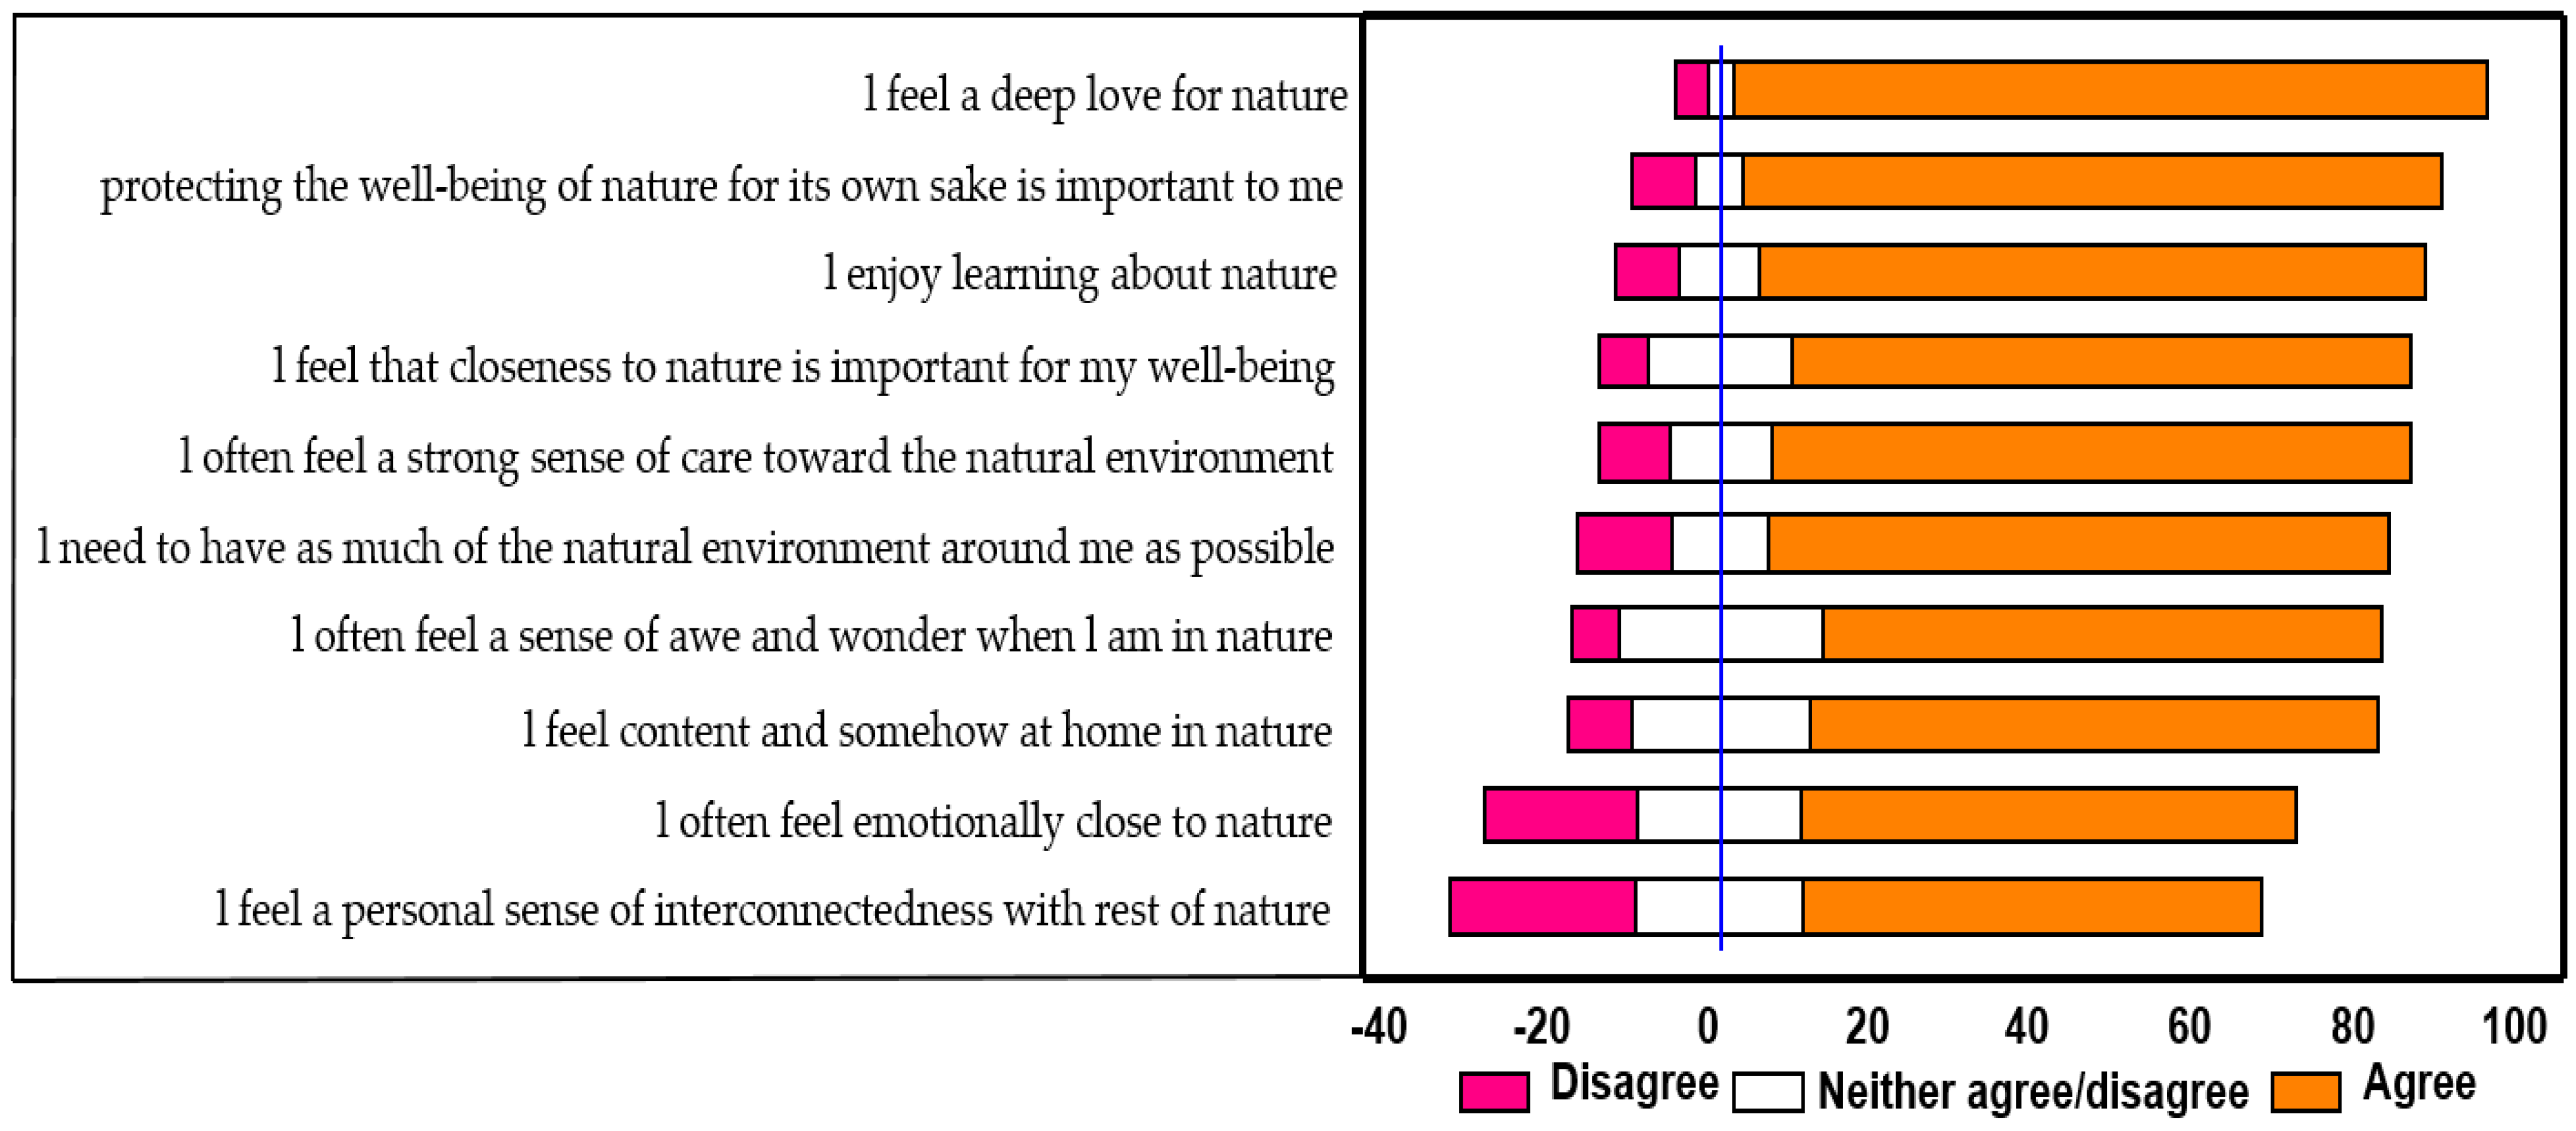
3.8. Young Children’s Perceptions of Nature

Most children (78%) perceived nature to be either a combination of trees and animals or just trees (22%). Children revealed that they learned about nature through direct visits to forests or farms, storytelling, or watching nature-based TV programs. Despite their high awareness of nature, most of them indicated their higher preference to live in cities (87%) compared to forest regions (13%) for fear of being attacked by wild animals. The environmental perception scale revealed that almost all the children interviewed strongly agreed with the 14 statements presented (Figure 8). Interestingly, some sections revealed their disagreement with statements such as: “it makes me sad to see homes built where plants and animals used to be”, “my life would change if there were no plants and animals”, and “plants and animals are easily harmed or hurt by people” and “my life would change if there were no trees” (Figure 8).
For benefits obtained from nature, 88% expressed that they are aware that nature provides timber; 73% indicated that they provide food; 72% indicated that it serves as a habitat for animals; 65% indicated that it provides clean air; 59% indicated that it serves as a place for worshipping gods; and 42% indicated that it houses watersheds that supply rivers with water (Figure 9). The children also suggested that fencing nature systems such as forests, and tree planting, could be possible options to protect nature and its biodiversity.
Furthermore, in evaluating the attitudes of children with respect to their love and how they are willing to care for nature, the majority agreed with all the statements presented, with few showing indifference or slight disagreement with some of the statements (Figure 10). Most children (93%) had a deep love for nature; perceived the need for the protection of nature for its own sake (86%); enjoyed learning about nature (83%); felt the importance of closeness to nature to their well-being (61%); had a strong sense of care towards the natural environment (81%); needed a more natural environment around themselves (77%); felt a sense of awe and wonder when in nature (69%); felt content and comfortable when in nature (70%); felt emotionally closed to nature (61%); and felt some interconnections with the rest of nature (86%; Figure 10).

4. Discussion

Managing and conserving urban green spaces are essential for achieving key sustainable development goals, including good health and well-being (Goal 3), sustainable cities and communities (Goal 11), climate action (Goal 13), and life on land (Goal 15), and not excluding the learning platforms urban green spaces offer for practical training (Goal 4) of citizen scientists in nature-driven conservation programs [7]. In addition, urban green spaces offer opportunities for residents’ physical activities, thereby relieving stress and fatigue and facilitating social contact with the natural environment, which minimizes social isolation and maximizes personal resilience and well-being [49]. Furthermore, green spaces shape the townscape in cities by nourishing the city’s attributes and improving environmental conditions, which is relevant to citizens’ health and well-being [50]. In addition, urban green spaces offer a natural cooling effect that contributes to climate change mitigation [11,51] to achieve climate action and relief from the heat island effect. Therefore, conserving urban green spaces in regions experiencing massive urbanization (especially in Africa) is very important, as they help mitigate climate change issues and enhance the provision of multiple ecosystem services to benefit societies.
Through a citizen science approach, we revealed different levels of biodiversity and ecosystem services of five green spaces with distinct landscape characteristics in a transitional agro-ecological zone of Ghana. The high response rate of citizen scientists to this conservation programme could be ascribed to the increased interest of the public in conservation issues in recent times [52]. Furthermore, the higher percentage of female participants in our program was a deliberate attempt to make science and fieldwork appealing to female participants who are usually marginalized in conservation projects in Ghana (personal observation). With numerous negative stereotypes about females not being good enough or motivated to carry out science projects [53], we strived to overcome this by engaging and motivating females to participate in this citizen science conservation program. In addition, the dominant youth participants within the age group 20 to 29 years could also affirm the recent increase in youth interest in biodiversity and conservation issues [54].
Furthermore, more than 80% of the participants having some level of education goes a long way to give credence to the findings in our study, as they (participants) could better appreciate the various services of UGS to themselves and the communities within which they lived. A related study conducted among university students in Liverpool, UK, revealed a significant relationship between the education levels of respondents and their awareness of green spaces [27]. In terms of preferences for the types of green spaces, the wildlife sanctuary was more preferred by respondents than parks or woodlots, which could be attributed to the benefits forests (Wildlife Sanctuary) provide compared to marginalized woodlots. Forests provide different ecosystem services, including Non-Timber Forest Products (NTFPs), such as plant-derived medicine, mushrooms, bushmeat, and wild fruits, which make them the preferred green space for most people [35].

4.1. Biodiversity and Ecosystem Services through a Field-Based Approach

The tree community was more diverse in the Wildlife Sanctuary than in the other urban green spaces in the metropolis and could be related to the existing but historically applied management approaches involving the conscious planting of diverse tree species in the area. Owusu-Prempeh et al. [55] affirmed that about 58 tree species from 25 different families were planted in the Wildlife Sanctuary to serve as food and habitat resources for wildlife species, which were then used for research purposes by the university. The positive relationship between diverse tree communities and the provisioning of bundle of ecosystem services is always highlighted in the ecosystem services discourse (e.g., Puplampu and Boafo [19], Elmqvist [56]). Most plant species recorded across the urban green spaces in this study were multi-purpose, used as medicine, food, fodder, fuelwood, timber, or a combination of other uses. For instance, citizen scientists identified Azadirachta indica as a multi-purpose tree species used for food, fodder, fuelwood, plant-derived medicine, or timber. Similarly, citizen scientists identified Khaya senegalensis, Cassia siebariana, Anacardium occidentale, and hosts of different tree species, as having multi-purpose uses. Planting multi-purpose tree species in urban green spaces has a long tradition of climate change mitigation and adaptation (greenhouse gas emission, air pollution control), food provisioning, and city beautification [57].
Arthropod taxonomic richness differed between the green spaces, with the Wildlife Sanctuary being significantly richer and characterized by a higher abundance of Orthoptera and Coleoptera than the other green spaces. Areas with diverse tree communities can support a greater diversity of arthropods, taking advantage of the wider ecological niches that supply resources (food, nesting sites, hiding places etc.) required by arthropods for their activities [58]. In a similar setting, Damptey et al. [10] affirmed the role of habitat complexity created by diverse plant communities in supporting arthropod communities in an urban green space. In addition, most of the tree species in the Wildlife Sanctuary were indigenous species, which correlated with the work of Mata et al. [59], affirming the role of complex indigenous tree communities in driving arthropod communities in urban green spaces. We found the least diversity of arthropod communities in the woodlot, which consisted of patches involving Tectona grandis and Anacardium occidentale highlighting the limits of monoculture plantations in maintaining arthropod communities [60]. Monoculture plantations usually simplify plant communities to a single species community supplying only limited resources suitable for specialized groups of arthropod communities to thrive [58].
Moreover, the higher deadwood volumes and litter depths in the Wildlife Sanctuary might have supported diverse Coleoptera families and Termitidae with food and essential habitat resources. Termites constituting between 40 and 95% of the total biomass of soil macrofauna might be favorable in facilitating decomposition activities while altering vegetation composition as ecosystem engineers [61]. Similarly, the diverse Coleoptera communities in the Wildlife Sanctuary probably took advantage of the deadwood quality and quantity in the area. This means that their different decay stages probably offered maximum heterogeneity, enhanced spatial segregation and created more suitable hibernation places for Coleoptera (beetles; [62]).
Thus, the optimal levels of ecosystem services provided by the Wildlife Sanctuary compared to the other green spaces affirm the role of diverse tree communities with multi-purpose uses in simultaneously providing multiple ecosystem services [63].

4.2. Biodiversity and Ecosystem Services through Perception Surveys

Urban green spaces in the metropolis were perceived to provide several ecosystem services (provisioning, cultural, regulating, or supporting services), with citizen scientists revealing their higher awareness of the existence of provisioning and regulating than the other services. The high level of local awareness of these two services in our study affirms the findings of Moutouama et al. [64] on how people easily reference what they feel or receive directly from nature in most ecosystem services discourse. Citizen scientists perceived shade provision by trees, plant-derived medicine and food as the main provisioning ecosystem services offered by urban green spaces. These services are fundamental for human societies [65]. The awareness of the existence of these services by citizen scientists could influence the conservation of UGSs, which can further enhance climate resilience in developing countries such as Ghana. Our findings corroborate the work of Shackleton [66], who indicated that the Global South or the Global North rely on providing ecosystem services such as food and plant-derived medicine to sustain local livelihoods. Similarly, Cilliers et al. [9] highlighted the higher demand for provisioning services, including food, medicine, and shade, in local poor residential settings in South Africa.
Equally, UGS was perceived to offer other cultural services, including serving as a platform for research (education) and recreational services because of their landscape orientation and aesthetic properties, improving the health and mental well-being of the local communities, and serving as a place of worship. Wildlife habitat support, soil conservation, and nutrient cycling, were the most perceived supporting services provided by UGSs. Thus, respondents’ perceptions of the ecosystem services of UGSs were not limited to provisioning ecosystem services but included regulating, supporting and cultural services. As noted by citizen scientists, the limited number of perceived cultural services could result from the challenges in assessing cultural ecosystem services [67]. Nevertheless, urban settings have been noted to contain great biodiversity but have been inadequately explored in terms of research and knowledge dissemination because of the difficulties in assessing services such as cultural services [1]. The higher level of awareness of citizen scientists about the possible ecosystem services urban green spaces offer for society is vital in contributing to academic knowledge as well as promoting conservation/restoration practices towards safeguarding UGS by governments collaboratively with citizens. The results of other seminal studies have contended that individuals with perception and awareness of the challenges and importance of nature are more likely to take actions toward promoting and conserving their environment [68]; hence, we see this level of awareness by citizen scientists as positive energy to safeguard available urban green spaces in the metropolis.

4.3. Frequency and Motivation for Visiting Urban Green Spaces

Citizen scientists revealed that they do not frequently visit urban green spaces; however, they occasionally visit on public holidays when the weather is good (especially on sunny days) irrespective of the day of the week to mainly relieve stress by indulging in social activities, including picnicking. Few of them revealed that they visit when other people are not there to have some quietness (spiritual reflection), while others revealed they visit because they feel a sense of belongingness and for aesthetic reasons. In a similar setting, Abankwa and Quaofio [69] affirmed socializing with family and friends for picnicking, mostly on weekends or on public holidays, as the main motive for people to visit urban green spaces in Accra. Nevertheless, the issue of spirituality and urban green space usage discourse in Ghana cannot be flouted. For instance, the Achimota Forest, Aburi, and KNUST Botanical Gardens, are some of the popular urban green spaces in Ghana, serving as places for prayer (worship) for individuals and groups in Accra [30,70].
The frequency (occasionally) at which people visit green spaces in our study region (Ghana) was similar to the observations made in Akure, Nigeria [71], but different from the frequency at which people visit urban green spaces in developed countries (e.g., daily for 1–2 h of duration in China [72], at least once per week among adolescents for physical and social activities [73] and once a week in Perth metropolitan in Australia [74]).
Citizen scientists attributed their infrequent visits to the lack of time and further highlighted that they prefer participating in other indoor activities with their families on their free days than visiting a park, for safety reasons. The fear of being attacked by bad people or dangerous animals (e.g.; poisonous snakes, bees) or dead trees falling on them, were the main barriers limiting people’s patronage of green spaces in our study region. The issue of safety and insecurity as barriers limiting people’s patronage of green spaces has been severally discussed. Noël et al. [75] highlighted that the presence of frightening elements perceived danger and other negative precedents are some social barriers to the patronage of green spaces in Belgium. Similarly Sefcik et al. [76] highlighted safety concerns, including the fear of being robbed, people drinking alcohol and using illegal drugs, and attacks by wild animals and bugs, as barriers discouraging people from spending time in nature

4.4. Citizen Satisfaction in the Quality and Management of Urban Green Spaces

Most of the respondents were satisfied with the quality of UGS within their vicinity. The respondents were very satisfied with the landscape pattern, plant decorations, the coverage of green spaces, and the spaces available for public activities. However, most of them were dissatisfied with the management of the UGS, which could jeopardize the sustainability of the UGS in the near future if adequate effort is not taken to address this. UGS management is a complex assortment of interacting social, cultural, and economic factors, including governance, multiple stakeholders, individual preferences, and social constraints [16]. The management of UGSs is saddled with several challenges, including urbanization, lack of long-term planning, absence or weak enforcement of legislation, ownership issues, poor maintenance culture and coordination, and other issues with management [17,20,77]. As a way of sustaining the quality of UGS, most respondents believed that better management and supervision is the way to improve the quality of UGS.
Furthermore, others believed that planting multi-purpose tree species, community engagement and education, law implementation and enforcement, and pest control, could be alternative options to enhance the quality of UGSs. Thus, in trying to improve the quality of existing UGSs, there will be the need to implement conservation projects, including biophysical actions and strengthening the governance structures. Considering the diversity and constellation of actors within urban green space management, a one-fitting-all approach might not be appropriate; hence, multiple approaches addressing the needs of most actors should be considered to improve the quality of goods and services UGSs provide.

4.5. Children’s Perception of Nature

We revealed a narrowed perception of children about the composition of nature. Most children perceived nature to be composed of only trees and animals, while others perceived it as just trees, in agreement with Keliher [78]. This might be attributed to the low conceptualization and educational levels of the children involved in the study. Individuals with little educational level are probably less likely to perceive and might have limited conceptualization abilities [79]. Among children, the sources of perceptions/knowledge about nature were through direct visits to forests or farms, storytelling, or watching TV programs. However, despite their narrowed conceptualization of the composition of nature, they were very aware of the value of nature and the impacts that human activities such as logging, mining and construction have on biodiversity and the future consequences on humanity and nature. Their level of awareness could be from their interaction and experiences within their natural environments or TV programs. Recently, the impacts of global environmental changes have been documented in most TV programs in the form of cartons to create awareness among children [80]. Conterminously, children’s contact with nature has been reported to positively related to their biophilia and negatively related to their biphobia [81]. Hence, children’s contact with nature may enhance their willingness to support conservation indirectly by nurturing biophilic attitudes to arthropods and empathy for nature as a whole.

5. Conclusions

This program offered citizen scientists in the metropolis their first opportunity for hands-on experience with scientific methods in biodiversity and ecological research. Through indigenous knowledge and experiences, citizen scientists proved that they are already aware of their environment and the surrounding conditions by highlighting with examples the benefits of nature and threats to nature. In addition, they also recognized how indispensable they are in creating a sustainable, livable community by being environmental stewards. The role of citizen scientists in this ecological research was not only limited to data collection but also included data interpretation (based on indigenous opinions) and dissemination of results to other community members who were not privileged to participate in the program. This study forms part of the pioneering research on biodiversity and conservation citizen science in Ghana and presents information mainly focused on five green spaces within the Sunyani metropolis. While the findings are policy informative, a large-scale study into other green spaces in urban cities of Ghana using similar approaches will be eminent in achieving sustainable urban green spaces planning and development. Furthermore, our study on arthropods was based on lower-level taxonomic resolution (order/suborder), which was sufficient for highlighting the differences in arthropod community composition between green spaces with different management options (e.g., green space managed for wildlife conservation, or woodlot). That notwithstanding, higher levels of taxonomic resolution (e.g., species or genus) will be required for species-specific habitat relationships. In addition, our sampling for arthropods was only for one season, presenting the results of arthropod communities in the wet season. Disentangling the effects of seasonality on arthropods will require all-year sampling involving the dry season for a clearer picture of which arthropod groups or species exist and are more active in which season for ecosystem service provision. Even though citizen science proved effective in collecting useful biodiversity and ecological datasets within the shortest possible time, we recommend instituting a verification system to verify and validate all attributes surveyed to make an informed and conclusive inference on the role of urban green spaces in biodiversity and ecosystem service provisioning. Hence, the success of this program opens avenues for incorporating citizen science programs for sampling other regions with data deficiency. We therefore recommend prioritizing urban green spaces in national and regional agendas and further call for their protection and conservation so they can continuously supply ecosystem goods and services to society.

Author Contributions

Conceptualization, F.G.D., N.Y.O.-F., F.B.-E., E.D.W. and E.O.-F.; methodology, F.G.D., N.Y.O.-F., A.W.A., A.O.Y. and D.K.D.; software, F.G.D., A.W.A., M.K.M. and B.B.A.; validation, E.D.W., E.O.-F., F.B.-E. and M.K.M.; formal analysis, F.G.D., N.Y.O.-F., F.B.-E., E.D.W. and E.O.-F.; investigation, F.G.D., N.Y.O.-F., A.O.Y., D.K.D., A.W.A., B.B.A. and M.K.M.; resources, F.G.D., N.Y.O.-F., E.D.W., F.B.-E. and E.O.-F.; data curation, F.G.D. and N.Y.O.-F.; writing—original draft preparation, F.G.D., N.Y.O.-F., F.B.-E., M.K.M., B.B.A. and D.K.D.; writing—review and editing, E.D.W. and E.O.-F.; visualization, F.G.D. and A.W.A.; supervision, E.D.W. and E.O.-F.; project administration, F.G.D.; funding acquisition, F.G.D. All authors have read and agreed to the published version of the manuscript.

Funding

This research was funded by the Rufford Foundation (Grant numbers 27866-1 and 33624-2).

Data Availability Statement

The datasets analyzed for this study are available at: doi:10.6084/m9.figshare.20445594.

Acknowledgments

This study was supported financially by the Rufford Foundation (Grant numbers 27866-1 and 33624-2) and logistically by IDEA WILD, Department of Ecology—Brandenburg University of Technology, Cottbus-Senftenberg and ForestAid Ghana. Authors are grateful to all community members (citizen scientists), basic schools in the Sunyani municipality, and students from the University of Energy and Natural Resources, Ghana, who participated in this citizen science program. Special thanks to the Bono Regional Co-ordinating Council, the University of Energy and Natural Resources, Sunyani Senior High School, and the Parks and Gardens, for permitting us to use the green spaces for this research. We are also grateful to Clement Wulnye for helping map the green spaces used in this study.

Conflicts of Interest

The authors declare no conflict of interest.

Appendix A

Table A1. Plant species and their uses for the various green spaces. A: Arboretum, W: Wildlife Sanctuary, P: Parks and Gardens, R: Residency Park, W: Woodlot.
Plant SpeciesAWPRWFoodFodderFuelwoodMedicineTimber
Albizia lebbeck X xx
Albizia saman X x x
Allamanda cathartica X xx
Anacardium occidentale Xx x
Azadirachta indicaX X xxxx
Bauhinia purpurea X x
Blighia sapida X xx
Breynia nivosa X x
Broussonetia papyriferaX xxx
Cassia fistula X xxx
Cassia siebariana X xxx
Cedrela odorata X x
Ceiba pentandraXX x
Cereus hexaqonus X x x
Codiaeum variegatum X x
Deloniix regiaX x xx
Duranta erecta X xx
Elaeis guineensis X x
Eucalyptus camaldulensis X xx
Eucalyptus grandifolia X xx
Ficus exasperataX xx
Ficus vasta X x
Furcraea foetida X x
Gmelina arborea X x x
Griffonia simplicifolia X x
Hibiscus rosa-senensis X x x
Holarrhena floribundaX xx
Ixora duffi X
Khaya senegalensis X X xxx
Lagerstroemia speciosa X x
Mangifera indica X x
Mansonia altissima X x
Millettia thonningii X x x
Morus mesozygiaX x
Morinda lucida X xx
Murraya paniculata X x
Newbouldia laevisXX x
Pachira glabra X xxx
Peltophorum pterocarpum X xx
Pethecellobium dulce X xx
Phyllostachys aurea X xx
Psidium guajava X x
Senna siamea XX xx
Solanum erianthumX x
Spathodea campanulata X xx
Tabebuia rosea X x
Tabernaemontana elegans X x xx
Tectona grandis XX X x
Terminalia catappa X x xx
Terminalia superba X x
Triplochiton scleroxylonXXX x
Figure A1. Questionnaire for ecosystem services perception assessment.
Land 11 01774 g0a1

References

  1. Markevych, I.; Schoierer, J.; Hartig, T.; Chudnovsky, A.; Hystad, P.; Dzhambov, A.M.; de Vries, S.; Triguero-Mas, M.; Brauer, M.; Nieuwenhuijsen, M.J.; et al. Exploring pathways linking greenspace to health: Theoretical and methodological guidance. Environ. Res. 2017, 158, 301–317. [Google Scholar] [CrossRef] [PubMed]
  2. United Nations & Department of Economic and Social Affairs. World Urbanisation Prospects: The 2014 Revision; United Nations Department of Economics and Social Affairs, Population Division: New York, NY, USA, 2015; p. 41. [Google Scholar]
  3. United Nations Human Settlements Programme (UN-Habitat). World Cities Report: The Value of Sustainable Urbanization; UN-Habitat: Nairobi, Kenya, 2020; ISBN 978-92-1-0054386. [Google Scholar]
  4. Cox, D.T.; Hudson, H.L.; Shanahan, D.F.; Fuller, R.; Gaston, K.J. The rarity of direct experiences of nature in an urban population. Landsc. Urban Plan. 2017, 160, 79–84. [Google Scholar] [CrossRef] [Green Version]
  5. Seto, K.C.; Güneralp, B.; Hutyra, L.R. Global forecasts of urban expansion to 2030 and direct impacts on biodiversity and carbon pools. Proc. Natl. Acad. Sci. USA 2012, 109, 16083–16088. [Google Scholar] [CrossRef] [PubMed] [Green Version]
  6. Bush, J.; Doyon, A. Building urban resilience with nature-based solutions: How can urban planning contribute? Cities 2019, 95, 102483. [Google Scholar] [CrossRef]
  7. United Nations. The UN Sustainable Development Goals. United Nations, New York. 2015. Available online: http://www.un.org/sustainabledevelopment/summit/ (accessed on 16 January 2022).
  8. De Haas, W.; Hassink, J.; Stuiver, M. The Role of Urban Green Space in Promoting Inclusion: Experiences From the Netherlands. Front. Environ. Sci. 2021, 9, 618198. [Google Scholar] [CrossRef]
  9. Cilliers, S.; Cilliers, J.; Lubbe, R.; Siebert, S. Ecosystem services of urban green spaces in African countries—Perspectives and challenges. Urban Ecosyst. 2013, 16, 681–702. [Google Scholar] [CrossRef]
  10. Damptey, F.G.; Frimpong, B.F.; Debrah, D.K.; Agro, P.P.; Wiafe, E.D. Vegetation attributes drive the taxonomic richness and functional composition of beetles and spiders in mountainous urban green spaces. Energy Ecol. Environ. 2022, 7, 268–280. [Google Scholar] [CrossRef]
  11. Nero, B.F.; Callo-Concha, D.; Anning, A.; Denich, M. Urban Green Spaces Enhance Climate Change Mitigation in Cities of the Global South: The Case of Kumasi, Ghana. Procedia Eng. 2017, 198, 69–83. [Google Scholar] [CrossRef]
  12. Nowak, D.J.; Greenfield, E.J.; Hoehn, R.E.; Lapoint, E. Carbon storage and sequestration by trees in urban and community areas of the United States. Environ. Pollut. 2013, 178, 229–236. [Google Scholar] [CrossRef] [Green Version]
  13. Jim, C.; Chen, W.Y. Ecosystem services and valuation of urban forests in China. Cities 2009, 26, 187–194. [Google Scholar] [CrossRef]
  14. Leeuwen, E.V.; Koomen, E. Adapting urban land use in a time of climate change; Optimising future land-use patterns to decrease flood risks. In Carbon Sequestration in Urban Ecosystems; Springer: Dordrecht, The Netherlands, 2012; pp. 21–24. [Google Scholar]
  15. Cardou, F.; Aubin, I.; Lapointe, M.; Shipley, B. Multifunctionality in practice: Measuring differences in urban woodland ecosystem properties via functional traits. Urban For. Urban Green. 2021, 68, 127453. [Google Scholar] [CrossRef]
  16. Aronson, M.F.; Lepczyk, C.A.; Evans, K.L.; Goddard, M.; Lerman, S.B.; MacIvor, J.S.; Nilon, C.H.; Vargo, T. Biodiversity in the city: Key challenges for urban green space management. Front. Ecol. Environ. 2017, 15, 189–196. [Google Scholar] [CrossRef] [Green Version]
  17. Ayele, B.Y.; Megento, T.L.; Habetemariam, K.Y. The governance and management of green spaces in Addis Ababa, Ethiopia. Heliyon 2022, 8, e09413. [Google Scholar] [CrossRef] [PubMed]
  18. Mensah, C.A. Destruction of Urban Green Spaces: A Problem Beyond Urbanization in Kumasi City (Ghana). Am. J. Environ. Prot. 2014, 3, 1–9. [Google Scholar] [CrossRef] [Green Version]
  19. Puplampu, D.A.; Boafo, Y.A. Exploring the impacts of urban expansion on green spaces availability and delivery of ecosystem services in the Accra metropolis. Environ. Chall. 2021, 5, 100283. [Google Scholar] [CrossRef]
  20. Guenat, S.; Lopez, G.P.; Mkwambisi, D.D.; Dallimer, M. Unpacking Stakeholder Perceptions of the Benefits and Challenges Associated With Urban Greenspaces in Sub-Saharan Africa. Front. Environ. Sci. 2021, 9, 591512. [Google Scholar] [CrossRef]
  21. De Rijck, K.; Schade, S.; Rubio, J.M.; Van Meerloo, M. Best Practices in Citizen Science for Environmental Monitoring: Commission Staff Working Document; European Commission: Luxembourg, Brussels, 2020. [Google Scholar]
  22. Bonney, R.; Cooper, C.B.; Dickinson, J.; Kelling, S.; Phillips, T.; Rosenberg, K.V.; Shirk, J. Citizen Science: A Developing Tool for Expanding Science Knowledge and Scientific Literacy. BioScience 2009, 59, 977–984. [Google Scholar] [CrossRef]
  23. Cooper, C.B.; Dickinson, J.; Phillips, T.; Bonney, R. Citizen Science as a Tool for Conservation in Residential Ecosystems. Ecol. Soc. 2007, 12, 11. [Google Scholar] [CrossRef]
  24. Weiner, D.; Bloomer, J.; Conchúir, R.; Dalton, C. The Role of Volunteers and Citizen Scientists in Addressing Declining Water Quality in Irish River Catchments. Citiz. Sci. Theory Pract. 2022, 7, 13. [Google Scholar] [CrossRef]
  25. Vohland, K.; Göbel, C.; Balázs, B.; Butkevičienė, E.; Daskolia, M.; Duží, B.; Susanne, H.; Manzoni, M.; Schade, S. Citizen science in Europe. In The Science of Citizen Science; Springer: Berlin/Heidelberg, Germany, 2021; p. 35. [Google Scholar]
  26. Riego, C.; Breuste, J.; Rojas, J. Perception and value of nature in urban landscapes: A comparative analysis of cities in Germany, Chile and Spain. Landsc. Online 2008, 7, 1–22. [Google Scholar] [CrossRef]
  27. Speake, J.; Edmondson, S.; Nawaz, H. Everyday encounters with nature: Students’ perceptions and use of university campus green spaces. Hum. Geogr.—J. Stud. Res. Hum. Geogr. 2013, 7, 21–31. [Google Scholar] [CrossRef] [Green Version]
  28. Zheng, B.; Zhang, Y.; Chen, J. Preference to home landscape: Wildness or neatness? Landsc. Urban Plan. 2011, 99, 1–8. [Google Scholar] [CrossRef]
  29. Bonnes, M.; Passafaro, P.; Carrus, G. The Ambivalence of Attitudes Toward Urban Green Areas: Between Proenvironmental Worldviews and Daily Residential Experience. Environ. Behav. 2011, 43, 207–232. [Google Scholar] [CrossRef]
  30. Abass, K.; Appiah, D.O.; Afriyie, K. Does green space matter? Public knowledge and attitude towards urban greenery in Ghana. Urban For. Urban Green. 2019, 46, 126462. [Google Scholar] [CrossRef]
  31. Adusu, D.; Anaafo, D.; Abugre, S.; Addaney, M. Experiential knowledge of urbanites on climatic changes in the Sunyani municipality, Ghana. J. Urban Aff. 2022, 1–17. [Google Scholar] [CrossRef]
  32. Ghana Statistical Service. Ghana 2021 Population and Housing Census. In Population of Regions and Districts; Ghana Statistical Service: Accra, Ghana, 2021. [Google Scholar]
  33. Opare, P.; Akintonde, J.O.; Obeng-Ofori, D.; Nelson, V. Using climate analogue tools to explore and build smallholder farmer capacity for climate smart agriculture. AAS Open Res. 2018, 1, 24. [Google Scholar] [CrossRef]
  34. Agyei-Ohemeng, J.; Yeboah, B.A.; Asamoah, F.B.; Ohemeng, M.O. Nuisance Activities of Straw Colored Fruit Bats (Eidolon helvum) on the University of Energy and Natural Resources, Ghana. Ecol. Sustain. Dev. 2020, 3, 1–6. [Google Scholar] [CrossRef]
  35. Damptey, F.G.; de la Riva, E.G.; Birkhofer, K. Trade-Offs and Synergies Between Food and Fodder Production and Other Ecosystem Services in an Actively Restored Forest, Natural Forest and an Agroforestry System in Ghana. Front. For. Glob. Chang. 2021, 4, 630959. [Google Scholar] [CrossRef]
  36. Hawthorne, W.D.; Jongkind, C.C. Woody Plants of Western African Forests, A Guide to the Forest Trees, Shrubs and Lianas from Senegal to Ghana; Royal Botanic Gardens: London, UK, 2006. [Google Scholar]
  37. Zanne, A.E.; Lopez-Gonzalez, G.; Coomes, D.A.; Ilic, J.; Jansen, S.; Lewis, S.L.; Miller, R.B.; Swenson, N.G.; Wiemann, M.C.; Chave, J. Global Wood Density Database; Dryad Digital Repository: Davis, CA, USA, 2009. [Google Scholar]
  38. Chave, J.; Réjou-Méchain, M.; Búrquez, A.; Chidumayo, E.; Colgan, M.S.; Delitti, W.B.; Duque, A.; Eid, T.; Fearnside, P.M.; Goodman, R.C.; et al. Improved allometric models to estimate the aboveground biomass of tropical trees. Glob. Chang. Biol. 2014, 20, 3177–3190. [Google Scholar] [CrossRef]
  39. Lewis, S.L.; Sonké, B.; Sunderland, T.; Begne, S.K.; Lopez-Gonzalez, G.; van der Heijden, G.; Phillips, O.; Affum-Baffoe, K.; Baker, T.R.; Banin, L.; et al. Above-ground biomass and structure of 260 African tropical forests. Philos. Trans. R. Soc. B Biol. Sci. 2013, 368, 20120295. [Google Scholar] [CrossRef] [PubMed]
  40. Keuskamp, J.A.; Dingemans, B.J.J.; Lehtinen, T.; Sarneel, J.; Hefting, M. Tea Bag Index: A novel approach to collect uniform decomposition data across ecosystems. Methods Ecol. Evol. 2013, 4, 1070–1075. [Google Scholar] [CrossRef]
  41. Larson, L.R.; Green, G.T.; Castleberry, S.B. Construction and Validation of an Instrument to Measure Environmental Orientations in a Diverse Group of Children. Environ. Behav. 2011, 43, 72–89. [Google Scholar] [CrossRef]
  42. Perkins, H.E. Measuring love and care for nature. J. Environ. Psychol. 2010, 30, 455–463. [Google Scholar] [CrossRef] [Green Version]
  43. Salazar, G.; Kunkle, K.; Monroe, M.C. Practitioner Guide to Assessing Connection to Nature; NAAEE: Washington, DC, USA, 2020. [Google Scholar]
  44. Clarke, K.R.; Gorley, R.N.; Somerfield, P.J.; Warwick, R.M. Change in Marine Communities: An Approach to Statistical Analysis and Interpretation, 3rd ed.; PRIMER-E Ltd.: Plymouth, UK, 2014. [Google Scholar]
  45. Anderson, M.; Gorley, R.N.; Clarke, R.K. Permanova+ for Primer: Guide to Software and Statistical Methods; Primer-E Limited: Plymouth, UK, 2008. [Google Scholar]
  46. Clarke, K.R.; Gorley, R.N. User Manual/Tutorial; Primer-E Ltd.: Plymouth, UK, 2006; p. 93. [Google Scholar]
  47. Clarke, K.R.; Gorley, R.N. Getting Started with PRIMER v7; Plymouth Marine Laboratory: Plymouth, UK, 2015. [Google Scholar]
  48. R Core Team. R: A Language and Environment for Statistical Computing; R Foundation for Statistical Computing: Vienna, Austria, 2019; ISBN 3-900051-07-0. [Google Scholar]
  49. Braubach, M.; Kendrovski, V.; Jarosinska, D.; Mudu, P.; Andreucci, M.B.; Beute, F.; Zoe, D.; de Vries, S.; Glanville, J.; Keune, H.; et al. Green and Blue Spaces and Mental Health: New Evidence and Perspectives for Action; World Health Organization: Geneva, Switzerlan, 2021. [Google Scholar]
  50. Costa, C.S.; Mathey, J.; Erjavec, I. Green spaces—A key resources for urban sustainability. The GreenKeys approach for developing green spaces. Urbani Izziv 2008, 19, 199–211. [Google Scholar] [CrossRef]
  51. Haq, S.M.A.; Islam, M.N.; Siddhanta, A.; Ahmed, K.J.; Chowdhury, M.T.A. Public Perceptions of Urban Green Spaces: Convergences and Divergences. Front. Sustain. Cities 2021, 3, 755313. [Google Scholar] [CrossRef]
  52. Burivalova, Z.; A Butler, R.; Wilcove, D.S. Analyzing Google search data to debunk myths about the public’s interest in conservation. Front. Ecol. Environ. 2018, 16, 509–514. [Google Scholar] [CrossRef]
  53. Law, F.; McGuire, L.; Winterbottom, M.; Rutland, A. Children’s Gender Stereotypes in STEM Following a One-Shot Growth Mindset Intervention in a Science Museum. Front. Psychol. 2021, 12, 641695. [Google Scholar] [CrossRef]
  54. Franzolin, F.; Carvalho, G.S.; Santana, C.M.B.; Calegari, A.D.S.; de Almeida, E.A.E.; Soares, J.P.R.; Jorge, J.; das Neves, F.D.; Lemos, E.R.S. Students’ Interests in Biodiversity: Links with Health and Sustainability. Sustainability 2021, 13, 13767. [Google Scholar] [CrossRef]
  55. Owusu-Prempeh, N.; Antobre, O.; Agyei, T. Floral diversity and carbon stocks and of protected forest ecosystem: A case of UENR’s Bat Sanctuary, Sunyani, Ghana. Open J. For. 2017, 8, 80924. [Google Scholar] [CrossRef] [Green Version]
  56. Elmqvist, T.; Setälä, H.; Handel, S.N.; Van Der Ploeg, S.; Aronson, J.; Blignaut, J.N.; Gomez-Baggethun, E.; Nowak, D.J.; Kronenberg, J.; De Groot, R. Benefits of restoring ecosystem services in urban areas. Curr. Opin. Environ. Sustain. 2015, 14, 101–108. [Google Scholar] [CrossRef]
  57. Pataki, D.E.; Alberti, M.; Cadenasso, M.L.; Felson, A.J.; McDonnell, M.J.; Pincetl, S.; Pouyat, R.V.; Setälä, H.; Whitlow, T.H. The Benefits and Limits of Urban Tree Planting for Environmental and Human Health. Front. Ecol. Evol. 2021, 9, 603757. [Google Scholar] [CrossRef]
  58. Damptey, F.G.; Opuni-Frimpong, E.; Nsor, C.A.; Addai, J.; Debrah, D.K.; Schnerch, B.; Bentsi-Enchill, F.; Korjus, H. Taxonomic and community composition of epigeal arthropods in monoculture and mixed tree species plantations in a deciduous forest of Ghana. J. For. Res. 2022, 1–13. [Google Scholar] [CrossRef]
  59. Mata, L.; Andersen, A.N.; Morán-Ordóñez, A.; Hahs, A.K.; Backstrom, A.; Ives, C.D.; Bickel, D.; Duncan, D.; Palma, E.; Thomas, F.; et al. Indigenous plants promote insect biodiversity in urban greenspaces. Ecol. Appl. 2021, 31, e2309. [Google Scholar] [CrossRef]
  60. Liu, C.L.C.; Kuchma, O.; Krutovsky, K.V. Mixed-species versus monocultures in plantation forestry: Development, benefits, ecosystem services and perspectives for the future. Glob. Ecol. Conserv. 2018, 15, e00419. [Google Scholar] [CrossRef]
  61. Calderón-Cortés, N.; Escalera-Vázquez, L.H.; Oyama, K. Occurrence of termites (Isoptera) on living and standing dead trees in a tropical dry forest in Mexico. PeerJ 2018, 6, e4731. [Google Scholar] [CrossRef] [Green Version]
  62. Kappes, H.; Topp, W. Emergence of Coleoptera from deadwood in a managed broadleaved forest in central Europe. Biodivers. Conserv. 2004, 13, 1905–1924. [Google Scholar] [CrossRef]
  63. Gamfeldt, L.; Snall, T.; Bagchi, R.; Jonsson, M.; Gustafsson, L.; Kjellander, P.; Ruiz-Jaen, M.C.; Froberg, M.; Stendahl, J.; Philipson, C.D.; et al. Higher levels of multiple ecosystem services are found in forests with more tree species. Nat. Commun. 2013, 4, 1340. [Google Scholar] [CrossRef] [PubMed] [Green Version]
  64. Moutouama, F.T.; Biaou, S.S.H.; Kyereh, B.; Asante, W.A.; Natta, A.K. Factors shaping local people’s perception of ecosystem services in the Atacora Chain of Mountains, a biodiversity hotspot in northern Benin. J. Ethnobiol. Ethnomedicine 2019, 15, 38. [Google Scholar] [CrossRef] [Green Version]
  65. Kadykalo, A.N.; López-Rodriguez, M.D.; Ainscough, J.; Droste, N.; Ryu, H.; Ávila-Flores, G.; Le Clec’H, S.; Muñoz, M.C.; Nilsson, L.; Rana, S.; et al. Disentangling ‘ecosystem services’ and ‘nature’s contributions to people’. Ecosyst. People 2019, 15, 269–287. [Google Scholar] [CrossRef] [Green Version]
  66. Shackleton, C.M. Ecosystem provisioning services in global south cities. In Urban Ecology in the Global South; Springer: Cham, Switzerland, 2021; pp. 203–226. [Google Scholar]
  67. Gould, R.K.; Coleman, K.; Gluck, S.B. Exploring dynamism of cultural ecosystems services through a review of environmental education research. Ambio 2018, 47, 869–883. [Google Scholar] [CrossRef] [PubMed]
  68. Tsami, E.; Zachariou, F.; Voulgari, I.; Bersimis, S. Exploring the Attitudes of Secondary Education Students on Environmental Education in Relation to their Perceptions on Environmental Problems: The Case of the Prefecture of Viotia. Interdiscip. J. Environ. Sci. Educ. 2019, 16, e02208. [Google Scholar] [CrossRef] [Green Version]
  69. Abankwa, J.G.K.; Quaofio, N. Understanding People’s Motives for visiting Public Green Spaces in Accra to aid the Development of Urban Greenery in Ghana. Dev. Ctry. Stud. 2020, 10, 72–90. [Google Scholar] [CrossRef]
  70. Aryeh, D.N.A. The relationship between christianity and entrepreneurship: A curriculum for leadership training for pastors in africa. In Understanding the Relationship Between Religion and Entrepreneurship; IGI Global: Hershey, PA, USA, 2019; pp. 25–50. [Google Scholar]
  71. Aribigbola, A.; Fatusin, A.F. Parks Provision and Management in Urban Areas on Nigeria: The Example of Akure, Ondo State. J. Environ. Earth Sci. 2016, 6, 1–7. [Google Scholar]
  72. Mao, Q.; Wang, L.; Guo, Q.; Li, Y.; Liu, M.; Xu, G. Evaluating Cultural Ecosystem Services of Urban Residential Green Spaces From the Perspective of Residents’ Satisfaction With Green Space. Front. Public Health 2020, 8, 226. [Google Scholar] [CrossRef]
  73. Bloemsma, L.D.; Gehring, U.; Klompmaker, J.O.; Hoek, G.; Janssen, N.A.; Smit, H.A.; Vonk, J.M.; Brunekreef, B.; Lebret, E.; Wijga, A.H. Green Space Visits among Adolescents: Frequency and Predictors in the PIAMA Birth Cohort Study. Environ. Health Perspect. 2018, 126, 047016. [Google Scholar] [CrossRef] [Green Version]
  74. Carter, M.; Horwitz, P. Beyond Proximity: The Importance of Green Space Useability to Self-Reported Health. EcoHealth 2014, 11, 322–332. [Google Scholar] [CrossRef]
  75. Noël, C.; Van Landschoot, L.; Vanroelen, C.; Gadeyne, S. Social Barriers for the Use of Available and Accessible Public Green Spaces. Front. Sustain. Cities 2021, 3, 744766. [Google Scholar] [CrossRef]
  76. Sefcik, J.S.; Kondo, M.C.; Klusaritz, H.; Sarantschin, E.; Solomon, S.; Roepke, A.; South, E.C.; Jacoby, S.F. Perceptions of Nature and Access to Green Space in Four Urban Neighborhoods. Int. J. Environ. Res. Public Health 2019, 16, 2313. [Google Scholar] [CrossRef] [Green Version]
  77. Mensah, C.; Andres, L.; Beazley, M.; Roji, A. Managing urban green spaces in Africa: A collaborative governance approach. In Advances in Resource Management and Consumer Sciences; Arif, Z., Rajput, N., Şener, A., Eds.; ORIC Publocations: Little Rock, AR, USA, 2015. [Google Scholar]
  78. Keliher, V. Children’s perceptions of nature. Int. Res. Geogr. Environ. Educ. 1997, 6, 240–243. [Google Scholar] [CrossRef]
  79. Cable, D.M.; DeRue, D.S. The convergent and discriminant validity of subjective fit perceptions. J. Appl. Psychol. 2002, 87, 875–884. [Google Scholar] [CrossRef] [Green Version]
  80. Sampei, Y.; Aoyagi-Usui, M. Mass-media coverage, its influence on public awareness of climate-change issues, and implications for Japan’s national campaign to reduce greenhouse gas emissions. Glob. Environ. Chang. 2009, 19, 203–212. [Google Scholar] [CrossRef]
  81. Zhang, W.; Goodale, E.; Chen, J. How contact with nature affects children’s biophilia, biophobia and conservation attitude in China. Biol. Conserv. 2014, 177, 109–116. [Google Scholar] [CrossRef]
Figure 1. Study area map with Ghana and its regions (A), Sunyani municipality (B), showing the urban green spaces sampled (C).
Land 11 01774 g001
Figure 2. Demonstrating how the beating tray is used for sampling arthropods (A), sorting pitfall trap catches to morphospecies or taxonomic groups (B), identifying arthropod samples to taxonomic groups (C), and measuring tree diameter (D), by citizen scientists.
Land 11 01774 g002
Figure 3. Box plots of (A) tree diversity, and (B) arthropod taxonomic richness in the five urban green spaces (N = 6 per green space). The line represents the median value, the box limits are the 25th and 75th percentiles, and error bars show the 10th and 90th percentiles on a log scale.
Land 11 01774 g003
Figure 4. Ordination diagram showing the results of the CCA triplot of arthropod taxonomic communities and vegetation variables of the urban green spaces (Green cluster = Sunyani Parks and Gardens, Blue = UENR Arboretum, Pink = Sunyani Residency Park, Gray = UENR Wildlife Sanctuary, Orange = SUSEC Woodlot.
Land 11 01774 g004
Figure 5. Non-metric multidimensional scaling ordination based on Gower similarities between plots of different green spaces and values for all ES proxies. The 2-d stress value is 0.08. (N = 6 per green space). Vectors are superimposed for all nine ES proxies with vector length scaled according to Pearson correlation coefficients (0.2) with green space scores along both NMDS axes.
Land 11 01774 g005
Figure 6. Relevance of UGSs for citizen scientists (A), their preferred UGSs (B), their frequency of visits (C), and reasons why they visit UGSs (D).
Land 11 01774 g006
Figure 7. Perceived ecosystem services derived from urban green spaces indicated by citizen scientists.
Land 11 01774 g007
Figure 8. Children’s environmental perception scale.
Land 11 01774 g008
Figure 9. Radar plot showing children’s perception of the benefits of nature. Variables are scaled from 0 to 100%.
Land 11 01774 g009
Figure 10. Relationship between children and their natural environment.
Land 11 01774 g010
Table 1. List of green spaces studied, with their locations and characteristics.
Green Space NumberNameLocationSize (ha)General CharacteristicsVegetation Composition
1UENR Arboretum7°20′56.55″ N, 2°20′31.03″ W0.68Consist of canopy trees which are colonised by Straw Colored Fruit Bats (Eidolon helvum). The terrain is usually flat and covered by extensive grass layerComposed of a mixture of indigenous and exotic canopy tree species
2UENR Wildlife Sanctuary7°20′49.01″ N, 2°20′33.80″ W3.67A fenced area for wildlife mainly for research purposes. Consist of multi-layered trees and shrubsComposed of both indigenous and exotic emergent trees species
3Sunyani Residency Park7°20′39.98″ N, 2°20′25.11″ W5.67Characterised by multi-layered tree species, different types of grasses and flowersDominated by exotic species (mainly Eucalyptus camaldulensis) and some few indigenous tree species
4Sunyani Parks & Gardens 7°20′12.72″ N, 2°19′57.85″ W18.98A recreational ground with few emergent tree species, flowers and extensive grass layerDominated by exotic species (mainly Gmelina arborea, and Cedrela odorata) and some few indigenous tree species
5SUSEC Woodlot7°19′6.50″ N,
2°18′42.33″ W
1.95A woodlot dominated mainly by Tectona grandis and Anacardium occidentale with food crops planted in betweenComposed only of Tectona grandis and Anacardium occidentale
Table 2. Biodiversity components and ecosystem services studied (based on proxy; adopted and modified with permission from Damptey et al. [35].
BiodiversityEcosystem Services (ES)
Tree species diversityES ProxiesES Categories
Food tree biomassProvisioning
Fuelwood tree biomass
Medicinal tree biomass
Timber
Arthropod taxonomic richness (e.g., spiders, insects)Predator numbersRegulating
Carbon storage
Decomposer numbersSupporting
Tea bag index (Nutrient cycling)
Tree species richnessCultural
Table 3. Citizen scientists’ demographic characteristics.
Demographic AttributesNumber of RespondentsPercentage (%)
Gender
Male5848.33
Female6251.66
Age
<201310.83
20–298772.50
30–3986.67
40–4943.33
50–5921.67
60+65.00
Educational level
Junior High School/lower108.33
Senior High School108.33
Undergraduate6050.00
Postgraduate2016.67
No formal education2016.67
Table 4. Level of satisfaction with the quality and management of urban green spaces.
Attributes of UGSCitizens’ Satisfaction (%)Citizens’ Dissatisfaction (%)
Landscape pattern6931
Plant decoration8218
Coverage of UGS6832
Space for public activities7129
Management of UGS3961
Publisher’s Note: MDPI stays neutral with regard to jurisdictional claims in published maps and institutional affiliations.

