
Time Allocation and the Activity-Space-Based Segregation of Different Income Groups: A Case Study of Nanjing


Abstract
:1. Introduction
2. Methods and Data Collection
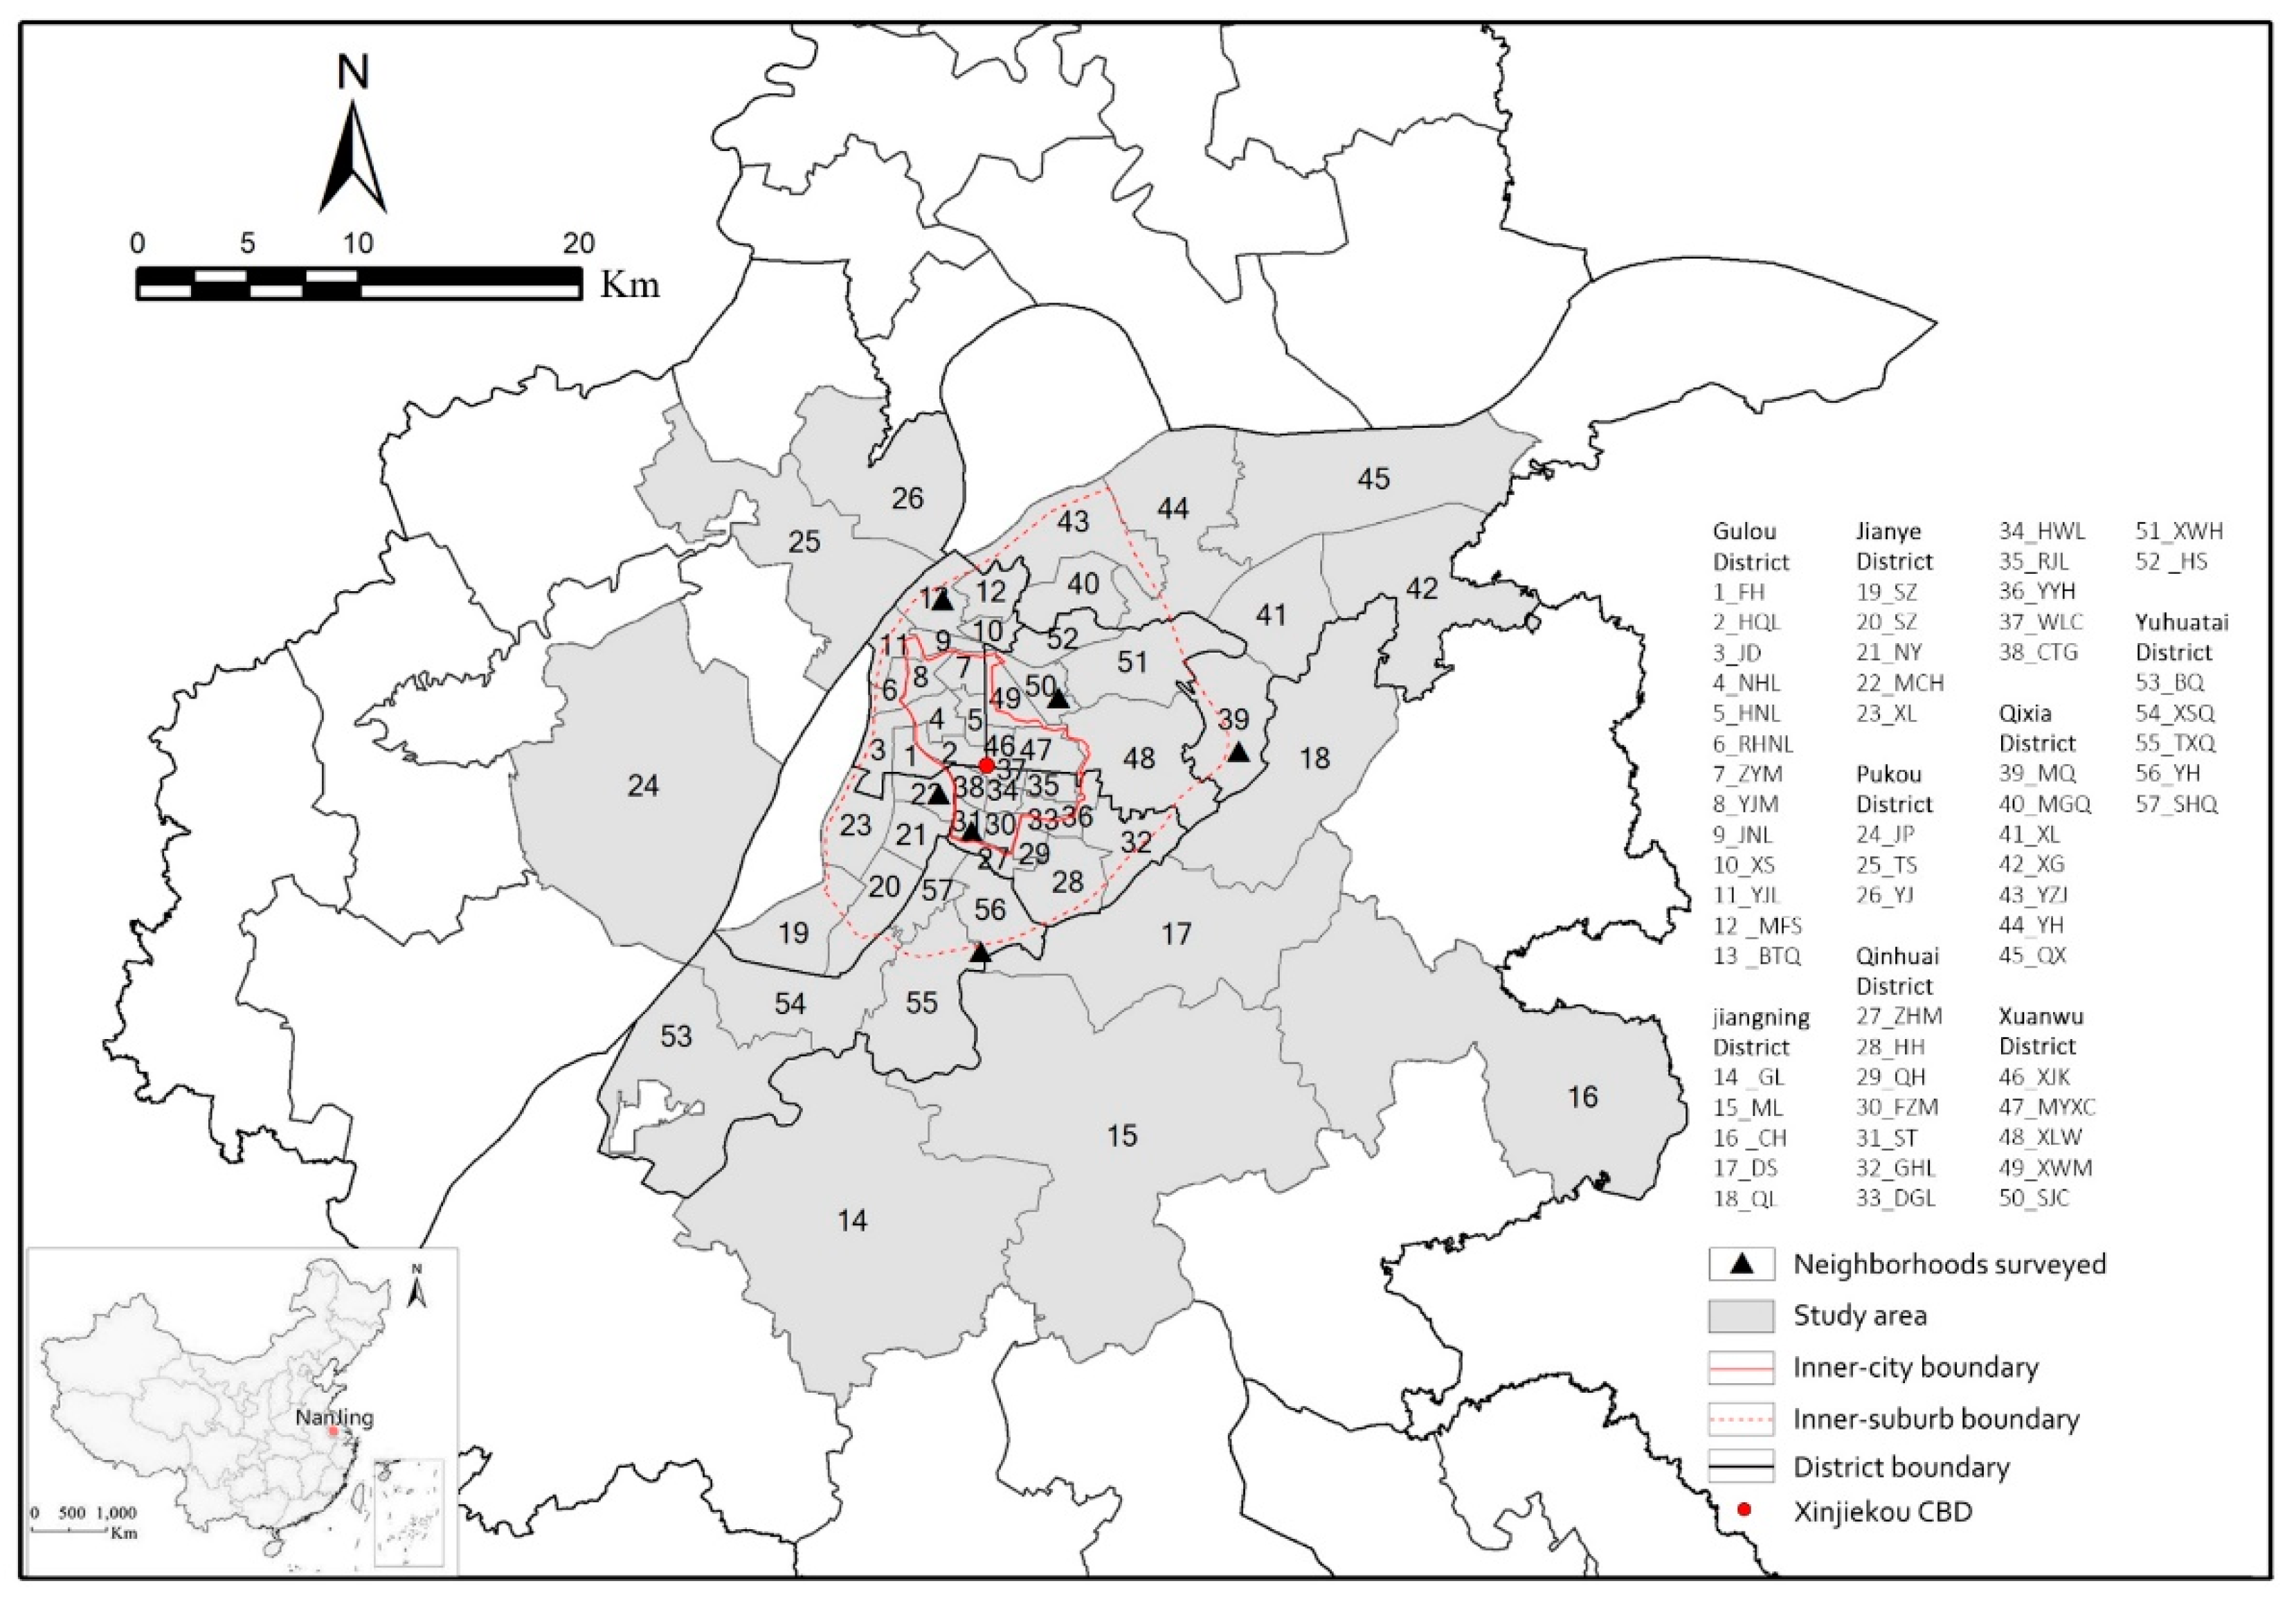
2.1. Study Area and Data Collection
2.2. Method
2.3. Descriptive Statistics
3. Results
3.1. Differences in Time Allocation in Urban Spaces among Income Groups
3.2. Differences in Urban Space Utility among Income Groups
3.3. Analysis of Factors Affecting the Spatial Distribution of Individual Activity Time
4. Conclusion and Discussion
Author Contributions
Funding
Institutional Review Board Statement
Informed Consent Statement
Data Availability Statement
Conflicts of Interest
References
- Hägerstraand, T. What about people in regional science. Reg. Sci. Assoc. 1970, 24, 7–24. [Google Scholar] [CrossRef]
- Feng, J.; Dijst, M.; Prillwitz, J.; Wissink, B. Travel Time and Distance in International Perspective: A Comparison between Nanjing (China) and the Randstad (The Netherlands). Urban Stud. 2013, 50, 2993–3010. [Google Scholar] [CrossRef]
- Kim, J.; Kwan, M.P. Beyond Commuting: Ignoring Individuals’ Activity-Travel Patterns May Lead to Inaccurate Assessments of Their Exposure to Traffic Congestion. Int. J. Environ. Res. Public Health 2018, 16, 89. [Google Scholar] [CrossRef] [PubMed] [Green Version]
- Jang, J.; Ko, J. Factors associated with commuter satisfaction across travel time ranges. Transp. Res. Part F Traffic Psychol. Behav. 2019, 66, 393–405. [Google Scholar] [CrossRef]
- Levinson, D.; Kumar, A. Activity, Travel, and the Allocation of Time. J. Am. Plan. Assoc. 1995, 61, 458–470. [Google Scholar] [CrossRef]
- Weber, J.; Kwan, M.-P. Bringing Time Back In: A Study on the Influence of Travel Time Variations and Facility Opening Hours on Individual Accessibility. Prof. Geogr. 2002, 54, 226–240. [Google Scholar] [CrossRef]
- Nie, P.; Sousa-Poza, A. Commute time and subjective well-being in urban China. China Econ. Rev. 2018, 48, 188–204. [Google Scholar] [CrossRef] [Green Version]
- Gross, D.R. Time Allocation: A Tool for the Study of Cultural Behavior. Annu. Rev. Anthropol. 1984, 13, 519–558. [Google Scholar] [CrossRef]
- Bhat, C.R.; Misra, R. Discretionary activity time allocation of individuals between in-home and out-of-home and between weekdays and weekends. Transportation 1999, 26, 193–209. [Google Scholar] [CrossRef]
- Casas, I. Social Exclusion and the Disabled: An Accessibility Approach. Prof. Geogr. 2007, 59, 463–477. [Google Scholar] [CrossRef]
- Wang, D.; Cao, X. Impacts of the built environment on activity-travel behavior: Are there differences between public and private housing residents in Hong Kong? Transp. Res. Part A Policy Pract. 2017, 103, 25–35. [Google Scholar] [CrossRef]
- Costa, R.; de Valk, H.A.G. Ethnic and Socioeconomic Segregation in Belgium: A Multiscalar Approach Using Individualised Neighbourhoods. Eur. J. Popul. 2018, 34, 225–250. [Google Scholar] [CrossRef]
- Wang, H.; Kwan, M.P.; Hu, M. Usage of Urban Space and Sociospatial Differentiation of Income Groups: A Case Study of Nanjing, China. Tijdschr. Voor Econ. En Soc. Geogr. 2020, 111, 616–633. [Google Scholar] [CrossRef]
- Massey, D.S.; Denton, N.A. The dimensions of residential segregation. Soc. Forces 1988, 67, 281–315. [Google Scholar] [CrossRef]
- Li, Z.; Wu, F. Tenure-based residential segregation in post-reform Chinese cities: A case study of Shanghai. Trans. Inst. Br. Geogr. 2008, 33, 404–419. [Google Scholar] [CrossRef]
- Kwan, M.-P.; Murray, A.T.; O’Kelly, M.E.; Tiefelsdorf, M. Recent advances in accessibility research: Representation, methodology and applications. J. Geogr. Syst. 2003, 5, 129–138. [Google Scholar] [CrossRef]
- Sheller, M.; Urry, J. The New Mobilities Paradigm. Environ. Plan. A Econ. Space 2006, 38, 207–226. [Google Scholar] [CrossRef] [Green Version]
- Kwan, M.-P. Beyond Space (As We Knew It): Toward Temporally Integrated Geographies of Segregation, Health, and Accessibility. Ann. Assoc. Am. Geogr. 2013, 103, 1078–1086. [Google Scholar] [CrossRef]
- Järv, O.; Müürisepp, K.; Ahas, R.; Derudder, B.; Witlox, F. Ethnic differences in activity spaces as a characteristic of segregation: A study based on mobile phone usage in Tallinn, Estonia. Urban Stud. 2014, 52, 2680–2698. [Google Scholar] [CrossRef]
- Kwan, M.P. From place-based to people-based exposure measures. Soc. Sci. Med. 2009, 69, 1311–1313. [Google Scholar] [CrossRef]
- Atkinson, R.; Flint, J. Fortress UK? Gated communities, the spatial revolt of the elites and time–space trajectories of segregation. Hous. Stud. 2004, 19, 875–892. [Google Scholar] [CrossRef] [Green Version]
- Ellis, M.; Richard, W.; Virginia, P. Work Together, Live Apart? Geographies of Racial and Ethnic Segregation at Home and at Work. Ann. Assoc. Am. Geogr. 2004, 94, 620–637. [Google Scholar] [CrossRef]
- Wang, D.; Chai, Y.; Li, F. Built environment diversities and activity–travel behaviour variations in Beijing, China. J. Transp. Geogr. 2011, 19, 1173–1186. [Google Scholar] [CrossRef]
- Wong, D.W.; Shaw, S.L. Measuring segregation: An activity space approach. J. Geogr. Syst. 2011, 13, 127–145. [Google Scholar] [CrossRef] [Green Version]
- Wang, D.; Li, F.; Chai, Y. Activity Spaces and Sociospatial Segregation in Beijing. Urban Geogr. 2012, 33, 256–277. [Google Scholar] [CrossRef]
- Li, F.; Wang, D. Measuring urban segregation based on individuals’ daily activity patterns: A multidimensional approach. Environ. Plan. A Econ. Space 2016, 49, 467–486. [Google Scholar] [CrossRef]
- Ta, N.; Kwan, M.-P.; Lin, S.; Zhu, Q. The activity space-based segregation of migrants in suburban Shanghai. Appl. Geogr. 2021, 133, 102499. [Google Scholar] [CrossRef]
- Kwan, M.-P. Space-Time and Integral Measures of Individual Accessibility: A Comparative Analysis Using a Point-based Framework. Geogr. Anal. 1998, 30, 191–216. [Google Scholar] [CrossRef]
- Wang, D.; Li, F. Daily activity space and exposure: A comparative study of Hong Kong’s public and private housing residents’ segregation in daily life. Cities 2016, 59, 148–155. [Google Scholar] [CrossRef]
- Krivo, L.J.; Washington, H.M.; Peterson, R.D.; Browning, C.R.; Calder, C.A.; Kwan, M.P. Social Isolation of Disadvantage and Advantage: The Reproduction of Inequality in Urban Space. Soc. Forces 2013, 92, 141–164. [Google Scholar] [CrossRef]
- Silm, S.; Ahas, R. The temporal variation of ethnic segregation in a city: Evidence from a mobile phone use dataset. Soc. Sci. Res. 2014, 47, 30–43. [Google Scholar] [CrossRef] [Green Version]
- Zhou, S.; Deng, L.; Kwan, M.-P.; Yan, R. Social and spatial differentiation of high and low income groups’ out-of-home activities in Guangzhou, China. Cities 2015, 45, 81–90. [Google Scholar] [CrossRef]
- Song, W.; Chen, P.; Xu, D. Research on the deprivation-type reconstruction of inner-city registered poverty space based on resettlement data of Nanjing. Geogr. Res. 2013, 32, 1467–1476. (In Chinese) [Google Scholar]
- Zeng, W.; Rees, P.; Xiang, L. Do residents of Affordable Housing Communities in China suffer from relative accessibility deprivation? A case study of Nanjing. Cities 2019, 90, 141–156. [Google Scholar] [CrossRef]
- Shevky, E.; Williams, M. The Social Areas of Los Angeles; University of California Press: Los Angeles, CA, USA, 1949. [Google Scholar]
- Chen, N.; Akar, G. Effects of neighborhood types & socio-demographics on activity space. J. Transp. Geogr. 2016, 54, 112–121. [Google Scholar] [CrossRef]
- Gu, C.; Wang, F.; Liu, G. The Structure of Social Space in Beijing in 1998: A Socialist City in Transition. Urban Geogr. 2005, 26, 167–192. [Google Scholar] [CrossRef]
- Liu, Y.; Wu, F. Urban poverty neighbourhoods: Typology and spatial concentration under China’s market transition, a case study of Nanjing. Geoforum 2006, 37, 610–626. [Google Scholar] [CrossRef]


| Level-One Variable | Level-Two Variable |
|---|---|
| (1) Spatial distribution of working activities | 1. LQ of weekday-working-activities of the low-income group |
| 2. LQ of weekday-working-activities of the non-low- income group | |
| 3. LQ of weekend-working-activities of the low-income group | |
| 4. LQ of weekend-working-activities of the non-low- income group | |
| (2) Spatial distribution of shopping activities | 5. LQ of weekday-shopping-activities of the low- income group |
| 6. LQ of weekday- shopping -activities of the non-low-income group | |
| 7. LQ of weekend- shopping -activities of the low- income group | |
| 8. LQ of weekend- shopping -activities of the non-low-income group | |
| (3) Spatial distribution of leisure activities | 9. LQ of weekday-leisure-activities of the low-income group |
| 10. LQ of weekday- leisure -activities of the non-low-income group | |
| 11. LQ of weekend- leisure -activities of the low- income group | |
| 12. LQ of weekend- leisure -activities of the non-low-income group | |
| (4) Spatial distribution of other out-of-home activities | 13. LQ of weekday-others-activities of the low-income group |
| 14. LQ of weekday-others-activities of the non-low- income group | |
| 15. LQ of weekend-others-activities of the low-income group | |
| 16. LQ of weekend-others-activities of the non-low- income group |
| Variables | Classification | Low-Income (N = 424) | Non-Low-Income (N = 350) | Total (N = 774) | p Value | |||
|---|---|---|---|---|---|---|---|---|
| N | % | N | % | N | % | |||
| Gender | Male | 197 | 46.5 | 203 | 58 | 400 | 51.7 | 0.001 *** |
| Female | 227 | 53.5 | 147 | 42 | 374 | 48.3 | ||
| Age | 16–29 | 47 | 11.1 | 76 | 21.7 | 123 | 15.9 | 0.000 *** |
| 30–59 | 237 | 55.9 | 192 | 54.9 | 429 | 55.4 | ||
| ≥60 | 140 | 33 | 82 | 23.4 | 222 | 28.7 | ||
| Education | Middle school or lower | 250 | 59 | 115 | 32.9 | 365 | 47.2 | 0.000 *** |
| High school | 122 | 28.8 | 90 | 25.7 | 212 | 27.4 | ||
| College or university or above | 52 | 12.2 | 145 | 41.4 | 197 | 25.5 | ||
| Household structure | Single person | 23 | 5.4 | 36 | 10.3 | 59 | 7.6 | 0.640 |
| Couple alone | 97 | 22.9 | 74 | 21.1 | 171 | 22.1 | ||
| Two generations | 145 | 34.2 | 129 | 36.9 | 274 | 35.4 | ||
| Three generations and above | 159 | 37.5 | 111 | 31.7 | 270 | 34.9 | ||
| Employment status | Employed | 208 | 49.1 | 248 | 70.9 | 571 | 73.8 | 0.000 *** |
| Not employed (including retired) | 216 | 50.9 | 102 | 29.1 | 203 | 26.2 | ||
| Housing type | Danwei | 74 | 17.5 | 70 | 20.0 | 144 | 18.6 | 0.000 *** |
| Commercial | 36 | 8.5 | 64 | 18.3 | 100 | 12.9 | ||
| Rental | 102 | 24.1 | 83 | 23.7 | 185 | 23.9 | ||
| Affordable housing | 212 | 50.0 | 133 | 38.0 | 345 | 44.6 | ||
| Car ownership (Mean) | 0.1 | -- | 0.4 | -- | 0.2 | -- | 0.000 *** | |
| Urban Form | Activity Type | Weekday | Weekend | ||
|---|---|---|---|---|---|
| Non-Low-Income | Low-Income | Non-Low-Income | Low-Income | ||
| Inner city | Working | 102 | 79.7 | 28.6 | 36.2 |
| Shopping | 3.2 a** | 7.3 b** | 19.1 | 13.9 | |
| Recreation | 15.3 | 18.3 | 33 | 24.3 | |
| Other | 11.4 | 11.2 | 15.1 | 13.0 | |
| Total | 131.95 | 116.49 | 95.77 | 87.37 | |
| Inner suburb | Working | 184.4 a*** | 127.3 b*** | 72.4 | 67.9 |
| Shopping | 8.5 | 8.7 | 21.6 | 16.8 | |
| Recreation | 44.4 | 34.1 | 60.6 a* | 45.9 b* | |
| Other | 17.1 | 19.9 | 41.1 a* | 29.3 b* | |
| Total | 254.37 a*** | 189.9 b*** | 195.79 a** | 159.9 b** | |
| Outer suburb | Working | 95 | 87.7 | 30.5 a** | 59.5 b** |
| Shopping | 7.3 a*** | 13.3 b*** | 16.7 | 13.4 | |
| Recreation | 41.5 a** | 61.0 b** | 64.0 | 76.3 | |
| Other | 14.3 | 18.7 | 28.7 | 23.4 | |
| Total | 158.1 | 180.71 | 139.92 a** | 172.57 b** | |
| Weekday | Weekend | |||
|---|---|---|---|---|
| Low-Income | Non-Low-Income | Low-Income | Non-Low-Income | |
| Working |  |  |  |  |
| Shopping |  |  |  |  |
| Leisure |  |  |  |  |
| Others |  |  |  |  |
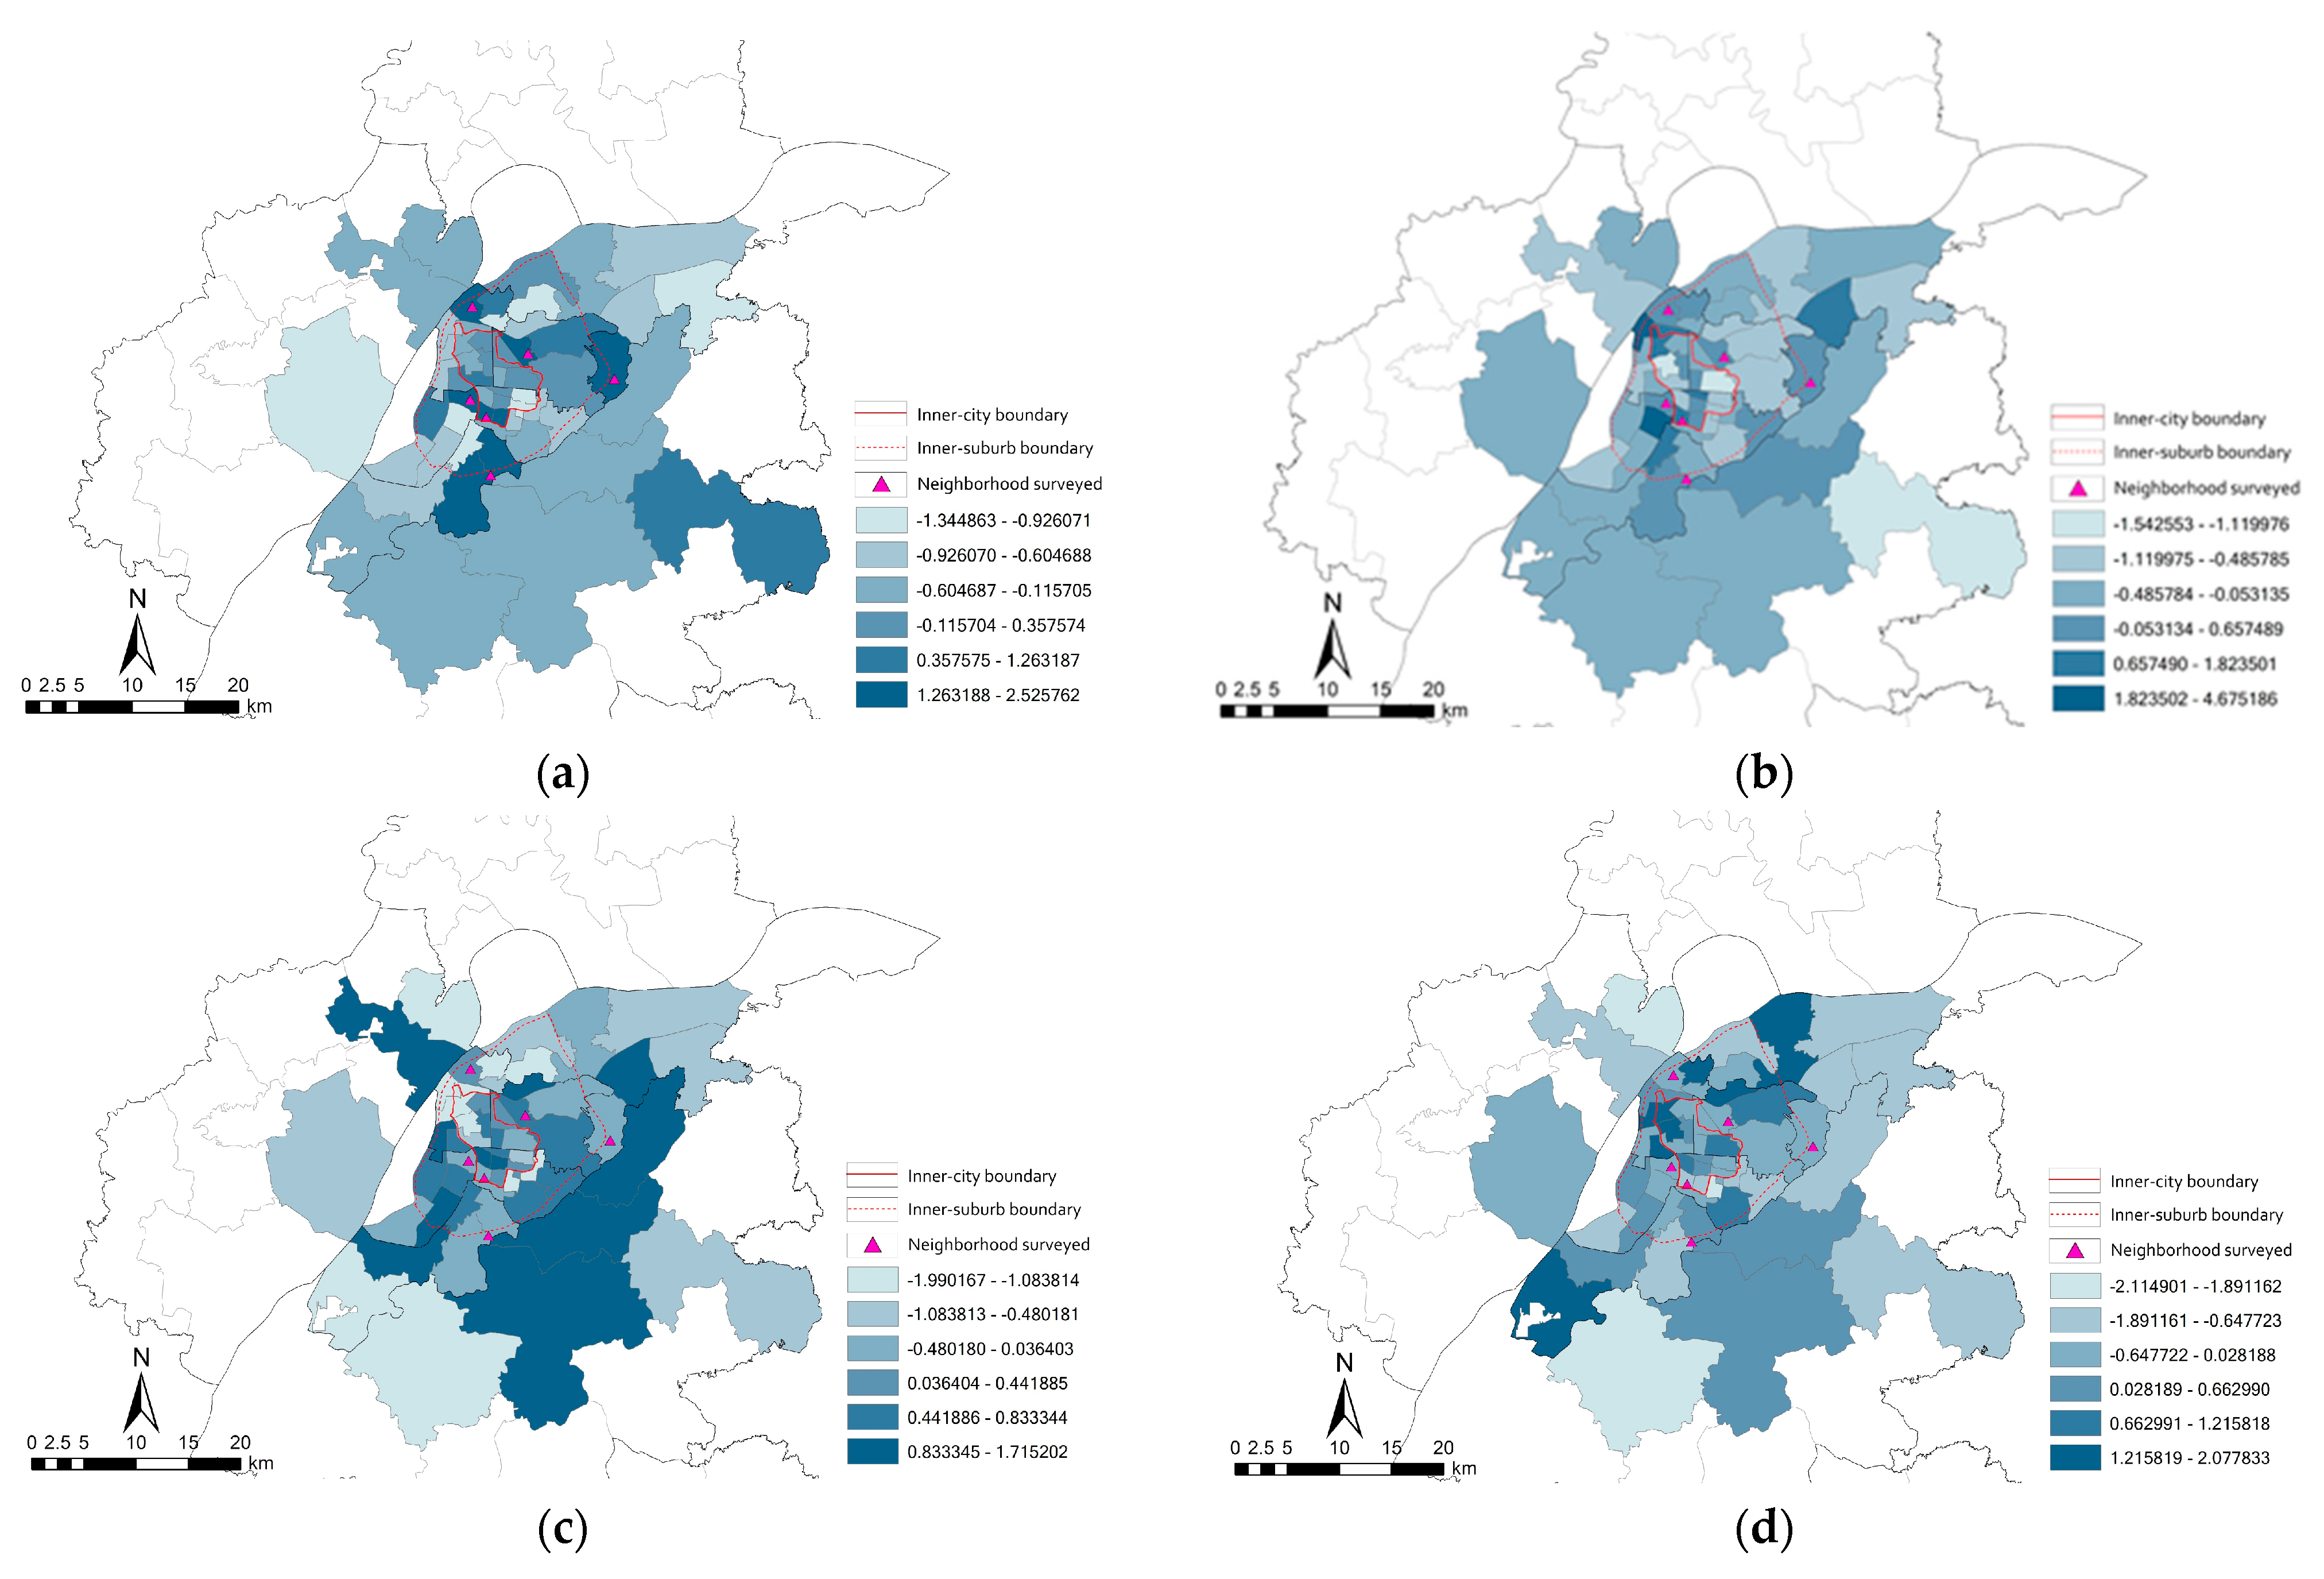
| Main Factor Name | The Variables | Factor Load | ||||||
|---|---|---|---|---|---|---|---|---|
| F1: Mixed leisure and low-income other activities | 9. LQ of weekday-leisure-activities of the low-income group | 0.865 | 0.006 | −0.013 | −0.126 | 0.242 | 0.093 | 0.016 |
| 10. LQ of weekday-leisure-activities of the non-low-income group | 0.863 | 0.155 | −0.004 | −0.147 | 0.116 | −0.03 | −0.009 | |
| 13. LQ of weekday-other-activities of the low-income group | 0.588 | 0.085 | 0.275 | 0.183 | −0.001 | 0.554 | −0.067 | |
| F2: Mixed shopping activities | 8. LQ of weekend- shopping -activities of the non-low-income group | 0.032 | 0.789 | 0.261 | −0.067 | 0.080 | 0.225 | 0.016 |
| 7. LQ of weekend- shopping -activities of the low-income group | −0.036 | 0.745 | −0.181 | 0.135 | −0.06 | 0.003 | 0.034 | |
| 6. LQ of weekday- shopping -activities of the non-low-income group | 0.277 | 0.681 | 0.08 | −0.163 | 0.372 | −0.052 | −0.053 | |
| 14. LQ of weekday-other-activities of the non-low-income group | 0.327 | 0.442 | −0.097 | 0.217 | −0.195 | −0.329 | 0.437 | |
| F3: Low-income working activities | 3. LQ of weekend-working-activities of the low-income group | −0.013 | 0.074 | 0.877 | 0.061 | −0.076 | 0.03 | −0.133 |
| 1. LQ of weekday-working-activities of the low-income group | 0.043 | −0.032 | 0.875 | 0.058 | −0.022 | −0.111 | 0.15 | |
| F4: Non-low-income working and leisure activities | 4. LQ of weekend-working-activities of the non-low-income group | 0.075 | 0.007 | −0.019 | 0.896 | −0.1 | −0.014 | −0.112 |
| 2. LQ of weekday-working-activities of the non-low-income group | −0.294 | −0.014 | 0.297 | 0.604 | 0.002 | 0.11 | −0.049 | |
| 12. LQ of weekend-leisure-activities of the non-low-income group | 0.348 | −0.039 | 0.071 | −0.513 | −0.27 | −0.068 | −0.489 | |
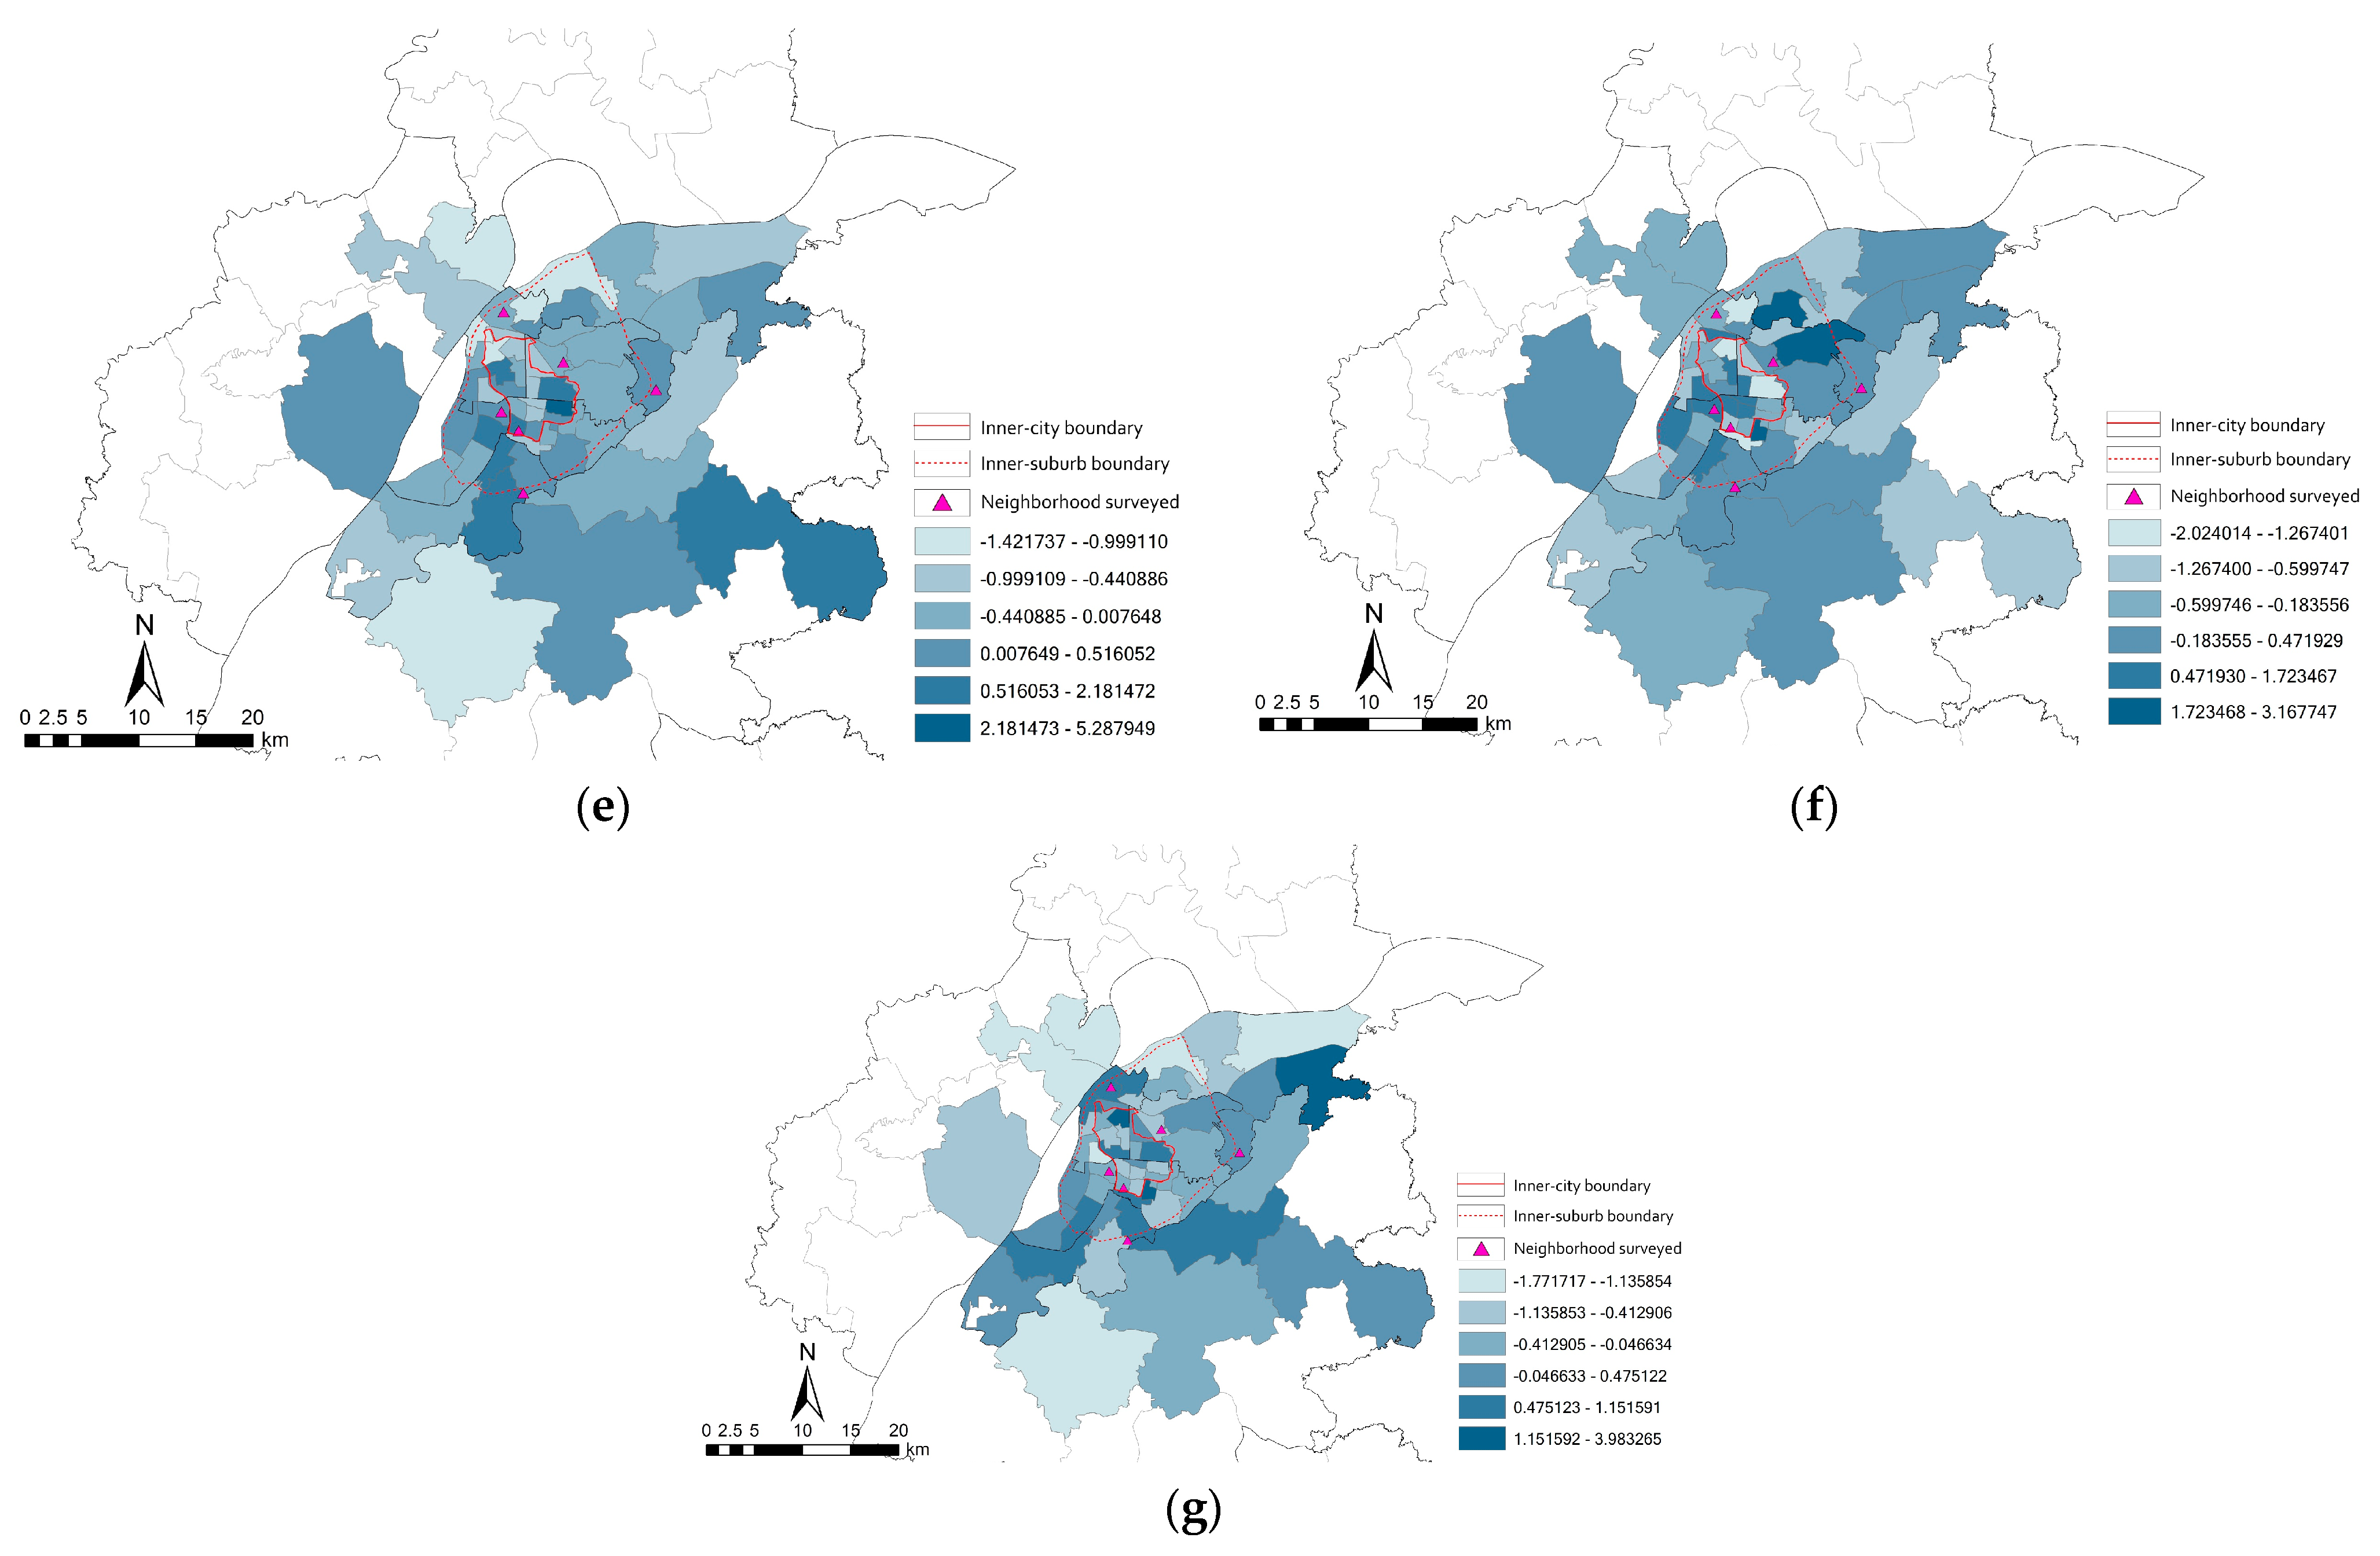
| F5: Low-income shopping and leisure activities | 5. LQ of weekday-shopping-activities of the low-income group | 0.110 | 0.292 | −0.034 | −0.097 | 0.821 | −0.025 | −0.066 |
| 11. LQ of weekend-leisure-activities of the low-income group | 0.370 | −0.271 | −0.147 | 0.115 | 0.673 | −0.089 | 0.022 | |
| F6: Low-income other activities | 15. LQ of weekend-other-activities of the low-income group | 0.014 | 0.100 | −0.156 | 0.038 | −0.079 | 0.876 | 0.197 |
| F7: Non-low-income other activities | 16. LQ of weekend-other-activities of the non-low-income group | 0.027 | −0.012 | 0.045 | −0.179 | −0.076 | 0.173 | 0.857 |
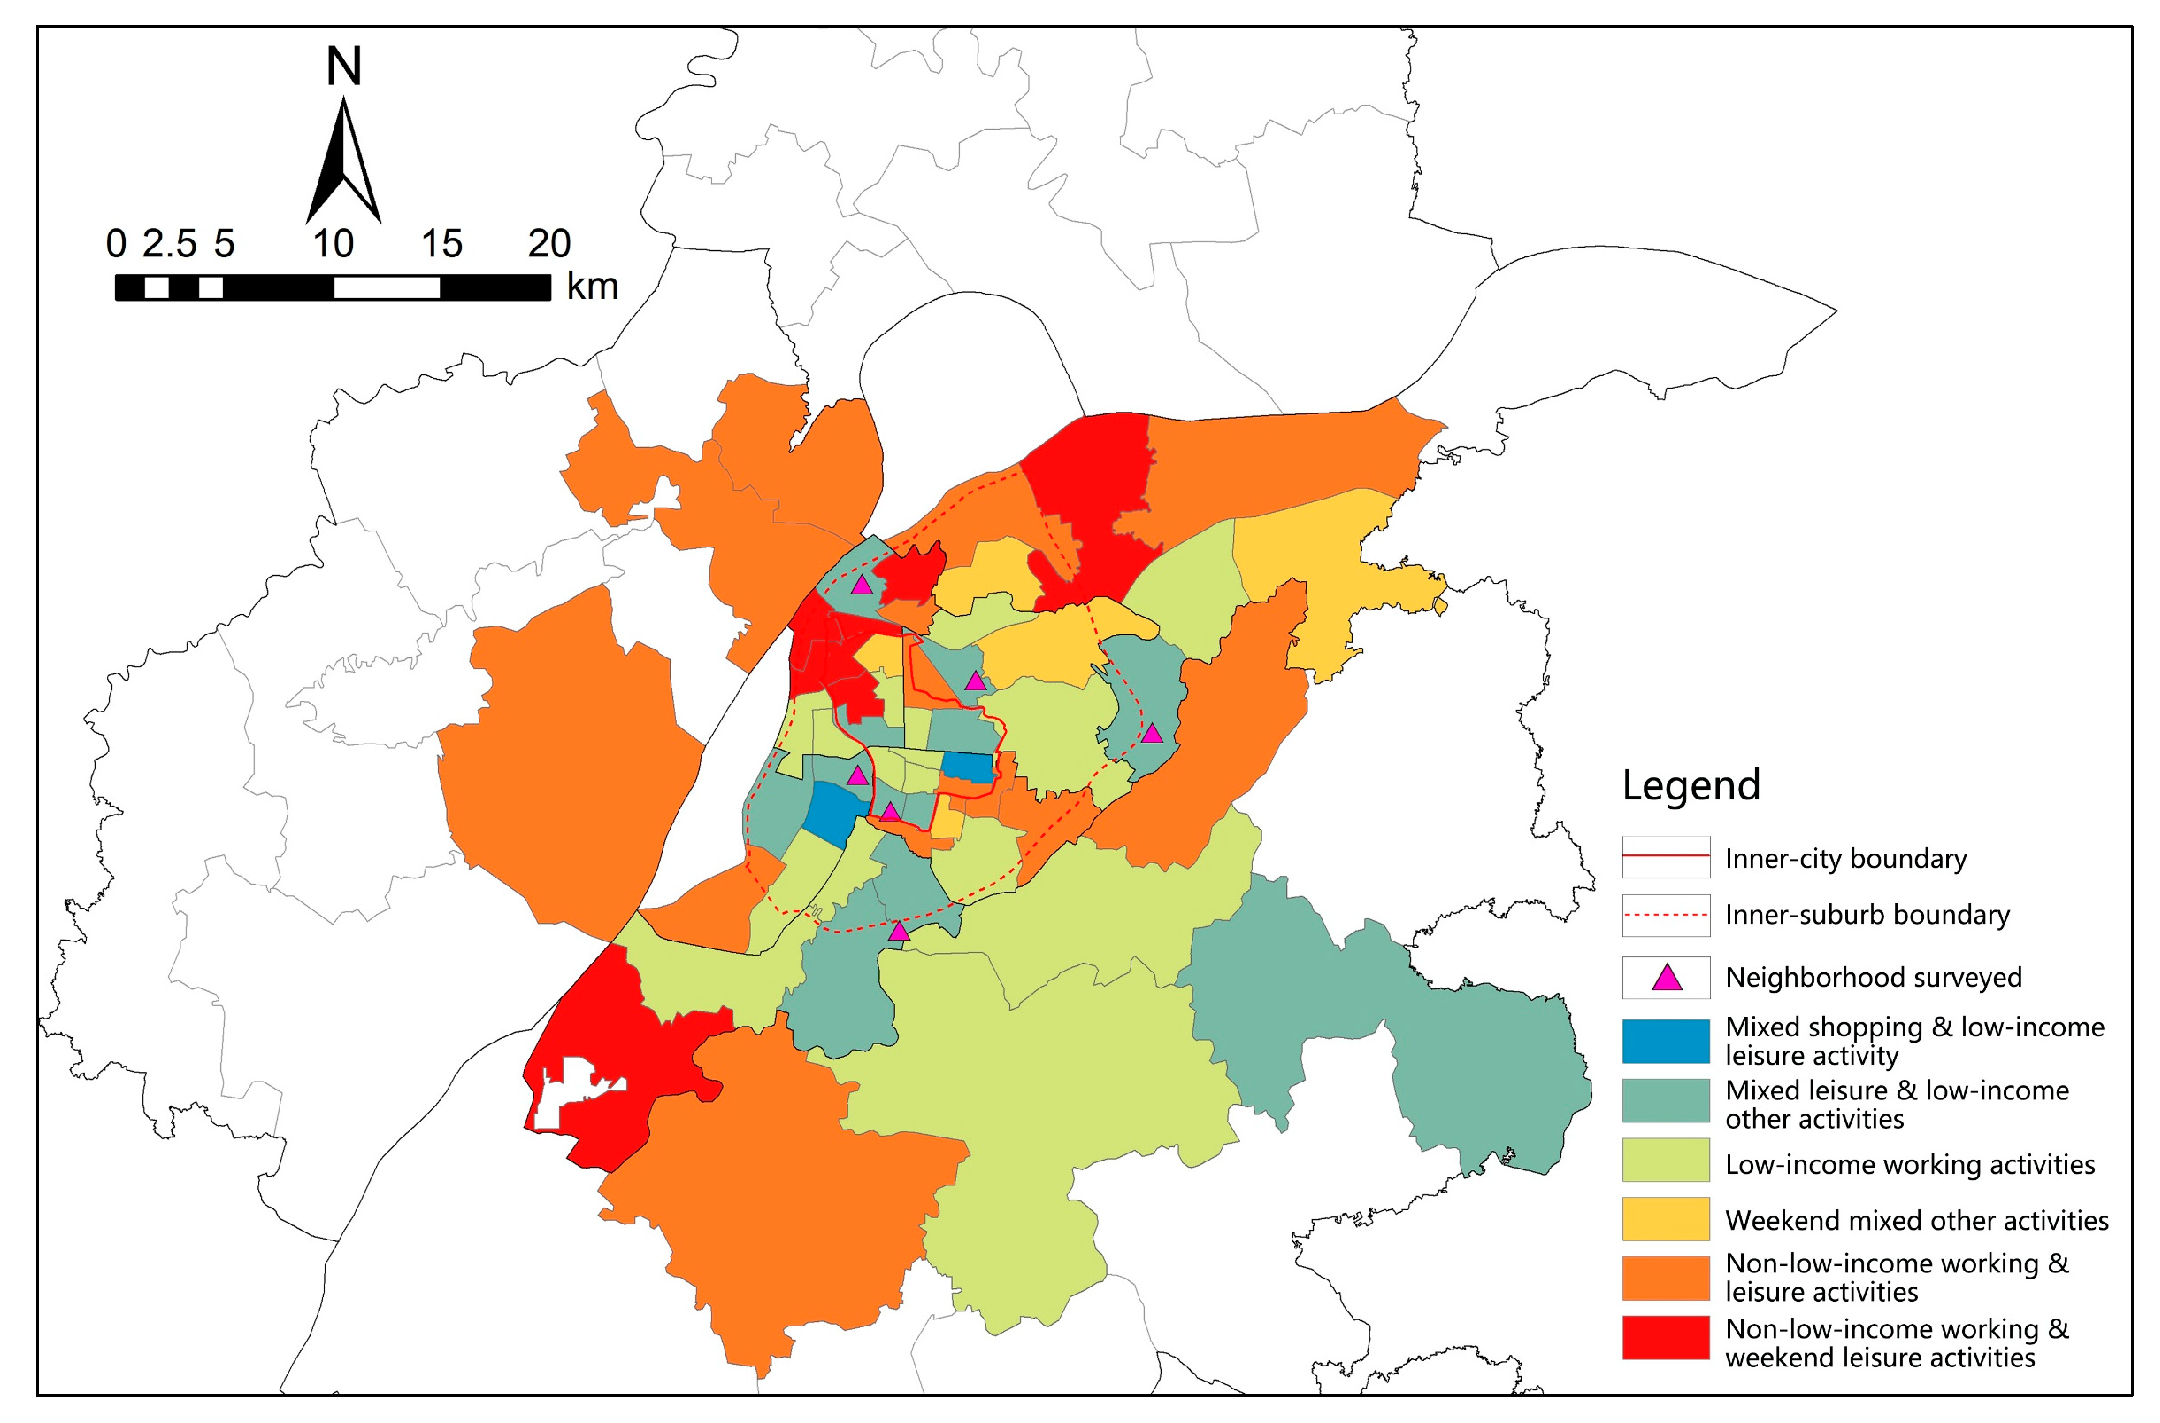
| Social Area | Distribution | Name of Observations | Number of Observations |
|---|---|---|---|
| Cluster 1: Mixed shopping and low-income leisure activity | In central city areas with high-density residential and low-end commercial facilities | 21_NY, 35_RJL | 2 |
| Cluster 2: Mixed leisure and low-income other activities | Mostly located in the subdistrict where the community is located, with a few in the southeast of the outer suburb | 13_BTQ,16_CH, 30_FZM, 2_HQL, 39_MQ, 47_MYXC, 22_MCH, 31_ST, 50_SJC, 55_TXQ, 23_XL, 56_YH | 12 |
| Cluster 3: Low-income working activities | Mainly concentrated in the center of the inner-city (CBD), some are scattered in the inner-suburb area and near the surveyed community in the outer suburb | 38_CTG, 17_DS, 1_FH, 28_HH,52_HS, 34_HWL, 5_HNL, 3_JD, 15_ML, 57_SHQ, 20_SZ, 37_WLC, 54_XSQ, 41_XL, 48_XLW, 46_XJK | 16 |
| Cluster 4: Weekend mixed other activities | Mainly scattered located near the surveyed communities and few on suburban fringe | 40_MGQ, 29_QH, 42_XG, 51_XWH, 7_ZYM | 5 |
| Cluster 5: Non-low-income working & leisure activities | Scattered in the north and southeast of the central city, as well as the west, east and south of the suburb with clusters of science and technology industrial parks. | 33_DGL,14_GL,32_GHL,24_JP,45_QX, 18_QL,19_SZ, 25_TS,10_XS,49_XWM, 26_YJ,43_YZJ,36_YYH,27_ZHM | 14 |
| Cluster 6: Non-low-income group working and rest day leisure activities | Mainly in the northwest of the central city, few scattered in the north and south suburban area. | 53_BQ,9_JNL,12_MFS, 4_NHL, 6_RHNL, 44_YH, 8_YJM,11_YJL | 8 |
| Time Allocation in the Central City | Time Allocation in Outer Suburbs | |||||||
|---|---|---|---|---|---|---|---|---|
| Working | Shopping | Leisure | Others | Working | Shopping | Leisure | Others | |
| Model 1 | ||||||||
| Low-income (ref. non-low-income group) | −79.523 *** | 4.248 * | −7.339 | 2.675 | −7.276 | 6.016 *** | 19.462 ** | 4.405 |
| (Constant) | 286.471 *** | 11.743 *** | 59.697 *** | 28.414 *** | 95.011 *** | 7.286 *** | 41.529 *** | 14.271 *** |
| R Square | 0.019 | 0.004 | 0.001 | 0.000 | 0.000 | 0.012 | 0.008 | 0.002 |
| Adjusted R Square | 0.018 | 0.002 | 0.000 | −0.001 | −0.001 | 0.010 | 0.007 | 0.000 |
| Model 2 | ||||||||
| Low-income (ref. non-low-income group) | −32.877 ** | 2.751 | −13.005 * | −0.425 | 30.750 ** | 1.284 | 1.549 | 2.695 |
| Gender (ref. women) | −9.445 | −2.989 | −1.000 | 1.957 | 6.166 | −1.871 | 5.775 | 2.944 |
| Age (ref. 30–59) | ||||||||
| 29 or below | −2.553 | −2.921 | 11.926 | 10.679 | 1.708 | −3.896 | −15.108 | −2.218 |
| 60 or above | −18.470 | 3.427 | 20.358 ** | −18.124 ** | 9.781 | −5.918 ** | 32.584 *** | −5.998 |
| Education (ref. middle school or below) | ||||||||
| Secondary school | 38.849 ** | 1.451 | −9.055 | 6.510 | −39.133 ** | −0.648 | 11.810 | −2.800 |
| College or university or above | −0.317 | 1.494 | −2.772 | −5.425 | −1.147 | −2.226 | −6.131 | −4.650 |
| Housing type (ref. affordable housing) | ||||||||
| Danwei | 62.829 *** | 2.561 | 39.691 *** | 13.759 | −61.867 *** | −5.521 * | −36.360 *** | 0.214 |
| Commercial | 71.184 *** | 3.956 | 29.872 *** | 6.343 | −74.720 *** | −4.515 | −38.421 *** | 3.182 |
| Rental | 38.141 ** | 3.227 | 2.907 | 5.896 | −39.708 ** | −4.678 * | −24.531 *** | 7.720 |
| Family size | 0.178 | −2.406 ** | −6.861 ** | 1.518 | −2.071 | 0.372 | −7.596 *** | 3.632 ** |
| Cars owned (ref. no car) | −69.532 | −0.918 | −6.844 | −12.376 * | 64.524 *** | 0.715 | 14.158 * | 12.294 ** |
| Working time in the diary day | 0.734 *** | −0.034 | −0.124 *** | −0.036 *** | 0.258 *** | −0.026 *** | −0.079 *** | −0.022 *** |
| Total travel time in the diary day | −0.280 ** | 0.024 | −0.005 | 0.064 | 0.258 *** | −0.034 ** | −0.178 *** | −0.058 * |
| Distance from home to the city center | −0.010 *** | −0.003 *** | −0.011 | −0.003 | 0.010 *** | 0.002 *** | 0.011 *** | 0.004 *** |
| (Constant) | 87.146 | 48.771 | 189.779 | 53.912 | −74.393 | 9.583 | 37.064 | −17.263 |
| R Square | 0.601 | 0.200 | 0.339 | 0.051 | 0.233 | 0.209 | 0.367 | 0.098 |
| Adjusted R Square | 0.594 | 0.185 | 0.327 | 0.033 | 0.219 | 0.194 | 0.355 | 0.082 |
| Time Allocation in the Central City | Time Allocation in Outer Suburbs | |||||||
|---|---|---|---|---|---|---|---|---|
| Working | Shopping | Leisure | Others | Working | Shopping | Leisure | Others | |
| Model 3 | ||||||||
| Low-income (ref. non-low-income group) | 3.123 | −10.050 * | −23.411 ** | −13.956 * | 29.026 ** | −3.299 | 12.251 | −5.329 |
| (Constant) | 100.946 *** | 40.757 *** | 93.597 *** | 56.263 *** | 30.514 *** | 16.671 *** | 64.023 *** | 28.711 *** |
| R-square | 0.000 | 0.005 | 0.008 | 0.005 | 0.008 | 0.002 | 0.002 | 0.001 |
| Adjusted R-square | −0.001 | 0.003 | 0.006 | 0.003 | 0.007 | 0.000 | 0.001 | 0.000 |
| Model 4 | ||||||||
| Low-income (ref. non-low-income group) | 6.035 | −2.595 | −12.244 | −5.113 | 35.552 *** | −3.313 | 2.187 | −7.622 |
| Gender (ref. women) | 20.801 | −9.379 * | 0.314 | 3.764 | 0.622 | −3.027 | 3.815 | −7.622 |
| Age (ref. 30–59) | ||||||||
| 29 or below | 10.193 | −14.230 * | 7.380 | −22.503 ** | −1.374 | 0.838 | 1.876 | 6.975 |
| 60 or above | 15.378 | −6.266 | 31.633 ** | −39.229 *** | 1.774 | −4.226 | 30.225 ** | −2.848 |
| Education (ref. middle school or below) | ||||||||
| Secondary school | −5.054 | 6.116 | −17.685 | 23.516 *** | −19.773 | 0.304 | −3.278 | −6.047 |
| College or university or above | −76.679 *** | 28.049 *** | 11.984 | 41.769 *** | −37.286 ** | 5.855 | −6.400 | −4.736 |
| Housing type (ref. affordable housing) | ||||||||
| Danwei | −28.373 | 15.630 * | 60.394 | 23.275 ** | −42.512 ** | −0.826 | −47.928 *** | 7.748 |
| Commercial | 54.350 ** | 17.986 ** | 12.605 | 6.470 | −53.874 *** | −3.325 | −34.762 ** | 10.403 |
| Rental | 19.412 | 19.348 ** | 3.756 | 2.518 | −16.117 | 0.339 | −44.690 *** | 28.461 *** |
| Family size | 0.743 | −0.685 | −11.660 *** | 3.510 | −1.533 | −1.319 | −9.886 *** | 5.966 ** |
| Cars owned (ref. no car) | −50.860 *** | 2.589 | 17.869 | −13.754 | 28.197 * | 2.222 | 12.010 | 8.975 |
| Working time in the diary day | 0.376 *** | −0.026 ** | −0.025 | −0.009 | 0.144 *** | −0.015 *** | −0.059 *** | −0.030 ** |
| Total travel time in the diary day | −0.074 | 0.000 | −0.129 * | −0.009 | 0.144 | −0.009 | 0.015 | 0.037 |
| Distance from home to the city center | −0.012 *** | −0.002 *** | −0.010 *** | −0.002 * | 0.006 *** | 0.004 *** | 0.012 *** | 0.006 *** |
| (Constant) | 68.530 | 54.348 | 182.810 | 53.530 | −39.292 | 2.289 | 49.714 | −26.147 |
| R Square | 0.277 | 0.069 | 0.195 | 0.086 | 0.123 | 0.125 | 0.228 | 0.089 |
| Adjusted R Square | 0.264 | 0.052 | 0.180 | 0.069 | 0.107 | 0.108 | 0.214 | 0.072 |
Publisher’s Note: MDPI stays neutral with regard to jurisdictional claims in published maps and institutional affiliations. |
© 2022 by the authors. Licensee MDPI, Basel, Switzerland. This article is an open access article distributed under the terms and conditions of the Creative Commons Attribution (CC BY) license (https://creativecommons.org/licenses/by/4.0/).
Share and Cite
Wang, H.; Kwan, M.-P.; Hu, M.; Qi, J.; Zheng, J.; Han, B. Time Allocation and the Activity-Space-Based Segregation of Different Income Groups: A Case Study of Nanjing. Land 2022, 11, 1717. https://doi.org/10.3390/land11101717
Wang H, Kwan M-P, Hu M, Qi J, Zheng J, Han B. Time Allocation and the Activity-Space-Based Segregation of Different Income Groups: A Case Study of Nanjing. Land. 2022; 11(10):1717. https://doi.org/10.3390/land11101717
Chicago/Turabian StyleWang, Hui, Mei-Po Kwan, Mingxing Hu, Junheng Qi, Jiemin Zheng, and Bin Han. 2022. "Time Allocation and the Activity-Space-Based Segregation of Different Income Groups: A Case Study of Nanjing" Land 11, no. 10: 1717. https://doi.org/10.3390/land11101717