
Pre/Post-Fire Soil Erosion and Evaluation of Check-Dams Effectiveness in Mediterranean Suburban Catchments Based on Field Measurements and Modeling

Abstract
:1. Introduction
2. Materials and Methods
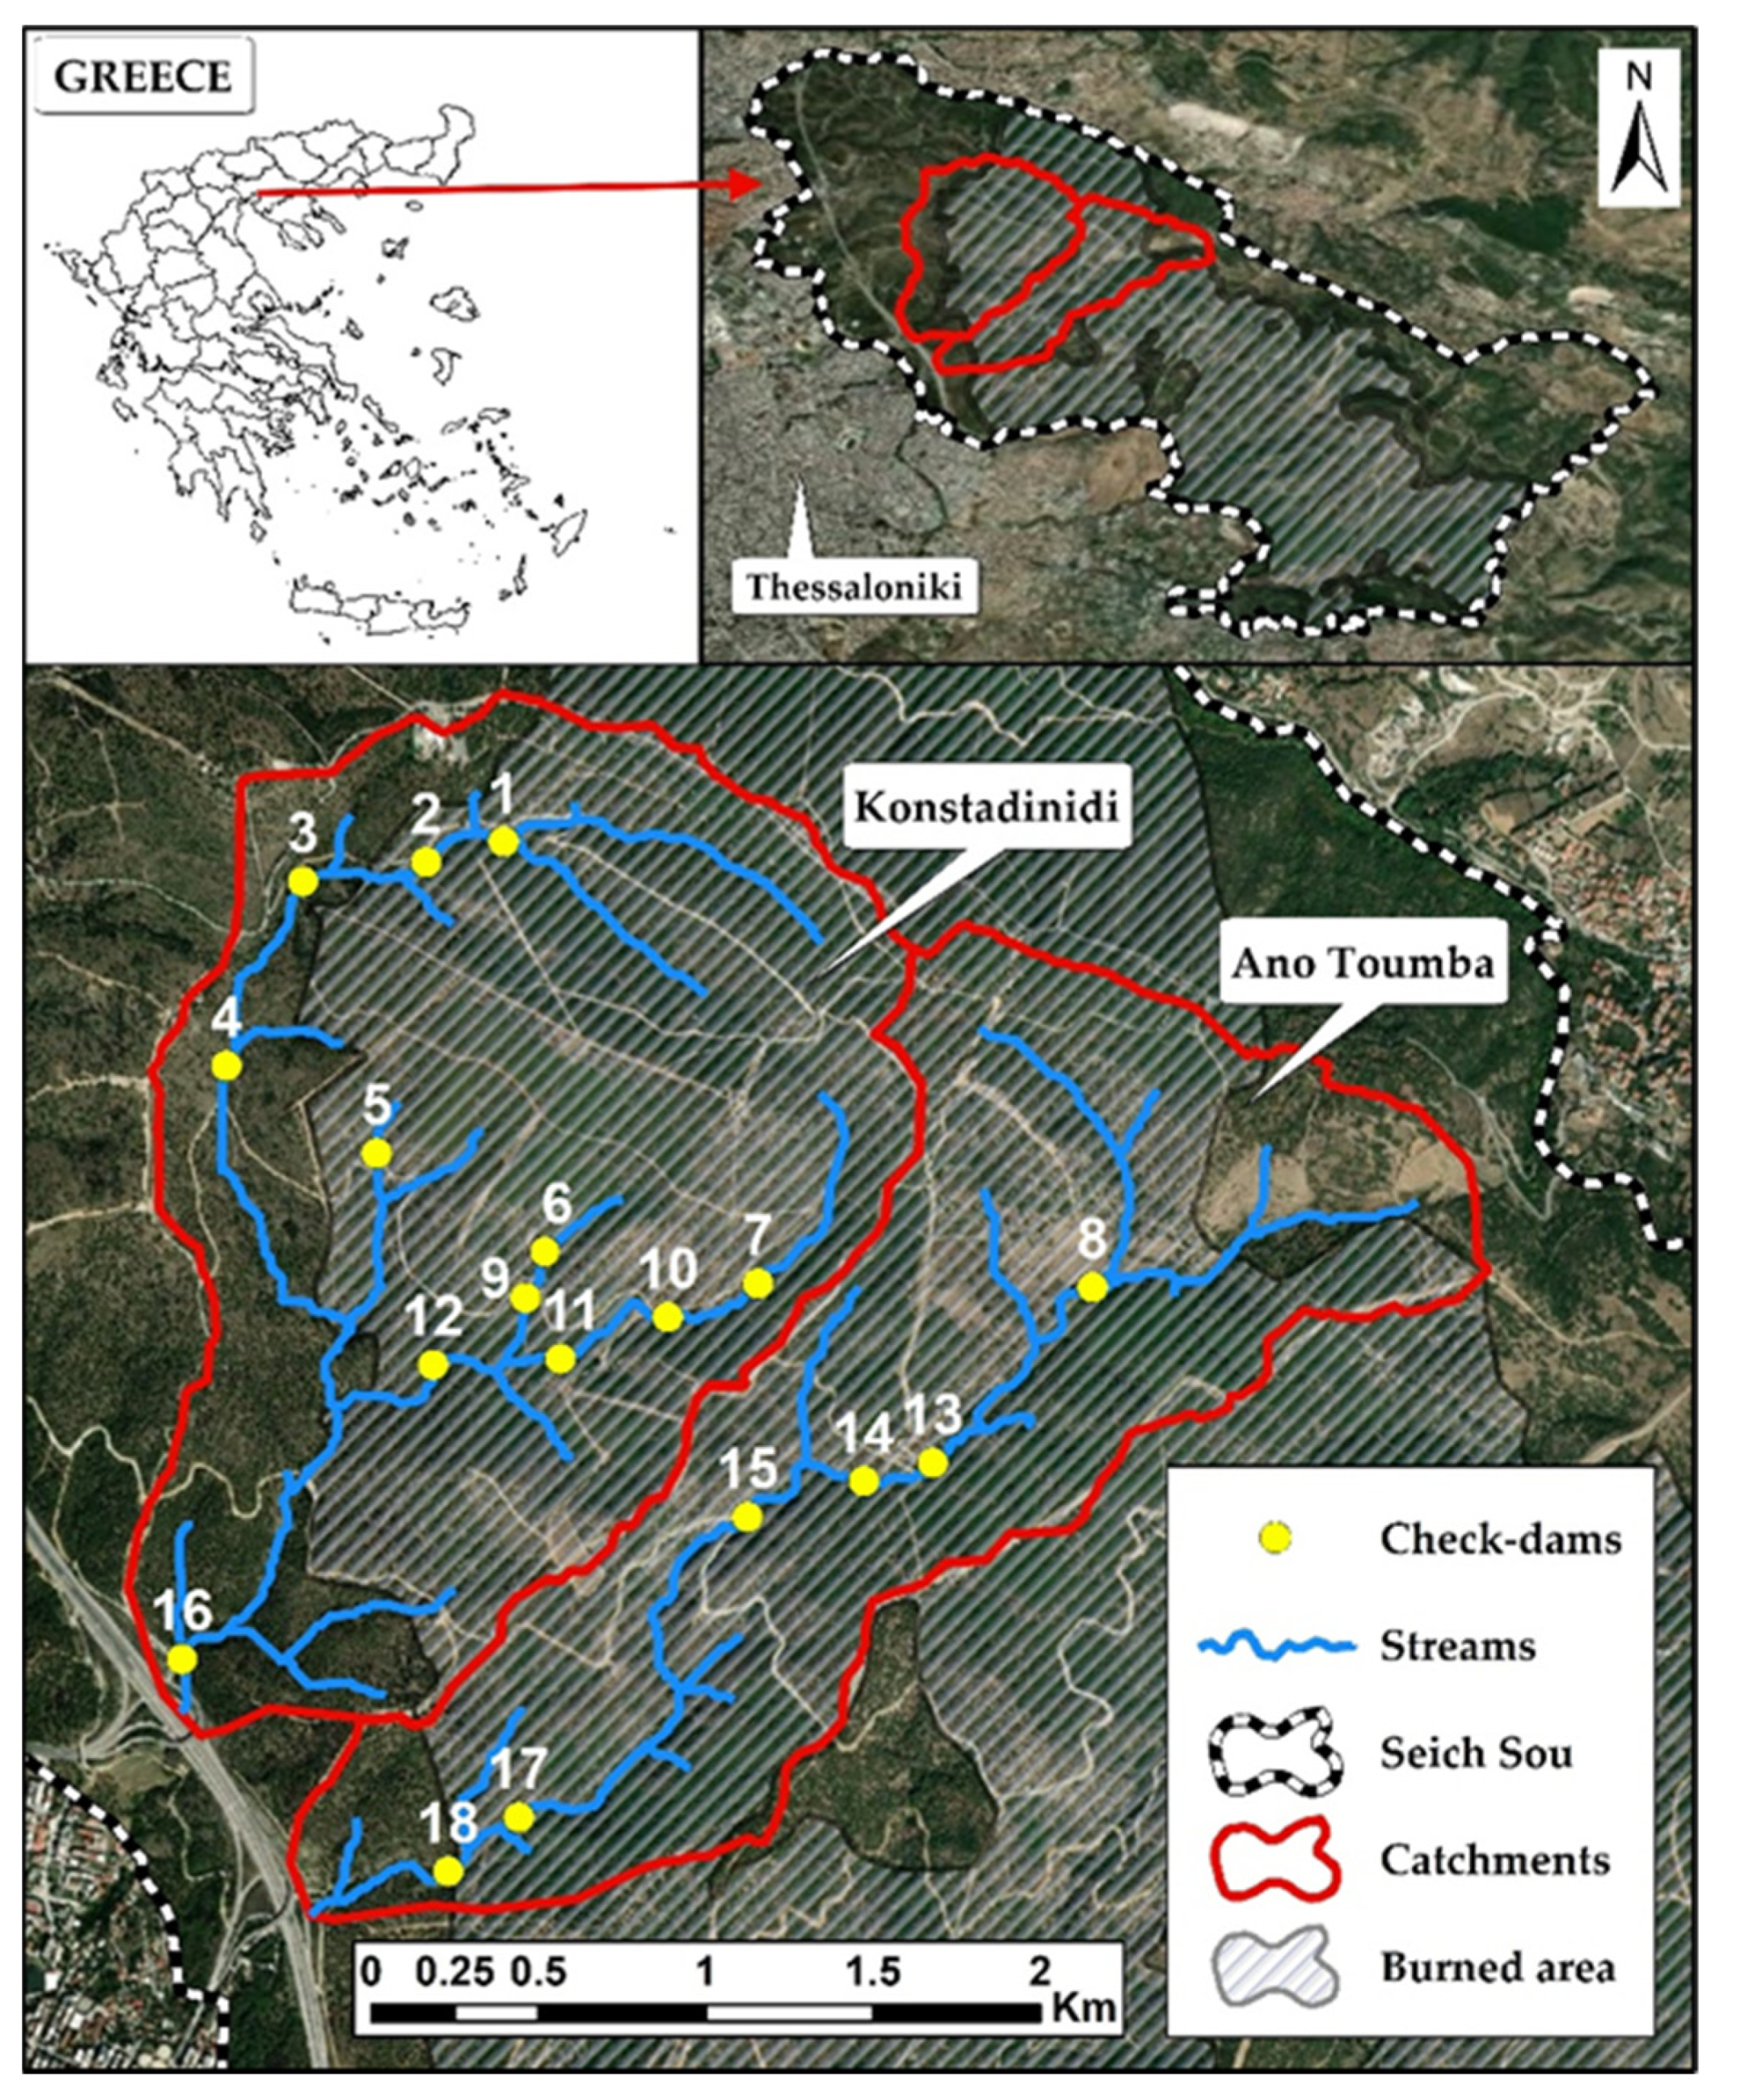
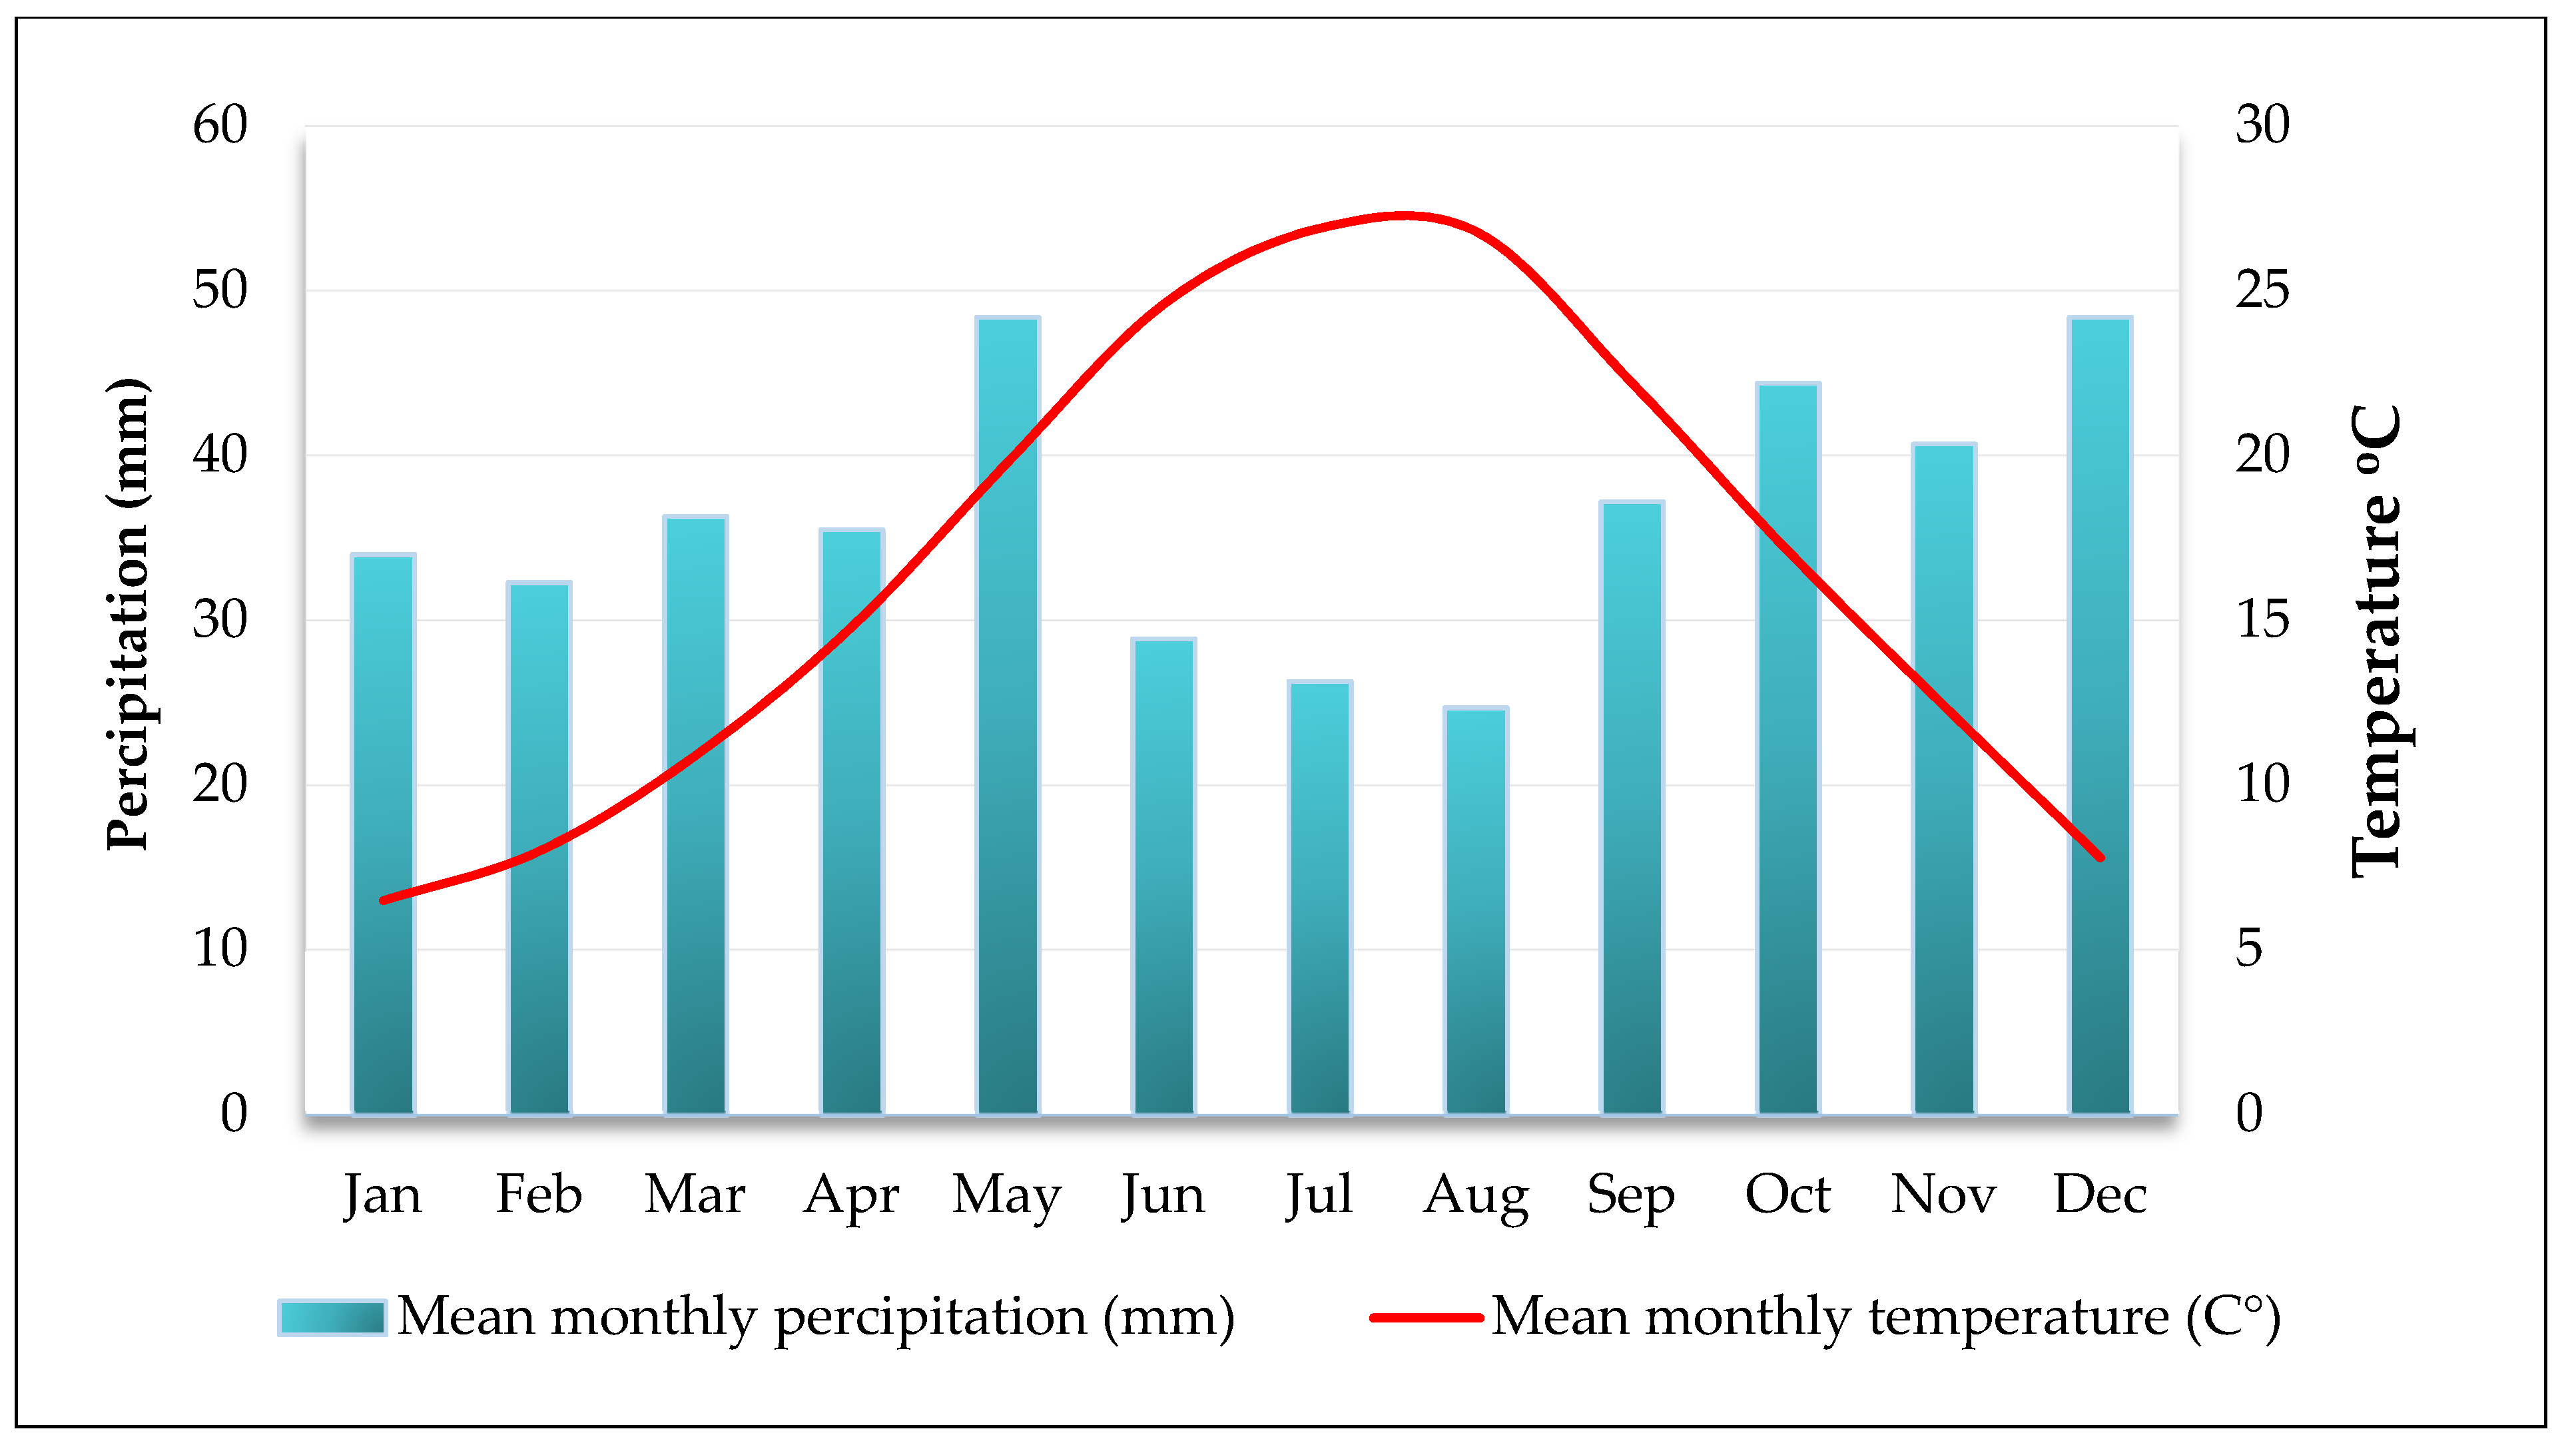
2.1. Study Area
2.2. Methodologies
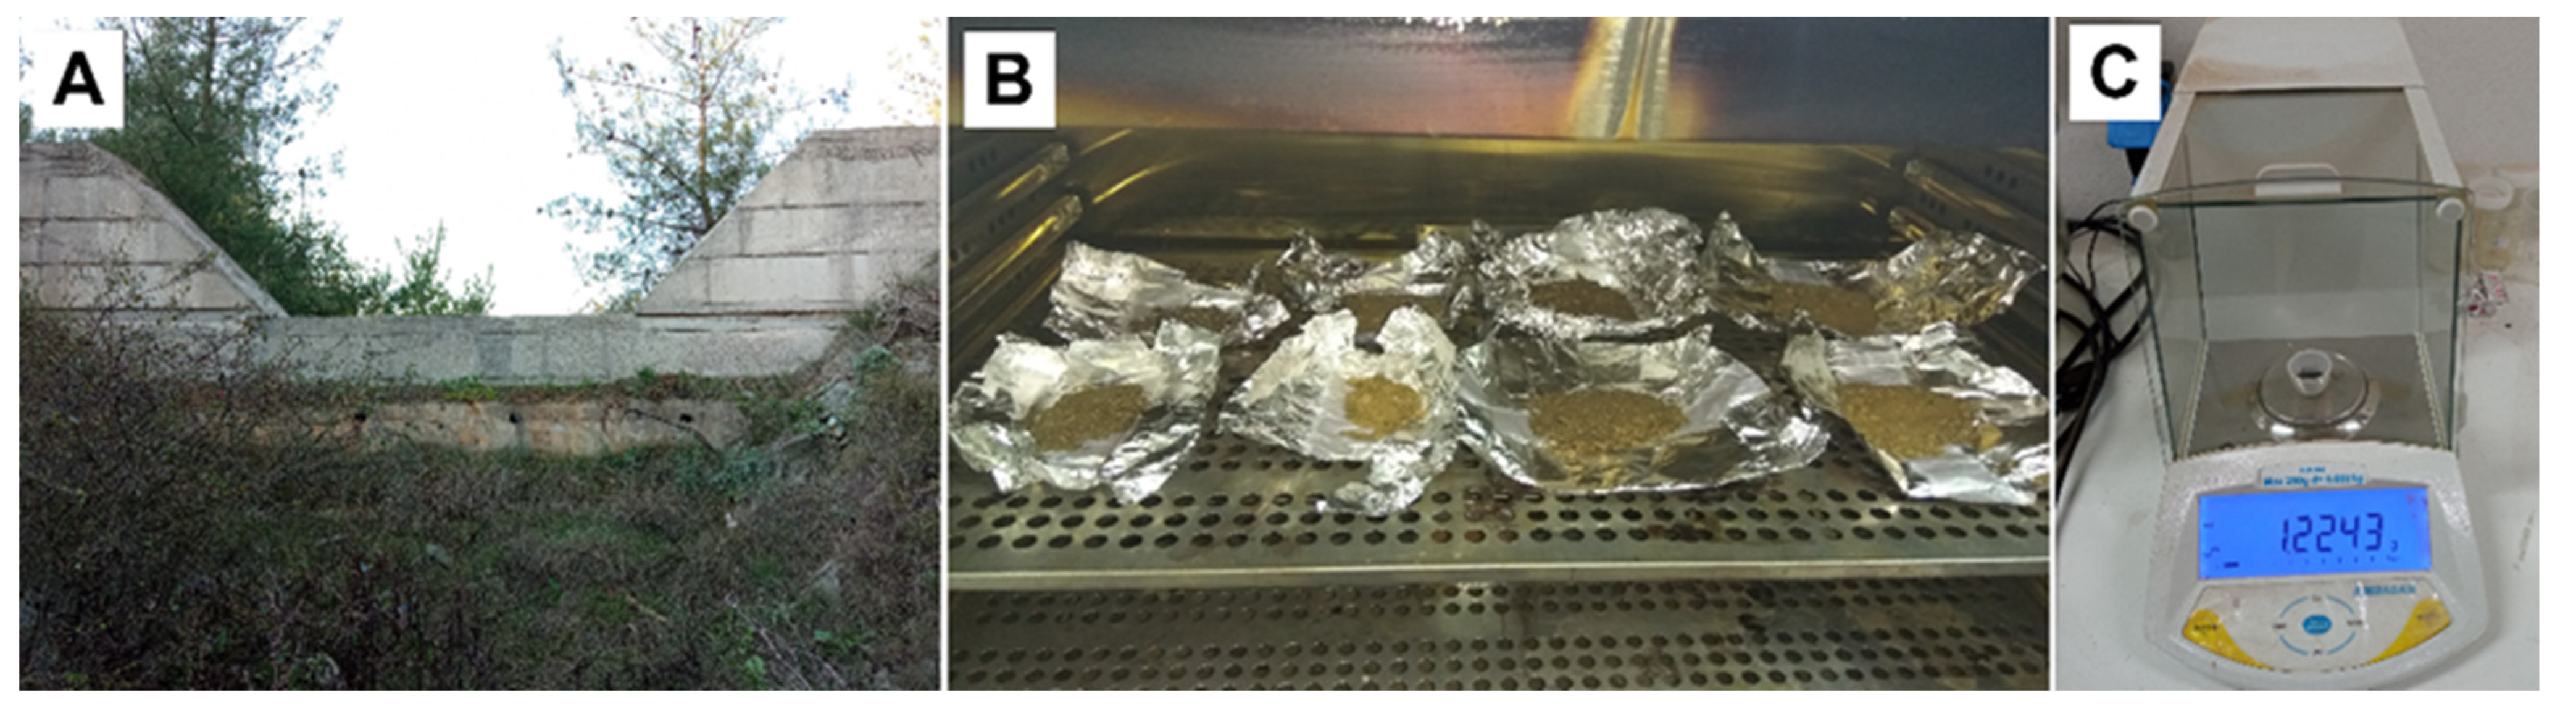
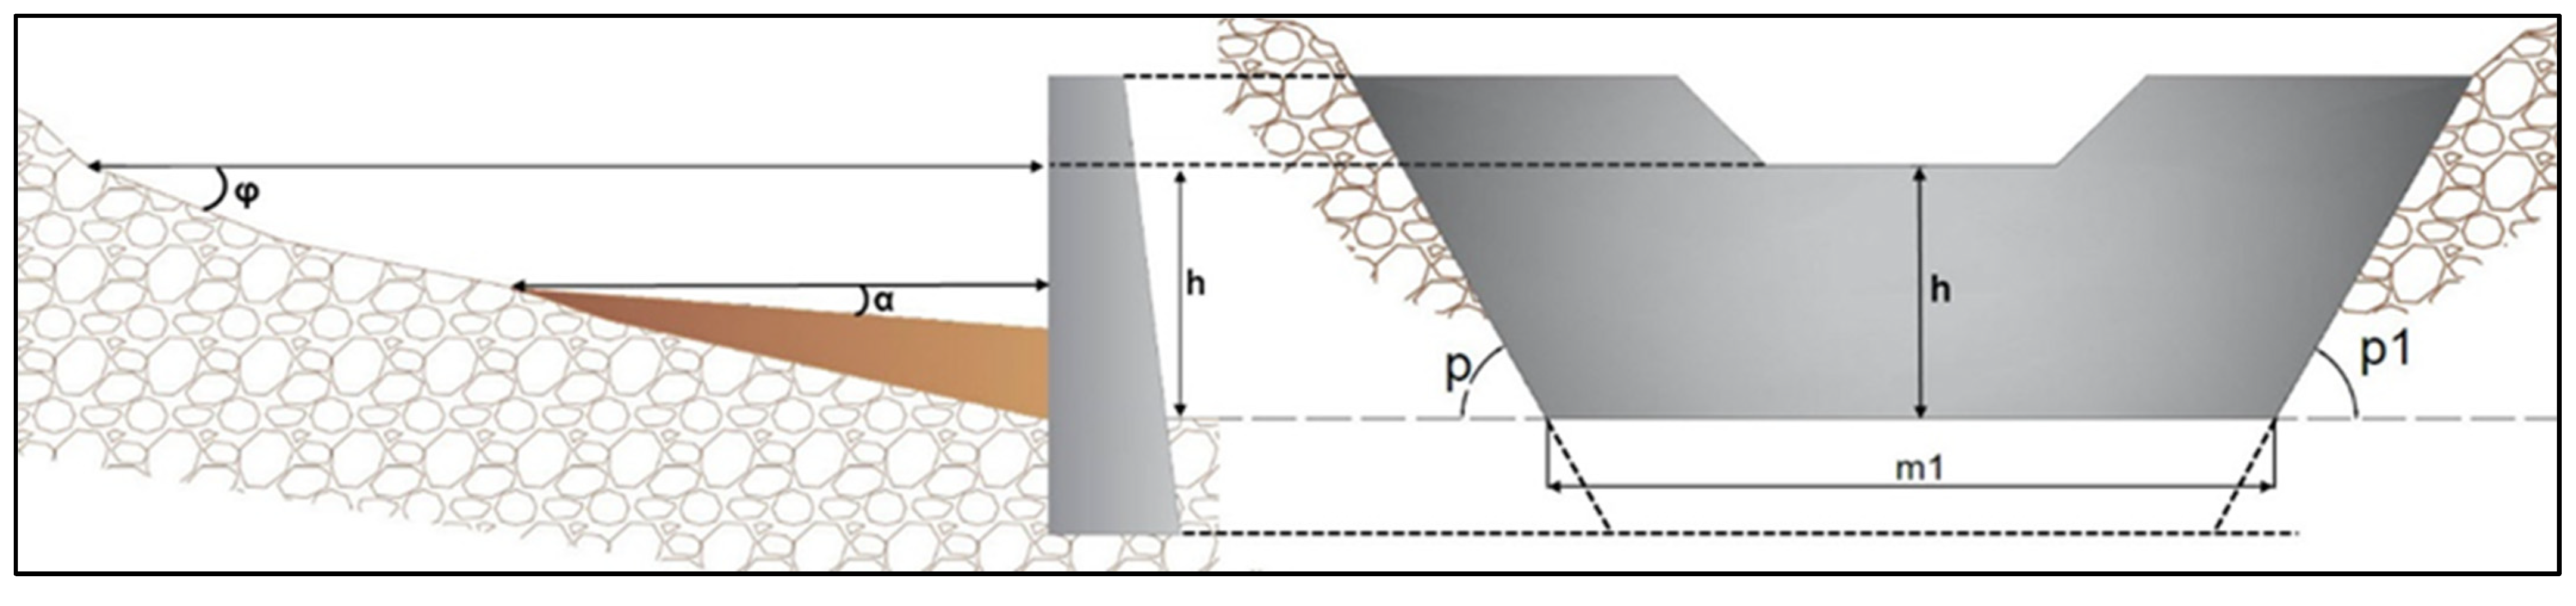
2.2.1. Field Work–Check-Dam Trap Efficiency Estimation
2.2.2. RUSLE Parameters
- (1)
- (2)
- Soil erodibility map (K factor). The soil erodibility values were determined using the Soil Conservation Service (SCS) nomogram (Renard et al. 1997). For this purpose, maps of mechanical composition and soil hydrological types of the catchments were constructed based on information obtained from pre-existing field surveys [78,89,90]. The soil characteristics and the respective calculated K factors are presented in Table 3.
- (3)
- (4)
- (5)
- Parcels map were estimated using orthophotos of the study area from the past 30 years’ period.
2.2.3. WaTEM/SEDEM Setup and Calibration
3. Results and Discussion
3.1. Check-Dam Trap Efficiency Field Work Results
3.2. Model Calibration
3.3. WaTEM/SEDEM Model Application Results
3.4. Post-Fire Modeling Application with Check-Dams
4. Conclusions
Author Contributions
Funding
Data Availability Statement
Conflicts of Interest
References
- Pastor, A.V.; Nunes, J.P.; Ciampalini, R.; Koopmans, M.; Baartman, J.; Huard, F.; Calheiros, T.; Le-Bissonnais, Y.; Keizer, J.J.; Raclot, D. Projecting Future Impacts of Global Change Including Fires on Soil Erosion to Anticipate Better Land Manage-ment in the Forests of NW Portugal. Water 2019, 11, 2617. [Google Scholar] [CrossRef] [Green Version]
- Morgan, R.P.C. Soil Erosion and Conservation, 2nd ed.; Longman: Harlow, UK, 1995. [Google Scholar]
- Morán-Ordóñez, A.; Duane, A.; Gil-Tena, A.; De Cáceres, M.; Aquilué, N.; Guerra, C.A.; Geijzendorffer, I.R.; Fortin, M.J.; Brotons, L. Future impact of climate extremes in the Mediterranean: Soil erosion projections when fire and extreme rainfall meet. Land Degrad. Dev. 2020, 31, 3040–3054. [Google Scholar] [CrossRef]
- Myronidis, D.I.; Emmanouloudis, D.A.; Mitsopoulos, I.A.; Riggos, E.E. Soil erosion potential after fire and rehabilitation treatments in Greece. Environ. Modeling Assess. 2010, 15, 239–250. [Google Scholar] [CrossRef]
- Depountis, N.; Michalopoulou, M.; Kavoura, K.; Nikolakopoulos, K.; Sabatakakis, N. Estimating Soil Erosion Rate Changes in Areas Affected by Wildfires. ISPRS Int. J. Geo-Inf. 2020, 9, 562. [Google Scholar] [CrossRef]
- Kastridis, A.; Stathis, D. The effect of small earth dams and reservoirs on water management in North Greece (Kerkini municipality). Silva Balc. 2015, 16, 71–84. [Google Scholar]
- Iradukunda, P.; Bwambale, E. Reservoir sedimentation and its effect on storage capacity–A case study of Murera reservoir, Kenya. Cogent Eng. 2021, 8, 1917329. [Google Scholar] [CrossRef]
- Kalinderis, M.; Sapountzis, D.; Stathis, F.; Tziaftani, P.; Kourakli, P.; Stefanidis, P. The Risk of Sedimentation of Artificial Lakes, Following the Soil Loss and Degradation Process in the Wider Drainage Basin. Artificial Lake of Smokovo Case Study (Central Greece). In Proceedings of the International Conference Land Conservation 0905, Tara Mountain, Serbia, 26–30 May 2009. Global Change. Challenges for Soil Management. In Advances in GeoEcology, 41st ed.; Zlatić, M., Ed.; Catena Verlag: Stuttgart, Germany, 2009; pp. 129–140. ISBN 978-3-923381-57-9. Available online: https://www.researchgate.net/publication/259451926_The_risk_of_sedimentation_of_artificial_lakes_following_the_soil_loss_and_degradation_process_in_the_wider_drainage_basin_Artificial_lake_of_Smokovo_case_study_Central_Greece (accessed on 17 October 2021).
- Kondolf, G.M.; Piégay, H.; Landon, N. Channel Response to Increased and Decreased Bedload Supply from Land Use Change: Contrasts between Two Catchments. Geomorphology 2002, 45, 35–51. [Google Scholar] [CrossRef] [Green Version]
- Boix-Fayos, C.; de Vente, J.; Martínez-Mena, M.; Barberá, G.G.; Castillo, V. The impact of land use change and check-dams on catchment sediment yield. Hydrol. Process. Int. J. 2008, 22, 4922–4935. [Google Scholar] [CrossRef]
- Bielecka, E.; Jenerowicz, A.; Pokonieczny, K.; Borkowska, S. Land cover changes and flows in the Polish Baltic coastal zone: A qualitative and quantitative approach. Remote Sens. 2020, 12, 2088. [Google Scholar] [CrossRef]
- Malek, Ž.; Scolobig, A.; Schröter, D. Understanding land cover changes in the Italian Alps and Romanian Carpathians combining remote sensing and stakeholder interviews. Land 2014, 3, 52–73. [Google Scholar] [CrossRef] [Green Version]
- Bajocco, S.; De Angelis, A.; Perini, L.; Ferrara, A.; Salvati, L. The impact of land use/land cover changes on land degradation dynamics: A Mediterranean case study. Environ. Manag. 2012, 49, 980–989. [Google Scholar] [CrossRef] [PubMed]
- Koulouri, M.; Giourga, C. Land abandonment and slope gradient as key factors of soil erosion in Mediterranean terraced lands. Catena 2007, 69, 274–281. [Google Scholar] [CrossRef]
- Kastridis, A.; Stathis, D.; Sapountzis, M.; Theodosiou, G. Insect Outbreak and Long-Term Post-Fire Effects on Soil Erosion in Mediterranean Suburban Forest. Land 2022, 11, 911. [Google Scholar] [CrossRef]
- Myronidis, D.; Stathis, D.; Sapountzis, M. Post-Evaluation of flood hazards induced by former artificial interventions along a coastal Mediterranean settlement. J. Hydrol. Eng. 2016, 21, 05016022. [Google Scholar] [CrossRef]
- Van Rompaey, A.J.J.; Govers, G.; Puttemans, C. Modelling Land Use Changes and their Impacts on Soil Erosion and Sediment Supply to Rivers. Earth Surf. Process. Landf. 2002, 27, 481–494. [Google Scholar] [CrossRef]
- Yu, Y.; Wei, W.; Chen, L.; Feng, T.; Daryanto, S. Quantifying the effects of precipitation, vegetation, and land preparation techniques on runoff and soil erosion in a Loess watershed of China. Sci. Total Environ. 2019, 652, 755–764. [Google Scholar] [CrossRef]
- Kastridis, A.; Kamperidou, V. Influence of land use changes on alluviation of Volvi Lake wetland (North Greece). Soil Water Res. 2015, 10, 121–129. [Google Scholar] [CrossRef] [Green Version]
- Beguería, S.; López-Moreno, J.I.; Gómez-Villar, A.; Rubio, V.; Lana-Renault, N.; García-Ruiz, J.M. Fluvial adjustments to soil erosion and plant cover changes in the Central Spanish Pyrenees. Geogr. Ann. Ser. A Phys. Geogr. 2006, 88, 177–186. [Google Scholar] [CrossRef] [Green Version]
- Piacentini, T.; Galli, A.; Marsala, V.; Miccadei, E. Analysis of Soil Erosion Induced by Heavy Rainfall: A Case Study from the NE Abruzzo Hills Area in Central Italy. Water 2018, 10, 1314. [Google Scholar] [CrossRef] [Green Version]
- Shi, P.; Zhang, Y.; Ren, Z.; Yu, Y.; Li, P.; Gong, J. Land-use changes and check dams reducing runoff and sediment yield on the Loess Plateau of China. Sci. Total Environ. 2019, 664, 984–994. [Google Scholar] [CrossRef]
- Kervroëdan, L.; Armand, R.; Rey, F.; Faucon, M.P. Trait-based sediment retention and runoff control by herbaceous vegetation in agricultural catchments: A review. Land Degrad. Dev. 2021, 32, 1077–1089. [Google Scholar] [CrossRef]
- Lopez, T.D.M.; Aide, T.M.; Scatena, F.N. The effect of land use on soil erosion in the Guadiana watershed in Puerto Rico. Caribb. J. Sci. 1998, 34, 298–307. [Google Scholar]
- Vanacker, V.; Molina, A.; Govers, G.; Poesen, J.; Dercon, G.; Deckers, S. River channel response to short-term human-induced change in landscape connectivity in Andean ecosystems. Geomorphology 2005, 72, 340–353. [Google Scholar] [CrossRef]
- Kastridis, A. Impact of Forest Roads on Hydrological Processes. Forests 2020, 11, 1201. [Google Scholar] [CrossRef]
- Zema, D.A.; Bombino, G.; Denisi, P.; Lucas-Borja, M.E.; Zimbone, S.M. Evaluating the effects of check dams on channel geometry, bed sediment size and riparian vegetation in Mediterranean mountain torrents. Sci. Total Environ. 2018, 642, 327–340. [Google Scholar] [CrossRef]
- Castillo, V.M.; Mosch, W.M.; García, C.C.; Barberá, G.G.; Cano, J.N.; López-Bermúdez, F. Effectiveness and geomorphological impacts of check dams for soil erosion control in a semiarid Mediterranean catchment: El Cárcavo (Murcia, Spain). Catena 2007, 70, 416–427. [Google Scholar] [CrossRef]
- Zema, D.A.; Carrà, B.G.; Lucas-Borja, M.E.; Filianoti, P.G.F.; Pérez-Cutillas, P.; Conesa-García, C. Modelling Water Flow and Soil Erosion in Mediterranean Headwaters (with or without Check Dams) under Land-Use and Climate Change Scenarios Using SWAT. Water 2022, 14, 2338. [Google Scholar] [CrossRef]
- Dalaris, M.; Psilovikos, A.; Sapountzis, M.; Mourtzios, P. Water erosion assessment in Skiathos Island using the Gavrilović method. Fresenius Environ. Bull. 2013, 22, 2943–2952. [Google Scholar]
- Sun, P.; Wu, Y. Dynamic Modeling Framework of Sediment Trapped by Check-Dam Networks: A Case Study of a Typical Watershed on the Chinese Loess Plateau. Engineering, 2022; in press. [Google Scholar] [CrossRef]
- Abbasi, N.A.; Xu, X.; Lucas-Borja, M.E.; Dang, W.; Liu, B. The use of check dams in watershed management projects: Examples from around the world. Sci. Total Environ. 2019, 676, 683–691. [Google Scholar] [CrossRef]
- Hassanli, A.M.; Nameghi, A.E.; Beecham, S. Evaluation of the effect of porous check dam location on fine sediment retention (a case study). Environ. Monit. Assess. 2009, 152, 319–326. [Google Scholar] [CrossRef] [PubMed]
- Díaz, V.; Mongil, J.; Navarro, J. Topographical surveying for improved assessment of sediment retention in check dams applied to a Mediterranean badlands restoration site (Central Spain). J. Soils Sediments 2014, 14, 2045–2056. [Google Scholar] [CrossRef]
- Kang, J.H.; Kazama, S. Development and application of hydrological and geomorphic diversity measures for mountain streams with check and slit-check dams. J. Hydro-Environ. Res. 2014, 8, 32–42. [Google Scholar] [CrossRef]
- Bombino, G.; Gurnell, A.M.; Tamburino, V.; Zema, D.A.; Zimbone, S.M. Sediment size variation in torrents with check dams: Effects on riparian vegetation. Ecol. Eng. 2008, 32, 166–177. [Google Scholar] [CrossRef]
- Ayele, G.K.; Gessess, A.A.; Addisie, M.B.; Tilahun, S.A.; Tebebu, T.Y.; Tenessa, D.B.; Langendoen, E.J.; Nicholson, C.F.; Steenhuis, T.S. A biophysical and economic assessment of a community-based rehabilitated gully in the Ethiopian highlands. Land Degrad. Dev. 2016, 27, 270–280. [Google Scholar] [CrossRef]
- Lucas-Borja, M.E.; Zema, D.A.; Guzman, M.D.H.; Yang, Y.; Hernández, A.C.; Xiangzhou, X.; Carrà, B.G.; Nichols, M.; Cerdá, A. Exploring the influence of vegetation cover, sediment storage capacity and channel dimensions on stone check dam conditions and effectiveness in a large regulated river in México. Ecol. Eng. 2018, 122, 39–47. [Google Scholar] [CrossRef] [Green Version]
- Wei, Y.; He, Z.; Li, Y.; Jiao, J.; Zhao, G.; Mu, X. Sediment yield deduction from check–dams deposition in the weathered sandstone watershed on the North Loess Plateau, China. Land Degrad. Dev. 2017, 28, 217–231. [Google Scholar] [CrossRef]
- Zeng, Q.L.; Yue, Z.Q.; Yang, Z.F.; Zhang, X.J. A case study of long-term field performance of check-dams in mitigation of soil erosion in Jiangjia stream, China. Environ. Geol. 2009, 58, 897–911. [Google Scholar] [CrossRef]
- Eisbacher, R.H. Slope Stability and Land Use in Mountain Valleys. Geosci. Can. 1982, 9, 14–27. Available online: https://journals.lib.unb.ca/index.php/GC/article/view/3280 (accessed on 20 September 2020).
- Food and Agriculture Organization of the United Nations. Watershed Management Field Manual-Gully Control; Conservation Guide 13/2; FAO: Rome, Italy, 1986. [Google Scholar]
- Porto, P.; Gessler, J. Ultimate Bed Slope in Calabrian Streams Upstream of Check Dams: Field Study. J. Hydraul. Eng. 1999, 125, 1231–1242. [Google Scholar] [CrossRef]
- Conesa-García, C.; López Bermúdez, F.; García-Lorenzo, R. Bed stability variations after check dam construction in torrential channels (South-East Spain). Earth Surf. Process. Landf. J. Br. Geomorphol. Res. Group 2007, 32, 2165–2184. [Google Scholar] [CrossRef]
- Desta, L.; Adugna, B. Nile Basin Initiative. A Field Guide on Gully Prevention and Control. 2012. Available online: https://www.bebuffered.com/downloads/ManualonGullyTreatment_TOTFinal_ENTRO_TBIWRDP.pdf (accessed on 20 September 2020).
- Díaz-Gutiérrez, V.; Mongil-Manso, J.; Navarro-Hevia, J.; Ramos-Díez, I. Check dams and sediment control: Final results of a case study in the upper Corneja River (Central Spain). J. Soils Sediments 2019, 19, 451–466. [Google Scholar] [CrossRef]
- Quiñonero-Rubio, J.M.; Nadeu, E.; Boix-Fayos, C.; de Vente, J. Evaluation of the effectiveness of forest restoration and check-dams to reduce catchment sediment yield. Land Degrad. Dev. 2016, 27, 1018–1031. [Google Scholar] [CrossRef]
- Boix-Fayos, C.; Barberá, G.G.; López-Bermúdez, F.; Castillo, V.M. Effects of check dams, reforestation and land-use changes on river channel morphology: Case study of the Rogativa catchment (Murcia, Spain). Geomorphology 2007, 91, 103–123. [Google Scholar] [CrossRef]
- Ebrahimzadeh, S.; Motagh, M.; Mahboub, V.; Mirdar Harijani, F. An improved RUSLE/SDR model for the evaluation of soil erosion. Environ. Earth Sci. 2018, 77, 1–17. [Google Scholar] [CrossRef]
- Hao, C.H.E.N.; Oguchi, T.; Pan, W.U. Assessment for soil loss by using a scheme of alterative sub-models based on the RUSLE in a Karst Basin of Southwest China. J. Integr. Agric. 2017, 16, 377–388. [Google Scholar] [CrossRef] [Green Version]
- Yue-Qing, X.; Xiao-Mei, S.; Xiang-Bin, K.; Jian, P.; Yun-Long, C. Adapting the RUSLE and GIS to model soil erosion risk in a mountains karst watershed, Guizhou Province, China. Environ. Monit. Assess. 2008, 141, 275–286. [Google Scholar] [CrossRef] [PubMed]
- Phinzi, K.; Ngetar, N.S. The assessment of water-borne erosion at catchment level using GIS-based RUSLE and remote sensing: A review. Int. Soil Water Conserv. Res. 2019, 7, 27–46. [Google Scholar] [CrossRef]
- Devatha, C.P.; Deshpande, V.; Renukaprasad, M.S. Estimation of soil loss using USLE model for Kulhan Watershed, Chattisgarh-A case study. Aquat. Procedia 2015, 4, 1429–1436. [Google Scholar] [CrossRef]
- Kouli, M.; Soupios, P.; Vallianatos, F. Soil erosion prediction using the revised universal soil loss equation (RUSLE) in a GIS framework, Chania, Northwestern Crete, Greece. Environ. Geol. 2009, 57, 483–497. [Google Scholar] [CrossRef]
- Jakubínský, J.; Pechanec, V.; Procházka, J.; Cudlín, P. Modelling of soil erosion and accumulation in an agricultural landscape—A comparison of selected approaches applied at the small stream basin level in the Czech Republic. Water 2019, 11, 404. [Google Scholar] [CrossRef] [Green Version]
- De Vente, J.; Poesen, J.; Verstraeten, G.; Govers, G.; Vanmaercke, M.; Van Rompaey, A.; Arabkhedri, M.; Boix-Fayos, C. Predicting soil erosion and sediment yield at regional scales: Where do we stand? Earth-Sci. Rev. 2013, 127, 16–29. [Google Scholar] [CrossRef]
- Kazamias, A.P.; Sapountzis, M. Spatial and temporal assessment of potential soil erosion over Greece. In Proceedings of the 10th World Congress of the European Water Resources Association (EWRA) on Water Resources and Environment (EWRA2017), Athens, Greece, 5–9 July 2017; European Water: Athens, Greece, 2017; pp. 315–321. [Google Scholar]
- Stefanidis, S.; Chatzichristaki, C.; Stefanidis, P. Estimation of soil erosion in mountainous watersheds with the combined use of RUSLE model and geographic information systems. Hydrotechnika 2016, 25, 1–12. [Google Scholar]
- Myronidis, D.; Ioannou, K.; Sapountzis, M.; Fotakis, D. Development of a sustainable plan to combat erosion for an island of the Mediterranean region. Fresenius Environ. Bull. 2010, 19, 1694–1702. [Google Scholar]
- Sapountzis, M.; Myronidis, D.; Stathis, D.; Stefanidis, P. Comparison of the results of the application of the USLE and Gavrilović erosion prediction methods with actual measurements in a watershed. In Proceedings of the EYE & EDYP Joint Conference “Integrated Management of Water Resources in Conditions of Climate Change”, Volos, Greece, 27–30 May 2009; pp. 155–163. [Google Scholar]
- López-Ballesteros, A.; Senent-Aparicio, J.; Martínez, C.; Pérez-Sánchez, J. Assessment of future hydrologic alteration due to climate change in the Aracthos River basin (NW Greece). Sci. Total Environ. 2020, 733, 139299. [Google Scholar] [CrossRef] [PubMed]
- Koutalakis, P.; Zaimes, G.; Ioannou, K.; Iakovoglou, V. Application of the SWAT model on torrents of the Menoikio, Greece. Fresen. Environ. Bull 2017, 26, 1210–1215. [Google Scholar]
- Psomas, A.; Panagopoulos, Y.; Konsta, D.; Mimikou, M. Designing water efficiency measures in a catchment in Greece using WEAP and SWAT models. Procedia Eng. 2016, 162, 269–276. [Google Scholar] [CrossRef] [Green Version]
- Gamvroudis, C.; Nikolaidis, N.P.; Tzoraki, O.; Papadoulakis, V.; Karalemas, N. Water and sediment transport modeling of a large temporary river basin in Greece. Sci. Total Environ. 2015, 508, 354–365. [Google Scholar] [CrossRef] [PubMed]
- Boskidis, I.; Gikas, G.D.; Pisinaras, V.; Tsihrintzis, V.A. Spatial and temporal changes of water quality, and SWAT modeling of Vosvozis river basin, North Greece. J. Environ. Sci. Health Part A 2010, 45, 1421–1440. [Google Scholar] [CrossRef]
- Van Rompaey, A.J.; Verstraeten, G.; Van Oost, K.; Govers, G.; Poesen, J. Modelling mean annual sediment yield using a distributed approach. Earth Surf. Process. Landf. 2001, 26, 1221–1236. [Google Scholar] [CrossRef]
- Van Oost, K.; Govers, G.; Desmet, P. Evaluating the effects of changes in landscape structure on soil erosion by water and tillage. Landsc. Ecol. 2000, 15, 577–589. [Google Scholar] [CrossRef]
- Verstraeten, G.; Van Oost, K.; Van Rompaey, A.; Poesen, J.; Govers, G. Evaluating an integrated approach to catchment management to reduce soil loss and sediment pollution through modelling. Soil Use Manag. 2002, 18, 386–394. [Google Scholar] [CrossRef]
- Panagos, P.; Katsoyiannis, A. Soil erosion modelling: The new challenges as the result of policy developments in Europe. Environ. Res. 2019, 172, 470–474. [Google Scholar] [CrossRef] [PubMed]
- Borrelli, P.; Van Oost, K.; Meusburger, K.; Alewell, C.; Lugato, E.; Panagos, P. A step towards a holistic assessment of soil degradation in Europe: Coupling on-site erosion with sediment transfer and carbon fluxes. Environ. Res. 2018, 161, 291–298. [Google Scholar] [CrossRef]
- Manaouch, M.; Sadiki, M.; Fenjiro, I. Integrating GIS-based FAHP and WaTEM/SEDEM for identifying potential RWH areas in semi-arid areas. Geocarto Int. 2021, 1–24. [Google Scholar] [CrossRef]
- Van Loo, M.; Dusar, B.; Verstraeten, G.; Renssen, H.; Notebaert, B.; D’Haen, K.; Bakker, J. Human induced soil erosion and the implications on crop yield in a small mountainous Mediterranean catchment (SW-Turkey). Catena 2017, 149, 491–504. [Google Scholar] [CrossRef] [Green Version]
- Prosdocimi, M.; Cerdà, A.; Tarolli, P. Soil water erosion on Mediterranean vineyards: A review. Catena 2016, 141, 1–21. [Google Scholar] [CrossRef]
- Alatorre, L.C.; Beguería, S.; García-Ruiz, J.M. Regional scale modeling of hillslope sediment delivery: A case study in the Barasona Reservoir watershed (Spain) using WATEM/SEDEM. J. Hydrol. 2010, 391, 109–123. [Google Scholar] [CrossRef] [Green Version]
- Bakker, M.M.; Govers, G.; Kosmas, C.; Vanacker, V.; Van Oost, K.; Rounsevell, M. Soil erosion as a driver of land-use change. Agric. Ecosyst. Environ. 2005, 105, 467–481. [Google Scholar] [CrossRef]
- Bakker, M.M.; Govers, G.; van Doorn, A.; Quetier, F.; Chouvardas, D.; Rounsevell, M. The response of soil erosion and sediment export to land-use change in four areas of Europe: The importance of landscape pattern. Geomorphology 2008, 98, 213–226. [Google Scholar] [CrossRef]
- Institute of Geology and Mineral Exploitation (IGME). Engineering Geological Map of Greece; Scale 1:500,000; Institute of Geology and Mineral Exploitation (IGME): Athens, Greece, 1993. [Google Scholar]
- Forest Research Institute of Thessaloniki. Installation of a System for Monitoring the Developments in the Suburban Forest of Thessaloniki (Seich Sou) and Preparation of a Study for the Selection of Forest Species in Fire-Affected Areas; Forest Research Institute of Thessaloniki: Thessaloniki, Greece, 2001. [Google Scholar]
- Verstraeten, G.; Poesen, J. Estimating trap efficiency of small reservoirs and ponds: Methods and implications for the assessment of sediment yield. Prog. Phys. Geogr. 2000, 24, 219–251. [Google Scholar] [CrossRef]
- Brown, C.B. Discussion of sedimentation in reservoirs. Proc. Am. Soc. Civ. Eng. 1944, 69, 1493–1500. [Google Scholar]
- Tan, G.; Chen, P.; Deng, J.; Xu, Q.; Tang, R.; Feng, Z.; Yi, R. Review and improvement of conventional models for reservoir sediment trapping efficiency. Heliyon 2019, 5, e02458. [Google Scholar] [CrossRef] [PubMed] [Green Version]
- Kotoulas, D. Mountainous Hydronomy; Flowing Waters; Aristotle University of Thessaloniki Greece: Thessaloniki, Greece, 2001; Volume I, p. 681. [Google Scholar]
- Renard, K.G.; Foster, G.R.; Weesies, G.A.; McCool, D.K.; Yoder, D.C. Predicting soil erosion by water: A guide to conservation planning with the Revised Universal Soil Loss Equation (RUSLE). In Agriculture Handbook; United States Government Printing: Washington, DC, USA, 1997; p. 703. [Google Scholar]
- Morgan, R.P.C. Soil Erosion and Conservation, 3rd ed.; Blackwell Publishing: Hoboken, NJ, USA, 2005; p. 304. [Google Scholar]
- Zhang, J.X.; Chang, K.T.; Wu, J.Q. Effects of DEM resolution and source on soil erosion modelling: A case study using the WEPP model. Int. J. Geogr. Inf. Sci. 2008, 22, 925–942. [Google Scholar] [CrossRef]
- Mondal, A.; Khare, D.; Kundu, S.; Mukherjee, S.; Mukhopadhyay, A.; Mondal, S. Uncertainty of soil erosion modelling using open source high resolution and aggregated DEMs. Geosci. Front. 2017, 8, 425–436. [Google Scholar] [CrossRef] [Green Version]
- Eastman, J.R. IDRISI Selva; Clark University: Worcester, MA, USA, 2012. [Google Scholar]
- Panagos, P.; Borrelli, P.; Meusburger, K.; Alewell, C.; Lugato, E.; Montanarella, L. Estimating the soil erosion cover-management factor at the European scale. Land Use Policy 2015, 48, 38–50. [Google Scholar] [CrossRef]
- Tourlakidis, C.; Pinakidis, I.; Athanasiadis, B. Special Definitive Study of Anti-Flood Projects of the Suburban Forest (SEICH SOU) of Thessaloniki; Directorate of Reforestation of Thessaloniki: Thessaloniki, Greece, 2001. [Google Scholar]
- Sapountzis, M.; Koniaris, N.; Schizas, A.; Adamidou, Μ. Analysis of the extreme rainfall events in the watersheds “Konstantinidi” and “Ano Toumpas” at the urban forest of Thessaloniki. In Proceedings of the 10th International Hydrogeological Congress of Greece, Thessaloniki, Greece, 8–10 October 2014; Volume 2, pp. 267–276. [Google Scholar]
- Fang, H. Impact of land use change and dam construction on soil erosion and sediment yield in the black soil region, northeastern China. Land Degrad. Dev. 2017, 28, 1482–1492. [Google Scholar] [CrossRef]
- Verstraeten, G.; Prosser, I.P.; Fogarty, P. Predicting the spatial patterns of hillslope sediment delivery to river channels in the Murrumbidgee catchment, Australia. J. Hydrol. 2007, 334, 440–454. [Google Scholar] [CrossRef]
- Desmet, P.J.J.; Govers, G. A GIS procedure for automatically calculating the USLE LS factor on topographically complex landscape units. J. Soil Water Conserv. 1996, 51, 427–433. [Google Scholar]
- Desmet, P.J.J.; Govers, G. Comparison of routing algorithms for digital terrain models and their implications for predicting ephemeral gullies. Int. J. Geogr. Inf. Sci. 1996, 10, 311–331. [Google Scholar] [CrossRef]
- Bezak, N.; Rusjan, S.; Petan, S.; Sodnik, J.; Mikoš, M. Estimation of soil loss by the WATEM/SEDEM model using an automatic parameter estimation procedure. Environ. Earth Sci. 2015, 74, 5245–5261. [Google Scholar] [CrossRef]
- Nash, J.; Sutcliffe, J.V. River flow forecasting through conceptual models part I—A discussion of principles. J. Hydrol. 1970, 10, 282–290. [Google Scholar] [CrossRef]
- Moriasi, D.; Arnold, J.; Van Liew, M.; Bingner, R.; Harmel, R.; Veith, T. Model evaluation guidelines for systematic quantification of accuracy in watershed simulations. Trans. ASABE 2007, 50, 885–900. [Google Scholar] [CrossRef]
- Keesstra, S.D.; Van Dam, O.; Verstraeten, G.V.; Van Huissteden, J. Changing sediment dynamics due to natural reforestation in the Dragonja catchment, SW Slovenia. Catena 2009, 78, 60–71. [Google Scholar] [CrossRef]
- Verstraeten, G.; Poesen, J.; Gillijns, K.; Govers, G. The use of riparian vegetated filter strips to reduce river sediment loads: An over-estimated control measure? Hydrol. Process. 2006, 20, 4259–4267. [Google Scholar] [CrossRef]
- Van Rompaey, A.; Bazzoffi, P.; Jones, R.J.A.; Montanarella, L. Modeling sediment yields in Italian catchments. Geomorphology 2005, 65, 157–169. [Google Scholar] [CrossRef] [Green Version]
- De Vente, J.; Poesen, J.; Verstraeten, G.; Van Rompaey, A.; Govers, G. Spatially distributed modelling of soil erosion and sediment yield at regional scales in Spain. Glob. Planet. Change 2008, 60, 393–415. [Google Scholar] [CrossRef]
- Luo, Y.; Wang, H.; Meersmans, J.; Green, S.M.; Quine, T.A.; Feng, S. Modeling soil erosion between 1985 and 2014 in three watersheds on the carbonate-rock dominated Guizhou Plateau, SW China, using WaTEM/SEDEM. Prog. Phys. Geogr. Earth Environ. 2021, 45, 53–81. [Google Scholar] [CrossRef]
- Lieskovský, J.; Kenderessy, P. Modelling the effect of vegetation cover and different tillage practices on soil erosion in vineyards: A case study in Vráble (Slovakia) using WATEM/SEDEM. Land Degrad. Dev. 2014, 25, 288–296. [Google Scholar] [CrossRef]
- Haregeweyn, N.; Poesen, J.; Verstraeten, G.; Govers, G.; de Vente, J.; Nyssen, J.; Deckers, J.; Moeyersons, J. Assessing the performance of a spatially distributed soil erosion and sediment delivery model (WATEM/SEDEM) in Northern Ethiopia. Land Degrad. Dev. 2013, 24, 188–204. [Google Scholar] [CrossRef] [Green Version]
- Van Rompaey, A.; Krasa, J.; Dostal, T. Modelling the impact of land cover changes in Czeh Republic on sediment delivery. Land Use Policy 2007, 24, 576–583. [Google Scholar] [CrossRef]
- Van Liew, M.W.; Arnold, J.G.; Garbrecht, J.D. Hydrologic simulation on agricultural watersheds: Choosing between two models. Trans. Am. Soc. Agric. Eng. 2003, 46, 1539–1551. [Google Scholar] [CrossRef]
- Singh, J.; Knapp, H.V.; Arnold, J.; Demissie, M. Hydrological modeling of the Iroquois river watershed using HSPF and SWAT 1. J. Am. Water Resour. Assoc. 2005, 41, 343–360. [Google Scholar] [CrossRef]
- Segura-Beltrán, F.; Sanchis-Ibor, C.; Morales-Hernández, M.; González-Sanchis, M.; Bussi, G.; Ortiz, E. Using post-flood surveys and geomorphologic mapping to evaluate hydrological and hydraulic models: The flash flood of the Girona River (Spain) in 2007. J. Hydrol. 2016, 541, 310–329. [Google Scholar] [CrossRef] [Green Version]
- Poesen, J. Soil erosion in the Anthropocene: Research needs. Earth Surf. Process. Landf. 2018, 43, 64–84. [Google Scholar] [CrossRef]
- Wittenberg, L. Post-fire soil erosion–the Mediterranean perception. In Pines and Their Mixed Forest Ecosystems in the Mediterranean Basin; Springer: Cham, Switzerland, 2021; pp. 481–496. [Google Scholar]
- Liu, C.; Wang, K.; Gao, L.; Sun, Y.; Yang, Q.; Cao, B.; Chen, L.; Xue, D.; Wang, J. Influence of Rainfall Intensity and Slope on Runoff and Sediment Reduction Benefits of Fine Mesh Net on Construction Spoil Deposits. Sustainability 2022, 14, 5288. [Google Scholar] [CrossRef]
- Dunkerley, D.L. Rainfall intensity bursts and the erosion of soils: An analysis highlighting the need for high temporal resolution rainfall data for research under current and future climates. Earth Surf. Dyn. 2019, 7, 345–360. [Google Scholar] [CrossRef] [Green Version]
- Almeida, W.S.D.; Seitz, S.; Oliveira, L.F.C.D.; Carvalho, D.F.D. Duration and intensity of rainfall events with the same erosivity change sediment yield and runoff rates. Int. Soil Water Conserv. Res. 2021, 9, 69–75. [Google Scholar] [CrossRef]
- Wittenberg, L.E.A.; Inbar, M. The role of fire disturbance on runoff and erosion processes–A long-term approach, Mt. Carmel case study, Israel. Geogr. Res. 2009, 47, 46–56. [Google Scholar] [CrossRef]
- Wittenberg, L.; Malkinson, D.; Barzilai, R. The differential response of surface runoff and sediment loss to wildfire events. Catena 2014, 121, 241–247. [Google Scholar] [CrossRef]
- Shakesby, R.A. Post-wildfire soil erosion in the Mediterranean: Review and future research directions. Earth-Sci. Rev. 2011, 105, 71–100. [Google Scholar] [CrossRef]
- Shakesby, R.A.; Bento, C.P.; Ferreira, C.S.; Ferreira, A.J.; Stoof, C.R.; Urbanek, E.; Walsh, R.P. Impacts of prescribed fire on soil loss and soil quality: An assessment based on an experimentally-burned catchment in Central Portugal. Catena 2015, 128, 278–293. [Google Scholar] [CrossRef]
- Miranda, E.D.; Attorre, F.; Azevedo, J.; Belen, I.; Alcalde, E.E.; Freitas, H.; Garavaglia, V.; Hódar, J.A.; Iritas, O.; Karaaslan, Y.; et al. Drivers of Degradation and Other Threats. FAO and Plan Bleu. In State of Mediterranean Forests 2018; Food and Agriculture Organization of the United Nations: Marseille, France, 2018; pp. 2–15. [Google Scholar]
- Borrelli, P.; Märker, M.; Panagos, P.; Schütt, B. Modeling soil erosion and river sediment yield for an intermountain drainage basin of the Central Apennines, Italy. Catena 2014, 114, 45–58. [Google Scholar] [CrossRef]
- Fernández, C.; Vega, J.A.; Vieira, D.C.S. Assessing soil erosion after fire and rehabilitation treatments in NW Spain: Performance of RUSLE and revised Morgan–Morgan–Finney models. Land Degrad. Dev. 2010, 21, 58–67. [Google Scholar] [CrossRef] [Green Version]
- Smith, H.G.; Sheridan, G.J.; Lane, P.N.; Nyman, P.; Haydon, S. Wildfire effects on water quality in forest catchments: A review with implications for water supply. J. Hydrol. 2011, 396, 170–192. [Google Scholar] [CrossRef]
- Mayor, A.G.; Bautista, S.; Llovet, J.; Bellot, J. Post-fire hydrological and erosional responses of a Mediterranean landscpe: Seven years of catchment-scale dynamics. Catena 2007, 71, 68–75. [Google Scholar] [CrossRef]
- Shakesby, R.A.; Doerr, S.H. Wildfire as a hydrological and geomorphological agent. Earth-Sci. Rev. 2006, 74, 269–307. [Google Scholar] [CrossRef]
- Cawson, J.G.; Hemming, V.; Ackland, A.; Anderson, W.; Bowman, D.; Bradstock, R.; Brown, T.P.; Burton, J.; Cary, G.J.; Duff, T.J.; et al. Exploring the key drivers of forest flammability in wet eucalypt forests using expert-derived conceptual models. Landsc. Ecol. 2020, 35, 1775–1798. [Google Scholar] [CrossRef]
- Cerdan, O.; Govers, G.; Le Bissonnais, Y.; Van Oost, K.; Poesen, J.; Saby, N.; Gobin, A.; Vacca, A.; Quinton, J.; Auerswald, K.; et al. Rates and spatial variations of soil erosion in Europe: A study based on erosion plot data. Geomorphology 2010, 122, 167–177. [Google Scholar] [CrossRef]
- Panagos, P.; Borrelli, P.; Poesen, J.; Ballabio, C.; Lugato, E.; Meusburger, K.; Montanarella, L.; Alewell, C. The new assessment of soil loss by water erosion in Europe. Environ. Sci. Policy 2015, 54, 438–447. [Google Scholar] [CrossRef]
- Verheijen, F.G.; Jones, R.J.; Rickson, R.J.; Smith, C.J. Tolerable versus actual soil erosion rates in Europe. Earth-Sci. Rev. 2009, 94, 23–38. [Google Scholar] [CrossRef] [Green Version]
- Yuan, S.; Li, Z.; Li, P.; Xu, G.; Gao, H.; Xiao, L.; Wang, F.; Wang, T. Influence of Check Dams on Flood and Erosion Dynamic Processes of a Small Watershed in the Loss Plateau. Water 2019, 11, 834. [Google Scholar] [CrossRef] [Green Version]
- Cerdà, A.; Doerr, S.H. Influence of vegetation recovery on soil hydrology and erodibility following fire: An 11-year investigation. Int. J. Wildland Fire 2005, 14, 423–437. [Google Scholar] [CrossRef]
- Gimeno-García, E.; Andreu, V.; Rubio, J.L. Influence of vegetation recovery on water erosion at short and medium-term after experimental fires in a Mediterranean shrubland. Catena 2007, 69, 150–160. [Google Scholar] [CrossRef] [Green Version]
- Cerdà, A.; Keesstra, S.; Pereira, P.; Matrix-Solera, J.; Giménez-Morera, A.; Úbeda, X.; Francos, M.; Alcañiz, M.; Jordán, A. Long-term changes in soil erosion due to forest fires. A rainfall simulation approach in Eastern Spain. Geophys. Res. Abstr. 2016, 18, EGU2016-17261. [Google Scholar]
- Díaz-Raviña, M.; Martín, A.; Barreiro, A.; Lombao, A.; Iglesias, L.; Díaz-Fierros, F.; Carballas, T. Mulching and seeding treatments for post-fire soil stabilisation in NW Spain: Short-term effects and effectiveness. Geoderma 2012, 191, 31–39. [Google Scholar] [CrossRef]
- Inbar, M.; Tamir, M.I.; Wittenberg, L. Runoff and erosion processes after a forest fire in Mount Carmel, a Mediterranean area. Geomorphology 1998, 24, 17–33. [Google Scholar] [CrossRef]
- Bussi, G.; Rodríguez-Lloveras, X.; Francés, F.; Benito, G.; Sánchez-Moya, Y.; Sopeña, A. Sediment yield model implementation based on check dam infill stratigraphy in a semiarid Mediterranean catchment. Hydrol. Earth Syst. Sci. 2013, 17, 3339–3354. [Google Scholar] [CrossRef] [Green Version]
- Vaezi, A.R.; Abbasi, M.; Keesstra, S.; Cerdà, A. Assessment of soil particle erodibility and sediment trapping using check dams in small semi-arid catchments. Catena 2017, 157, 227–240. [Google Scholar] [CrossRef] [Green Version]
- González-Romero, J.; Lucas-Borja, M.E.; Plaza-Álvarez, P.A.; Sagra, J.; Moya, D.; De Las Heras, J. Short-term effects of postfire check-dam construction on ephemeral stream vegetation in a semiarid climate of SE Spain. Sci. Total Environ. 2019, 671, 776–785. [Google Scholar] [CrossRef]
- Martínez-Murillo, J.F.; López-Vicente, M. Effect of salvage logging and check dams on simulated hydrological connectivity in a burned area. Land Degrad. Dev. 2018, 29, 701–712. [Google Scholar] [CrossRef] [Green Version]


| Catchment Characteristics | |||
|---|---|---|---|
| Unit | Konstadinidi | Ano Toumba | |
| Area | km2 | 2.89 | 2.18 |
| Mean altitude | m | 310 | 315 |
| Max altitude | m | 423 | 465 |
| Min altitude | m | 116 | 107 |
| Mean slope | % | 26.02 | 27.66 |
| Average stream slope | % | 8.85 | 10.5 |
| Main stream length | km | 3.7 | 2.97 |
| Land Cover | C Factor |
|---|---|
| Burnt area | 0.3 |
| Forest | 0.0014 |
| Pasture | 0.0522 |
| Transitional woodland & shrub | 0.0260 |
| Mechanical Composition % | Organic Matter % | Structure | Water Permeability | Area km2 | Κ (Tons h MJ−1 mm−1) | ||
|---|---|---|---|---|---|---|---|
| Sand | Silt | Clay | |||||
| 60 | 15 | 25 | 3 | Medium | Medium | 0.135 | 0.012 |
| 50 | 35 | 15 | 3 | Fine | Low | 0.078 | 0.030 |
| 60 | 15 | 25 | 3 | Medium | Low | 0.012 | 0.018 |
| 70 | 20 | 10 | 3 | Medium | Low | 0.031 | 0.021 |
| 50 | 35 | 15 | 3 | Fine | Medium | 0.25 | 0.027 |
| 60 | 15 | 25 | 3 | Medium | High | 0.079 | 0.008 |
| 70 | 20 | 10 | 3 | Medium | Medium | 4.507 | 0.015 |
| Check-Dam | Catchment | Height (m) | Sediment Bulk Density (g cm3) | Drainage Area (ha) | Original Storage Capacity (m3) | Trap Efficiency (%) | Retained Sediments (m3) |
|---|---|---|---|---|---|---|---|
| 1 | Konstantinidi | 2.5 | 1.8 | 44.06 | 527.84 | 20.12 | 0.80 |
| 2 | Konstantinidi | 2.5 | 1.8 | 53.07 | 581.08 | 18.71 | 0.39 |
| 3 | Konstantinidi | 2.5 | 1.8 | 78.35 | 406.42 | 17.82 | 3.98 |
| 4 | Konstantinidi | 4.5 | 1.8 | 99.06 | 954.64 | 16.82 | 24.08 |
| 5 | Konstantinidi | 1.5 | 1.8 | 13.10 | 51.66 | 7.70 | 26.46 |
| 6 | Konstantinidi | 1.5 | 1.8 | 15.21 | 217.5 | 23.34 | 1.85 |
| 7 | Konstantinidi | 2 | 1.8 | 24.07 | 280.8 | 19.72 | 46.32 |
| 8 | Ano Toumba | 2.5 | 1.8 | 64.08 | 351.42 | 10.40 | 31.32 |
| 9 | Konstantinidi | 1.7 | 1.8 | 18.98 | 118.54 | 11.58 | 1.66 |
| 10 | Konstantinidi | 1.5 | 1.8 | 32.03 | 70.06 | 4.40 | 3.98 |
| 11 | Konstantinidi | 1.7 | 1.8 | 40.27 | 70.58 | 3.57 | 25.99 |
| 12 | Konstantinidi | 2.1 | 1.8 | 72.36 | 187.49 | 5.19 | 26.91 |
| 13 | Ano Toumba | 4 | 1.8 | 44.02 | 885.63 | 14.33 | 3.21 |
| 14 | Ano Toumba | 4 | 1.8 | 112.09 | 1592.35 | 20.48 | 28.33 |
| 15 | Ano Toumba | 4 | 1.8 | 141.10 | 417.36 | 5.83 | 27.93 |
| 16 | Konstantinidi | 5.5 | 1.8 | 284.07 | 3915.97 | 22.45 | 65.02 |
| 17 | Ano Toumba | 3 | 1.8 | 188.53 | 515.02 | 5.80 | 58.41 |
| 18 | Ano Toumba | 4.5 | 1.8 | 202.01 | 1349.7 | 11.19 | 0.2 |
| Model Results Per ktc Values High/Low | ||||
|---|---|---|---|---|
| Check-Dam | Observed Values | ktc 4/1.2 | ktc 5/2.5 | ktc 5/1.6 |
| 1 | 1.44 | 6 | 12 | 12 |
| 2 | 0.702 | 0 | 24 | 24 |
| 3 | 7.164 | 39 | 31 | 39 |
| 4 | 43.344 | 21 | 33 | 33 |
| 5 | 47.628 | 46 | 0 | 0 |
| 6 | 3.33 | 11 | 10 | 10 |
| 7 | 83.376 | 39 | 54 | 45 |
| 8 | 56.376 | 39 | 60 | 60 |
| 9 | 2.988 | 9 | 42 | 33 |
| 10 | 7.164 | 16 | 33 | 27 |
| 11 | 46.782 | 46 | 48 | 54 |
| 12 | 48.438 | 12 | 21 | 12 |
| 13 | 5.778 | 9 | 45 | 33 |
| 14 | 50.994 | 50 | 162 | 129 |
| 15 | 50.274 | 30 | 51 | 51 |
| 16 | 117.036 | 99 | 156 | 132 |
| 17 | 105.138 | 100 | 72 | 51 |
| 18 | 0.36 | 18 | 21 | 21 |
| NSE | 0.725 | −0.047 | 0.198 | |
| RSR | 0.509 | 0.994 | 0.896 | |
Publisher’s Note: MDPI stays neutral with regard to jurisdictional claims in published maps and institutional affiliations. |
© 2022 by the authors. Licensee MDPI, Basel, Switzerland. This article is an open access article distributed under the terms and conditions of the Creative Commons Attribution (CC BY) license (https://creativecommons.org/licenses/by/4.0/).
Share and Cite
Margiorou, S.; Kastridis, A.; Sapountzis, M. Pre/Post-Fire Soil Erosion and Evaluation of Check-Dams Effectiveness in Mediterranean Suburban Catchments Based on Field Measurements and Modeling. Land 2022, 11, 1705. https://doi.org/10.3390/land11101705
Margiorou S, Kastridis A, Sapountzis M. Pre/Post-Fire Soil Erosion and Evaluation of Check-Dams Effectiveness in Mediterranean Suburban Catchments Based on Field Measurements and Modeling. Land. 2022; 11(10):1705. https://doi.org/10.3390/land11101705
Chicago/Turabian StyleMargiorou, Stella, Aristeidis Kastridis, and Marios Sapountzis. 2022. "Pre/Post-Fire Soil Erosion and Evaluation of Check-Dams Effectiveness in Mediterranean Suburban Catchments Based on Field Measurements and Modeling" Land 11, no. 10: 1705. https://doi.org/10.3390/land11101705