Article

The Location and Built Environment of Cultural and Creative Industry in Hangzhou, China: A Spatial Entropy Weight Overlay Method Based on Multi-Source Data

1
School of Business Administration, East China Normal University, Shanghai 200062, China
2
Department of Geography and Spatial Information Techniques, Ningbo University, Ningbo 315211, China
3
Department of International Hotel Management at Qiandaohu, Tourism College of Zhejiang China, Hangzhou 311231, China
4
School of Teacher Education, Ningbo University, Ningbo 315211, China
*
Author to whom correspondence should be addressed.
Land 2022, 11(10), 1695; https://doi.org/10.3390/land11101695
Submission received: 30 August 2022 / Revised: 24 September 2022 / Accepted: 27 September 2022 / Published: 30 September 2022
(This article belongs to the Special Issue Territory Spatial Planning toward High-Quality Development in China)

Abstract

:
Quantitative identification of the location of cultural and creative industries has always been an important issue in the study of micro-locations in human geography. However, most of the previous studies on the location of cultural and creative industries focused on the macro description of the existing cultural and creative industry and lacked quantitative identification of micro-locations suitable for cultivating and developing cultural and creative industries. Therefore, based on the relevant location theory of cultural and creative industries, the urban creative field strength and its quantitative model are proposed. From the perspective of the built environment, 500 m × 500 m grids were established as analysis units based on multi-source data, including society, economy and geography data, using the geographic information system (GIS) analysis technology and spatial entropy weight overlay method to describe and visualize the micro-locations of urban cultural and creative industries. Based on the empirical study in Hangzhou, the following can be concluded: (1) the study method of “single index measurement–entropy method weighting–space weighted summation–hot spot analysis” constructed can quantitatively identify the micro-location of urban cultural and creative industries. It proves that the research framework proposed is scientifically valid. (2) The overall field strength of the creative field in Hangzhou has a circular structure with multiple centers, gradually decreasing outward from the main urban area of Hangzhou, with the sub-centers of the creative field scattered around the core urban area. The most suitable location for the cultivation and development of cultural and creative industries in Hangzhou is located in Wensan District as the core area, which includes Wensan Road, Xueyuan Road, Wulin Square, Hangzhou Future City-Xixi Wetland, etc. (3) The location around the provincial/city/district government land is the core area of creative field strength, which is more suitable for the development of cultural and creative industries. The farther from the core area, the smaller the creative field strength is, and the more obvious the attenuation of distance is.

1. Introduction

Since the 1990s, cultural and creative industries have emerged and flourished in developed countries, such as the United Kingdom and the United States, and their advantages, such as high added value and strong competitiveness, have gradually attracted the attention of many countries and regions around the world [1]. Some major cities in China have just stepped into the post-industrialization stage, and cultural and creative industries have become the engines of cities’ industrial transformation and new economic growth. The cultural and creative industries in Beijing, Shanghai, Guangzhou, Shenzhen, Hangzhou, Chengdu, Xi’an and other cities have gained global attention under the dual catalysis of government policies and profound heritage [2]. Currently, there is no unified definition of cultural and creative industries in China. With reference to the academic definition of cultural and creative industries [3,4,5], Hangzhou defines eight key industries of cultural and creative industries, including the information service industry, animation and game industry, design service industry, modern media industry, art industry, education and training industry, cultural leisure tourism industry, cultural exhibition industry, etc. Compared with Western countries, the definition of Hangzhou is more inclusive, which is also the classification standard of cultural and creative industries recognized in this paper. According to statistics, as early as 2016, the added value of Hangzhou’s cultural and creative industries was CNY 254.168 billion, accounting for 23.0% of the city’s GDP [6]. However, while the cultural and creative industries are developing rapidly, some creative enterprises and creative industry parks have insufficient development time due to the problem of site selection in the initial stage. Meanwhile, new creative enterprises entering the market face the challenge of site selection. Therefore, the location, location factors and location adjustment of cultural and creative industries have become important and difficult issues for Chinese academia and city governments [2,7].
The location theory study of cultural and creative industries originated in Western countries. Florida [8,9] first proposed the creative class theory and the “3T” hypothesis (Talent, Technology, Tolerance) and believed that a tolerant, open and diverse area can attract “continuous” creative class and attract high-tech technology industry agglomeration and ultimately promote the development of regional creative industries. However, the creative class theory is still subject to many doubts, and the criticism is mainly concentrated on two aspects: first, the creative class theory is very weak in model construction and economic analysis; second, its theoretical origin is not new, and it is based on endogenous growth theory [10,11]. Subsequently, Glaeser [10] put forward the “3S” theory based on the “3T” hypothesis, namely sunshine, skill and urban sprawl, emphasizing the influence of the regional environment on the cultural and creative industries; Scott [11] studied the relationship network between companies, individuals and specialized sectors in the creative field from the urban and regional scales and proposed creative field theory. He emphasized the importance of institutional atmospheres, such as innovation scenarios, learning regions and regional innovation systems, to the agglomeration of innovative elements. These theories laid the foundation for empirical analysis of the location of cultural and creative industries. Since then, a large number of scholars have analyzed the location factors of cultural and creative industries in Western developed countries from different perspectives, such as professional labor market [12], infrastructure [13], communication infrastructure and convenience [14], favorable institutional environment [15], open social background [16] and local characteristics [17,18].
It is worth noting that some scholars have tried to construct a cultural and creative industry location model in developing countries [19] or non-metropolitan areas [20,21] and further improve the location model of cultural and creative industry in different location and scale contexts. In particular, Fahmi [19] took Indonesia as a sample and found that human capital, economic conditions, formal and informal network building capabilities and infrastructure are the main factors affecting the location of cultural and creative industries in developing countries, and emerging creative industries are not restricted by the local market and require different policy support for traditional cultural industries. This study has important implications for related study in China. However, most studies on the location of cultural and creative industries in China rely on the “diamond model” to explore the influencing factors and agglomeration characteristics of cultural and creative industries [22]. It is believed that the concentration of creative talent, population density and invention patents all play an important role in the location selection of cultural and creative industries. Many scholars believe that the agglomeration of cultural and creative industries in the province is easily affected by factors such as infrastructure, governance (institution), market and soft factors (environment and tolerance) [23]. In addition, the locality and rootedness of the cultural and creative industries are strong. In other words, non-trade connections, cultural traditions and social environment also have important influences [24]. This requires that the location analysis of cultural and creative industries should not only start from the macro-location but should pay attention to the micro-location interpretation from the perspective of structuralism and humanism [25].
Through a comprehensive analysis of the existing study, we found that the previous creative industry location theories were a complete narrative of the location factors affecting the development of the creative industry from a macro perspective [26]. However, no actionable quantitative scheme is provided that can link the theoretical analysis with a micro-empirical test. In addition, the previous literature is still limited to study the distribution and location influencing factors of cultural and creative industries at the scales of large regions [27,28], cities [29] or districts [30,31] and cannot guide the location selection of cultural and creative enterprises at the micro level. Therefore, it is necessary for us to propose an identification model and quantification scheme for the micro-location of cultural and creative industries so as to clearly show on a map which locations are suitable for the distribution and sustainable development of cultural and creative industries.
In this paper, we first construct a micro-location identification model based on the macro-theoretical achievements of creative location and the built environment. Second, using geographic information system (GIS) analysis technology and spatial entropy weight overlay methodology, according to the study path of “single index measurement–entropy method weighting–spatial weighted summation–hot spot analysis”, quantitative analysis and visualization of cultural and creative industries micro-location, we aim to (1) scientifically design a study framework (methodology) to quantitatively measure the creative field strength of the cultural and creative industries and provide suitable tools for the micro-site selection of the cultural and creative industries, and (2) take the nine districts of Hangzhou as an example to effectively evaluate the spatial pattern and hotspot characteristics of micro-locations of cultural and creative industries in metropolitan areas. The study is divided into five parts. After the introduction, Section 2 provides a theoretical analysis and modeling framework for the location of the cultural and creative industries. Section 3 presents the study area and data sources. Section 4 analyzes the results from empirical applications. Section 5 and Section 6 outline the discussion and conclusions, respectively.

2. Methodology

2.1. The Micro-Location Identification Logic and Evaluation System

Research on micro-locations of cultural and creative industries should focus on the ability of micro-level spatial units to attract and nurture cultural and creative industries, which is the sum of creative location factors that influence cultural and creative industries. Following the concepts of gravitational field and magnetic field in physics, the concept of “creative field” is introduced to assess the ability of a region to attract or cultivate creative industries; i.e., each point in space has a corresponding creative field strength. The stronger the field strength, the more conducive the layout is to cultural and creative industries. How to evaluate the space creative field and identify the micro-location of the creative industry? The key is to comprehensively analyze and evaluate the location influencing factors and space requirements of creative class and creative clusters. The principal theory describing industrial location was proposed by Weber. Weber’s analytical model focuses on three main location factors: transportation, labor and raw materials [32]. Based on this, there are at least four different basic theories that explain the key principles of industrial location, including the maximum income location principle [33], the maximum profit location principle [34], behavioral approaches and location [35], structural approaches and location [36]. With the in-depth development of location theory research, we discovered that resources factor (land, raw materials), capital factor, market factor, institution factor, technology factor and other factors (such as the individual behavior factor, level of economic development and economic structure) gradually enter the industrial location analysis framework [37]. As an emerging industry, the location selection mechanism of cultural and creative industry is significantly affected by factors such as regional development level and local characteristics, and the location factor tends to “soften” [2]. Western scholars tried to put forward hypotheses such as “3T”, creative field, creative class, creative city, etc., to analyze and describe the agglomeration and location characteristics of cultural and creative industries and found that creative talents, technology, tolerance, external production network, policy and urban convenience infrastructure, etc., are the significant location elements.
The cultural and creative industries and the creative class mostly rely on the physical space carrier to gather together. The built urban environment is the space that supports the creative industries, and it is also the physical expression of the macro-abstract location factor. The urban built environment mainly refers to the various buildings and places produced by man-made construction and renovation within city limits [38]. Relevant studies have shown that the urban built environment can affect the daily activities of actors, and the social interaction activities of people in the city and the process of interweaving with the built environment will shape regional vitality and innovation [39,40,41]. As a dominant space carrier, the urban built environment includes not only the materiality and spatiality emphasized by the built environment but also social and cultural dimensions [42,43,44]. It is very suitable for the common identification of “hard factor” and “soft factor” of creative industry location. Therefore, micro-observation of the built environment of cultural and creative industries is a favorable perspective to realize the evaluation of creative fields. The built environment of cultural and creative industries is the location that carries creative industry activities, which can meet the needs of knowledge exchange, spillover and acquisition among creative industries [45,46]. At the same time, it provides a space for creative work, living and social activities for the creative class [47]. According to the creative industry theory and “locality” theory [29], and combined with the actual situation of the case, this paper holds that the macro-location factors that are conducive to the formation and development of the cultural and creative industry are mainly urban cultural atmosphere, talent and technological innovation resources, social infrastructure, policy elements, etc. [23]. Through the interaction of macro-location factors, urban space forms creative field, creative class and creative clusters gather in this space under the effect of the creative field and also respond to the creative field. The abstract creative field is expressed at the micro level by the urban environment; that is, it is assigned to the corresponding elements of the urban environment, such as the land use environment, the cultural environment, the arts environment, the scientific research and innovation environment, etc. [48] (Figure 1).
According to the scientificity and measurability of the data, the elements of the built environment are specified and the indicators are selected to identify the micro-location of cultural and creative industries (Table 1). (1) Cultural atmosphere in the city: it reflects the diversity, heterogeneity and tolerance of the city and is an important factor in attracting the creative class. The degree of land use mixture can be used to measure the diversity and vitality of a certain area [49]; the local cultural atmosphere and historical layers are the genes that produce the cultural and creative industries. Cultural protection facilities (cultural heritage), museums, art galleries, theaters and other built environment facilities provide creative talent with informal communication venues that can be used to measure the historical and cultural atmosphere of the city [50,51]. (2) Talents and scientific and technological innovation resources: scientific research institutions gather a large number of highly qualified talents to provide scientific and technological innovation, and talents from social higher education are the main force for promoting innovation [52,53]. The spatial distribution of scientific research institutions and college talents is used as a proxy index. The spatial distribution of scientific research institutes and higher education talents is used as the proxy index. (3) Social infrastructure: the creative class tend to congregate in areas with distinctive leisure and entertainment facilities. First, recreational facilities, such as cafes, bars, clubs and studios, are conducive to the exchange and dissemination of tacit knowledge [54]. Second, the accessibility of resources, such as transportation, education and medical care, is also a factor that influences the creative class. The location of educational resources and medical resources that can provide good educational and medical service facilities for the creative class and their family members is favored by practitioners in the cultural and creative industries, so the distribution of hospitals and schools is another important factor in social infrastructure. Of course, transportation service facilities are the core carrier of business travel for creative class people, including not only urban external transportation (accessibility of airports and high-speed railway stations) but also urban internal transportation (accessibility of subways and bus stops) [55]. (4) Political factor: the influence of institutional elements on innovation is mainly reflected in the government’s talent policy for the creative class and various preferential policies, such as tax breaks for industrial parks. The supportive policies of cultural and creative industries vary from region to region, and this regional difference affects the location selection of cultural and creative enterprises. The first is the creative industry parks promulgated and recognized by the government. Most cultural and creative parks rely on old factories, old buildings, etc., to be restored and transformed. Such industrial parks generally have relatively complete infrastructure, low rent, preferential taxation and talent introduction incentives, etc.; second, there are policies such as income tax preferential policies for certain types of creative enterprises, while the spatial differences of preferential policies within the same city can be ignored [56].

2.2. Technical Route

Based on the clarification of the research context and the considerations of the location of cultural and creative industries, first, a micro-location model of cultural and creative industries and its identification logic was created. Second, data were collected in accordance with the index system and a 500 m × 500 m vector grid was constructed. Then, the Hill number diversity index, buffer analysis, allocation overlay analysis and cost-weighted distance algorithm were used to measure each built environment factor of four location indicators, and, moreover, the single built environment factor was standardized and the entropy weight method was used to determine the weights. Finally, each index was superimposed to obtain the urban creative field strength, and the area with high creative field strength is the micro-location suitable for the layout of cultural and creative industries (Figure 2). It is noteworthy that the evaluation of the creative area in this paper is based on the model operation using 500 m × 500 m vector grid.

2.3. Quantitative Evaluation Method for Micro-Location of Cultural and Creative Industries

2.3.1. Single Index Measurement Method

(1) Hill numbers diversity index. Urban diversification is reflected in the degree of urban land use mixing. The higher the degree of land use mixing, the greater the social and economic benefits of the neighborhood, which promotes the vitality of the neighborhood or city and enables the innovative development of the city or neighborhood. The fine-grained data from POI can be used to reclassify the data from POI according to the urban land use classification criteria and obtain land use information represented by the number of POI [57]. The use of the Hill Numbers Biodiversity Index to measure the degree of urban land use mixing can be used to apply the Entropy Index to study the relationship between land use and the transportation choices of urban residents [58] and the Hill Number Diversity Index derived from it. Jost’s [59] experiments show that data from POI can accurately reflect land use status and quantify the richness of POI at a fine-grained level, using formulas such as:
Diversity = ( i = 1 n S i q ) 1 / 1 q
where Diversity represents diversity, n is the number of POI species, S i is the frequency of occurrence of the i-th POI, q is an order and the value of q reflects the sensitivity of the diversity index to common and rare species. Based on the different values of q, Hill numbers diversity index can reflect the land use mixture from the richness, disorder and degree of aggregation of land use types. When q > 0, the richness is most relevant to the activity of the neighborhood. Therefore, the richness of the POI species is used for correlation calculation and the degree of land use mixture is measured [60]. When q = 0, the diversity index is for all species. It reflects the number of different types of land use or POI in a particular area, and the formula is:
Diversity = i n S i 0
(2) Cost-weighted removal algorithm. The ArcGIS10.2 software uses a spatial analysis function whose shortest path is used to calculate the shortest weighted distance from each raster to a target raster based on the raster data, which is called the “cost-weighted distance algorithm”. The purpose of this method is to abstract the raster data into the structure of the graph and calculate it first to obtain the cost raster graph and divide the study area into a raster image with a certain accuracy of orthogonal rasters. The attribute value of each raster represents its cost. The article shows the degree of time consumption [61].
(3) Buffer analysis and allocation overlay, that is, using the buffer tool of ArcGIS10.2 software to draw the buffer and allocate the buffer value according to the distance to the site factor, mainly measuring the ability of the site factor to affect the radiation of the environment. The overlay assignment is the first assignment of the factors affecting the site factor, and then using the ArcGIS10.2 software for the overlay analysis.
In addition, due to the hierarchical nature of built environment elements, such as cultural conservation units, museums, scientific research institutions, schools and hospitals, we assign different weights and then add them together for calculation. The evaluation criteria for each single index are given below (Table 2).

2.3.2. Standardization and Weight Determination of Each Indicator

The dimension of each index in the micro-location index system of cultural and creative industries is not uniform, and indicators need to be standardized to eliminate the influence of the dimension. The original data can be processed by using the range standardization method. Equations are as follows:
X i j = X i j m i n X i j / m a x X i j m i n X i j
e j = k i = 1 m ( Y i j l n X i j )
Y i j = X i j / i = 1 m X i j ;   k = 1 / l n m
w j = 1 e j / j = 1 n 1 e j
The m a x X i j and m i n X i j are the maximum and minimum values of the index, m is the number of evaluations and n is the index number [62].

2.3.3. Comprehensive Evaluation of Creative Field Strength

Field strength is one of the concepts of physics. In this paper, the creative field strength is used to describe the strength of the ability to generate and promote cultural and creative industrial clusters in different urban locations; that is, the greater the creative field strength, the more suitable for the layout of cultural and creative industries. According to the corresponding measurement method, the individual indicators produce a 500 m × 500 m grid layer with calculation results. After standardizing the data and using the entropy weighting method to determine the weights, the raster calculator of ArcGIS 10.2 software was used to overlay the indicators and calculate creative field strength of the city based on the raster scale. The comprehensive calculation formula for the creative field strength is as follows:
S i = b 1 x i 1 + b 2 x i 2 + + b j x i j
Among them,   S i is the integrated value of each geographical unit (500 m × 500 m grid); the score of the j-th measure index in the i-th geographical unit; the weight of the j-th indicator; the larger the S i value, the higher the score of the geographical unit, and, the greater the creative field strength, the more favorable it is for the layout of cultural and creative industries [63]

2.3.4. Local Hot and Cold Analysis of Location Value of Urban Cultural and Creative Industries

The localized Getis-Ord G-index method can measure the regional agglomeration of high and low values, and this method can be used to measure the distribution of hot and cold regions of creative field strength [64] and analyzes whether the areas with high creative field strength have agglomeration and distribution trends. The method of calculating the local spatial autocorrelation G-index of t creative field strength is presented as follows:
G * d = i = 1 n w i j d x i j = 1 n x i
Z G i * = G i * E G i * V a r G i *
In the formula: respectively, the value of elements is i; j is the average of the elements and represents the spatial weight; n is the total amount of the element if the Z G i * value is positive and is very significant, indicating that the values around the spatial unit i are relatively large (above average); high-value space agglomeration, on the contrary, indicates that spatial unit i is a low-value space agglomeration.

3. Study Area and Data Sources

3.1. Study Area

Hangzhou, located on the southeast coast, is the central city in the Yangtze River Delta metropolitan area and an important international e-commerce center. Hangzhou has taken a leading position in entering the post-industrial era, led by high-tech industries and supported by modern service industries. The unique regional environment and the status of urban development have laid a solid foundation for the development of Hangzhou’s cultural and creative industries. Hangzhou has successively won the UNESCO Global Creative Cities Network “City of Crafts and Folk Art”, the first set of national-level cultural and technological integration demonstration centers, national digital publishing industry centers and the headquarters of China (Zhejiang) Film and Television Industry International Cooperation Experimental Zone and so on. It has received a series of honorary titles. The research area covers nine urban districts of Hangzhou based on the end of 2016, such as Shangcheng, Xiacheng, Jianggan, Gongshu, Xihu, Binjiang, Xiaoshan, Yuhang and Fuyang (Figure 3).

3.2. Data Sources

Factor data specific to the urban built environment include city data POI, such as art museums, art galleries, theatres, cultural security facilities, museums, university research facilities, cafes, bars, restaurants, elementary and secondary schools, first-third grade hospitals, high-speed rail stations, subway stations, industry, data on the location of parks and other location attributes and other sources of innovative talent data and liquidity. City data POI comes from digital map data, the number of innovative talents can be derived from census data and the transportation road network, public facilities and industrial parks come from various planning atlases.

4. Results

4.1. Single Index Evaluation and Its Spatial Characteristics

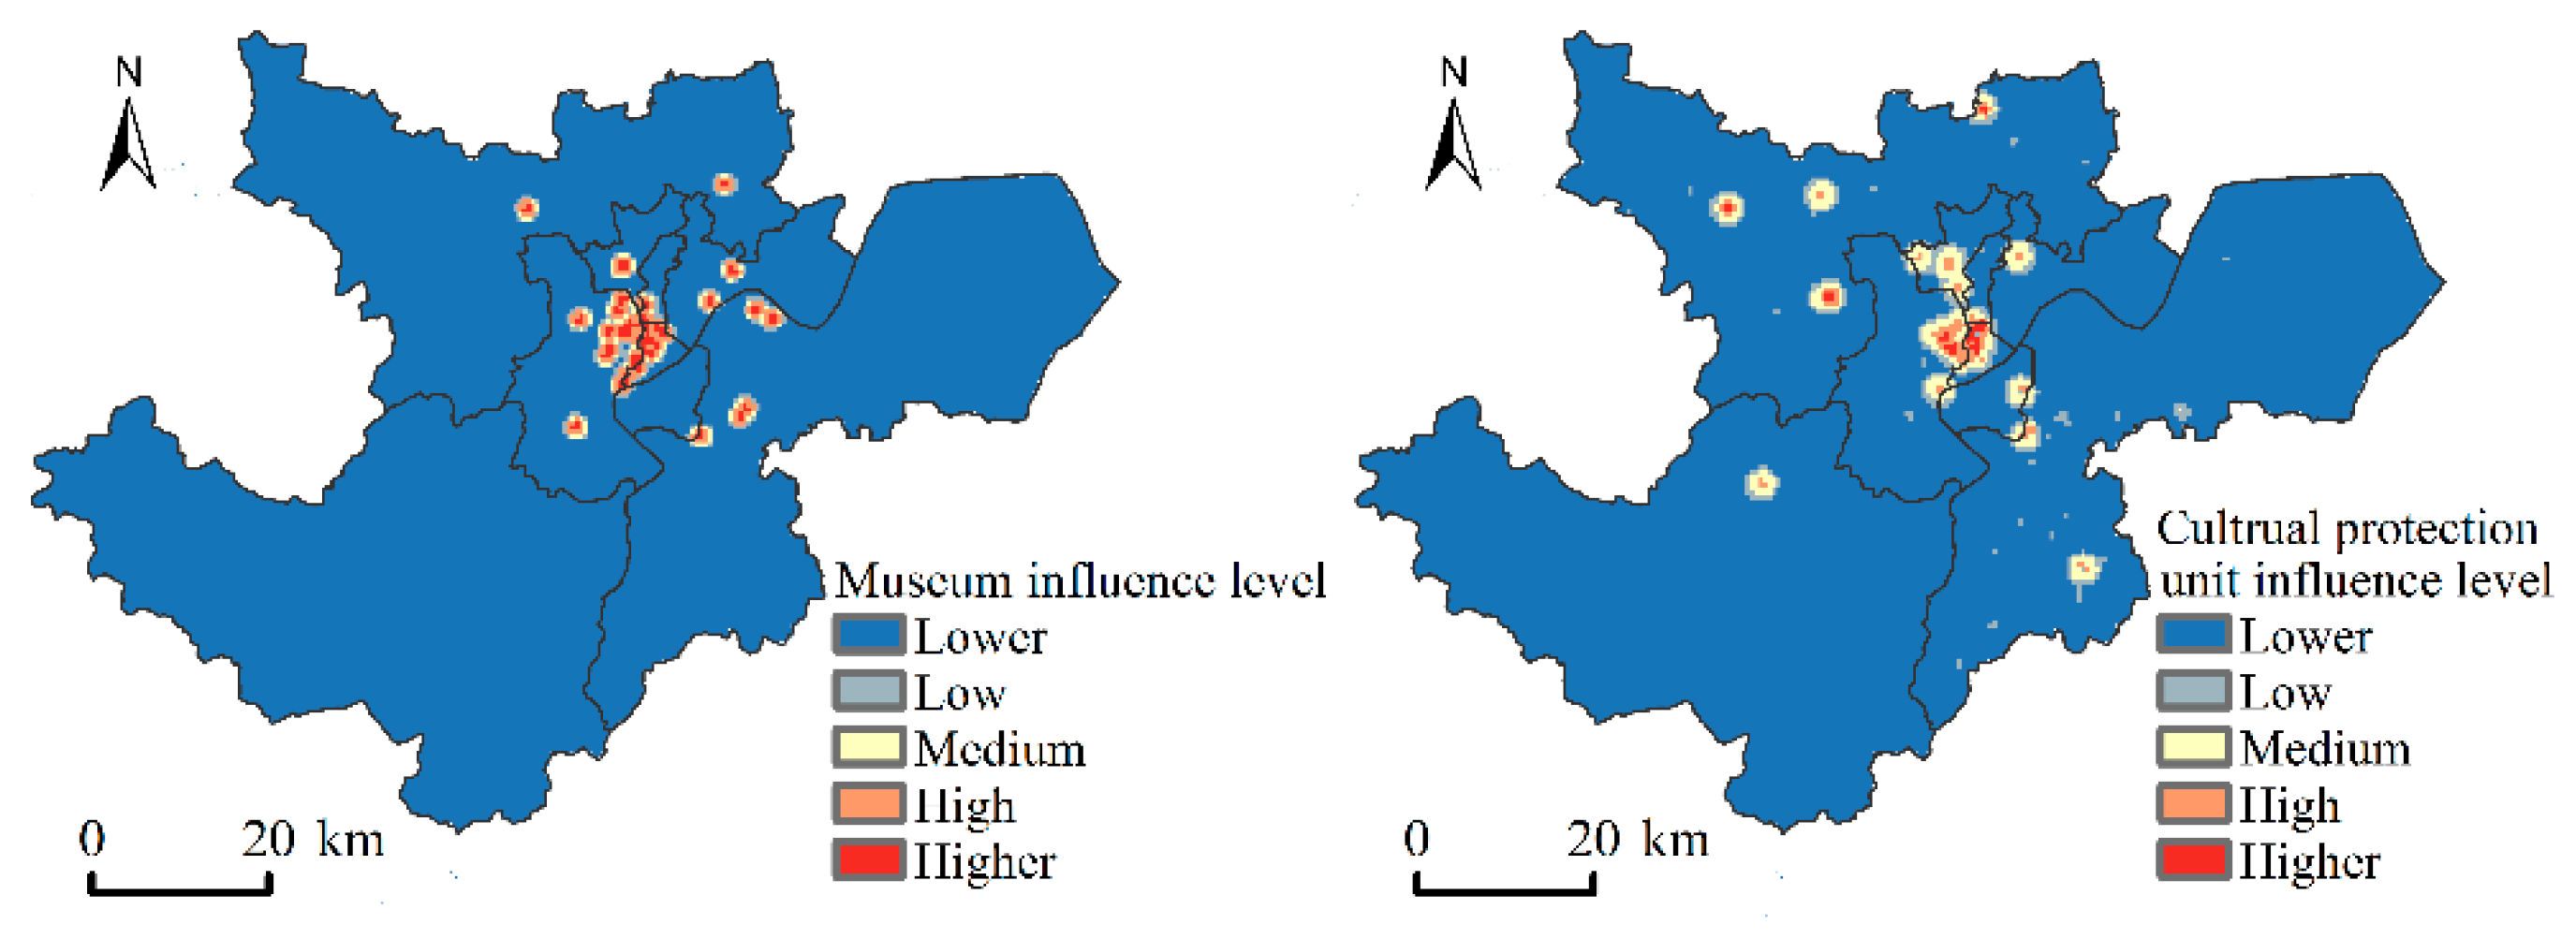
4.1.1. Urban Cultural Atmosphere

(1) Activity in the district. Since the degree of land use mix in urban areas is a measure of urban diversification and neighborhood vitality, there are 13 types of POI classification standards with a total of 136,158, including 18,971 food services, 51,982 shopping services, 14,544 living services, 1396 tourism services, 1423 firms, 5.125 financial services, 5440 educational and cultural services, 4497 motor vehicle services, 5214 health care services, 13,668 sports and recreation services, 4329 accommodation services, 6519 transportation facilities and 3050 government services. Due to the overlap of the company’s business activity with other categories of POI, office buildings are considered as a proxy for the company’s business activity.
The point data of POI are imported into ArcGIS 10.2 software and vectorized according to the classification, and the degree of land use mixing is calculated by calculating in a 500 m × 500 m grid; that is, the value of POI richness ranges from 0 to 13, and, the higher the value, the more land is used. The higher the degree of mixing, the better the economic power, which is then classified into five categories using a natural breakpoint method (see Table 2). The five categories of Lower, Low, Medium, High and Higher are assigned scores of 1, 3, 5, 7 and 9 from low to high, respectively. In general, the degree of land use mixing in Hangzhou has clear spatial differentiation characteristics (Figure 4): The areas with a high degree of land use mixture are mainly located in the core area of Hangzhou, and the seats of district governments have the highest degree of land use mixture, showing a gradual decrease from the center to the periphery.
(2) The built environment of art. The built environment of art refers to the places that allow people to appreciate and exchange art. The most representative ones are art galleries, art halls and theaters. The 148 art galleries and theaters with a certain influence in Hangzhou were vectorized in ArcGIS 10.2 software, and their influence area was assigned according to the law of decreasing distance. The farther the value is from the target of art completion, the lower the value is. The areas with relatively strong artistic atmosphere in Hangzhou are mainly located in the core area of Hangzhou (Figure 5).
(3) Cultural built environment. The measurement indicators are old cultural relics and old buildings with historical, artistic and scientific value in various museums and cultural protection institutions in Hangzhou. There are 54 museums in Hangzhou, including 38 state museums and 16 non-state museums. Cultural relic protection institutions are divided into three categories: national level, provincial level and municipal level. The extent and intensity of the influence of the various museums and relic protection institutions vary. Accordingly, weights are established to divide the affected areas. The results show that the area with strong cultural atmosphere in Hangzhou is concentrated in the Provincial Cultural Relics Bureau and gradually spreads to Wulin Square, Nanshan Road and Fengqi Road (Figure 6).

4.1.2. Talent and Technology Innovation Resources

(1)
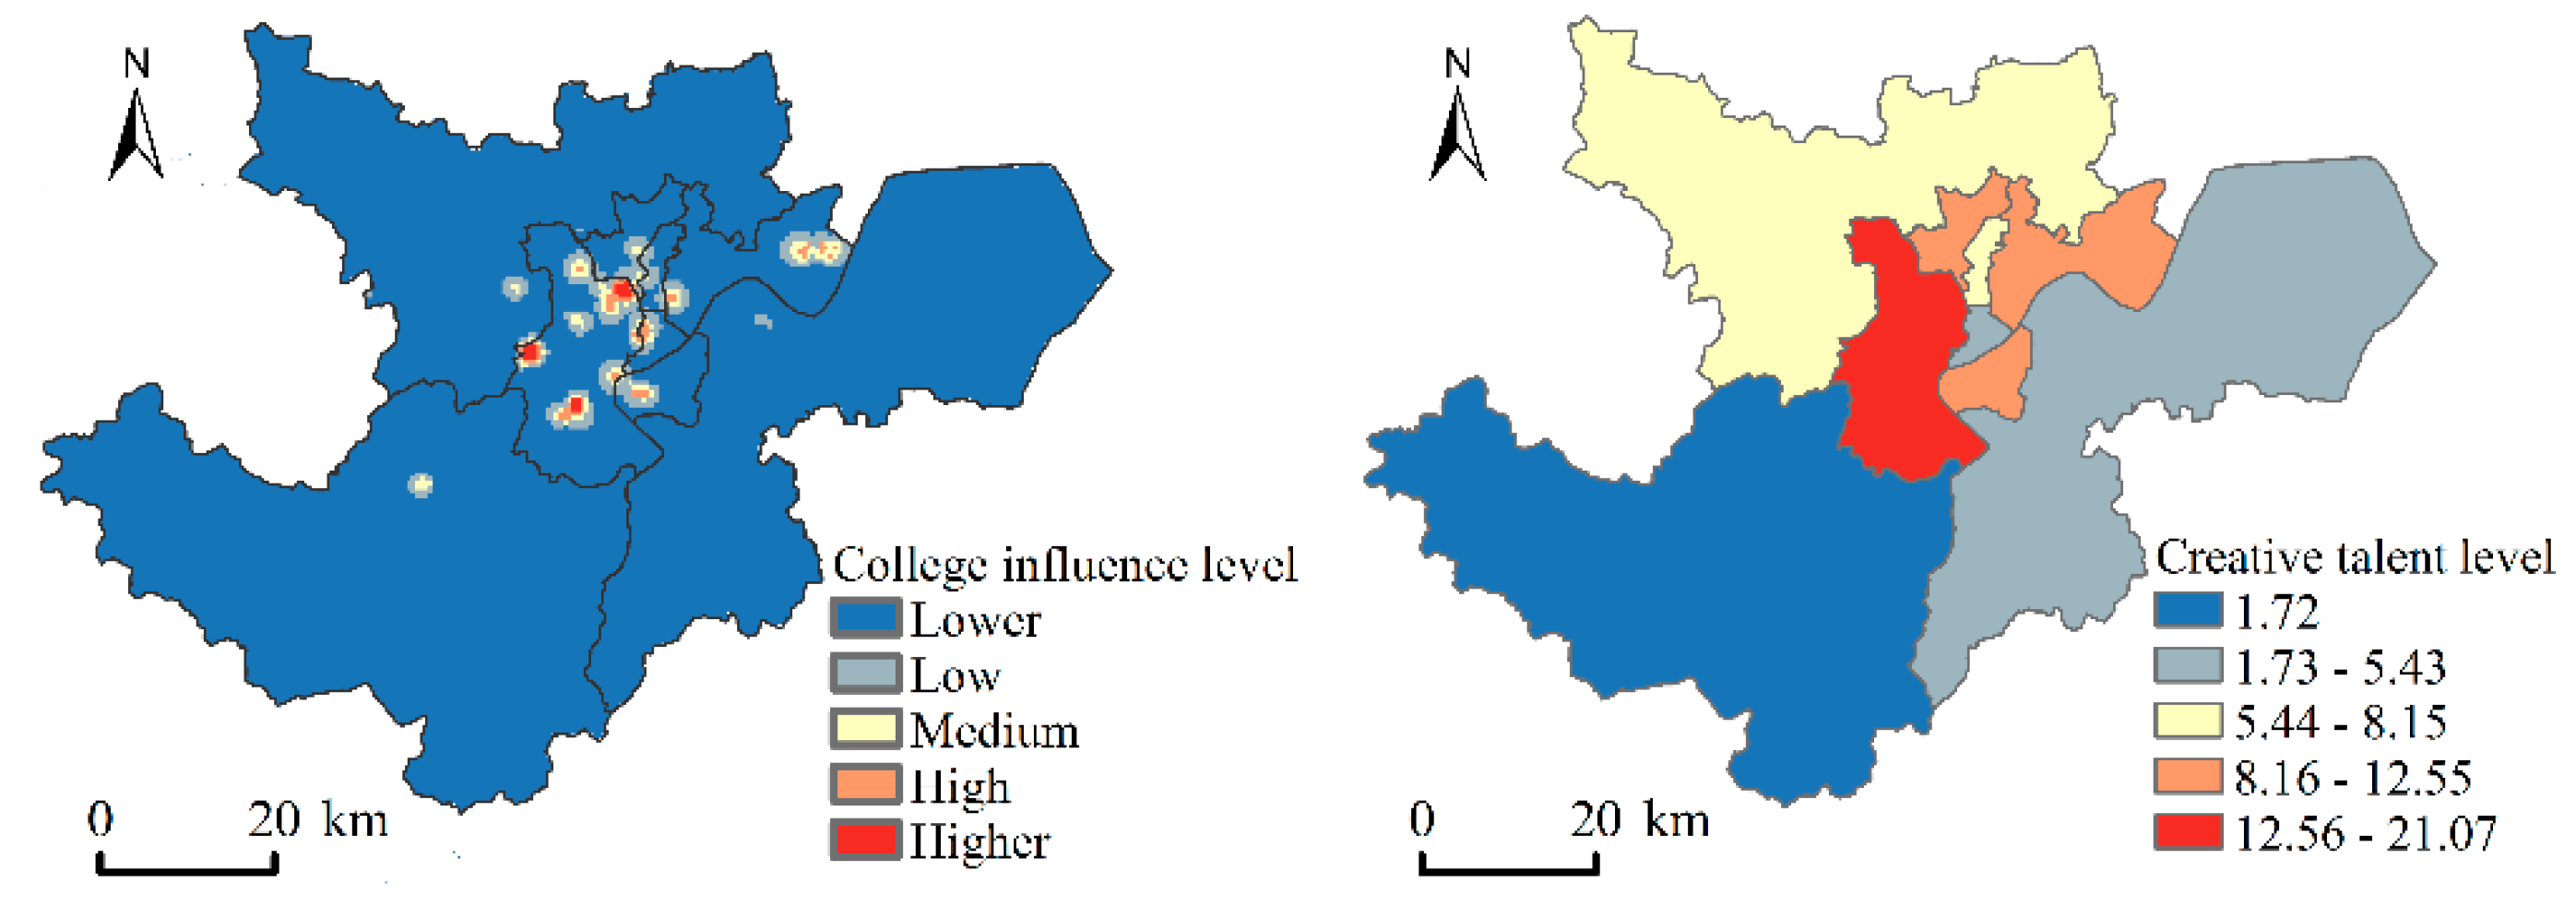
Research and innovation environment. There are a total of 58 colleges and universities in Hangzhou. Based on the different impacts on the innovation environment, it can be divided into three categories: elite universities, normal universities and technical colleges. Among them, Zhejiang University and China Academy of Art have the most influence on cultural and creative industries, while technical colleges have the least influence on cultural and creative industries. The results show that the urban core area is still a region where the resources of higher education institutions are concentrated, while Xiasha Higher Education Park, Binjiang District and Xihu District have good higher education resources, although Xiaoshan District and Yuhang District also have tertiary institutions. However, the technical colleges are less supportive of the cultural and creative industries.
(2)
Innovative talent environment. The education level data of Hangzhou population comes from the actual population survey data of Hangzhou Public Security Bureau in December 2016. According to the actual needs of the development of the cultural and creative industries, combined with the reliability and availability of statistical data, the “innovative talents” refer to the urban resident population with a bachelor’s degree or above and under the age of 60. According to calculations, at the end of 2016, the number of innovative talents in Hangzhou was 813,500, accounting for 12.72% of the total population. The scale of innovative talents in Xihu is the largest, with 210,700 people; the scale of innovative talents in Binjiang is 125,500, accounting for 38.12% of the population of Binjiang, ranking first in the nine districts. In general, the talent scale in the outer areas of the city is relatively small, mainly involving Xiaoshan and Fuyang (Figure 7).

4.1.3. Social Infrastructure

(1)
Environment of educational and medical institutions. Regional innovation originates from the innovation of creative people. In addition to a comfortable and convenient working and entertainment environment, the factors that attract creative people also require good educational and medical facilities and take into account the spatial distribution of primary and secondary schools and hospitals in Hangzhou. The educational and medical conditions and resources of each region are allocated according to the level of schools and hospitals. In general, the core area still has sufficient educational and medical resources, but the outlying districts also have abundant educational and medical facilities (Figure 8).
(2)
Environment of transportation facilities. By the end of 2016, the total length of highways in Hangzhou was 16306.07 km and the highway density was 98.25 km/100 km2, of which 632.04 km are expressways (including 489.47 km of national expressways), 831.95 km are first-class roads, 1614.68 km are second-class roads, 1108.44 km are third-class roads and 7265.64 km are fourth-class roads. Hangzhou has Hangzhou City Railway Station (first class), Hangzhou East Station (special station) and Hangzhou South Station (main station). Xiaoshan International Airport is one of the ten largest airports in China. In general, the transportation facilities in Hangzhou are excellent, and the transportation network has significant advantages. In conjunction with the definition of external traffic in this article, the land transportation method is selected as the analysis basis and reasoning for the time cost. According to the “Highway Engineering Technical Standards of the People’s Republic of China (JTGB-2003)”, in conjunction with the density of the road network and the quality of the road network in Hangzhou, the actual operating speeds are set at 100 km/h for highways, 80 km/h for first class roads, 70 km for second class roads, 40 km/h for third class roads and 20 km/h for minor roads and other roads (Table 3) [65]. Using ArcGIS 10.2 software spatial analysis, where the different road classes were mapped to the spatial distance analysis model, the travel time of each grid cell to the high-speed railway station was calculated (Figure 9). Basically, it can be seen that, the farther away from the high-speed rail station, the longer the distance to the station. As of 2016, there are three subway lines in Hangzhou, namely lines 1, 2 and 4, all of which use the subway system. There are 68 stations and a total of 93.7 km of operation. As an environmentally friendly and convenient public transportation system, the MTR is a good choice for creative people who do not drive. As the MTR is a daily transportation system, the effective range is within 4 km. Below that, the maximum impact intensity is within 1 km. Using the ArcGIS 10.2 software buffer tool, the route of the Hangzhou subway is shown in Figure 10.
(3)
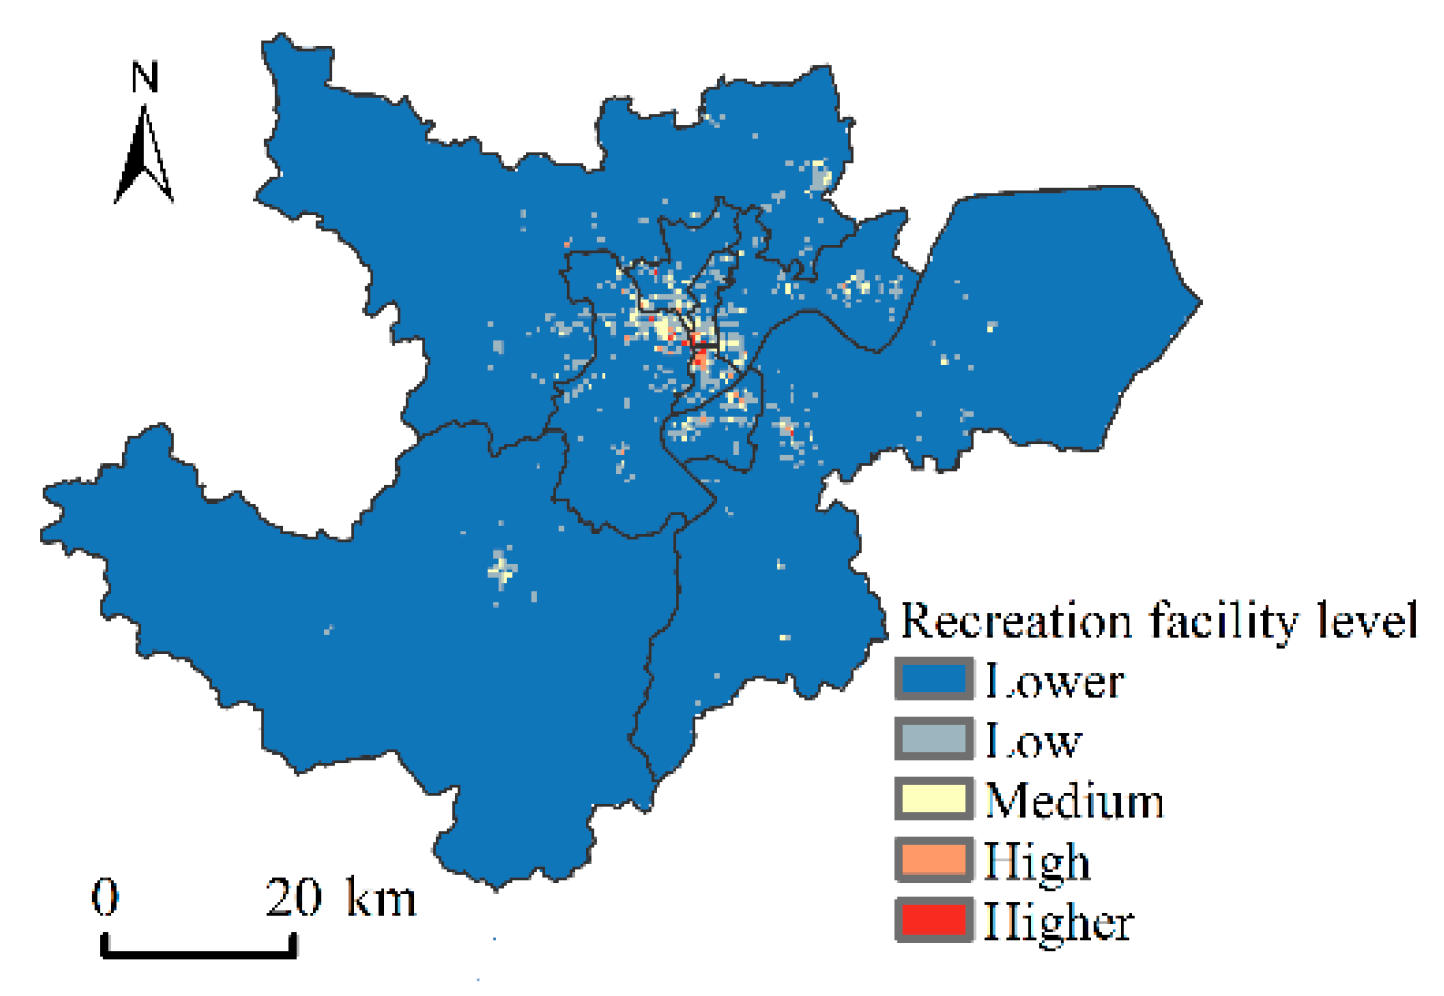
Recreational facility environment. Creative people have high demands on their working, living and entertainment facilities. A comfortable and pleasant environment is conducive for creative people to relax and find creative inspiration. Cafes, bars, leisure clubs, gyms and restaurants provide creative people with a good space for leisure and communication. Such POI data are processed and statistically analyzed in a 500 m × 500 m vector grid and evaluated and assigned according to the number of POIs included in the grid. The results show that recreational facilities are concentrated in the core area, with Wulin Square, Fengqi Street and Ding’an Street having the highest concentration of recreational facilities along the subway lines and decreasing outward in a circular structure. The peripheral districts and urban recreation facilities are located in the areas where their government agencies are located (Figure 11).

4.1.4. Policy Support

The industrial park is very important for the development of cultural and creative industries, especially for newly established cultural and creative enterprises. Hangzhou Industrial Park includes Hangzhou Hi-tech Industrial Development Zone, Hangzhou Economic and Technological Development Zone, Xiaoshan Economic and Technological Development Zone, Qianjiang Economic Development Zone, Lin’an Economic Development Zone, Fuyang Economic Development Zone and Yuhang Economic Development Zone, and we consider not only the national parks mentioned above but also the industrial clusters supported by the provinces and cities, such as Fuyu Science & Technology City, Dajiang East Industrial Cluster and Linjiang Industrial Park (Figure 12).

4.2. Comprehensive Identification of Micro-Locations of Cultural and Creative Industries in Hangzhou

(1)
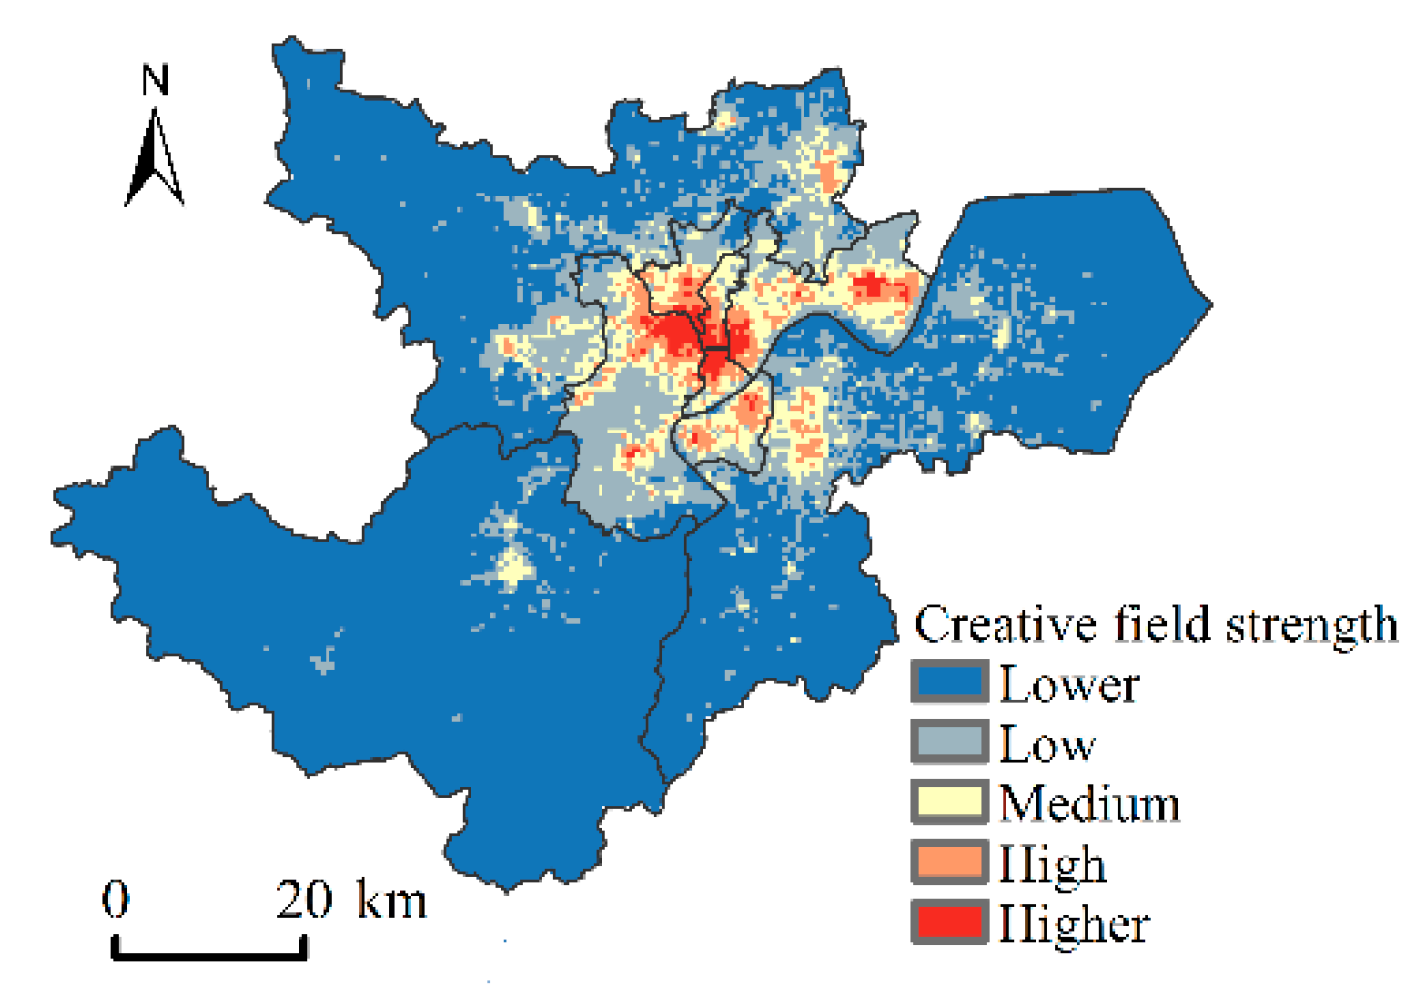
The creative field strength in Hangzhou presents a “core–periphery” circle structure, gradually decreasing from the central city to the outside, but there are also some secondary creative field centers in the periphery (Figure 13). The area with the highest creative field strength is located in Wensan Block and Wulin Square Block, starting from Qingchun Square Block in the east, South Song Dynasty Royal Street–Wushan Square Block in the south, Baochu Road–Nanshan Road in the west and the Gongchen Bridge section of Beijing–Hangzhou Grand Canal in the north. This area is the core area of Hangzhou, with great historical and cultural accumulation, a diversified urban environment, and relatively complete support facilities, such as transportation, education and medical care. It is the most suitable micro-location for cultural and creative industries. The area with the second largest creative field strength includes Zhejiang University Zijingang Campus-Xixi Block, Xiasha Higher Education Park, Binjiang High-Tech Industrial Development Zone, Xiaoshan Economic and Technological Development Zone, Zhuantangzhi Jiang National Tourist Resort and other areas. Binjiang High-tech Industrial Development Zone and the surrounding areas have a good innovation environment and convenient transportation. However, the emerging industries around Hangzhou Economic and Technology Development Zone have a weak base, mainly relying on the introduction of technology-based enterprises, and the supporting facilities in the surrounding areas are insufficient, which is not attractive to creative enterprises. Future Science & Technology City is located in the northwestern part of Hangzhou. With the Xixi campus of Zhejiang College and Alibaba Industrial Park, it has strong innovation and development advantages, but there is still a problem with poor transportation access. The future opening of subway lines will improve the external traffic conditions to a certain extent and further expand the innovation advantages. In addition, the Dajiangdong Industrial Cluster, Linjiang Industrial Park, Yuhang Economic and Technological Development Zone, etc., industrial parks, which are strongly supported by the government, have obvious institutional advantages and have the potential to develop innovative industries. However, the transportation and development conditions still need to be improved.
(2)
The location around the provincial/city/district government land is the core area of creative field strength. The research results show that the area with high creative field strength with Wensan Road and Wulin Square as the core is also the area where the provincial and city government is located. Creative field strength outside the core area is obviously weaker. In Yuhang, Fuyang and other districts, areas with high creative field strength are located around the district government land. The spatial infrastructure and supporting facilities and the level of economic development in these areas are relatively well developed, which plays an important role in promoting creative field strength. From the perspective of Hangzhou’s spatial system, creative field strength shows an obvious weakening of distance; that is, the closer the district center is to the city center, the higher the creative field strength is and the more suitable it is for the development of cultural and creative industries; the farther the district center is from the central city, the lower the creative field strength is.
(3)
The areas with a high creative field strength in different districts have significantly different area (Figure 14). The location corresponding to the creative field strength in each of the nine districts under the jurisdiction of Hangzhou City is extracted according to the five levels and the corresponding area is calculated. In general, Xihu and Jianggan are the two areas with the largest areas, which have a high creative field strength and more. Fuyang, Xiaoshan and Yuhang do not have high or higher area of creative field strength. Among them, the areas with the highest creative field strength are only in Xihu, Jianggan, Shangcheng, Gongshu and Binjiang and Xihu. Jianggan and Shangcheng have the largest area with the highest creative field strength, 22.75 km2, 15.50 km2 and 9.25 km2, respectively. This shows that Yuhang, Fuyang and Xiaoshan, as new districts, are weak in innovation and suffer from insufficient innovation aura in the core area.

4.3. Identification of Hot and Cold Areas of the Creative Field in the Core Urban Area of Hangzhou

The assessment of Hangzhou’s creative field strength has shown that the areas with high creative field strength are mainly located in the central city. In order to better understand the micro-location of cultural and creative industries, we further investigate the distribution of hot spots and cold spots areas of Hangzhou creative field strength, relying on the ArcGIS 10.2 software Getis-Ord Gi* tool to analyze the high and low value agglomeration areas of urban creative field strength in downtown and generate hot spots (high value agglomeration areas) and cold spot areas (low value agglomeration areas), as shown in Figure 15. The results show that: (1) the core area of Hangzhou exhibits a spatial pattern with high-value agglomeration at the core and low-value agglomeration at the periphery. The high-value agglomeration areas are distributed around West Lake and are enclosed by Shangcheng, Xiacheng, Xihu, Gongshu, Binjiang and Jianggan. This area is a meeting place for creative talents, strong historical and cultural atmosphere and innovative enterprises. There are Hangzhou Traditional Higher Education Park, Bainaohui Software Park, Qinghefang and other historical and cultural blocks suitable for the development of cultural and creative industries. It forms a cultural and creative circle around West Lake, which is a “fertile ground” for the development of fashion design, cultural and creative finance, art, entertainment and other industries. (2) The Cold Spot area surrounds the Hot Spot area and is located on the edge of the core area. Mainly located in Xiaoshan, they have only recently merged with Hangzhou municipality, and their economic basis and innovation environment are relatively weak. In recent years, the Hangzhou government has been actively developing the Dajiangdong Industrial Cluster and Yuhang Dream Town, and “new hot spots” may appear in the future.

5. Discussion

5.1. The Combined Influence of the Historical and Cultural Layers and Industrial Planning

Our study on Hangzhou shows that the micro-location (creative field) of Hangzhou’s cultural and creative industries presents a multi-center spatial structure of “One main center + multiple sub-centers”, and the creative space environment in the central city is more conducive to the layout of cultural and creative industries than the surrounding areas. This spatial pattern is mainly attributable to the combined influence of the historical and cultural layers and industrial planning of Hangzhou. On the one hand, Hangzhou is an ancient city with 8000 years of civilization history and 5000 years of city-building history. Meanwhile, there are also a large number of modern old industrial buildings on both sides of Grand Canal in the central city, laying the foundation for the development of Hangzhou’s cultural and creative industries. Since 2000, the central city has become the birthplace of Hangzhou’s cultural and creative industries, attracting a group of creative talents. A large number of old factories and old buildings have been artistically transformed into creative spaces and gradually developed into a cultural and creative industry cluster. This is consistent with a previous study’s point of view [66] that history and culture are the direct driving force for the development of creative industries, and old industrial buildings are good places to nurture cultural and creative industries [67]. On the other hand, the official and industry experts have gradually realized the huge economic value of cultural and creative industries and have used industrial planning policies to build many creative industry parks in the area not away from the central city, such as the High-tech Zone Animation Industry Base, West Lake Digital Entertainment Industrial Park, Zhijiang Cultural and Creative Park, Hangzhou Future City, etc. The creative industry parks planned and constructed under the guidance of the government are more likely to obtain support from financing, taxation, land rent, talent introduction, etc., which is conducive to the development of small cultural and creative enterprises. In addition, there are universities and research institutes, transportation and leisure and entertainment facilities around the Cultural and Creative Industry Park. Therefore, there are many sub-level creative spaces outside the core area.

5.2. Micro-Location and Policy Formulation of Cultural and Creative Industries

We found that the most suitable micro-locations for breeding and development of cultural and creative industries are closely related to the location of the three-level government, such as Hangzhou province/city/district government. The initial stage of urban planning in China is mainly to serve urban economic growth [68] and has not yet shaken off the shackles of the planned economy. Government land generally occupies the key and core position of urban space planning, and its surrounding supporting facilities are very complete. It has unique advantages in employment, residence, medical care, education, transportation, communication, entertainment, etc., and can meet the production, living and consumption of creative talents. It is a “golden location” suitable for the development of cultural and creative industries. Therefore, the creative field strength corresponding to the location of the government is very high. Meanwhile, following the first law of geography, “all things are related, but nearby things are more related than distant things” [69], the farther away from the core area of creative field strength, the less radiation it receives, and the weaker the creative field strength.
According to the empirical results, the areas suitable for the development and cultivation of cultural and creative industries in Hangzhou are relatively strong in the core area, while the creative areas in other parts of the city are relatively weak, which is not conducive to the coordinated development of urban cultural and creative industries. In order to create more micro-locations that meet the space requirements of the cultural and creative industries and avoid the saturation of space carriers and vicious competition, policy-makers and planners should raise greater awareness of the spatial distribution of cultural and creative industries and the creation of local environments. For future planning, three policy implications were highlighted: (i) promoting the construction and improvement of urban transportation network, landscape environment, education and health facilities and related supporting facilities and creating a sustainable and attractive urban space environment; (ii) sorting out the original urban spatial structure and cultural accumulation, cultivating urban spatial diversity and stimulating the vitality of urban creative industries and (iii) implementing appropriate cultural and creative industry development strategies according to different types of regions.

5.3. Methodological Advantages

At present, many studies focus on finding and verifying the factors that affect the distribution of cultural and creative industries. Few studies use models to quantify and evaluate which locations are most suitable for the development of cultural and creative industries. This study first integrates creative industry location theory and clarifies the local environmental factors that affect creative industry and the creative class; second, from the perspective of the built environment, it constructs a cultural and creative industry micro-location (creative field) model. Third, it uses buffer analysis, cost-weighted analysis and other geographic information system analysis techniques, as well as overlay analysis with spatial entropy weights, to describe and visualize the micro-location of urban cultural and creative industries at the grid scale.
Different from previous studies, this study constructs a bridge linking macro theory and micro spatial measurement. Taking the grid as the study unit has its own technical complexity compared with the study units, such as provinces/cities/districts, and it is also necessary for the study topic because, ultimately, each grid in the urban space has its own creative field strength. It is worth noting that we compare the research with the existing research and find that the micro-location pattern of the cultural and creative industries is consistent with the spatial distribution of the actual cultural and creative industries [70]. This shows that the research framework we proposed is scientifically valid.

5.4. Research Limitations and Future Directions

The study has some limitations to be further improved. First, the influencing factors of the micro-location of cultural and creative industries are complex to a certain extent, and some information may be lost in the process from theoretical construction to quantitative test. For example, we did not account for the land rent factor in the model. Lianjia (http://www.Lianjia.com/) (accessed on 1 January 2019) and other similar housing agent platforms include rich information on housing prices about all communities, These factors can be incorporated to reflect land rent in future work [71]. Second, we use a large amount of POI data to measure the creative environment. A large amount of point data can accurately describe the location of the business unit, but it ignores the detailed information, such as the size, internal environment and performance of the business unit. In the future, we can consider using big data mining technology to improve the richness and accuracy of data information and then more accurately identify the micro-location of cultural and creative industries. Third, in future research, the urban built environment data of different times can be used to carry out more in-depth research, observe the evolution trend of cultural and creative industry micro-location in space and time and analyze the development mechanism of micro-location from the perspective of evolutionary economic geography.

6. Conclusions

The spatial location of cultural and creative enterprises will affect the economic benefits of creative industries, which is an urgent issue in China and the world. In this study, we constructed a micro-location identification model for cultural and creative industries and applied it to the urban area of Hangzhou, China. The study showed that:
(1)
the creative field strength in Hangzhou presents a “core–periphery” circle structure, gradually decreasing from the central city to the outside, with the sub-centers of the creative field scattered around the core urban area. The most suitable location for the cultivation and development of cultural and creative industries in Hangzhou is located in Wensan District as the core area, which includes Wensan Road, Xueyuan Road, Wulin Square, Hangzhou Future City-Xixi Wetland, etc. This spatial pattern is mainly attributable to the combined influence of the historical and cultural layers and industrial planning of Hangzhou;
(2)
the location around the provincial/city/district government land is the core area of creative field strength, which is more suitable for the development of cultural and creative industries. The farther from the core area, the smaller the creative field strength is and the more obvious the attenuation of distance is. It is worth noting that we compared the study results with the existing studies and found that the micro-location pattern of the cultural and creative industries is consistent with the spatial distribution of the actual cultural and creative industries. This demonstrates that the research framework we proposed is scientifically valid.
On the whole, this research framework provides a useful tool for quickly identifying the most suitable micro-locations in cities to nurture and develop cultural and creative industries and is conducive to achieving a win–win situation between the sustainable development of cultural and creative industries and the development of urban space.

Author Contributions

Conceptualization, D.W., Y.W.; data curation, D.W.; formal analysis, D.W., Y.W. and R.M.; funding acquisition, R.M.; investigation, D.W.; methodology, Y.W.; project administration, R.M.; resources, Y.W., X.N. and R.M.; software, D.W., Y.S. and X.N.; validation, Y.S. All authors have read and agreed to the published version of the manuscript.

Funding

This research was funded by The National Natural Science Foundation of China, grant number 41301110.

Institutional Review Board Statement

Not applicable.

Informed Consent Statement

Not applicable.

Data Availability Statement

Not applicable.

Conflicts of Interest

The authors declare no conflict of interest.

References

  1. He, J.; Hans, G. Space of creative industries: A case study of spatial characteristics of creative clusters in Shanghai. Eur. Plan. Stud. 2014, 22, 2351–2368. [Google Scholar] [CrossRef]
  2. Ma, R.F. Evolution of the Creative Industrial Districts and Spatial Restructuring of the Metropolitan Space; Zhejiang University Press: Hangzhou, China, 2014. [Google Scholar]
  3. DCMS. Creative Industries Mapping Document 2001; DCMS: London, UK, 2001. [Google Scholar]
  4. Hangzhou Municipal People’s Government. Hangzhou Cultural and Creative Industry Development “13th Five-Year Plan”; Hangzhou Municipal People’s Government: Hangzhou, China, 2008. [Google Scholar]
  5. United Nations Conference on Trade and Development. Creative Economy Report 2008; UNCTAD: Geneva, Switzerland; New York, NY, USA, 2008. [Google Scholar]
  6. Hangzhou Municipal Bureau of Statistics. 2016 Hangzhou National Economic and Social Development Statistical Bulletin. 2016, Hangzhou. Available online: https://www.hangzhou.gov.cn/art/2017/10/27/art_805865_12141116.html (accessed on 20 September 2022).
  7. Aliye, A.G.; Tüzın, B.L.; Peter, N. Measuring regional creative capacity: A literature review for rural-specific approaches. Eur. Plan. Stud. 2010, 18, 545–563. [Google Scholar] [CrossRef]
  8. Florida, R. The Rise of the Creative Class; Basic Books: New York, NY, USA, 2002. [Google Scholar]
  9. Florida, R.; Mellander, C. Talent, skills, and urban economies//Dariusz Wójcik. The New Oxford Handbook of Economic Geography; Oxford University Press: Oxford, UK, 2018. [Google Scholar]
  10. Glaeser, E.L.; Edward, L. Review of Richard Florida ‘s the rise of the creative class. Reg. Sci. Urban Econ. 2005, 35, 593–596. [Google Scholar] [CrossRef]
  11. Scott, A.J. Cultural economy and the creative field of the city. Hum. Geogr. 2010, 92, 115–130. [Google Scholar] [CrossRef]
  12. Backman, M.; Nilson, P. The role of cultural heritage in attracting skilled individuals. J. Cult. Econ. 2018, 42, 111–138. [Google Scholar] [CrossRef]
  13. Daubaraite, U.; Startiene, G. Creative industries mapping in kaunas county. Econ. Manag. 2012, 17, 1178–1184. [Google Scholar] [CrossRef]
  14. Tao, J.; Ho, C.Y.; Luo, S.; Sheng, Y. Agglomeration economies in creative industries. Reg. Sci. Urban Econ. 2019, 77, 141–154. [Google Scholar] [CrossRef]
  15. Dörry, S.; Rosol, M.; Thissen, F. The significance of creative industry policy narratives for Zurich’s transformation toward a post-industrial city. Cities 2016, 58, 137–142. [Google Scholar] [CrossRef]
  16. Cerisola, S. Creativity and local economic development: The role of synergy among different talents. Pap. Reg. Sci. 2016, 46, 637–660. [Google Scholar] [CrossRef]
  17. Clare, K. The essential role of place within the creative industries: Boundaries, networks and play. Cities 2013, 34, 52–57. [Google Scholar] [CrossRef]
  18. Yuan, H.H.; Wu, D.D.; Ma, R.F. Spatial-correlation between agglomeration of cultural &creative industries and urban built environment field in Hangzhou. Econ. Geogr. 2018, 38, 123–132. [Google Scholar] [CrossRef]
  19. Fahmi, F.Z.; Koster, S.; Dijk, J.V. The location of creative industries in a developing country: The case of Indonesia. Cities 2016, 59, 66–79. [Google Scholar] [CrossRef]
  20. Escalona-Orcao, A.; Escolano-Utrilla, S.; Sáez-Pérez, L.; García, B.S.-V. The location of creative clusters in non-metropolitan areas: A methodological proposition. J. Rural Stud. 2016, 45, 112–122. [Google Scholar] [CrossRef]
  21. Townsend, L.; Wallace, C.; Fairhurst, G. Broadband and the creative industries in rural Scotland. J. Rural Stud. 2016, 47, 1–8. [Google Scholar] [CrossRef]
  22. Xiao, Y.F. A Study of the Dynamic Mechanism and Innovation Models of Development of Economic Spaces of the Creative Industrial District; Doctoral Dissertation of East China Normal University: Shanghai, China, 2007. [Google Scholar] [CrossRef]
  23. Ma, R.F.; Wang, T.F.; Zhang, W.Z. Location model of cultural & creative industry and its application in Zhejiang. Geogr. Res. 2018, 37, 379–390. [Google Scholar] [CrossRef]
  24. Ma, R.F. The identification of creative spaces in Shanghai. Progress in Geography. Prog. Geogr. 2012, 31, 1013–1023. [Google Scholar] [CrossRef]
  25. Zhou, S.Y.; Yang, H.Y.; Kong, X. The structuralistic and humanistic mechanism of placeness. Geogr. Res. 2011, 30, 1566–1576. [Google Scholar] [CrossRef]
  26. Berg, S.H.; Hassink, R. Creative industries from an evolutionary perspective: A critical literature review. Geogr. Compass 2014, 8, 653–664. [Google Scholar] [CrossRef]
  27. Boschma, R.A.; Fritsch, M. Creative class and regional growth: Empirical evidence from seven European countries. Econ. Geogr. 2009, 85, 391–423. [Google Scholar] [CrossRef]
  28. Wen, H.; Hu, B. A spatial econometric study on the influence factors of provincial cultural and creative industries development in China. Econ. Geogr. 2014, 4, 101–107. [Google Scholar] [CrossRef]
  29. Wang, Y.J.; Zhong, L.Q. The case study on spatial influence and spatial development pattern of cultural and creative industry clusters in Hangzhou. Archit. Cultur. 2015, 12, 141–143. [Google Scholar]
  30. Miguel, B.S.; Herrero, L.C. A spatial–temporal analysis of cultural and creative industries with micro-geographic disaggregation. Sustainability 2020, 12, 6376. [Google Scholar] [CrossRef]
  31. Jiang, H.B.; Zhang, W.Z.; Yu, J.H. Spatial and temporal pattern evolution of urban producer services in Hangzhou. Econ. Geogr. 2015, 35, 103–111. [Google Scholar] [CrossRef]
  32. Weber, A.; Li, G.J. Theory of the Location of Industries; The Commercial Press: Beijing, China, 1997. [Google Scholar]
  33. Hotelling, H. Stability in competition. Econ. J. 1929, 39, 49–57. [Google Scholar] [CrossRef]
  34. Losch, A. The Economics of Location; Yale University Press: New Haven, CT, USA, 1939. [Google Scholar]
  35. Fei, H.P. Organization and Strategic Behavior of Chinese Corporation; Economic Management Press: Beijing, China, 1998. [Google Scholar]
  36. Scott, A. Industrial organization and location: Division of labor, the firm and spatial process. Econ. Geogr. 1986, 63, 215–231. [Google Scholar] [CrossRef]
  37. Song, Z.Y.; Liu, W.D. The challenge of wide application of information and communication technologies to traditional location theory. J. Geogr. Sci. 2013, 23, 315–330. [Google Scholar] [CrossRef]
  38. Bronfenbrenner, U. The Ecology of Human Development: Experiment by Nature and Design; Harvard University Press: Cambridge, MA, USA, 1979; pp. 1–27. [Google Scholar]
  39. Jacobs, J. The Death and Life of Great American Cities; Random House Digital: New York, NY, USA, 1961. [Google Scholar]
  40. Mouratidis, K.; Poortinga, W. Built Environment, Urban Vitality and Social Cohesion: Do Vibrant Neighborhoods Foster Strong Communities. Landsc. Urban Plan. 2020, 204, 103951. [Google Scholar] [CrossRef]
  41. Chen, Y.; Yue, W.Z.; Rosa, D.L. Which communities have better accessibility to green space? An investigation into environmental inequality using big data. Landsc. Urban Plan. 2020, 204, 103919. [Google Scholar] [CrossRef]
  42. Cervero, R.; Kockelman, K. Travel demand and the 3Ds: Desity, diversity, and design. Transp. Res. Part D Transp. Environ. 1997, 2, 199–219. [Google Scholar] [CrossRef]
  43. Kumar, V.; Vuilliomenet, A. Urban Nature: Does Green Infrastructure Relate to the Cultural and Creative Vitality of European Cities? Sustainability 2021, 13, 8052. [Google Scholar] [CrossRef]
  44. Sun, Y.W.; Li, Y.; Ma, R.F. TI Mapping urban socio-economic vulnerability related to heat risk: A grid-based assessment framework by combing the geospatial big data. Urban Clim. 2022, 43, 101169. [Google Scholar] [CrossRef]
  45. Howells, J.R.L. Tacit knowledge, innovation and economic geography. Urban Stud. 2002, 39, 871–884. [Google Scholar] [CrossRef]
  46. Dahl, M.S.; Pedersen, C.R. Knowledge flows through informal contacts in industrial clusters: Myth or reality. Res. Policy 2004, 33, 1673–1686. [Google Scholar] [CrossRef]
  47. Blair, J.P.; Premus, R. Location theory//Theories of local eco-nomic development: Perspectives from across the disciplines. Choice Rev. Online 1993, 32, 3–27. [Google Scholar] [CrossRef]
  48. Ji, S.W.; Ma, R.F.; Ren, L.Y.; Wang, C.J. How to Find Vacant Green Space in the Process of Urban Park Planning: Case study in Ningbo (China). Int. J. Environ. Res. Public Health 2020, 17, 8282. [Google Scholar] [CrossRef]
  49. Delclò, A.X.; Miralles, C.C. Looking at Barcelona through Jane Jacobs’s Eyes: Mapping the Basic Conditions for Urban Vitality in a Mediterranean Conurbation. Land Use Policy 2018, 75, 505–517. [Google Scholar] [CrossRef]
  50. Choi, J.R.; Lim, D.G. A case study of cultural space to revitalize local community. Int. J. History Cult. 2013, 1, 1–14. [Google Scholar]
  51. Markusen, A. Urban development and the politics of a creative class: Evidence from a study of artists. Environ. Plan. A 2006, 38, 1921–1940. [Google Scholar] [CrossRef]
  52. Feldman, M.P.; Audretsch, D.B. Innovation in cities: Science based diversity, specialization and localized competition. Eur. Econ. Rev. 1999, 43, 409–429. [Google Scholar] [CrossRef]
  53. Koskinen, K.U.; Vanharanta, H. The role of tacit knowledge in innovation processes of small technology companies. Int. J. Prod. Econ. 2002, 80, 57–64. [Google Scholar] [CrossRef]
  54. Chen, D.N.; He, Z.X.; Hong, X.Y.; Ni, X.X.; Ma, R.F. Green and Low-Carbon Commuting Evaluation and Optimization of a Cross-Border Metropolitan Region by the Subway Network: The Case of Shenzhen and Hong Kong, China. Land 2022, 11, 1127. [Google Scholar] [CrossRef]
  55. Montgomery, J. Creative industry business incubators and managed workspaces: A review of best practice. Plan. Pr. Res. 2007, 22, 601–617. [Google Scholar] [CrossRef]
  56. Garnham, N. From cultural to creative industries: An analysis of the implications of the “creative industries” approach to arts and media policy making in the United Kingdom. Int. J. Cult. Policy 2005, 11, 15–29. [Google Scholar] [CrossRef]
  57. Christian, H.E.; Bull, F.C.; Middleton, N.J. How important is the land use mix measure in understanding walking behavior? results from the RESIDE study. Int. J. Behav. Nutr. Phys. Act. 2011, 55, 69–72. [Google Scholar] [CrossRef]
  58. Frank, L.D.; Pivo, G. Impacts of mixed use and density on utilization of three modes of travel: Single occupant vehicle, transit, and walking. Transp. Res. Rec. 1994, 1466, 44–52. [Google Scholar]
  59. Lou, J. Entropy and diversity. Oikos 2006, 113, 363–375. [Google Scholar] [CrossRef]
  60. Jiang, H. Research on Dynamic Evaluation Method of Urban Community Livability Based on Multi-Temporal Spatial Data; Wuhan University: Wuhan, China, 2017. [Google Scholar] [CrossRef]
  61. Wang, Z.B.; Xu, J.G.; Zhu, C.G. The county accessibility divisions in China and its correlation with population distribution. Acta Geogr. Sin. 2010, 65, 416–426. [Google Scholar] [CrossRef]
  62. Xiang, Y.B.; Zhang, Y.; Yuan, K.G. Analysis on characteristics and comprehensive evaluation of county’s development level in the Xiangjiang River Basin. Econ. Geogr. 2011, 1, 1088–1093. [Google Scholar]
  63. Li, J.M.; Zhang, W.Z.; Ma, R.F. Potential analysis of urban innovation space and its application. Econ. Geogr. 2016, 36, 224–232. [Google Scholar] [CrossRef]
  64. Chen, W.S.; Liu, L.; Liang, Y.T. Retail center recognition and spatial aggregating feature analysis of retail formats in Guangzhou based on POI data. Geogr. Res. 2016, 35, 703–716. [Google Scholar] [CrossRef]
  65. Jiang, H.B.; Xu, J.G.; Qi, Y. The influence of Beijing-Shanghai high-speed railways on land accessibility of regional center cities. Acta Geogr. Sin. 2010, 65, 1287–1298. [Google Scholar] [CrossRef]
  66. Graham, D. “This place gives me space”: Place and creativity in the creative industries. Geoforum 2003, 34, 511–524. [Google Scholar] [CrossRef]
  67. Hutton, T. The new economy of inner city. Cities 2004, 21, 89108. [Google Scholar] [CrossRef]
  68. Wu, F.L. Planning for Growth: Urban and Regional Planning in China; Routledge: London, UK, 2015. [Google Scholar]
  69. Tobler, W.R. A computer movie simulating urban growth in the Detroit region. Econ. Geogr. 1970, 46, 234–240. [Google Scholar] [CrossRef]
  70. Wu, D.D.; Ma, R.F.; Zhang, Y. Agglomeration characteristics and spatio-temporal evolution of cultural and creative industry in Hangzhou. Econ. Geogr. 2018, 38, 127–135. [Google Scholar] [CrossRef]
  71. Dai, X.; Li, Z.; Ma, L.; Jin, J. The spatio-temporal pattern and spatial effect of installation of lifts in old residential buildings: Evidence from Hangzhou in China. Land 2022, 11, 1600. [Google Scholar] [CrossRef]
Figure 1. Urban cultural and creative industry micro-location identification model (authors’ own).
Land 11 01695 g001
Figure 2. Technical route.
Land 11 01695 g002
Figure 3. Location of the study area of the Hangzhou Metropolitan area in 2016. Note: The map is based on the standard map of the Map Technical Review Centre of the Ministry of Natural Resources of China (Number: GS (2021)3715), with no modifications to the base map; Map-making by author.
Land 11 01695 g003
Figure 4. Land use mixture degree.
Land 11 01695 g004
Figure 5. The influence range of art built environment.
Land 11 01695 g005
Figure 6. The influence range of cultural built environment.
Land 11 01695 g006
Figure 7. The influence range of scientific and technological innovation resources.
Land 11 01695 g007
Figure 8. The influence range of educational and medical facility environment.
Land 11 01695 g008
Figure 9. The accessibility to high-speed rail station.
Land 11 01695 g009
Figure 10. The influence range of subway line.
Land 11 01695 g010
Figure 11. The influence range of recreation facility environment.
Land 11 01695 g011
Figure 12. Influence scale of industrial park.
Land 11 01695 g012
Figure 13. Comprehensive assessment of creative field strength.
Land 11 01695 g013
Figure 14. The area occupied by different levels of creative field strength in each district of Hangzhou.
Land 11 01695 g014
Figure 15. Accumulation pattern of cold spot and hot spot of creative field strength.
Land 11 01695 g015
Table 1. The index weight of the built environment assessment of cultural and creative industries.
Macro-Location FactorLocation FactorBuilt Environment
Factor
Urban Built Environment
Perspective Cultural and Creative
Industry Location Measurement Index
Weights
Urban cultural atmosphere (0.32)Street activity (0.2)Land use environment (0.2)Land use mixture0.20
Strong artistic atmosphere (0.06)Art built environment (0.06)Distance to art gallery,
theater distribution
0.06
Deep cultural heritage (0.06)Culturally built environment (0.06)Distance to cultural protection unit0.03
Distance to museums0.03
Talent and technology innovation resources (0.24)Scientific innovation (0.12)Research and innovation environment (0.12)Distance to university
research institutions
0.12
Innovative talents (0.12)Research talent environment (0.12)Innovative talents distribution0.12
Social infrastructure (0.36)Leisure services (0.08)Recreation facility environment (0.08)Number of cafes, bars, restaurants0.08
Quality education service (0.08)Education facility environment (0.08)Primary and secondary school accessibility0.08
Quality medical service (0.08)Medical facility environment (0.08)Hospital accessibility0.08
Convenient transport (0.12)Transportation facility environment (0.12)High-speed railway station accessibility0.06
Distance to subway line0.06
Policy elements (0.08)Government services and support (0.08)Industrial policy environment (0.08)Whether in the industrial park0.08
Table 2. Evaluation criteria for each index.
Index Evaluation CriterionSub-Indicator (Weight)Score (Evaluation Grade)
97531
(Higher)(High)(Medium)(Low)(Lower)
Land use mixture (species)——<=00–2.02.0–6.06.0–9.0>=9.0
Distance to art gallery, theater distribution (km)——<=0.50.5–1.01.0–1.51.5–2.0>=2.0
Distance to cultural protection unit (km)National (0.5)<=0.50.5–1.01.0–1.51.5–2.0>=2.0
Provincial (0.3)<=0.50.5–1.01.0–1.51.5–2.0>=2.0
Municipal (0.2)<=0.50.5–1.01.0–1.51.5–2.0>=2.0
Distance to museums (km)State-museums (0.7)<=0.50.5–1.01.0–1.51.5–2.0>=2.0
Non-state museums (0.3)<=0.50.5–1.01.0–1.51.5–2.0>=2.0
Distance to university research institutions (km)Elite universities (0.5)<=0.50.5–1.01.0–1.51.5–2.0>=2.0
Normal universities (0.3)<=0.50.5–1.01.0–1.51.5–2.0>=2.0
Technical Colleges (0.2)<=0.50.5–1.01.0–1.51.5–2.0>=2.0
Innovative talents distribution (per million people)——<=1.71.7–5.45.4–8.28.2–12.5>=12.5
Primary and secondary schools accessibility (h)Secondary school (0.5)<=0.10.1–0.20.2–0.30.3–0.4>=0.4
Primary school (0.5)<=0.050.05–0.10.1–0.20.2–0.3>=0.3
Hospital accessibility (h)1st hospital (0.5)<=0.10.1–0.30.3–0.50.5–0.7>=0.7
2nd hospital (0.3)<=0.10.1–0.20.2–0.30.3–0.4>=0.4
3rd hospital (0.1)<=0.10.1–0.20.2–0.30.3–0.4>=0.4
Ordinary hospital (0.1)<=0.10.1–0.20.2–0.30.3–0.4>=0.4
High-speed railway station accessibility (h)——<=0.50.6–11.1–1.51.6–2.0>=2.5
Distance to subway line (km)——<=1.01.0–2.02.0–3.03.0–4.0>=4.0
Number of cafes, bars, restaurants (per grid)——<=1.01.0–5.05.0–11.011.0–23.0>=23.0
Whether in the industrial park—— yes no
Table 3. The classification of traffic road network and time cost in Hangzhou.
Road GradeHighway1st Road2nd Road3rd RoadOther Roads
Highway speed (km/h)10080704020
Time cost (s/m)0.0360.0450.0520.090.18
Publisher’s Note: MDPI stays neutral with regard to jurisdictional claims in published maps and institutional affiliations.

