Article

Tillage in Combination with Rice Straw Retention in a Rice–Wheat System Improves the Productivity and Quality of Wheat Grain through Improving the Soil Physio-Chemical Properties

1
Department of Soil Science, Punjab Agricultural University, Ludhiana 141004, Punjab, India
2
Department of Agronomy, Punjab Agricultural University, Ludhiana 141004, Punjab, India
3
Department of Science and Technology, University College-Ranyah, Taif University, P.O. Box 11099, Taif 21944, Saudi Arabia
4
Department of Biology, College of Science, Taif University, P.O. Box 11099, Taif 21944, Saudi Arabia
5
Division of Agronomy, Bangladesh Wheat and Maize Research Institute, Dinajpur 5200, Bangladesh
*
Author to whom correspondence should be addressed.
Land 2022, 11(10), 1693; https://doi.org/10.3390/land11101693
Submission received: 27 August 2022 / Revised: 17 September 2022 / Accepted: 26 September 2022 / Published: 30 September 2022

Abstract

:
In order to study the contribution of long-term tillage and rice straw management practices on wheat yield and soil properties in a rice–wheat system, a field study was conducted with seven main plot treatments as straw management practices, i.e., puddled transplanted rice + zero till drill sown wheat without paddy and wheat straw (R1), puddled transplanted rice + conventional tillage sown wheat without paddy and wheat straw (R2), puddled transplanted paddy without wheat straw + zero till wheat sown with Happy Seeder with paddy straw as mulch (R3), puddled transplanted rice without wheat straw+ conventional tillage sown wheat after paddy straw incorporation with disc harrow (R4), puddled transplanted rice without wheat straw + zero till sown wheat after paddy straw incorporation with rotavator (R5), puddled transplanted rice with wheat straw + zero till sown wheat with Happy Seeder with paddy straw as mulch (R6), puddled transplanted rice + zero till drill sown wheat after partial burning of wheat and paddy straw (R7) and three subplot treatments, i.e., nitrogen (N) levels (100, 125 and 150 kg ha−1), in a rice–wheat system-cropping system during 2017–2018 and 2018–2019 in a split plot experiment. Among different treatments, the straw management practices significantly influenced yield and yield attributes as well as the nutrient availability in soil. The application of 100 kg N ha−1 resulted in a significantly higher partial factor productivity (PFPN) of N over other levels of N application. The reduction in wheat yields obtained with conventional sowing of wheat without straw/straw burning/removal cannot be compensated even with an additional 50 kg N ha−1 to that obtained with straw retention or incorporation. In addition to saving N, crop residue recycling also helped to improve soil properties, grain quality, profitability, and air quality considerably.

1. Introduction

The rice–wheat system is cultivated in the nearly 13.5 million hectares in the Indo-Gangetic Plains of South-Asia and plays a key and crucial role in the food security of millions of people; India alone shares 10.5 m ha [1]. In Punjab, India, about 91% and 82% of the area under rice and wheat is harvested by combines [2], respectively, leaving a large amount of residue in the field that creates problems in the smooth sowing of succeeding wheat crops. While 75% of wheat straw is used as fodder, rice straw has no economic use. In Indian Punjab, more than 90% of rice straw and 25% of wheat straw are burnt annually by the farmers [3]. It leads to loss of nutrients, about 80% of nitrogen (N), 25% of phosphorus (P), 21% of potassium (K), and up to 60% of sulfur (S) along with the emission of 18% of black carbon, which is the second largest contributor to global warming [4]. Burning or removing a straw from the system leads to the loss of a substantial amount of plant nutrients which need to be replenished in the soil through costly energy-expensive inorganic fertilizers, resulting in reduced profits for the farmers [5].
On-farm straw management options include surface retention as mulch and soil incorporation. The in situ incorporation of rice straw is generally not preferred by the farmers due to the narrow window of 20–25 days between harvesting of rice and sowing of wheat and the high cost incurred on incorporation. Generally, rice is harvested in the first week of October and wheat is sown in the last week of October or the first week of November. In paddy-based systems, the management of paddy straw in fields is a serious problem due to scarcity of labor availability and gained momentum in recent years. The farmers generally follow the legally banned practice of burning paddy straw in their fields, and about 80% of rice straw produced is being burnt annually over 3 to 4 weeks of October–November. The problem is more severe under irrigated conditions particularly in the mechanized rice–wheat system of northwestern India. With the recent development of the zero-till seed drill (known as Happy Seeder), wheat can be planted in combine harvested rice fields, leaving rice straw as surface mulch [6]. The surface-placed residue presented a slow decomposition, which generally does not contribute to the N nutrition of wheat over a short period and might even immobilize soil N [7]. On the other hand, a recent study showed that the long-term incorporation of rice straw increased N use efficiency in both rice and wheat in the rice–wheat system [5]. Mulching wheat crop with rice straw enhances wheat yield from 11 to 22%, water use efficiency up to 25%, and root length density up to 40% in mulch-treated plots because of higher soil water retention [8]. A large number of short-term and medium-term studies on the effect of rice residue management on productivity and soil properties in the rice–wheat system are available in the literature [9,10], but more research is needed to study the long-term effect of crop residue management with varying N levels on wheat yield, N use efficiency, grain quality and soil properties in north-western conditions of India. There are several scenarios for residue management in the rice–wheat cropping system. Every management scenario has its advantages as well as disadvantages, since crop residue management practices are affected by the climatic and soil conditions of an area and every crop residue management practice is not suitable under all conditions [11]. Therefore, the testing of different management practices is imperative before their adoption in the area. We hypothesize that the continuous retention of rice residues on the surface as mulch or its incorporation into the soil for more than three years and its subsequent decomposition, besides improving soil health [11], will release nutrients for wheat crop and thereby help save fertilizer input, increase N use efficiency, improve wheat grain yield and quality, maintain or improve soil health and decrease the environmental pollution. Knowledge of the above parameters for the most efficient practice of rice straw management along with varying rates of N for saving N is very scanty and therefore is the focus of the present study.

2. Material and Methods

2.1. Experimental Site and Soil Characteristics

A long-term field experiment on different straw management practices in rice (Oryza sativa L.) and wheat (Triticum aestivum L.) cropping systems was initiated in 2008 at the Research Farm, Department of Agronomy, Punjab Agricultural University, Ludhiana (latitude of 30°54’ N, the longitude of 75°48′ E,~247 m AMSL), Punjab (India) to study the impact of rice residue management practices on the productivity of the rice–wheat system. The surface (0–15 cm) soil was sandy loam in texture with an average bulk density of 1.47 g cm−3. The soil of the experimental site was Typic Ustochrept, alkaline in reaction having soil pH (1:2 soil:water suspension)-8.6), soil electrical conductivity (1:2 soil:water suspension)-0.18 dSm−1 [12] with soil organic C (SOC) of 5.80 g kg−1 [12]. The KMnO4oxidizable N, Olsen P content, and 1N NH4OAc-extractable K in the initial soil sample were131.5 mg kg−1, 12.2 mg kg−1 and 133.4 mg kg−1, respectively.

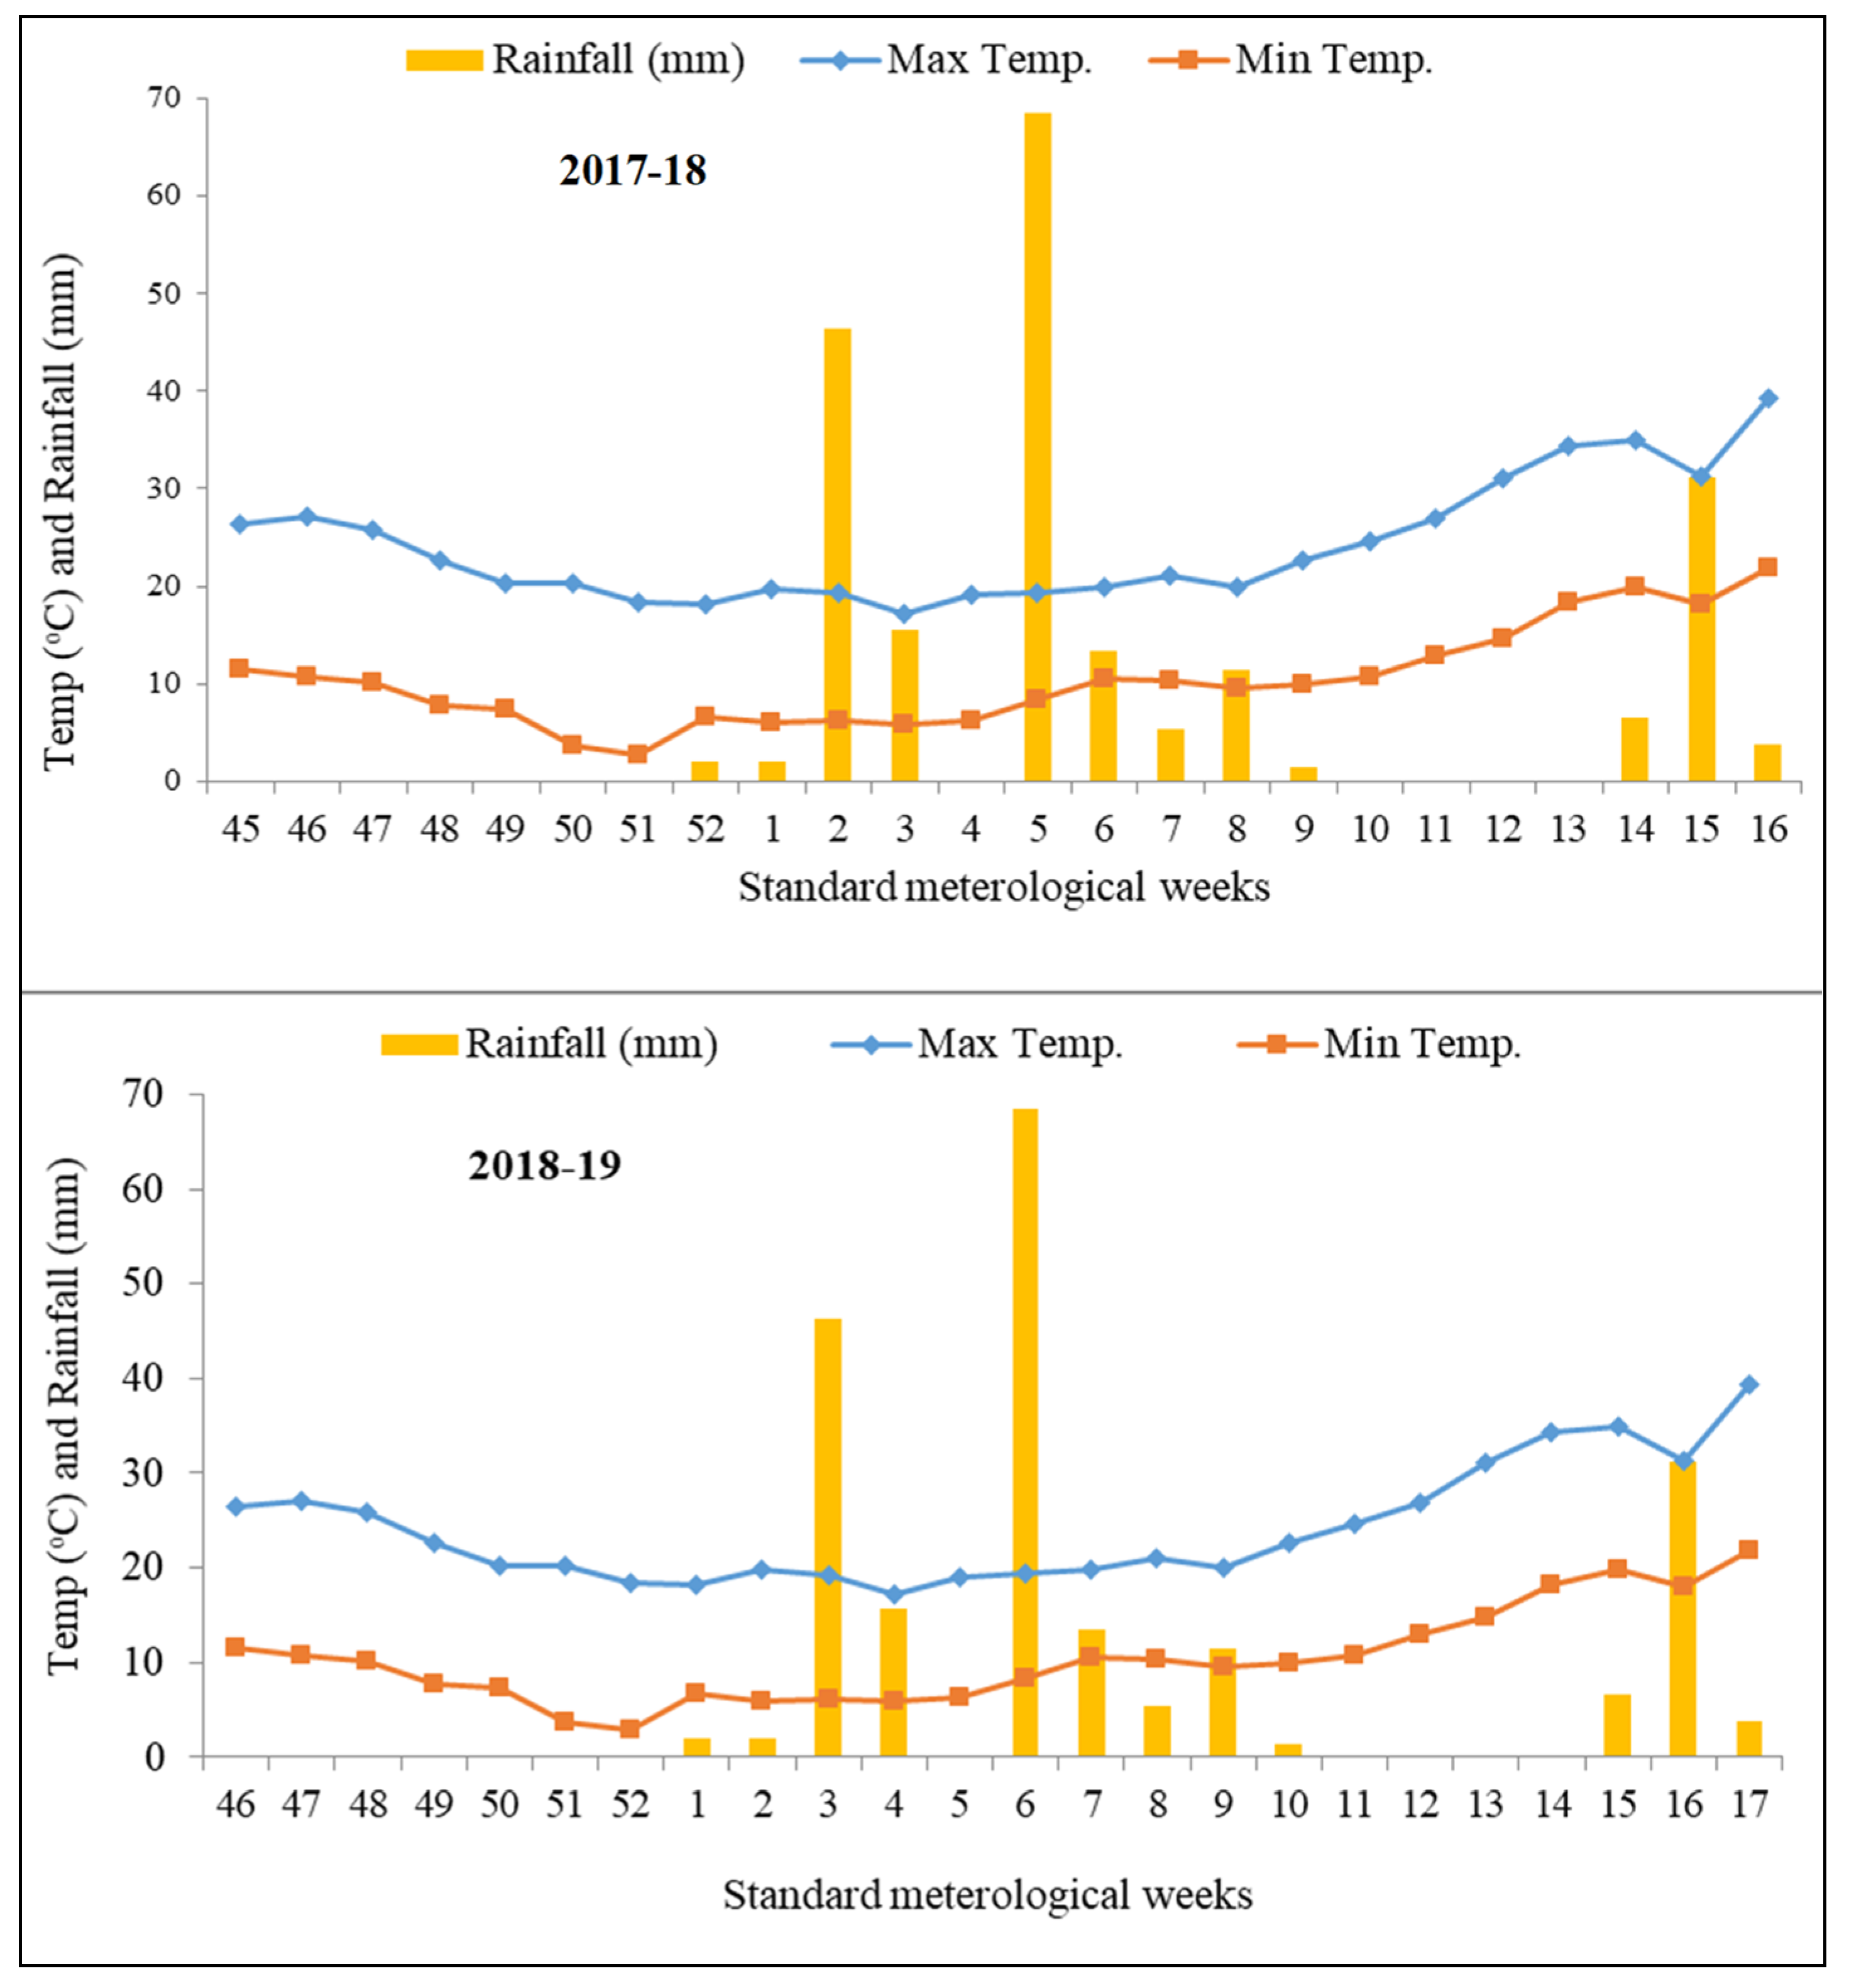
2.2. Climatic and Weather Data during the Crop Season

The study sites fall under semi-arid and sub-tropical climate with hot and dry summer extending between April and June and mostly moist between July and September due to the onset of monsoon, while there are cool and dry during winters extending between November and January. Mild climatic conditions prevail during February and March. This region receives 705 mm of average annual rainfall, nearly four-fifths of which is delivered from July to September (Figure 1).
The weather during the crop growing season of 2017–2018 and 2018–2019 was recorded at the Meteorological Observatory of Punjab Agricultural University, Ludhiana. The average maximum weekly temperature ranges were 15.5–35.5 °C and 17.2–39.3 °C, while the average minimum weekly temperature ranges were 5.3–20.3 °C and 2.8–21.9 °C during the crop season of 2017–2018 and 2018–2019, respectively (Figure 1). The average maximum temperature during the standard metrological week (SMW) 9 to 13 in 2017–2018 was high (29 °C) compared to 2018–2019 (25 °C). The total amount of rainfall received during 2017–2018 and 2018–2019 in wheat seasons was 84 mm and 223.2 mm, respectively, and it was relatively well distributed (Figure 1).

2.3. Brief Description of Field Treatments and Experimental Set-Up

A field experiment was initiated in 2008 with seven residue management treatments to study the long-term effects of tillage and rice straw management on crop yields in a rice–wheat system. After 9 years, the experiment was modified for two more consecutive years (2017–2018 and 2018–2019) with the above seven treatments as main plots and splitting of main treatment into three levels of N as sub-plots to evaluate the long-term implications of tillage and residue management practices and N application on wheat productivity and soil properties. Seven residue management treatments were kept as main plots with 3 fertilizer N levels (viz., 100, 125 and 150 kg N ha−1) as sub plots in a split-plot design with three replications. These seven treatments represented four scenarios mainly arising under farmers’ field conditions nowadays. In the first scenario (treatments R1 to R2), wheat and rice straw were removed before planting the crop. In the second scenario (treatments R3 to R5), rice was transplanted after wheat straw removal, but wheat was sown and rice straw was retained as surface mulch. The third scenario (R6) depicts the situation where wheat straw was incorporated into the soil before the rice crop, and rice straw (100%) was retained as surface mulch in wheat. The fourth scenario (R7) simulates the conditions where farmers usually burn standing stubbles of wheat after collecting about 75% of the straw for fodder before transplanting rice and partially burn (loose) rice straw for sowing of wheat. Treatment details are given in Table 1. The total amount of residue added and NPK recycled in each treatment is given in Table 2.

2.4. Crop Management

The sub plot size was 4.0 m × 2.5 m (10.0 m2). In rice, high yielding with the best cooking quality variety PR121 was transplanted in the last week of June with a spacing of 20 cm × 15 cm. The recommended dose of nitrogen 125 kg ha−1 through urea was applied in 3 equal splits at 7, 21 and 42 days of transplanting, respectively. The phosphorus and potassium fertilizers were applied only to wheat crop. The rice crop was harvested in the first week of October. In wheat, high yielding and yellow rust-resistant variety PBW 677 was sown in the first week of November with row spacing of 15 cm apart and 5–6 cm depth. A basal dose of 26.2 kg P ha−1 as single super phosphate containing 16% P2O5 and 25 kg K ha−1 as muriate of potash (60% K2O) was applied to all treatments. Fertilizer-N as urea was added as per treatments (100, 125 and 150 kg N ha−1), i.e., half at sowing and the other half was top dressed in two equal splits after 21 days with the first irrigation and at 45 days with the second irrigation to crop. Termites were controlled by treating the seed with chlorpyriphos (20EC @ 4 mL kg seed−1). A tank mix solution of Topik 15 WP (clodinafop) at 400 g ha−1 and Algrip 20 WP (metsulfuron) at 25 g ha−1 was applied for the management of grassy (Phalaris minor) and broadleaf weeds at 30–35 days after sowing. The other crop production and protection practices were followed as per package of practices for rabi crops [13]. Plots were irrigated with 100 mm water about 1 week prior to seeding and 4 additional irrigations of 75 mm were applied at critical growth stages of wheat. The wheat crop was harvested in the second week of April.

2.5. Data Collection and Analysis

2.5.1. Soil Parameters

Composite soil samples were taken from the surface layer (0–15 cm) soil from all the plots after harvesting rice crop in 2017 and homogenized thoroughly. Surface soil samples (0–15 cm depth) were also collected after the wheat harvest in 2018–2019 to know changes in soil properties. These soil samples were air dried and sieved through a 2 mm sieve before analysis of pH (1:2 soil:water suspension), EC (1:2 soil:water suspension), SOC and available N, P and K contents. Soil organic carbon was analyzed using the Walkley and Black wet digestion method [12]; available N was determined using the alkaline permanganate method [14], while available P was determined using Olsen’s method [15]. Available K was determined in 1N CH3COONH4 (pH = 7.0) using a flame photometer [12]. Soil temperature was measured with digital and analog thermometer (Spectrum Technologies, Aurora, IL, USA) at a depth of 15 cm from sowing to the crop emergence (up to 15 days after sowing) and at monthly intervals up to harvest. For determination of soil bulk density, cores were taken from undisturbed soil [16] at two depths (0–7.5 cm and 7.5–15 cm). Then, these samples were dried in an oven till the constant weight was achieved and their weight was recorded. A double-ring infiltrometer was used to measure the infiltration rate [17]. The depth of water infiltrated into soil at different time intervals was recorded to estimate the infiltration rate of soil (cm hr−1). Soil penetration resistance was measured by using a cone penetrometer (CP 40 II, RIMIK Toowoomba, QLD, Australia) from different soil depths up to 40 cm, and the readings were expressed as kPa.

2.5.2. Plant Parameters

Tiller density (total tillers m−2) in wheat sown with a rotavator plot was recorded (1.0 m2 area) and for other treatments from 1 m row length at two randomly selected spots within each plot at maturity, and then, the average was expressed as tillers m−2. Similarly, spikes were counted at harvest and expressed in spikes m−2. Five spikes were selected randomly to measure the length. Grains were also counted simultaneously to record grains per spike. The central area (4 m2) from each plot was manually harvested, and grain weight was measured after threshing. A known weight of sub-samples was dried in an electric oven at 50 °C for 48 h for the determination of moisture content of grains. The 1000 grain weight was determined by counting 1000 grains collected from each plot, and weight was expressed at 12% moisture content. The hardness of grains was tested by crushing the grains under an Ogawa Seiki OSK grain hardness tester, which gave values of force in kilograms on gauge. Hectoliter weight (or test weight) was determined with the test weight apparatus of 100 mL volume. The value obtained after weighing of wheat grains was expressed in kilogram per hectoliter (kg hl−1). Grain protein was analyzed using an automatic whole grain analyzer (Infratech-1241 model) and expressed in percentage. The protein yield of wheat grains was estimated as a product of grain yield and grain protein.

2.5.3. Partial Factor Productivity of N

The partial factor productivity (PFPN) of applied N (kg grain kg N−1) is calculated as grain yield (kg ha−1) produced from the unit quantity of N applied.

2.5.4. Economic Analysis

The mean gross returns were worked out as a product of the market price of produce (grain and straw) and their yield, and net returns were worked out by deducting the cultivation cost from total returns. The benefit:cost ratio was calculated by dividing the net returns with the cultivation cost.

2.6. Statistical Analysis

Data were analyzed with ANOVA in a split plot design [18] using SAS 9.1 software (SAS Institute). The treatment means were compared with the least significant difference (LSD) at p < 0.05. Since there was no significant difference in the trend of results during both years, data were pooled over for 2 years.

3. Results

The interaction effects (residue management practices × fertilizer N rates) on growth parameters, yield attributes and dry matter production except for grain yield and partial factor productivity of N were insignificant (Table 3). The results of various straw management techniques and varying levels of non-growth parameters, yield attributes, dry matter production, grain yield and the partial factor of productivity are presented in Table 4.

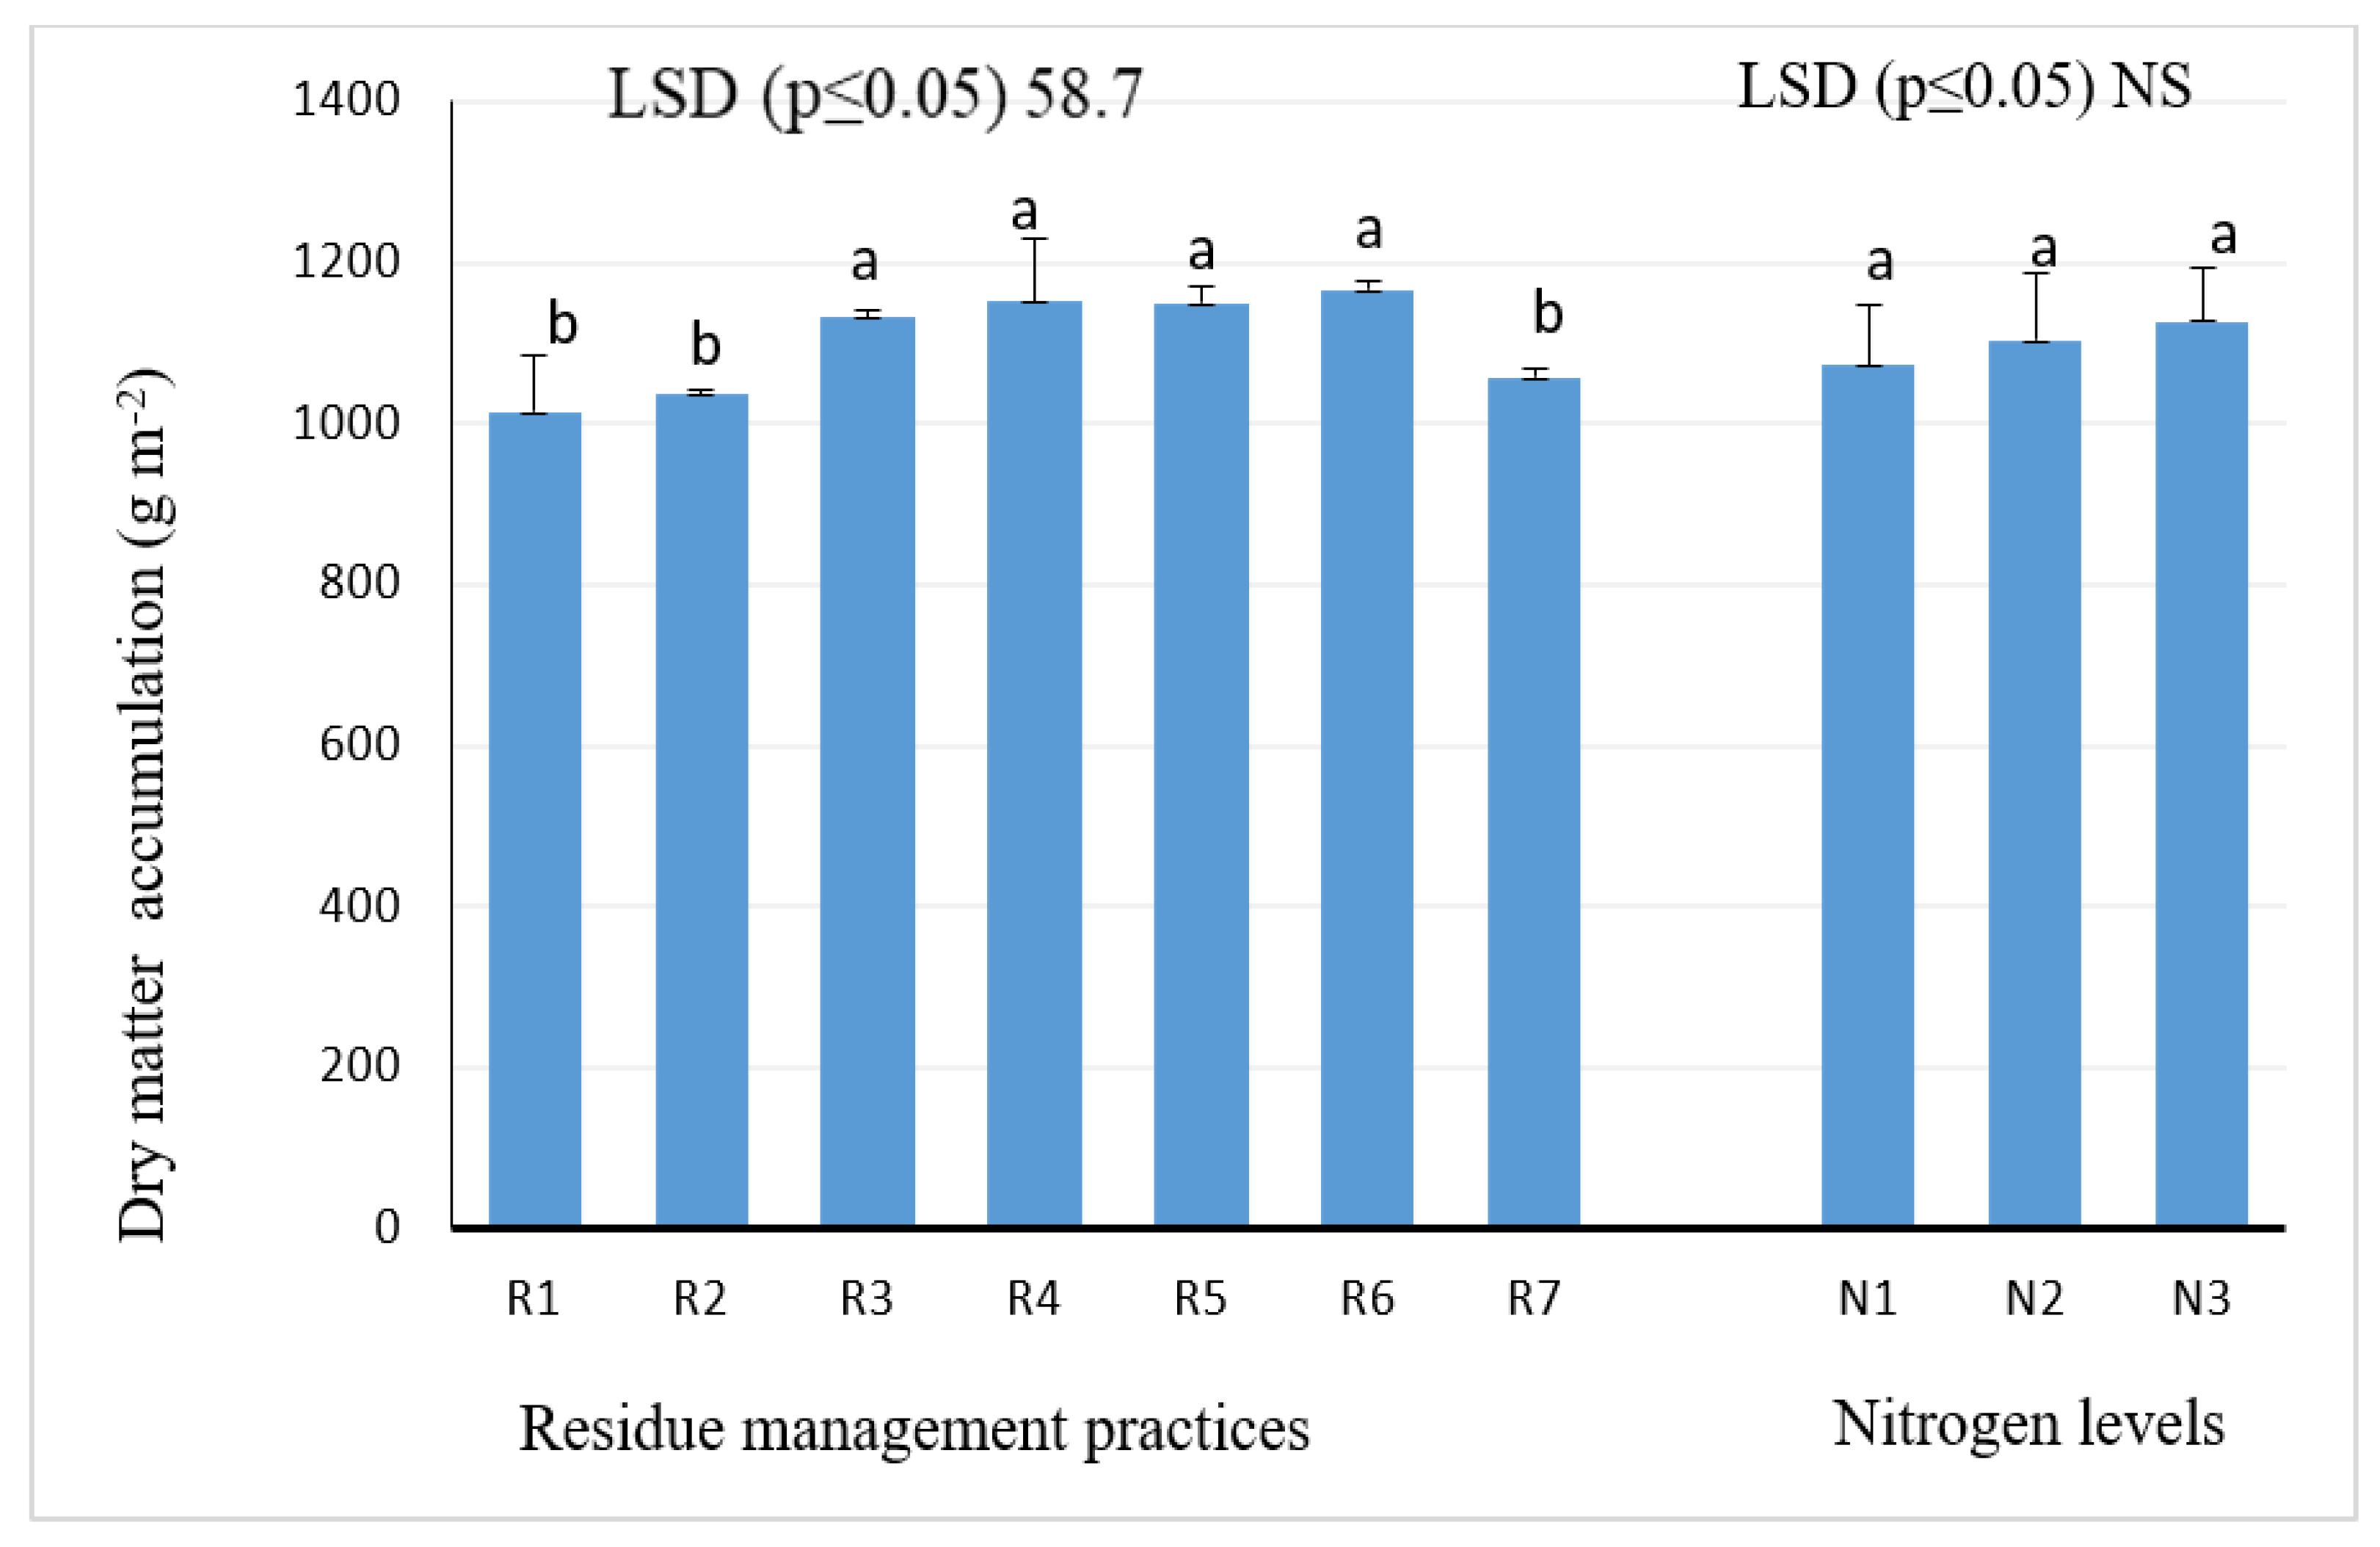
3.1. Growth Parameters

Different residue management practices significantly (p ≤ 0.05) affected growth parameters of wheat such as plant height and tiller density at harvest and chlorophyll content index, LAI, and PAR at 120 days after sowing of wheat (Table 4). Significantly higher plant height was observed in the treatments of the second and third scenarios compared to the first and fourth scenarios. The treatment combination of R5 exhibited maximum plant height at harvest and was significantly higher than R1 and R7.
Tiller density (378 m−2) was maximum in treatment R6 where rice and wheat straws were retained/incorporated in the field and were significantly higher over removal treatments R1 and R2 and straw burnt treatment R7. The chlorophyll content index recorded at 120 days was the highest in treatment R6 where both the straws were retained/incorporated and were on par with the treatments R3 and R4. The chlorophyll content index of other treatments was significantly lower than R6, R5 and R4. LAI and PAR after four months of sowing of wheat were statistically similar amongst those treatments where only rice straw or both rice and wheat straw were incorporated or retained on the surface and was significantly higher over treatments where either straw was removed or burnt (R1, R2 and R7) (Table 4). Amongst growth parameters, only the chlorophyll content index of wheat leaves increased significantly with increase in fertilizer N application rates (Table 4). Residue management significantly affected the mass of dry matter in both years, where N levels did not influence significantly (Figure 2).

3.2. Yield Attributes

Spike density, spike length and grains per spike of treatment R6 were significantly higher over straw removal treatments R1 and R2 or in straw burnt treatment R7 (Table 4). The test weight (1000-grain weight) was statistically similar in all the treatments. Nitrogen levels did not significantly affect yield attributes such as spike density, number of grains per spike and 1000-grain weight of wheat (Table 4). However, spike length increased significantly with the application of 150 kg N ha−1 compared to that application of N at lower than 150 kg.

3.3. Grain Yield

Different residue management practices influenced wheat grain yield significantly (Table 4). It was significantly higher in treatment R6 where the residue of both the crops was retained/incorporated compared to the treatments without straw or straw burnt, but it was statistically similar with all the treatments of the second scenario. The grain yield of wheat realized from the treatments of the first and fourth scenarios was statistically similar. Among the four scenarios, the grain yield of wheat obtained from the R1 treatments of the first scenario responded significantly to the fertilizer N application rate of 125 kg N ha−1, whereas the treatment R2 of the first scenario responded up to 150 kg N ha−1 (Table 5).
The treatments belonging to the second and third scenarios did not respond to the addition of more than 100 kg N ha−1, whereas the treatment of the fourth scenario also responded to up to 150 kg N ha−1 (Table 5). On an average, 10.6% higher yields along with savings of 25 to 50 kg N ha−1 were achieved by managing rice straw alone/or both straw to that without straw/straw burnt treatments in the field (Table 4). The average wheat grain yield in straw managed treatments R3, R4, R5 and R6 was 12% and 9.1% higher than treatments without straw R1 and R2 and straw burnt treatment R7, respectively. Wheat grain yield obtained from treatment R6 was 13.8% and 10.9% higher compared with the average yield of straw removal treatments R1 and R2 and straw burnt treatment R7, respectively (Table 4). Varying N levels could not significantly affect wheat grain yield and yield contributing parameters. Although the 1000-grain weight of wheat was improved with straw management practices and graded levels of N, the differences were non-significant.

3.4. Nutrient Uptake

The data revealed that nutrient uptake by grain and straw differed significantly with the different straw management techniques (Table 6). The highest N and K uptake (97.4 kg ha−1 and 23.3 kg ha−1) by grain were recorded in treatment R6. The P uptake by grain was highest (15.2 kg ha−1) in treatments R3 and R4 and was significantly higher than the treatments with no straw or straw burnt. The application of different levels of N also affected N uptake by grains and was highest at 150 kg N ha−1 application rate (92.8 kg ha−1). The uptake of N, P and K by straw was significantly higher in treatment R6 as compared to the treatments belonging to scenarios 1 and 4 but was statistically on par with all the treatments in scenario 2. The N uptake by straw improved significantly with the application of 150 kg N over its lower levels of application. However, the uptake of P as well as K was statistically similar at 125 or 150 kg N but significantly higher over 100 kg N treatment (Table 6).

3.5. Nitrogen Use Efficiency

The PFPN was significantly higher in R6 (46.2 kg grain kg N−1) than R1 and R2 or straw burnt treatment R7 but was statistically on par with R3 and R4 (Table 4). Maximum PFPN was achieved at 100 kg N ha−1 (52.6 kg grain kg N−1), which was significantly higher than the application of higher N levels.

3.6. Physical and Chemical Properties of Soil

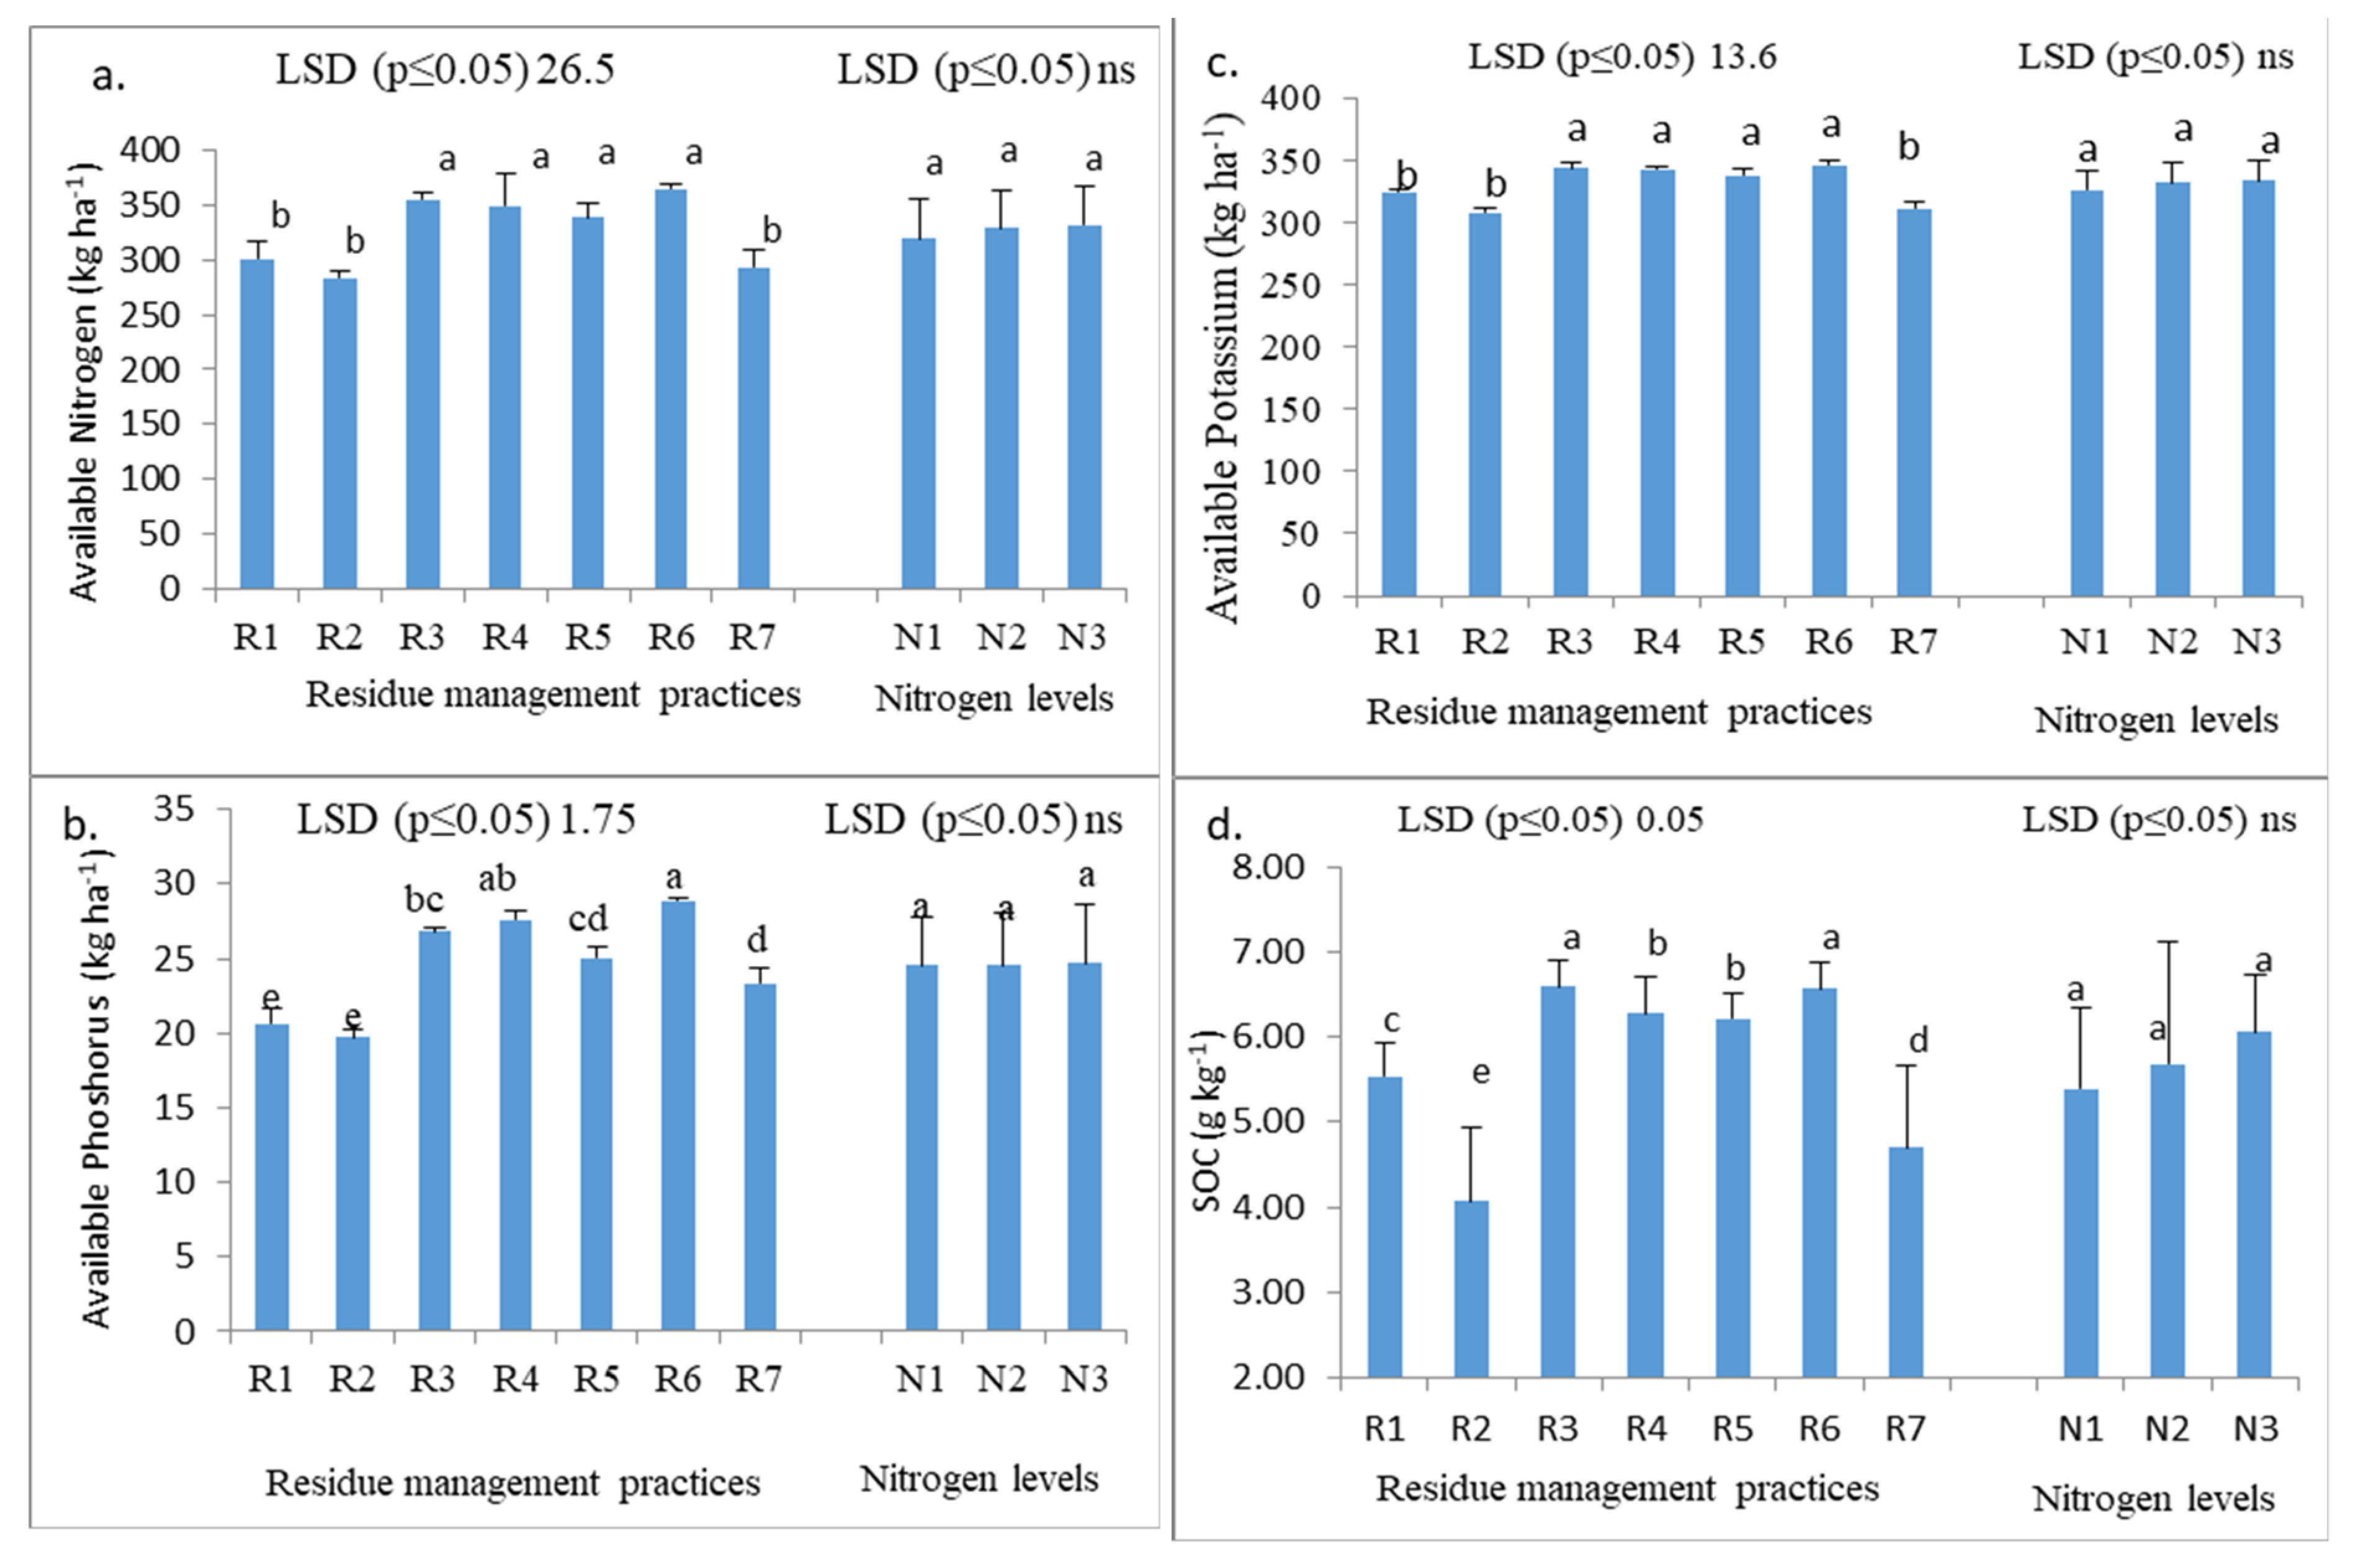
3.6.1. Available Nitrogen (N), Phosphorus (P) and Potassium (K)

The data given in Figure 3a–c clearly indicate that the different rice residue management practices significantly affected the availability of N, P and K in soil, and the treatment R6 exhibited the highest values of 365 kg ha−1, 28.9 kg ha−1 and 345.7 kg ha−1, respectively. The treatments where rice straw alone or both straws were managed in the soil resulted in 20.3, 27.8 and 8.9% more N, P and K availability in the soil to the treatments without any straw or straw burnt, respectively. The graded doses of N did not influence the nutrient availability in the soil considerably (Figure 3).

3.6.2. Soil Organic Carbon (SOC)

The SOC was also influenced significantly by different rice residue management practices. The SOC content after termination of the experiment (wheat of 2018–2019) was significantly higher in treatments with rice straw alone or with both straws incorporated/retained over the treatments with straw removed/straw burnt. On average, the SOC content of treatments with straw recycling increased by 33.9% over the average treatments without straw/straw burnt (Figure 3d). Application of N beyond 100 kg ha−1 did not increase SOC content (Figure 3d). The SOC content in surface soil under this treatment R6 increased markedly compared to treatments without straw/straw burnt (Figure 3d).

3.6.3. Soil Temperature

The data on soil temperature revealed that residue management practices significantly affected the soil temperature (Table 7). The minimum temperature increased and the maximum temperature decreased significantly with the recycling of crop residues. During emergence (up to 15 days after sowing) and at 30 DAS, the minimum temperature was lowest (14.1 °C and 9.9 °C) and maximum temperature was highest (22.3 °C and 19.4 °C), respectively, in R2. However, in residue retained treatments (R6, R3, R4 and R6), the minimum temperature during emergence and at 30 DAS increased and was highest under R3 treatment (15.2 °C and 10.9 °C), and the maximum temperature decreased to 19.7 °C and 16.6 °C in R6, respectively. A similar trend in soil temperature was observed at other dates of measurement.

3.6.4. Soil Bulk Density

The lowest bulk density was recorded in treatment R4 (1.31 g cm−3), and the highest was observed in treatment R1 (1.40 g cm−3) at 0–7.5 cm soil depth (Table 8). The bulk density increased with an increase in soil depth. At 7.5–15 cm, the lowest bulk density (1.35 g cm−3) was recorded in treatment R6 and the highest (1.43 g cm−3) was recorded in treatment R2.

3.6.5. Soil Penetration Resistance

Different crop residue management practices also significantly affected the soil penetration resistance (SPR) of the experimental field (Table 8). The SPR in the treatment R6 for 10, 20, 30 and 40 cm depth was found to be 250.0, 659.3, 495.7 and 552.3 kPa, respectively. The highest SPR was recorded in treatment R2.

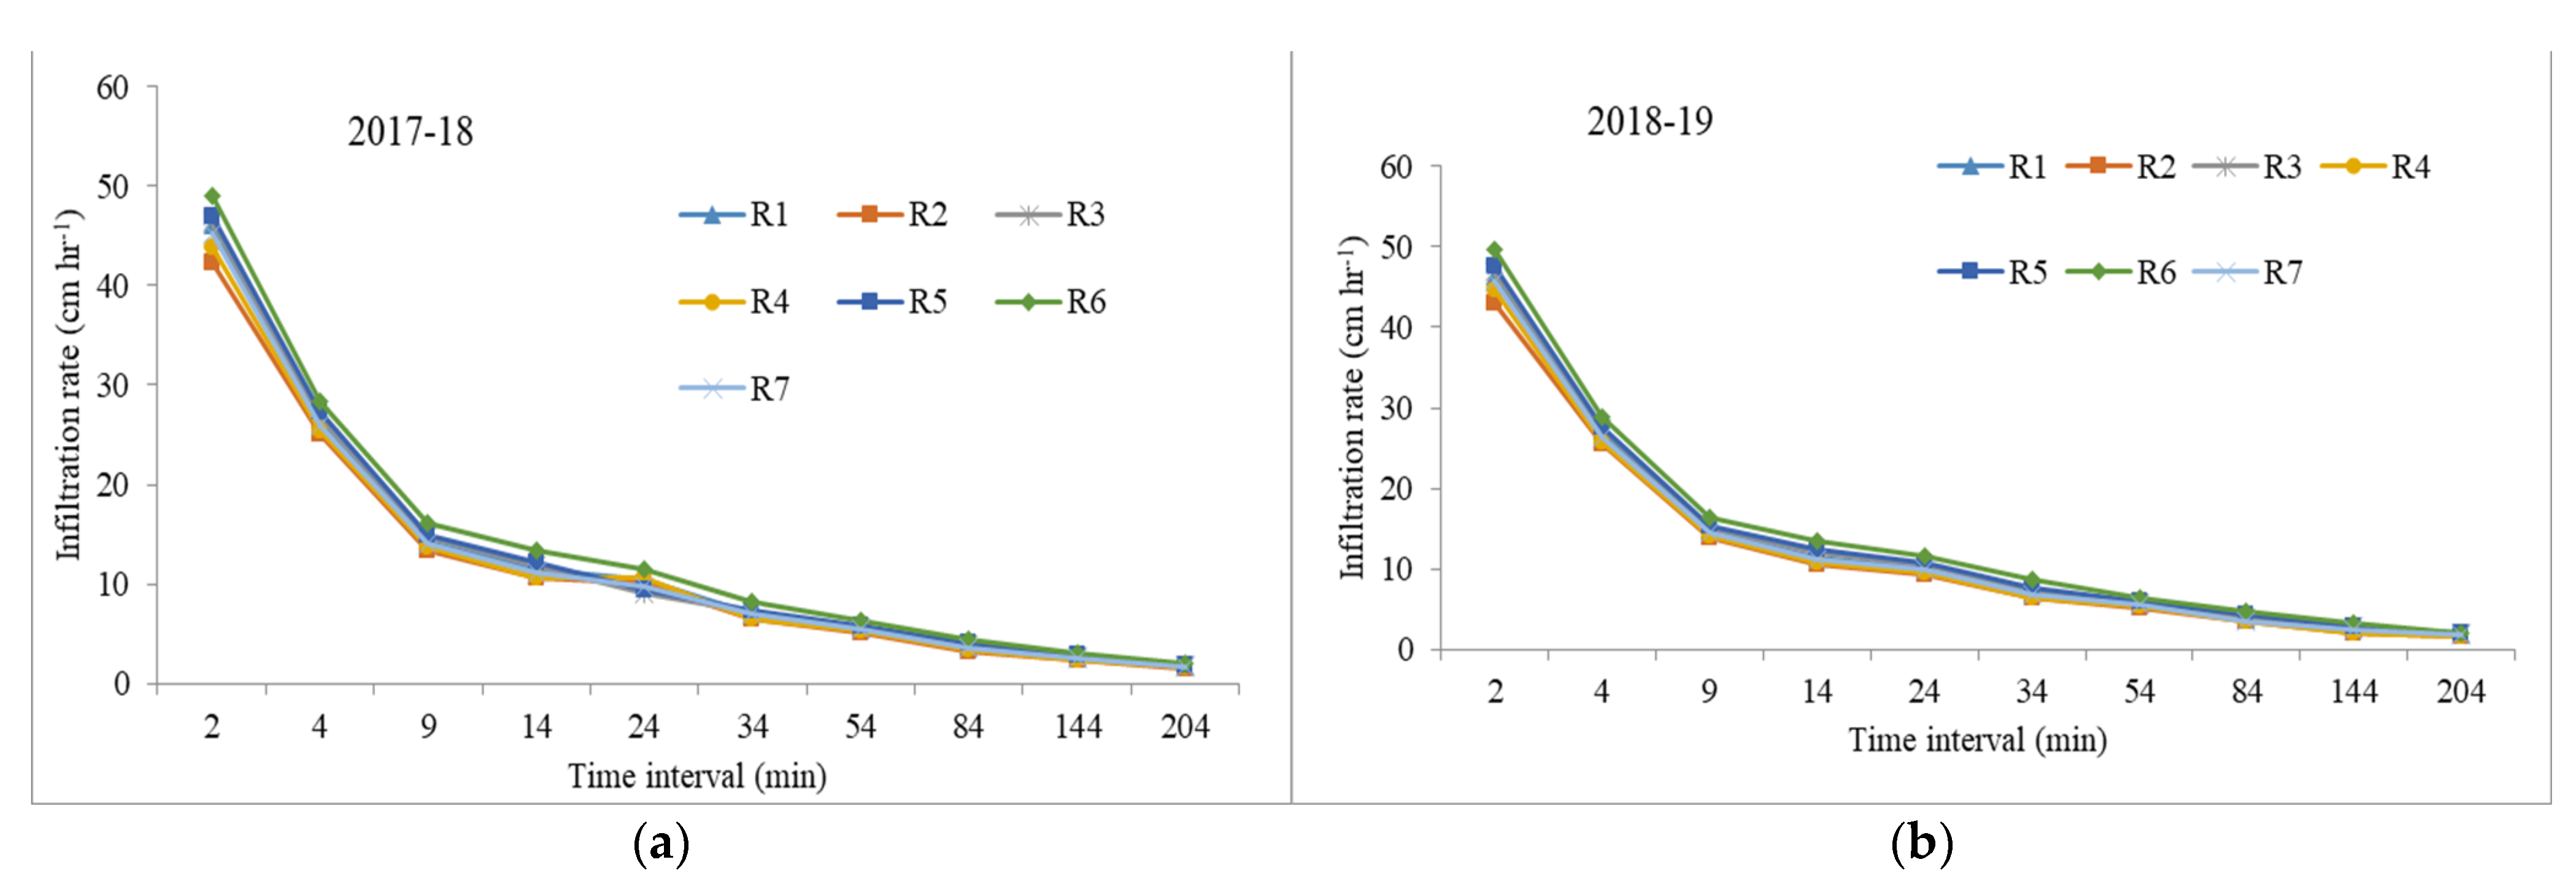
3.6.6. Infiltration Rate

Rice residue retention affected the water infiltration rate significantly (Figure 4). Residue incorporation or retention increased the infiltration rate. It was observed that the infiltration rate under treatment R6 was highest (2.0 cm hr−1) and was lowest in treatment R2, i.e., 1.5 cm hr−1 after 204 min during 2017–2018, and the respective values for these treatments were found to be 2.2 cm hr−1 and 1.6 cm hr−1 during 2018–2019.

3.7. Wheat Grain Quality

Residue management practices and N levels did not influence grain hardness significantly (Table 9). However, grain hardness numerically decreased with adding residue over treatments without residue. Grain hectoliter weight and protein content showed a non-significant effect of straw management treatments (Table 9). However, protein content was significantly affected by N levels. The data further revealed that at higher rates of N application (125 to 150 kg ha−1), the grain protein content also increased from 11.13 to 12.09%, respectively. The different crop residue management practices and N levels had a significant effect on grain protein yield (Table 9). Treatment R4 yielded maximum grain protein (644 kg ha−1). The application of 150 kg N ha−1 produced significantly higher grain protein yield than its lower N application levels.

3.8. Economics

The cost of cultivation was maximum in the conventional sowing of wheat treatment R2 (Table 10). The gross and net returns and BC ratio were maximum in treatment R6. Among the N levels, cost of cultivation, gross and net returns were highest under 150 kg N ha−1. However, the BC ratio was lowest in 150 kg N ha−1 (3.06).

4. Discussion

4.1. Growth Parameters, Dry Matter Production, Yield Attributes, and Grain Yield

Leaf area index (LAI), a common production ecology, varied with the tillage practices and crop residue incorporation. The increased level of total N in soil under reduced tillage might be due to crop residue retention with minimum tillage, which increases the SOM and microbial activity linked to nitrogen fixation [19]. The no-tillage practices have increased soil organic carbon by 17.0% and mulch incorporation by 20.1% compared with conventional tillage on loess soil [20]. The frequent tillage practices disrupted the soil aggregates, enhanced the mineralization of organic matter, and lowered the SOC and soil nitrogen content. The increase in nitrogen content in soil with crop residue retention effectively increased leaf area duration by increasing the LAI, resulting in increased plant growth parameters and crop yield [21]. Dry matter accumulation was significantly influenced by treatments where straw was either incorporated or retained on the surface of the soil (Figure 2). The dry matter accumulation was highest (1166 g m−2) in the treatment R6 followed by the treatments (with rice straw alone) R3, R4, and R5, respectively. It might be due to an increase in tiller density, which is consistent with the findings of [20]. Treatment R6 produced 13.8% and 10.9% higher grain yield of wheat as compared with the average yield of straw removal treatments and straw burnt treatment, respectively (Table 4). The average grain yield of wheat in straw managed treatments was 12% and 9.1% higher than treatments without straw and straw burnt, respectively, which was ascribed to an increase in yield contributing traits such as spike length, spike density, and number of grains per spike and test weight in wheat due to moderation of soil temperature, increased nutrient availability and soil moisture content due to residues retained at the surface [10,22,23,24,25,26]. The average values of yield attributing characters were lower in straw removal treatments, which contributed to the lower grain yield of wheat compared with straw burnt treatment and treatments with rice and wheat straw retained/incorporated (Table 4). Amongst the straw removal treatments, treatment R2 where rice was transplanted without wheat straw and the succeeding wheat was sown without rice straw resulted in a significantly higher grain yield of wheat over treatment R1. The lower wheat yield in R1 compared with R2 might be due to poor root growth and the decreased availability of soil N [27]. The increase in wheat grain yield under different straw management practices was in line with earlier research findings highlighting the yield advantage of residue mulch compared to no residue under irrigated conditions [24,25,28,29,30,31,32,33]. Varying levels of N did not have any significant effect on yield and yield attributes (spike density, spike length, grains per spike, and 1000-grain weight) of wheat. Our results are consistent with the findings from previous studies [19,34]. The higher N levels resulted in a decrease in yield attributes as reported by [34].
The significant interaction effect of crop residue management practices and fertilizer N on grain yield was attributed to more annual nutrient cycling in respective treatments where either rice straw alone or both rice and wheat straw has been incorporated or retained on the surface as mulch [11], higher photosynthetic activity of the plant [19,28], improved hydrothermal conditions due to residue retaining [29] and better utilization of applied N resulting in reduced losses due to leaching [19]. A significantly higher uptake of N, P, and K by grain with different crop residue management practices (Table 7) has been supported by [35] who studied the beneficial effect of residue on uptake of plant nutrients by the crop. These results showing the highest N uptake by grain with varying levels of N corroborate with earlier research findings [36].

4.2. N Use Efficiency

The partial factor productivity of N (PFPN) was significantly higher in R6 (46.2 kg grain kg N−1) than R1 and R2 or treatment (straw burnt) R7 but statistically on par with R3 and R4. Maximum PFPN was obtained with the lowest level of N (52.6 kg grain kg N−1) as compared to higher levels of N application.

4.3. Grain Quality

Both residue management practices and varying N levels did not affect grain hardness significantly, but there was a decreasing trend in grain hardness with straw recycling (Table 9). This might be due to an increase in soil moisture content due to a reduction in evaporation loss and an increase in SOC with the retention/incorporation of residue. The decrease in grain hardness of wheat was from 10.75 to 9.26 kg with the increase in mulch rate from 0 to 6 t ha−1 (10]. Different straw management treatments had a non-significant impact on the hectoliter weight and grain protein content of wheat grains (Table 9). No significant effect of mulch on protein content was also observed by [10]. However, these grain parameters were significantly affected by N levels. This might have occurred due to the greater absorption of N with an increase in N levels, as N is directly related to protein content and is in line with the findings of [33,34]. The significantly highest grain protein yield with the 150 kg N ha−1 as compared with the lower N application rates is mainly attributed to enhanced grain yield at a higher level of N application.

4.4. Physio-Chemical Soil Properties

The incorporation/retention of rice straw alone or both rice and wheat straw influenced the availability of nutrients such as N, P, and K in soil significantly over the straw removed treatments due to the supplementation of plant nutrients from the decomposition of incorporated/retained straw [20,37,38,39,40]. Straw management practices significantly affected the SOC content of surface soil (0–15 cm)over straw removal or straw burnt practices (Figure 3d), which might be due to the increased input of carbon with the addition of residues, whereas burning and residue removal leads to a decrease in the SOC content of the soil [1,41,42,43,44,45]. The significant increase in SOC content of the surface soil in treatment R6 compared with R1, R2 or R7 demonstrates the positive effects of zero till wheat on the build-up of SOC [46]. Zero tillage is well known for the decreased oxidation of SOC due to the protection of encapsulated SOM and thereby improves the SOC content [47,48], whereas conventional tillage accentuates the soil microbial decomposition of organic matter by exposing occluded organic matter [35,49]. The moderation in soil temperature in straw-retained treatments in our study might be due to the interception of solar radiation by residue retention as compared to residue removal treatments. The residue retention moderates soil temperature by about 2.0 to 3.3 °C [10,50]. The lowest bulk density and SPR were recorded in treatment R4 (1.31 g cm−3) and the highest was recorded in treatments with straw removal (1.40 g cm−3) at 0–7.5 cm soil depth (Table 8). It could be because of organic matter in soil and the prevention of crust formation on the soil surface by irrigation and rainfall impacts. A significant effect of rice straw mulching and incorporation on bulk density has been reported [10,51]. The lower SPR in residue-retained plots might be due to the lower bulk density [51,52]. The addition of crop residue in soil or surface cover as mulch prevents the direct impact of rain drops and reduces the chance of erosion through increasing water infiltration [53]. Infiltration is reported to be higher in no tillage than in tilled soils due to the large number of macropores and increased microbial activity [54]. Tripathi et al. [55] reported that in wheat season, the infiltration rate increased more than in the rice season both under zero tillage and conventional tillage because of the breakdown of aggregates in the puddled layer and subsurface compaction

5. Conclusions

The results showed that the conventional sowing of wheat after the incorporation of rice straw or zero-till sowing of wheat with rice straw as a surface mulch on a long-term basis improved wheat productivity, soil properties, nutrient uptake, and grain quality, with reduced N application. Furthermore, residue recycling in the rice–wheat system will help in improving air quality by avoiding open field residue burning in northwestern India. Conventional or zero-till sowing of wheat after straw burning or its removal reduces wheat yields, which cannot be compensated even after applying an additional 50 kg N ha−1 to the yields obtained with straw retention or incorporation. Overall, it is concluded that surface mulching with rice straw on a long-term basis is a good agronomic practice for sustaining wheat productivity, soil health, and nitrogen use efficiency.

Author Contributions

Conceptualization, J.K., R.K.G. and J.S.K.; methodology, J.K., J.S.K. and R.K.G.; software, R.K.G. and A.H.; validation, S.K., J.K., J.S.K. and R.K.G.; formal analysis, R.K.G. and A.H.; investigation, S.K., J.K., J.S.K. and R.K.G.; resources, H.S.; data curation, R.K.G. and A.H.; writing—original draft preparation, R.K.G., S.K. and J.K.; writing—review and editing, S.S., A.G., R.K.G., J.K. and A.H.; visualization, J.K., R.K.G. and J.S.K.; supervision, J.S.K.; project administration, J.S.K., A.G. and A.H.; funding acquisition, A.G., S.S., J.S.K. and A.H. All authors have read and agreed to the published version of the manuscript.

Funding

This research was funded by the Department of Agronomy, Punjab Agricultural University, Ludhiana-India. This research was also partially funded by the Taif University Researchers for funding this research with Supporting Project number (TURSP-2020/39), Taif University, Taif, Saudi Arabia.

Institutional Review Board Statement

Not applicable.

Informed Consent Statement

Not applicable.

Data Availability Statement

All data are available in the manuscripts.

Acknowledgments

The authors extend their appreciation to the Head of the Department of Agronomy, PAU, Ludhiana and the Taif University Researchers for funding this research with Supporting Project number (TURSP-2020/39), Taif University, Taif, Saudi Arabia for supporting the current research.

Conflicts of Interest

The authors would hereby like to declare that there is no conflict of interest in the article.

References

  1. Tirol-Padre, A.; Rai, M.; Kumar, V.; Gathala, M.; Sharma, P.C.; Sharma, S.; Nagar, R.K.; Deshwal, S.; Singh, L.K.; Jat, S.H.; et al. Quantifying changes to the global warming potential of rice wheat systems with the adoption of conservation agriculture in northwestern India. Agric. Ecosyst. Environ. 2016, 219, 56–67. [Google Scholar] [CrossRef]
  2. ICAR. Enhancing the Biodegradation of Rice Residue in Rice-Based Cropping Systems to Sustain Soil Health and Productivity; Technical Project Representative; Indian Council of Agricultural Research: New Delhi, India, 1999. [Google Scholar]
  3. Abdurrahman, M.I.; Chaki, S.; Saini, G. Stubble burning: Effects on health & environment, regulations and management practices. Environ. Adv. 2020, 2, 100011. [Google Scholar] [CrossRef]
  4. Ramanathan, V.; Carmichael, G. Global and regional climate changes due to black carbon. Nat. Geosci. 2008, 1, 221–227. [Google Scholar] [CrossRef]
  5. Sharma, S.; Singh, P.; Choudhary, O.P.; Neemisha. Nitrogen and rice straw incorporation impact on nitrogen use efficiency, soil nitrogen pools and enzyme activity in rice-wheat system in north-western India. Field Crops Res. 2021, 266, 108–131. [Google Scholar] [CrossRef]
  6. Sidhu, H.S.; Manpreet, S.; Yadvinder, S.; Blackwell, J.; Lohan, S.K.; Humphreys, E.; Jat, M.L.; Vicky, S.; Sarbjeet, S. Development and evaluation of the TurboHappy Seeder for sowing wheat into heavy rice residues in NW India. Field Crops Res. 2015, 184, 201–212. [Google Scholar] [CrossRef]
  7. Yadvinder, S.; Singh, M.; Sidhu, H.S.; Khanna, P.K.; Kapoor, S.; Jain, A.K.; Singh, A.K.; Sidhu, G.K.; Singh, A.; Chaudhary, D.P.; et al. Options for Effective Utilization of Crop Residues; Directorate of Research, Punjab Agricultural University: Ludhiana, India, 2010. [Google Scholar]
  8. Chakraborty, D.; Garg, R.N.; Tomar, P.K.; Singh, R.; Sharma, S.K.; Singh, R.K.; Trivedi, S.M.; Mittal, R.B.; Sharma, P.K.; Kamble, K.H. Synthetic and organic mulching and nitrogen effect on winter wheat (Triticumaestivum L.) in a semi-arid environment. Agric. Water Manage. 2010, 97, 738–748. [Google Scholar] [CrossRef]
  9. Balwinder-Singh; Humphreys, E.; Eberbach, P.L.; Katupitiya, A.; Yadvinder, S.; Kukal, S.S. Growth, yield and water productivity of zero-till wheat as affected by rice straw mulch and irrigation schedule. Field Crops Res. 2011, 121, 209–225. [Google Scholar] [CrossRef]
  10. Ram, H.; Dadhwal, V.; Vashist, K.K.; Kaur, H. Grain yield and water use efficiency of wheat (Triticumaestivum L.) in relation to irrigation levels and rice straw mulching in northwest India. Agric. Water Manage. 2013, 128, 92–101. [Google Scholar] [CrossRef]
  11. Fu, B.; Chen, L.; Huang, H.; Qu, P.; Wei, Z. Impacts of crop residues on soil health: A review. Environ. Pollut. Bioavailab. 2021, 33, 164–173. [Google Scholar] [CrossRef]
  12. Jackson, M.L. Soil Chemical Analysis; Prentice Hall of India, Private Limited: New Delhi, India, 1973. [Google Scholar]
  13. Bhatti, D.S.; Kaur, S. Package of Practices for Rabi Crops; Punjab Agricultural University: Ludhiana, India, 2017; pp. 1–18. [Google Scholar]
  14. Subbiah, B.V.; Asija, G.L. A rapid procedure for the estimation of available nitrogen in soils. Curr. Sci. 1956, 25, 259–260. [Google Scholar]
  15. Olsen, S.R.; Cole, C.V.; Waternade, F.S.; Dean, L.A. Estimation of available phosphorous in soil by extraction with sodium bicarbonate. USDA Circ. 1954, 939, 1–19. [Google Scholar]
  16. Blake, G.R.; Hartge, K.H. Bulk Density. In Methods of Soil Analysis: Part 1: Physical and Mineralogical Methods, 2nd ed.; Monograph Number 9; Klute, A., Ed.; ASA: Madison, WI, USA, 1986; pp. 363–375. [Google Scholar]
  17. Parr, J.R.; Bertrand, A.R. Water infiltration into soils. Adv. Agron. 1960, 12, 311–363. [Google Scholar]
  18. Gomez, K.A.; Gomez, A.A. Statistical Procedures for Agricultural Research, 2nd ed.; John Wiley and Sons: NewYork, NY, USA, 1984; 680p. [Google Scholar]
  19. Chen, H.; Lianga, Q.; Gonga, Y.; Kuzyakovb, Y.; Fana, M.; Plante, A.F. Reduced tillage and increased residue retention increase enzyme activity and carbon and nitrogen concentrations in soil particle size fractions in a long-term field experiment on Loess Plateau in China. Soil Till. Res. 2019, 194, 105296. [Google Scholar] [CrossRef]
  20. Jin, K.; Cornelis, W.M.; Schiettecatte, W.; Lu, J.; Yao, Y.; Wu, H.; Gabriels, D.; Neve, S.D.; Cai, D.; Jin, J.; et al. Effects of different management practices on the soil–water balance and crop yield for improved dryland farming in the Chinese Loess Plateau. Soil Till. Res. 2007, 96, 131–144. [Google Scholar] [CrossRef]
  21. Chen, H.Q.; Billen, N.; Stahr, K.; Kuzyakov, Y. Effects of nitrogen and intensive mixing on decomposition of 14C-labelled maize (Zea mays L.) residue in soils of different land use types. Soil Till. Res. 2007, 96, 114–123. [Google Scholar] [CrossRef]
  22. Dadhwal, V. Effect of Irrigation and Rice Straw Mulching on Performance of Wheat (Triticum aestivum L.). Master’s Thesis, Punjab Agricultural University, Ludhiana, India, 2011. [Google Scholar]
  23. Sandhu, O.S.; Gupta, R.K.; Thind, H.S.; Jat, M.L.; Sidhu, H.S.; Yadvinder, S. Evaluation of N fertilization management strategies for increasing crop yields and nitrogen use efficiency in furrow irrigated maize-wheat system under permanent raised bed planting. Arch. Agron. Soil Sci. 2020, 66, 1302–1317. [Google Scholar] [CrossRef]
  24. Soyeb, H.M.A. Effect of Straw Mulch on the Production of Wheat. Master’s Thesis, Bangladesh Agricultural University, Mymensingh, Bangladesh, 2011. [Google Scholar]
  25. Thind, H.S.; Sharma, S.; Yadvinder, S.; Sidhu, H.S. Rice–wheat productivity and profitability with residue, tillage and green manure management. Nutr. Cycl. Agroecosys. 2019, 113, 113–125. [Google Scholar] [CrossRef]
  26. Yadvinder, S.; Sidhu, H.S. Management of cereal crop residues for sustainable rice-wheat production system in the Indo-Gangetic Plains of India. Proc. Indian Natl. Sci. Acad. 2014, 80, 95–114. [Google Scholar] [CrossRef]
  27. Arora, V.K.; Sidhu, A.S.; Sandhu, K.S.; Thind, S.S. Effects of tillage intensity, planting time and nitrogen rate on wheat yield following rice. Expl. Agric. 2010, 46, 267–275. [Google Scholar] [CrossRef]
  28. Chandra, M. Effect of rice residue management on soil quality and productivity of wheat crop. Master’s Thesis, Indira Gandhi Krishi Vishwavidyalaya: Raipur, India, 2018. [Google Scholar]
  29. Dhar, D.; Datta, A.; Basak, N.; Paul, N.; Badole, S.; Thomas, T. Residual effect of crop residues on growth, yield attributes and soil properties of wheat under rice-wheat cropping system. Indian J. Agric. Res. 2014, 48, 373–378. [Google Scholar] [CrossRef]
  30. Dotaniya, M.L. Impact of crop residue management practices on yield and nutrient uptake in rice-wheat system. Curr. Adv. Agric. Sci. 2013, 5, 269–271. [Google Scholar]
  31. Grahmann, K.; Govaerts, B.; Simon, F.; Guzmán, C.; Soto, A.P.G.; Buerkert, A.; Verhulst, N. Nitrogen fertilizer placement and timing affects bread wheat (Triticum aestivum) quality and yield in an irrigated bed planting system. Nutr. Cycl. Agroecosys. 2016, 106, 185–199. [Google Scholar] [CrossRef]
  32. Sah, G.; Shah, S.C.; Sah, S.K.; Thapa, R.B.; McDonald, A.; Sidhu, H.S.; Gupta, R.K.; Tripathi, B.P.; Justice, S.E. Effects of tillage and crop establishment methods, crop residues, and nitrogen levels on wheat productivity, energy-savings and greenhouse gas emission under rice-wheat cropping system. Nepal J. Sci. Tech. 2014, 15, 1–10. [Google Scholar] [CrossRef]
  33. Singh, A.; Kumar, R. Nutrient uptake, root density and yield of direct seeded rice-wheat as affected by tillage systems and N levels. Indian J. Ecol. 2014, 41, 146–151. [Google Scholar]
  34. Ali, L.; Mohy-Ud-Din, Q.; Ali, M. Effect of different doses of nitrogen fertilizer on the yield of wheat. Int. J. Agric. Biol. 2003, 5, 438–439. [Google Scholar]
  35. Das, A.; Lal, R.; Patel, D.P.; Idapuganti, R.G.; Layek, J.; Ngachan, S.V.; Ghosh, R.G.; Bordoloi, J.; Kumar, M. Effects of tillage and biomass on soil quality and productivity of lowland rice cultivation by small scale farmers in North Eastern India. Soil Till. Res. 2014, 143, 50–58. [Google Scholar] [CrossRef]
  36. Rahman, M.A.; Sarker, M.A.Z.; Amin, M.F.; Jahan, A.H.S.; Akhter, M.M. Yield response and nitrogen use efficiency of wheat under different doses and split application of nitrogen fertilizer. Bangladesh J. Agric. Res. 2011, 36, 231–240. [Google Scholar] [CrossRef]
  37. Liu, D.; Shi, Y. Effects of different nitrogen fertilizer on quality and yield in winter wheat. Adv. J. Food Sci. Technol. 2013, 5, 646–649. [Google Scholar] [CrossRef]
  38. Mehta, A.; Kaur, M.; Gupta, S.K.; Singh, R.P. Physico-chemical, rheological and baking characteristics of bread wheat as affected by FYM and nitrogen management. Agril. Res. J. 2006, 43, 263–270. [Google Scholar]
  39. Yadvinder, S.; Singh, B.; Ladha, J.K.; Khind, C.S.; Khera, T.S.; Bueno, C.S. Effects of residue decomposition on productivity and soil fertility in rice-wheat rotation. Soil Sci. Soc. Am. J. 2004, 68, 854–864. [Google Scholar] [CrossRef]
  40. Yadvinder, S.; Gupta, R.K.; Singh, J.; Singh, G.; Singh, G.; Ladda, J.K. Placement effects on rice residue decomposition and nutrient dynamics on two soil types during wheat cropping in rice-wheat system in northwestern India. Nutr. Cycl. Agroecosyst. 2010, 88, 471–480. [Google Scholar] [CrossRef]
  41. Sidhu, B.S.; Beri, V. Rice residue management: Farmer’s Perspective. Indian J. Air Pollut. Control. 2008, 8, 61–67. [Google Scholar]
  42. Verma, N.K.; Pandey, B.K. Effect of varying rice residue management practices on growth and yield of wheat and soil organic carbon in rice-wheat sequence. Global J. Sci. Frontier Res. Agric. Vety. Sci. 2013, 13, 33–38. [Google Scholar]
  43. Bhattacharyya, R.; Kundu, S.; Pandey, S.C.; Singh, K.P.; Gupta, H.S. Tillage and irrigation effects on crop yields and soil properties under the rice-wheat system in the Indian Himalayas. Agric. Water Manag. 2008, 95, 993–1002. [Google Scholar] [CrossRef]
  44. Govaerts, B.; Sayre, K.D.; Goudeseune, B.; DeCorte, P.; Lichter, K.; Dendooven, L.; Deckers, J. Conservation agriculture as a sustainable option for the central Mexican highlands. Soil Till. Res. 2009, 103, 222–230. [Google Scholar] [CrossRef]
  45. Kushwaha, C.P.; Tripathi, S.K.; Singh, K.P. Soil organic matter and water stable aggregates under different tillage and residue conditions in a tropical dry land agroecosystem. Appl. Soil Ecol. 2001, 16, 229–241. [Google Scholar] [CrossRef]
  46. Lu, J.; Hirasawa, T. Study on intermittent irrigation for paddy rice: I. Water use efficiency. Pedosphere 2001, 11, 48–56. [Google Scholar]
  47. Benbi, D.K.; Singh, P.; Toor, A.S.; Verma, G. Manure and fertilizer application effects on aggregate and mineral-associated organic carbon in a loamy soil under rice-wheat system. Commun. Soil Sci. Plant Anal. 2016, 47, 1828–1844. [Google Scholar] [CrossRef]
  48. Singh, P.; Benbi, D.K. Soil organic carbon pool changes in relation to slope position and land-use in Indian lower Himalayas. Catena 2018, 166, 171–180. [Google Scholar] [CrossRef]
  49. Pinheiro, E.F.M.; Pereira, M.G.; Anjos, L.H.C. Aggregates distribution and soil organic matter under different tillage system for vegetable crops in a Red Latosol from Brazil. Soil Till. Res. 2004, 77, 79–84. [Google Scholar] [CrossRef]
  50. Gupta, P.K.; Sahai, S.; Singh, N.; Dixit, C.K.; Singh, D.P.; Sharma, C.; Tiwari, M.K.; Gupta, R.K.; Garg, S.C. Residue burning in rice–wheat cropping system: Causes and implications. Curr. Sci. 2004, 87, 1713–1717. [Google Scholar]
  51. Zhao, X.; Yuan, G.; Wang, H.; Lu, D.; Chen, X.; Zhou, J. Effects of full straw incorporation on soil fertility and crop yield in rice-wheat rotation for silty clay loamy cropland. Agronomy 2019, 9, 133. [Google Scholar] [CrossRef]
  52. Bijay-Singh; Shan, Y.H.; Johnson-Beebout, S.E.; Yadvinder, S.; Buresh, R.J. Crop residue management for lowland rice-based cropping systems in Asia. Adv. Agron. 2008, 98, 117–199. [Google Scholar]
  53. Singh, R.; Serawat, M.; Singh, A.; Babli. Effect of tillage and crop residue management on soil physical properties. J. Soil Salin. Water Qual. 2018, 10, 200–206. [Google Scholar]
  54. McGarry, D.; Bridge, B.J.; Radford, B.J. Contrasting soil physical properties after zero and traditional tillage of an alluvial soil in the semi-arid subtropics. Soil Till. Res. 2000, 53, 105–115. [Google Scholar] [CrossRef]
  55. Tripathi, R.P.; Gaur, M.K.; Rawat, M.S. Puddling effects on soil physical properties and rice performance under shallow water table conditions of Tarai. J. Indian Soc. Soil Sci. 2003, 51, 118–124. [Google Scholar]
Figure 1. Standard meteorological weekly total rainfall and average maximum and minimum temperatures during the crop season of 2017–2018 and 2018–2019.
Land 11 01693 g001
Figure 2. Dry matter accumulation at maturity of wheat as influenced by residue management practices and nitrogen levels (data pooled over 2 years). The values with the same superscript letter do not differ significantly at the 5% level using Duncan’s multiple range test.
Land 11 01693 g002
Figure 3. Effect of crop residue management practices and fertilizer nitrogen levels on available soil (a) nitrogen, (b) phosphorus, (c) potassium, and (d) SOC at harvest of wheat in rice–wheat cropping system (data pooled over two years). The values with the same superscript letter do not differ significantly at the 5% level using Duncan’s multiple range tests.
Land 11 01693 g003
Figure 4. Effect of different crop residue management practices on soil infiltration rate at harvest of wheat in rice–wheat cropping system during: (a) 2017–2018 and (b) 2018–2019.
Land 11 01693 g004
Table 1. Details of field treatments applied under rice–wheat cropping system.
TreatmentsAbbreviations
Main Plot: Residue Management Practices
Scenario 1. Planting after removal of rice and wheat straw residue
Puddled transplanted rice + zero till drill sown wheatR1
Puddled transplanted rice + conventional tillage sown wheat R2
Scenario 2. Planting with rice residue in wheat and removal of wheat straw in rice
Puddled transplanted rice + zero till sown wheat with Happy Seeder rice straw as mulch R3
Puddled transplanted rice + conventional tillage sown wheat and straw incorporation with disc harrowR4
Puddled transplanted rice + zero till sown wheat and straw incorporation with rotavatorR5
Scenario 3. Planting with both rice and wheat residue
Puddled transplanted rice + zero till sown wheat with Happy Seeder with rice straw as mulchR6
Scenario 4. Planting after partial burning of rice and wheat residue
Puddled transplanted rice + zero till drill sown wheat (Farmer practice)R7
Sub-plot: Fertilizer N levels (kg ha−1)
I. 100N1
II. 125N2
III. 150N3
Table 2. Amount of crop residue and nutrient addition through residue in different treatments.
TreatmentsAmount of Crop Residue Added (Mg ha−1)Nutrient Addition with Residue (kg ha−1)
RiceWheatNPK
Residue management practices
R1-----
R2-----
R38.21-44.97.79222.0
R48.27-45.27.85223.6
R58.27-45.27.85223.6
R68.336.6945.6 + 26.87.90 + 8.03225.2 + 80.3
R7-----
Table 3. Analysis of variance (degree of freedom and F value) of growth parameters of wheat (data pooled over two years).
SourceDFF Ratio
Plant Height (cm)Tillers Density
(m−2)
Chlorophyll Content IndexLAIPAR InterceptionSpikes m−2Spike Length (cm)Grains
Spike−1
1000- Grain Weight (g)Grain Yield
(Mg ha−1)
PFP
(kg Grain
kg N−1)
At HarvestAt 120 DAS
Rep21.443.044.320.1112.961.520.664.010.601.891.94
Y131.01 *17.91 ns53.74 *4.46 ns46.04 *12.95 ns3.07 ns9.21 ns0.04 ns6.79 ns6.66 ns
R63.31 *9.28 *11.60 *6.54 *23.45 *8.90 *16.30*2.93 *0.46 ns9.34 *10.39 *
YxR60.70 ns0.15 ns0.10 ns0.10 ns0.22 ns0.16 ns0.45 ns0.02 ns0.02 ns0.13 ns0.13 ns
N20.49 ns2.81 ns59.9 *1.96 ns2.63 ns1.99 ns4.90 *2.70 ns0.01 ns1.97 ns2687.5 *
RxN120.09 ns0.03 ns1.25 ns0.05 ns0.60 ns0.04 ns1.33 ns0.02 ns0.04 ns4.83 *8.82 *
YxN2−0.00 ns0.00 ns2.88 ns0.00 ns0.06 ns0.02 ns0.44 ns0.00 ns0.00 ns0.02 ns4.40 *
YxRxN120.06 ns0.03 ns1.30 ns0.03 ns0.46 ns0.03 ns0.90 ns0.00 ns0.04 ns0.11 ns0.12 ns
Rep—replications, Y—years, R—residue addition, N—nitrogen levels, ns—non-significant, * Values are statistically significant at p ≤ 0.05).
Table 4. Effect of crop residue management practices and N levels on growth, yield parameters, yield and partial factor productivity (PFP) of wheat in rice–wheat cropping system (data pooled over 2 years).
TreatmentsPlant Height (cm)Tillers (m−2)Chlorophyll Content IndexLAIPAR InterceptionSpike Density m−2Spike Length (cm)Grains
Spike−1
1000- Grain weight (g)Grain Yield
(Mg ha−1)
PFP
(kg Grain kg N−1)
Crop residue management practices
R192.9 c339 d19.2 c2.86 b75.3 b331 d10.7 b43.4 c39.3 a4.91 b40.3 b
R295.5 ab351 cd19.3 c2.97 b75.1 b352 c10.3 b44.9 bc39.1 a4.95 b40.5 b
R395.1 ab368 ab22.1 ab3.46 a82.4 a360 abc11.7 a49.8 ab41.1 a5.41 a44.5 a
R496.0 a370 ab22.3 ab3.54 a81.9 a368 ab11.9 a50.3 ab40.9 a5.56 a45.8 a
R596.4 a371 ab21.6 b3.66 a83.3 a365 ab11.5 a50.7 ab39.9 a5.50 a45.3 a
R694.5 abc378 a23.1 a3.74 a84.1 a367 a11.9 a52.2 a41.3 a5.61 a46.2 a
R794.0 bc361 bc19.4 c3.04 b75.8 b354 bc10.7 b45.5 bc39.7 a5.06 b41.5 b
LSD (p ≤ 0.05)1.912.81.420.412.46120.475.8NS0.292.34
Nitrogen levels
N194.8 a358 a18.9 a3.23 a79.3 a350 a11.1 b46.5 a40.1 a5.26 a52.6 a
N295.2 a363 a20.7 a3.31 a79.3 a354 a11.2 ab48.0 a40.2 a5.30 a42.4 b
N394.8 a369 a23.3 a3.43 a80.5 a358 a11.4 a49.9 a40.2 a5.30 a35.4 c
LSD (p ≤ 0.05)NSNS0.81NSNSNS0.2NSNSNS0.5
InteractionNSNSNSNSNSNSNSNSNS0.111.25
The values with the same superscript letter (a, b, c) do not differ significantly at the 5% level using Duncan’s multiple range test.
Table 5. Interactive effect of crop residue management practices and nitrogen levels on grain yield (Mg ha−1) of wheat (data pooled over 2 years).
TreatmentsNitrogen Levels
N1N2N3
R14.79 h4.94 g5.03 f
R24.83 g4.95 f g5.07 f
R35.44 de5.42 de5.39 e
R45.61 a5.57 bc5.50 bcde
R55.54 bcd5.52 bcd5.45 cde
R65.70 a5.62 ab5.52 bcd
R74.935.075.18
LSD (p ≤ 0.05) (R × N)0.12
The values with the same superscript letter do not differ significantly at the 5% level using Duncan’s multiple range test.
Table 6. Effect of crop residue management practices and nitrogen levels on nutrient uptake (kg ha−1) by grain and straw of wheat in rice–wheat cropping system (pooled data of 2 years).
TreatmentsGrainStraw
NPKNPK
Residue management practices
R181.3 b11.6 b19.1 b28.3 c2.86 b54.5 c
R278.4 b11.7 b18.7 b28.1 c2.84 b55.5 c
R394.2 a15.2 a22.0 a33.5 a3.53 a66.2 ab
R495.4 a15.2 a23.3 a33.3 ab3.38 a65.3 ab
R593.7 a14.2 a22.3 a32.8 ab3.41 a65.9 ab
R697.4 a14.8 a23.3 a34.6 a3.63 a70.8 a
R782.6 b12.3 b20.3 b29.7 bc3.03 b59.4 bc
LSD (p ≤ 0.05)6.31.41.63.60.327.5
Fertilizer N levels
N185.0 c13.0 a21.2 a30.3 b3.07 b59.6 b
N289.2 b13.9 a21.1 a31.3 ab3.27 ab62.7 ab
N392.8 a13.8 a21.5 a32.7 a3.3765.2 a
LSD (p ≤ 0.05)2.9NSNS1.40.213.5
InteractionNSNSNSNSNSNS
The values with the same superscript letter do not differ significantly at the 5% level using Duncan’s multiple range test.
Table 7. Effect of crop residue management practices on soil temperature during wheat in rice–wheat cropping system (pooled data of 2 years).
TreatmentsUp to Emergence30 DAS60 DAS90 DASAt Harvest
minmaxminmaxmaxmaxmax
R114.2 bc21.7 a9.9 b18.9 a14.6 ab15.1 ab30.0 a
R214.1 c22.3 a9.9 b19.4 a14.7 a15.3 a29.8 ab
R315.2 a20.1 c10.9 a16.8 c13.5 c14.4 c29.3 bc
R414.4 bc21.8 a10.1 b17.6 b14.2 ab14.7 b29.5 abc
R514.5 b21.0 b10.6 a17.8 b14.1 b14.6 bc29.5 abc
R615.1 a19.7 c10.7 a16.6 c13.5 c14.3 c29.2 c
R714.1 c21.7 a9.9 b19.2 a14.6 ab15.0 ab29.9 ab
LSD (p ≤ 0.05)0.30.60.30.70.50.50.5
The values with the same superscript letter do not differ significantly at the 5% level using Duncan’s multiple range test.
Table 8. Effect of crop residue management practices on soil bulk density and penetration resistance at harvest of wheat in rice–wheat cropping system (pooled data of 2 years).
TreatmentsBulk Density (g cm−3)Soil Penetration Resistance (kPa)
Soil Depth (cm)Soil Depth (cm)
0–7.57.5–1510203040
R11.40 a1.42 a369 ab944 ab688 a648 a
R21.40 a1.43 a452 a1003 a712 a658 a
R31.33 c1.37 bc262 c693 c522 bc548 a
R41.31 c1.37 bc268 c673 c523 bc551 a
R51.36 b1.41 a317 bc769 bc648 a561 a
R61.32 c1.35 c250 c659 c496 c552 a
R71.38 ab1.40 ab362 b781 bc665 ab547 a
LSD (p ≤ 0.05)0.030.0388190143NS
The values with the same superscript letter do not differ significantly at the 5% level using Duncan’s multiple range test.
Table 9. Effect of crop residue management practices and nitrogen levels on quality parameters and yield of wheat in rice–wheat cropping system (pooled data of 2 years).
TreatmentsGrain Hardness (kg)Hectoliter Weight (kg Hectoliter−1)Protein Content (%)Grain Protein Yield (kg ha−1)
Residue management practices
R110.6 a75.9 a11.7 a574 b
R210.6 a75.7 a11.7 a581 b
R310.6 a76.3 a11.6 a627 a
R410.6 a76.4 a11.6 a645 a
R510.6 a76.1 a11.6 a640 a
R610.5 a76.5 a11.5 a644 a
R710.5 a76.0 a11.6 a589 b
LSD (p ≤ 0.05)NSNSNS31.2
Fertilizer N levels
N110.5 a76.0 a11.1 c587 c
N210.6 a76.1 a11.6 b615 b
N310.7 a76.3 a12.1 a641 a
LSD (p ≤ 0.05)NSNS0.1911.1
InteractionNSNSNSNS
The values with the same superscript letter do not differ significantly at the 5% level using Duncan’s multiple range test.
Table 10. Effect of crop residue management practices and nitrogen levels on the economics of wheat in rice–wheat cropping system (pooled data of 2 years).
TreatmentsCost of CultivationGross ReturnsNet ReturnsB:C
($ha−1)
Residue management practices
R1393.0 a1397.4 b1004.4 c2.55 c
R2410.6 a1410.9 b1000.3 c2.43 c
R3354.9 a1539.9 ab1185.1 a3.34 a
R4375.9 a1570.4 ab1194.5 a3.18 b
R5352.3 a1563.8 ab1211.5 a3.44 a
R6354.9 a1593.3 a1238.4 a3.49 a
R7346.3 a1439.5 b1093.2 b3.16 b
LSD (p ≤ 0.05)NS53.953.90.15
Fertilizer N levels
N1365.6 a1491.7 b1126.1 a3.10 a
N2369.7 a1504.4 ab1134.7 a3.09 a
N3373.7 a1510.4 a1136.7 a3.06 a
LSD (p ≤ 0.05)NS12.6NSNS
InteractionNS33.433.40.09
The values with the same superscript letter do not differ significantly at the 5% level using Duncan’s multiple range test.
Publisher’s Note: MDPI stays neutral with regard to jurisdictional claims in published maps and institutional affiliations.

