Article

How Can Macro-Scale Land-Use Policies Be Integrated with Local-Scale Urban Growth? Exploring Trade-Offs for Sustainable Urbanization in Xi’an, China

1
School of Environmental and Municipal Engineering, Xi’an University of Architecture and Technology, Xi’an 710055, China
2
Department of Geography and Environmental Sustainability, The University of Oklahoma, Norman, OK 73019, USA
*
Author to whom correspondence should be addressed.
Land 2022, 11(10), 1678; https://doi.org/10.3390/land11101678
Submission received: 20 July 2022 / Revised: 19 September 2022 / Accepted: 23 September 2022 / Published: 28 September 2022
(This article belongs to the Section Urban Contexts and Urban-Rural Interactions)

Abstract

:
Rapid urbanization results in farmland loss, habitat fragmentation, biodiversity decrease, and greenhouse gas emissions. Land-use policies and planning as administrative means are used to guide sustainable urban development and to balance the location of urban expansion and agricultural activities. To better understand the future implications of a variety of land-use policies, we used a FUTURES model scenario analysis to analyze the potential future patterns of urban areas and the loss and fragmentation of farmland and natural resources at the local level for Xi’an. We tested representative indicators of sustainable urbanization according to Plan 2014–2020. We found that scenarios representing the integration of several policies showed both synergetic spatial patterns and conflicting outcomes. The simulated land-use patterns of urban growth resulting from the combination of policies, were the most likely to support progress toward a livable compact city and natural resources’ conservation. These findings underscore the importance of simulation modeling and scenario analyses to quantify and visualize the results from policies and planning to support sustainable urbanization. Specifically, they show the value in simulation modeling for integrating information across scales, i.e., combining macro-level land-use policies with local-level spatial heterogeneity in socio-ecological settings, for identifying actionable planning solutions. Hence, these research results provide scientific support for land-use policy revision and implementation in Xi’an, as well as a reference point for other urbanizing cities in China.

1. Introduction

With Asia’s population projected to reach up to 5 billion by 2030 [1], land-use activities are driven by the need for fiber, food, shelter, and infrastructure. These activities result in an expansion of urban areas, farmland loss, habitat fragmentation, biodiversity decrease, and greenhouse gas emissions [2,3]. In countries with lower population densities, urbanization policies are often studied from the perspective of sustainability to achieve long-term “win-win-win” benefits for the economy, society, and the environment [4,5]. However, in countries with high population densities such as China, studies frequently emphasize the land competition between the agricultural sector and food security on the one hand and urbanization on the other hand [6,7]. Because of their co-location, there is often competition between the protection of highly productive agricultural areas and land demand for urban development [8,9], as the replacing of highly productive farmland with lower-productivity farmland impacts mid- to long-term food security [10,11]. This competition creates an urgent need for actionable studies of land-use policies that guide and sustainably shape urban expansion and identify the trade-offs between future urbanization and agricultural activities. To coordinate the trade-offs between farmland protection and continuing urbanization, the Chinese government has established the, historically, strictest of policies for cultivated land protection, including the implementation of a 1.8 billion mu farmland limit [8,12] and the introduction of a quota land system for both farmland and construction.
Sustainable urbanization has become an inevitable focus in the context of rapid urban expansion and a large body of literature exists studying efforts to promote sustainable urbanization [13,14]. These studies not only provide a better understanding of urban expansion patterns and mechanisms, but also provide science-based guidance for land-use policy making and planning [15,16]. Additionally, urbanization is frequently described as the process of urban-rural transition, i.e., the increase of population density in rural settlements and urbanization [17,18]. Hence, China’s National Development and Reform Commission put forward the National New-Type Urbanization Plan (2014–2020) in 2014 (in the present study this is referred to as Plan 2014–2020), which aims to refine the existing urbanization processes to further promote sustainable development [19]. In this context, a new macro-level land-use policy of combining the expansion of urban land with a reduction of development area has gained attention as a desirable measure required to improve policy outcomes [20]. However, land-use policies of central governments specified at the macro-level include limited consideration of regional to local heterogeneities and disparities, resulting in unforeseen issues emerging during rapid urbanization [17]. Hence, it is necessary and important to downscale macro-level land-use policies and consider the socio-environmental heterogeneity of a specific study region to fully understand the policies’ micro-level outcomes. This can be achieved with data-driven spatiotemporal model simulations and analyses of landscape patterns [21,22,23].
There is an urgent need for studies of current and future land-use change that consider regional and local geographies, to assess the micro-level outcomes of macro-level land policies in China, especially considering both farmland conservation and conservation of natural vegetation. Hence, the objective of our research is to use spatiotemporal model simulation to produce actionable results that will inform land-use policymakers, planners, and managers at the micro-level. We use historical land-use/cover data for Xi’an, the capital of Shaanxi Province in China, from 1980 to 2015 to parameterize a spatially explicit urban simulation model for analyzing potential future changes in land-use and the policy dimensions driving these changes, focusing especially on the competition for land among farmlands, forested areas, grasslands, and developed areas (urban and rural). Based on observed land-use change dynamics resulting from the interplay among physical, social, and economic drivers, this analysis visualizes and quantifies the potential future urban land-use configurations. This helps to formulate strategies for sustainable farmland use and conservation of natural vegetation and refine macro-level policies that consider regional down to local characteristics.

2. Materials and Methods

We used the FUTURES model [24,25] to assess the potential impact of rapid urban expansion on the competition for land among farmlands, forested areas, grasslands, and developed areas (urban and rural) resulting from an integration of macro-level policies with local level heterogeneities. FUTURES is a multilevel modeling framework that combines field- and object-based representations for simulating landscape changes. Using FUTURES, we carried out spatiotemporal scenario simulations of urban expansion. To inform planning policies at the city-level, we were especially interested in exploring the impact of macro-level urban planning policies on regional- to local-level land-use change outcomes. We embedded land-use policies and planning strategies into scenario assumptions to then project and visualize potential future urban configurations resulting from the implementation of these scenarios (i.e., model simulations). We tested urban expansion under three different scenarios, including the Stimulus Scenario (STI), the Infill Scenario (IN), and the Decreased Density Scenario (DD). We also tested four combinations of those three scenarios. All simulations cover the period 2015–2030 with an annual time step. We compared the simulation results for these scenarios to a business-as-usual or Status Quo Scenario (SQ; i.e., a scenario assuming continuation of historical trends) as a reference. We used landscape indices, land-use change metrics, and quantifications of the resulting area loss of the area covered with natural vegetation and farmland to analyze the outcomes of the urban growth patterns projected under the different scenarios. The resulting quantifications in the form of metrics and maps allowed us to better understand the urban-rural conversion outcomes as well as the sustainability implications of a variety of land-use strategies and planning policies at the local level.

2.1. Study Area

This study covers the municipal administrative area of Xi’an, located in Shaanxi Province, China (Figure 1), which is home to a population of 8.62 million [26]. The municipal administrative area covers 10,108 km2 with an urban core area of 490 km2. There are 11 districts and two counties located in this municipal administrative area. Xi’an is in the central Guanzhong Plain Basin, with the Weihe River to the north and the Qinling Mountains to the south (Figure 1). The main land-use/cover categories in the northern part of the study area are developed land, cultivated land (farmland), and water bodies, accounting for 45% of the total study area. The remainder of the study area, mainly located south of the city core, is covered by forests, grasslands, and undeveloped land (Figure 1).
The unique characteristics such as the geography of the landscape and the presence of historical and heritage sites in Xi’an, mean that the study is of great significance and practicality so that the exploration and early adoption of actionable results through scenario-based simulation during rapid urbanization is made possible.

2.2. Modeling Urban Land-Use Change

We used the spatiotemporal FUTURES model to simulate urbanization in Xi’an from 2015 to 2030 with an annual simulation time step. FUTURES has been validated [24], tested [27], and used for a variety of applications across a variety of study areas [13,25,27,28]. The model is available as an open-source GRASS GIS integration [29]. FUTURES was designed to explore the possible future locations, quantities, and spatial patterns of developed areas through the integration of three sub-models (DEMAND, POTENTIAL, and PGA), with a particular focus on the leapfrogging dynamic development process [24].
FUTURES is a Cellular Automata model that simulates the spatiotemporal increase in urban land area. More specifically, FUTURES works on a regular grid, where each grid cell represents an area of land described by one land-use or land-cover category. The resolution and configuration of the land-use and land-cover grid are based on historical land use/cover observations used to initialize the FUTURES model application. For U.S.-based applications, this information is often derived from NLCD data with a 30 m × 30 m spatial resolution. In this study, we used land-use/cover data from the West Data Center (2018), resampled as a spatial resolution of 30 m × 30 m. FUTURES uses population numbers as the driver of land-use change and “urban land use” as the active land-use category. For each time step, FUTURES evaluates the additional demand for the urban areas (based on the area demand per person as derived from historical observations of land use combined with population numbers), and if the current urban area is insufficient to meet the demand, additional urban area needs to be allocated in the landscape. This assessment of additional area demand is carried out in the DEMAND sub-model, i.e., DEMAND estimates future-per-capita land demand by combining historical population numbers and historical area demand and relating it to projected future population numbers.
The allocation of the new, additional urban areas is based on a spatial development potential assessment (see a list of spatial factors considered in Table 1) on one hand and the consideration of leapfrogging on the other hand. Based on a regression analysis of the historical distribution of urban areas (see Section 2.3), development potential factors are used to calculate development potential values for each grid cell that is not categorized as urban (or water). Moreover, parts of the study area can be excluded from the future development, for example, the conservation areas or historical sites. Since the urban area is considered for the calculation of the development potential, the development potential needs to be updated after each simulation time step if new urban areas had been allocated. The assessment of the development potential is carried out in the POTENTIAL sub-model, i.e., POTENTIAL calculates the development potential for individual raster cells by combining weighted, spatially explicit suitability factors such as environmental, infrastructural, and socioeconomic characteristics.
Allocation of new urban areas and the leapfrogging development dynamics are implemented in the patch growing algorithm (PGA); PGA builds on the DEMAND and POTENTIAL sub-models to map new developments in the landscape. Combining the demand for the additional developed area with the spatial distribution of development potential, PGA identifies the most suitable grid cells and then changes their land-use category to urban until the demand for the additional area is met. In addition to growing urban areas along the boundaries of existing areas, FUTURES also includes leapfrogging dynamics. To represent those, the model places seeds for new development patterns in the landscape and then randomly generates a value between 0 and 1 for the seed cell. If the randomly generated number exceeds the development potential (which is also defined in the range between 0–1) the grid cell will serve as a seed for a new development patch, with a patch size drawn from an historical distribution of development patches. If not, PGA moves on to a new grid cell and the process is repeated until a suitable seed cell is identified. Since PGA contains a random component, it can be categorized as a non-deterministic model, making it required to perform multiple simulation runs per scenario. While depending on the extent and resolution of the respective model application of FUTURES, typically, between 50–100 runs are reasonable for the computing time.
This general process of sub-model execution in FUTURES is repeated for each time step (typically 1-year time steps), covering the simulation period from the start year until the end year of the simulation period. In our case, the simulation period covered 15 time steps (2015–2030). FUTURES accounts for the spatial non-stationarity across administrative boundaries and represents cell- and neighborhood-based urban spatial patterns in its raster-based, spatiotemporal scenario simulations. We evaluated these simulations with fragmentation metrics (patch number and mean patch area) and natural land conservation metrics (area lost). The model and its extensions have been successfully applied to simulate urbanization in many regions [25,27,28], including Beijing, China [13].

2.3. Model Parameterization

More detail on the specific functionalities of the FUTURES model is provided in Meentemeyer et al. [24] and Dorning et al. [25]. Here, we give a short introduction of the sub-model functionalities and then describe the FUTURES parameterization applied in this study. We prepared the input parameters with study area’s data for three sub-models, including layer parameters, control parameters, and scenario parameters, seen in Table 1. Water bodies and already urbanized areas were excluded from consideration for future urban expansion in this study. For each of the scenarios described below, we ran 55 stochastic simulations based on prior model applications [24,25]; 55 runs per scenario were expected to adequately capture model variation while resulting in reasonable computation time.
The DEMAND sub-model calculates the quantity of the future demand for development areas expected for each district or county, based on a continuation of trends in historical non-agriculture population growth and land use. We extracted the historical population numbers for Xi’an from the Xi’an Statistical Yearbooks spanning the period from 1995 to 2015 [26]. Then we projected the future population numbers and the corresponding area demand, based on the Population Development Planning in Shaanxi Province (2016–2030) [30]. We defined the non-agricultural population numbers (the rate of urbanization) for seven counties, three urban districts, and three suburban districts. For the urban and suburban districts, we assumed a 100% urbanization rate. For the districts/counties, namely Changan, Yanliang, Lintong, Gaoling, Huyi, Lantian, and Zhouzhi, we applied an annual urbanization increase of 1.2% to population, based on the Population Development Planning in Shaanxi Province (2016–2030) [30]. Using the DEMAND sub-model and the non-agricultural (or urbanized) population projections, we calculated the amount of land expected to become urban (or developed) under the SQ Scenario conditions by applying the extrapolated relationship between urban areas and non-agriculture population observed between 1995 and 2015. In 2015, urban land use per capita was 75 m2. According to Lei et al.’s 2020 study on Xi’an, there was no land left to be urbanized in the districts of Beilin, Lianhu, and Xincheng [31]. We predicted the relationship between land and population for the other 11 districts (counties) in logarithmic upon heterogenerous assumption. According to the DEMAND sub-model projections, the urban land demand per capita is 70 m2, which is below the range of 75–105 m2, according to the reference of GB50137—2011 [32].
The POTENTIAL sub-model combines a series of spatially explicit environmental, infrastructural, and socioeconomic indicators associated with urban growth and their spatial variation, to map the potential for new urban areas (see Table 1). The resulting map is used to guide the allocation of new urban areas in the landscape. This sub-model uses multilevel logistic regression to screen and weigh key factors that are associated with the conversion from other land-use/cover categories to urban areas. The regression analysis is used to estimate the major proximate factors associated with rural-urban conversion potential and is carried out on the county level. Through generating a binary (urban versus non-urban) response variable, we used a stratified/random sample of 3000 grid cells distributed across the 13 districts/counties within Xi’an’s boundary (n = 1500 transitioning cells; n = 1500 cells sampled from the land use/cover categories farmland, rural built-up land, and other land; water and already developed areas was excluded from development) to establish the multilevel logistic regression model. This sub-model parameterization has been conducted and calculated in the previous paper [31].
The PGA sub-model combines iterative, stochastic site selection with an algorithm for growing discrete patches of new development, which allows for the representation of leapfrogging in urban development (e.g., [33]). We use this sub-model to reproduce observed leapfrogging patterns of development and to adjust the size and shape of patches of newly urbanized areas in the landscape. For this purpose, we calibrated the patch size and patch compactness parameters with observed distributions of development patches for the period 2005–2015. In this study, we set the parameter of discount factor to the value of 0.5 when the size of the simulated patch is almost equal to that of the observed patch. Also, we set the compactness factor to the value of 0.3 and the compactness range to the value of 0.05, by comparing the simulated with the observed patch shape-index histograms. This means that we implicitly assume temporal stationarity in development patterns during the simulation period which spans the years 2005 to 2030 (with 2015 serving as time step for model validation). We used the Yanta district for calibration, following the general approach for FUTURES calibration as described by [24].

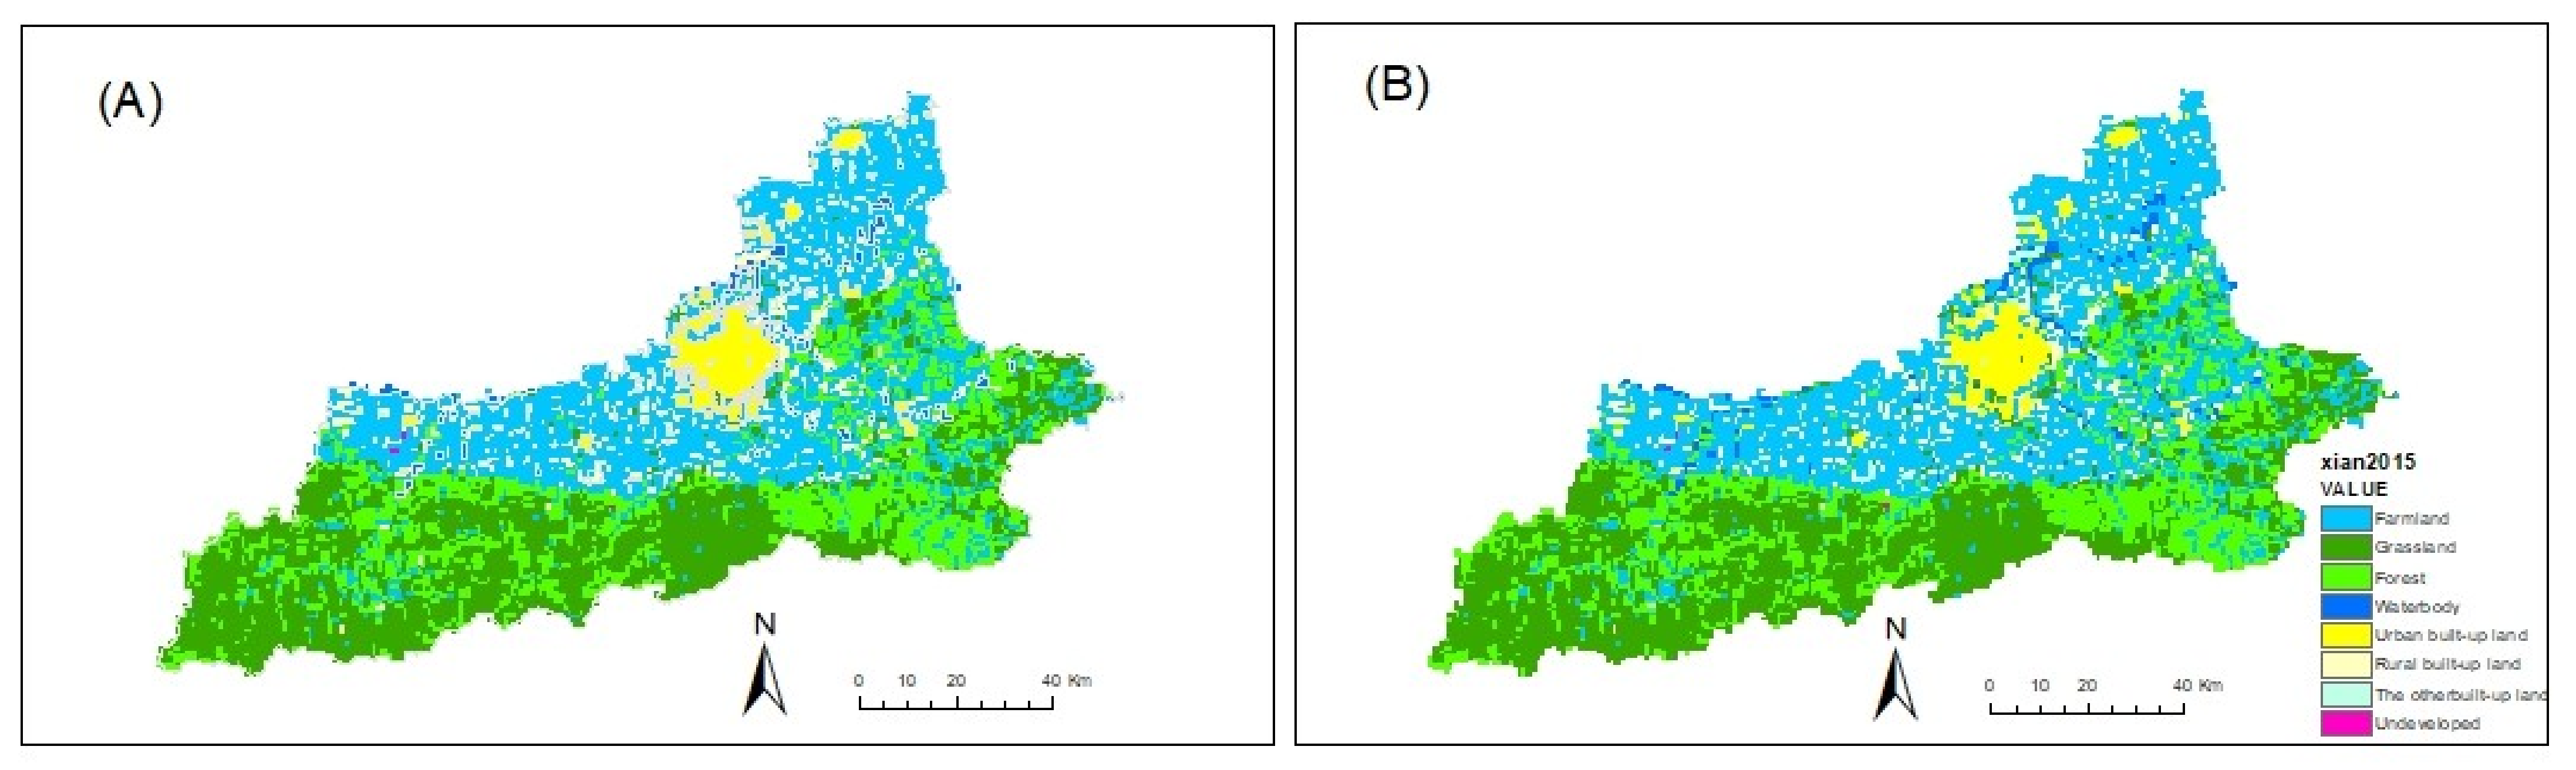
2.4. Modeling Validation

We validated the FUTURES simulations for 2015 using Ksimulation as described by [38]. We parameterized the FUTURES model using the land-use data for 2005 in Xi’an. We compared the observed with the simulated data for the year 2015 (seen in Figure 2); we used the independent land-use dataset for the year 2015 to validate the accuracy of the simulation. First, we ran the model 55 times and calculated the compactness factor of 0.3, the compactness factor range of 0.05, and the discount factor of 0.5, based on the 55 runs. We then used the results from this calculation and compared them to the 2015 land-use dataset. Table 2 lists Ksimulation coefficients; all listed values are higher than 0.8 indicating that the parameterization of FUTURES for Xi’an displays a feasible accuracy.

2.5. Scenario Definitions

We formulated the Status Quo Scenario and compared it to eight alternative scenarios (three “base” scenarios as well as combinations of those base scenarios) depicting a variety of policy-based urbanization strategies (Table 3). We developed the scenarios around the following policy and planning assumption connected to functionalities of the simulation model: (1) Status Quo: an exclusion of new development from historical protected areas; (2) Stimulus: urban-rural conversion and constraint of new development in areas covered with farmland, forests, and grasslands; (3) Infill: allocation of new development near existing infrastructure and development; and (4) Decreased Density: an increase in land demand (as compared to a continuation of historical trends) resulting in a decreased development density.

2.5.1. Status Quo Scenario

The Status Quo scenario assumes a continuation of historical trends in urban development—as driven by a continuation of the trends in population and area demand inputs—without an adjustment of any other model parameters. This scenario serves as a benchmark for comparison to the other scenarios listed in Table 3.

2.5.2. Stimulus Scenario

In FUTURES, the stimulus parameter affects the site transformation probability and is defined from 0 to 1. When the value of the stimulus parameter is 0, there is no impact of the stimulus parameter on the development probability. The closer the value of the stimulus parameter is to 1, the higher the probability of the grid cell getting developed into an urban grid cell. The probability P that a grid cell is going to be developed is calculated as [24]:
P p = e s i j 1 + e s i j + s t i m u l u s e s i j 1 + e s i j * s t i m u l u s
where Pp is the development probability, stimulus is the attribute value of the stimulus parameter, and sij is the development potential of the grid cell in row i and column j. FUTURES adjustments and sensitivity analysis were conducted as follows:
Adjustment: Jurisdictions can use policy-based mechanisms such as implementing an increase–decrease relationship between the development of urban and rural areas to steer new developments away from natural areas towards rural areas. To examine the outcomes of these incentives as an example of a strategy geared toward conservation, we used the optional development stimulus parameter in the PGA. The use of this parameter impacts the potential site suitability surface, increasing the likelihood of development in certain areas. Here, the stimulus parameter is multiplied by the development potential, increasing the site suitability of rural built-up land for future development as the stimulus factor increases. This modification of the PGA can be used to adjust the probability of development based on any set of land-use policies. Unlike exclusion and constraint parameters, this approach encourages priority development in rural settlements and not in farmland, forest, or grassland areas. Because of the dispersed nature of rural settlements, we used patch metrics to constrain the urbanization of the rural settlements, i.e., we used these metrics (such as a bigger patch area and a lower patch number) to control fragmentation of the non-urban portion of the landscape.
Sensitivity Analysis: We then conducted a sensitivity analysis using landscape metrics to assess the influence of the stimulus parameter on landscape outcomes. We varied the value of the stimulus parameter in a range from 0–1, using 0.1 increments (holding all other scenario parameters constant compared to the Status Quo Scenario) and quantified the total land area where simulated development overlapped with urbanization priorities (Figure 3). The results of this sensitivity analysis indicate the influence of the stimulus parameter on the variations in patch numbers and shape index in newly developed areas.

2.5.3. Decreased Density Scenario

According to the Plan 2014–2020, the area demand for urban land per capita will be less than 100 m2 [39]. In the Land Use Classification and Planning and Construction Land Use Standard GB50137 (revised), the recommended land use per capita ranges between 75–105 m2 [32]. According to the projection of urban land demand per capita from 2015 to 2030 in Xi’an [26], urban land demand per capita is 70 m2 below the average area demand for urban land per capita in China. With these values in mind, we designed the decreased density scenario to assume an increased urban land consumption per capita to increase the urbanization quality in Xi’an while limiting the fragmentation of forest and farmland. We implemented an increased per capita land consumption by altering the demand for development while holding other model parameters constant. As a result of these considerations, the decreased density scenario assumed 75 m2 per capita, which is a recommended value for metropolitan development [7].

2.5.4. Infill Scenario

Establishing new development in the proximity of existing urban areas and infrastructure is a strategy for conserving farmland, forestland, and grassland, aimed at limiting the detrimental effects of landscape fragmentation. Here, we implemented the Infill Scenario using PGA’s incentive parameter which controls the influence of the development potential [24]. As a global effect, the incentive parameter influences the spatial distribution of urbanization, modifying patch configuration and the degree of new patch agglomeration around existing development. We adjusted the incentive parameter by raising the initial value of development potential to the power of two, while holding all other model parameters constant. In this study, a power function is used to change the probability gradient homogeneity of grid cell urbanization. The probability P of grid urbanization is defined with a compact degree parameter, following [24]:
P α = e s i j 1 + e s i j α
with sij being the development potential of a raster cell located in row i and column j; and α is a parameter giving the degree of compactness ranging from 0 to 4, with 0 giving a highly diffused development and 4 resulting in a highly compact development pattern.

2.5.5. Combination of Scenarios

To test the effects of the different scenario combinations, we ran the model with two or three scenario parameters into the PGA. We derived the outcomes of the combination scenarios, such as DD + STI, I + STI, I + DD, and I + DD + STI, as shown in Table 3.

3. Results

Scenario Simulations

Under Status Quo Scenario conditions, newly developed urban areas in 2030 increased by 35% compared to the year 2015, with the increase of 72% converted from farmland, 1% from forests, 2% from grassland, and 24% from rural built-up areas. Among the 144.36 km2 of new urban areas projected for the year 2030, approximately 4.52 km2 were located on former natural areas (including 1.69 km2 of forests and 2.83 km2 of grasslands); 103.97 km2 on farmlands; and 34.87 km2 on former rural built-up areas (Table 4). Figure 4 displays the distribution of newly developed urban areas across different land-use categories and Figure 5 displays the effect of newly developed urban areas on the connectivity of the landscape.
Comparing the simulation results for the Infill Scenario to the Status Quo Scenario, 4.8% more farmland was converted to development, while fewer forests, grassland, and rural built-up areas were converted (19.1%, 63.4%, and 9.97%, respectively; Figure 4). Furthermore, fragmentation was less pronounced under the Infill Scenario as indicated by a lower number of farmland patches (3.26%) accompanied by an increase in patch areas for farmland patches (3%), with the total areas for those two categories staying relatively constant (Figure 5). In addition, there was also a small positive influence on urban built-up areas and patch numbers. The number and area of forest and grassland patches showed little variation under the Infill Scenario.
In the Stimulus Scenario, new development is preferably established on rural built-up areas as described in Section 2.5.2. In comparison to the Status Quo Scenario, values under the Stimulus Scenario for new urban development on farmlands were 27.0% lower, and new development on former forests and grasslands decreased by 93.6% and 68.2%, respectively (Figure 4). The values for new development on former rural built-up areas increased by 91.8%. As displayed in Figure 4, there was a decrease in the number of patches of urban land and a slight increase of 0.24% in the area of the urban patches compared to the Status Quo Scenario.
In the Decreased Density Scenario, the total conversion of farmland to urban land increased by 4.6%, while the conversion of forests, grasslands, and rural built-up land decreased by 21.1%, 60.0%, and 8.1%, respectively, compared to the Status Quo Scenario (Figure 4B). The fragmentation indicators displayed more patches accompanied by smaller mean patch area. Compared to the Status Quo Scenario, the number of urban patches increased by 0.44% while the mean patch area decreased by 0.27% (Figure 5). The number of farmland patches increased by 6.1%, and the mean farmland patch area decreased by 6.2%.
The different scenario combinations (Table 3) resulted in landscape patterns generally consistent with the effects, yet not strictly additive, of each scenario on its own (Figure 4 and Figure 5). The greatest decrease in the conversion of farmland (64%), forest (41.23%), and grassland (62.12%) to development and increase in conversion of rural built-up land (199.4%) to development was displayed for the Stimulus Scenario and Infill Scenario combination (Figure 4). The combination scenario of Infill, Decreased Density, and Stimulus Scenarios reduced the conversion of farmland to development to a lesser degree than the combination scenario of I + DD. It displayed the same total area as the DD and the I + DD combination scenario (Table 4).

4. Discussion

4.1. Scenario Simulations

In this study, we tested and visualized the potential future outcomes of the implementation of different land-use policies with the FUTURES model, focusing on the combination of macro-level land-use policies with micro-level heterogeneity in socio-environmental characteristics. We used scenario assumptions to represent land-use policies and test them with model simulations covering the simulation period 2015 to 2030 for Xi’an. This is a way to identify and visualize the potential future impacts of a variety of assumptions on future urban planning efforts on the landscape. The tested scenarios include the linkages between rural and urban development processes and the Plan 2014–2020 [39]; hence, our simulations were aimed at revealing the impact of policy implementation on the spatial patterns of urban development and the connected effects on resource conservation. The goal of this study was to understand which policies might be most beneficial at the regional level and, as such, could support decision-making of local policy makers and planners. We used the Status Quo Scenario as a reference to check the impacts of different urban development policies (as represented in different scenarios, which were realized through several model parameterizations) on landscape fragmentation and conservation of natural land resources.
The Decreased Density Scenario assumed more urban land area per capita and was geared to test an improvement of well-being as compared to the Status Quo Scenario. This scenario encouraged the extension of urban development into rural areas and natural land resources; thus, the loss of natural resources was more likely to take place around urban areas. The Infill Scenario reduced the fragmentation and the loss of farmland, forests, and grassland outside urban areas, but increased the fragmentation and loss of farmland, forest, and grassland inside urban areas. The combination scenario of Infill and Stimulus indicated synergistic effects, encouraging the compactness of urban areas. This combination scenario affected the spatial distribution of forests and grasslands in or around urban areas and threatened small pockets of greenspaces in urban areas, which play an important role for the conservation of a high-quality urban environment. The loss of pocket green spaces in urban areas can substantially impact regional urban landscape pattern and quality of life, since they are highly relevant for air quality, biodiversity, and for buffering urban heat-island effects [40,41]. Hence, it is crucial that policies promoting infill and stimulating development in rural settings also integrate strategies and measures for the protection of urban greenspaces and the natural environment, due to their important role for quality of life, health, and well-being in urban environments [40].
The development scenarios that employed multiple strategies generally resulted in a balance of the analyzed landscape characteristics. The pairing of Infill and Stimulus resulted in more compact urban land, more development of rural settlements, less natural resources lost, and especially a lower level of farmland fragmentation than the respective individual scenario. The spatial distribution of natural resource loss shifted to urban areas—an effect that was consistent across all combination scenarios that included the Infill Scenario assumptions. The combination scenario pairing Infill with Decreased Density displayed almost no variation in the proportion of farmland and rural settlements converted to development, but displayed less fragmentation of farmlands, forests, and grasslands than the Decreased Density Scenario as well as a higher loss of farmlands, forests, and grasslands than the Infill Scenario. This indicates the potential of the policies assumed for Infill and Decreased Density to work against each other when it comes to reducing landscape fragmentation and loss of natural resources. We introduced the combination of the Infill Scenario and Decreased Density Scenario to represent and test the New Urbanization Policy 2014–2020, which encourages compact, yet livable urban development around existing infrastructure to achieve sustainable urbanization. The simulations with combinations of policies under consideration of regional land-use/cover characteristics revealed the impact of such polices on the regional development of spatial patterns and natural resources; the results indicate that policies are not easily transferable, but should consider regional landscape heterogeneities and disparities in China. Incorporating the rural settlement Stimulus into the combination of Infill and Decreased Density not only increased the urban land per capita, but also resulted in less fragmentation and loss of farmland than the Infill or Stimulus scenarios alone.
We explored land-use policies that target avoiding specific land-use issues as well as a combination of issues. The mismatch and synergies among the policies affected spatial patterns and natural resource conservation, and are of great significance and practicality, especially for the case of Xi’an with its unique characteristics regarding the geography of the landscape and the presence of multiple historical and heritage sites (including the Terracotta Army), which need to be considered when implementing policies defined at the macro-level. We found that developed land and farmland are the main land-use categories for human activities, accounting for 45% of the total area in Xi’an, which indicates a competition for land between urbanization and food security. According to Lei et al.’s 2020 study on Xi’an, the rural built-up area increased by 86 km2 between 1980 and 2015, although, under a rural-urban transition path. Incorporating Stimulus into rural-urban development, the synergistic effects on spatial development patterns could benefit sustainable urban expansion for the rapid urbanization of Xi’an.
While the cause–effect relationships are clear—lower density development requires more area and vice versa and more development in the urban core leads to less development in rural areas and the reduced loss of natural vegetation–deciding on a preferable outcome regarding the quantity and configuration of urbanization is less straightforward (e.g., [25]). No simple or single best solution exists; a situation that is referred to as a wicked problem [42]. However, it is important to embrace complexity rather than holding on to the idea of “silver bullet” solutions. Under the context of economic, political, cultural, social, and ecological coordinated development, it is necessary for policymakers and planners to understand the inter-linkages among urban development, natural resources protection, and food security, and to carefully consider the outcomes of varying priorities across spatial and temporal scales. Modeling studies like the study presented here quantify the possible future landscape configurations, thus raising awareness of the complexities of sustainable urban planning, and can help find a balance between the short-term goal of creating livable urban development and economic development, and the long-term goal of food security and natural resources’ protection to assure well-being (e.g., [43]).

4.2. Study Limitations

With the help of the FUTURES model, this study focused on the spatial characteristics of urban expansion. The combination of urban simulations and landscape indices intuitively and effectively quantifies urban spatial growth resulting from assumptions on different land-use policies and management approaches. However, while this type of simulation model displays the resulting landscape patterns, it is not suitable to explore the mechanism and processes leading from a land management strategy to the landscape pattern [44]. Our study revealed the morphological evolution of Xi’an at the regional scale; however, sustainable urban expansion is not limited to the spatial patterns of land-use/cover, but it is also heavily dependent on structures that are not considered in the FUTURES model. These structures include establishing new roads and infrastructure, building heights, land-use intensity, and the ratio of green spaces on the micro scale. As well as the limitations regarding spatial resolution and representation of land change processes, this study is also limited by the scenarios’ assumptions. We selected a few policies to test, hence, we do not claim our scenario study to be comprehensive enough to propose the best possible strategy for combining natural resource conservation and the vitalization of rural land.

4.3. Next Steps

Recent research displayed the significance of climate adaptable urbanization, emphasizing the importance of building low-carbon, resilient, and sustainable urban landscapes. Rapid urbanization promotes the development of energy intensive industries such as construction, with extensive use of steel and cement. This leads to a large amount of carbon emission, especially in densely populated urban areas with rapid economic growth, and intensive resource use. Studying, understanding, and mitigating the impact of urban growth on carbon emissions will be of great significance to reduce carbon emissions. High density (population, residence, and buildings, etc.) and a compact urban form can greatly reduce travel time of urban residents, improve the use efficiency of public transport, and encourage slow transportation modes such as cycling and walking. In the future, studying the relationships between urban growth and carbon emissions, which are aimed at promoting a compact yet livable layout, the improved use of resources and infrastructure, and the production of low-carbon, efficient, green, and livable low-carbon cities, will be of greater significance to sustainable urbanization.

5. Conclusions

The application of the FUTURES model in simulating land-use change under different scenarios provides a way to explore the potential future patterns of urban areas, and the loss and fragmentation of farmland as well as natural resources as the landscape standard. The FUTURES simulations not only revealed the area demand for new development based on a site suitability-driven approach, but also displayed spatial growth patterns through a patch-based growing algorithm, thus quantifying urban morphology and its ecological impacts. The combination of modeling landscape patterns with policy-based scenarios synthesizes information across spatial scales and makes the results visual and measurable; thus, they are more likely to stimulate discussions between policy makers and planners around the cross-scale complexities and the feedback between different policy instruments guiding the location of new development.
We used FUTURES to analyze the potential future morphology of Xi’an and the corresponding ecological impacts under different scenarios. In one of the scenarios, we tested a land-use policy linking rural decrease and urban increase through a weighting scheme analysis with the stimulus parameter in the PGA sub-model. Furthermore, we tested representative indicators of sustainable urbanization according to Plan 2014–2020. This study produced two main conclusions: (1) Testing different scenario combinations representing the integration of several policies showed both synergetic spatial patterns and quantitative impacts, but also conflicting policies; (2) for the strategic goal of rural revitalization combined with new urban development in China, the simulated land-use pattern of urban growth resulting from the combination of polices (specifically combining rural stimulus, infill, and decrease in density), was most likely to support progress toward both a livable compact city and natural resources’ conservation.
Our findings underscore the value of simulation modeling and scenario analyses to quantify and visualize the results from policies and planning in supporting sustainable urbanization. Also, our research results provide scientific support for land-use policy revision and implementation in Xi’an, as well as a reference for other urbanizing cities in China. Balancing the short-term goal of livable urban growth and economic development with the long-term goal of food security and natural resources’ conservation will be the most useful approach for scenario studies and policy making.

Author Contributions

Conceptualization, H.L. and H.S.; methodology, software, and validation H.L. and J.K.; formal analysis, H.L., H.S. and J.K.; investigation, H.L.; resources, H.L. and H.S.; data curation, H.S.; writing—original draft preparation, H.L.; writing—review and editing, J.K. and S.S.; visualization, H.L., J.K. and S.S.; supervision, J.K.; funding acquisition, J.K. and H.S. All authors have read and agreed to the published version of the manuscript.

Funding

This research received no external funding.

Institutional Review Board Statement

Not applicable.

Informed Consent Statement

Not applicable.

Data Availability Statement

Not applicable.

Acknowledgments

The authors also would like to express gratitude to their beloved colleague and friend, Monica Dorning, whose advice, and thoughtful guidance made this manuscript possible.

Conflicts of Interest

Lead author, Haifen Lei, works as an engineering for city planning. Her work on this study is not funded through working office and is in no way affiliated with her work for her working office. The authors declare no conflict of interest.

References

  1. United Nations Population Division. World Population Prospects 2019; United Nations Population Division: New York, NY, USA, 2019. [Google Scholar]
  2. Seto, K.C.; Güneralp, B.; Hutyra, L.R. Global Forecasts of Urban Expansion to 2030 and Direct Impacts on Biodiversity and Carbon Pools. Sustain. Sci. 2012, 109, 16083–16088. [Google Scholar] [CrossRef] [PubMed]
  3. Foley, J.A.; DeFries, R.; Asner, G.P.; Barford, C.; Bonan, G.; Carpenter, S.R.; Chapin, F.S.; Coe, M.T.; Daily, G.C.; Gibbs, H.K.; et al. Global Consequences of Land Use. Science 2005, 309, 570–574. [Google Scholar] [CrossRef] [PubMed]
  4. Seto, K.C.; Fragkias, M.; Gueneralp, B.; Reilly, M.K. A Meta-Analysis of Global Urban Land Expansion. PLoS ONE 2011, 101, 1435–1439. [Google Scholar] [CrossRef] [PubMed]
  5. Seto, K.C.; Sánchez-Rodríguez, R.; Fragkias, M. The New Geography of Contemporary Urbanization and the Environment. Annu. Revies Environ. Resour. 2010, 35, 167–194. [Google Scholar] [CrossRef]
  6. Vliet, J. van Direct and Indirect Loss of Natural Area from Urban Expansion. Nat. Sustain. 2019, 2, 755–763. [Google Scholar] [CrossRef]
  7. Ge, S.; Cifang, W.; Yang, W. Research on the Relation between Urbanization and Farmland Conservation. Agric. Econ. Probl. 2006, 1, 64–67. (In Chinese) [Google Scholar]
  8. Wu, Y.; Shan, L.; Guo, Z.; Peng, Y. Cultivated Land Protection Policies in China Facing 2030: Dynamic Balance System versus Basic Farmland Zoning. Habitat Int. 2017, 69, 126–138. [Google Scholar] [CrossRef]
  9. Wang, X.F.; Fu, B.J.; Su, C.H.; Wang, R.R.; Zhao, Y.H.; Li, T.S. Spatio-Temporal Characteristics and & Driving Forces of Built-up Land in Xi’an, China. Acta Ecol. Sin. 2015, 35, 7139–7149. (In Chinese) [Google Scholar] [CrossRef]
  10. Long, H.; Li, T. The Coupling Characteristics and Mechanism of Farmland and Rural Housing Land Transition in China. J. Geogr. Sci. 2012, 22, 548–562. [Google Scholar] [CrossRef]
  11. Long, H.; Liu, Y.; Hou, X.; Li, T.; Li, Y. Effects of Land Use Transitions Due to Rapid Urbanization on Ecosystem Services: Implications for Urban Planning in the New Developing Area of China. Habitat Int. 2014, 44, 536–544. [Google Scholar] [CrossRef]
  12. Liu, T.; Liu, H.; Qi, Y. Construction Land Expansion and Cultivated Land Protection in Urbanizing China: Insights from National Land Surveys, 1996–2006. Habitat Int. 2015, 46, 13–22. [Google Scholar] [CrossRef]
  13. Xu, Q.; Zheng, X.; Zheng, M. Do Urban Planning Policies Meet Sustainable Urbanization Goals? A Scenario-Based Study in Beijing, China. Sci. Total Environ. 2019, 670, 498–507. [Google Scholar] [CrossRef] [PubMed]
  14. Lazaro, L.; Yang, Y. Urban Planning Historical Review of Master Plans and the Way towards a Sustainable City: Dar Es Salaam, Tanzania. Front. Archit. Res. 2019, 8, 359–377. [Google Scholar] [CrossRef]
  15. Anammasiya, R.; Amponsah, O.; Peprah, C.; Appiah, S. Land Use Policy A Review of Practices for Sustaining Urban and Peri-Urban Agriculture: Implications for Land Use Planning in Rapidly Urbanising Ghanaian Cities. Land Use Policy 2019, 84, 260–277. [Google Scholar] [CrossRef]
  16. Mauerhofer, V. The “Governance-Check”: Assessing the Sustainability of Public Spatial Decision-Making Structures. Land Use Policy 2013, 30, 328–336. [Google Scholar] [CrossRef]
  17. Wang, Y.; Liu, Y.; Li, Y.; Li, T. The Spatio-Temporal Patterns of Urban-Rural Development Transformation in China since 1990. Habitat Int. 2016, 53, 178–187. [Google Scholar] [CrossRef]
  18. He, C.; Chen, T.; Mao, X.; Zhou, Y. Economic Transition, Urbanization and Population Redistribution in China. Habitat Int. 2016, 51, 39–47. [Google Scholar] [CrossRef]
  19. Mingxing, C.; Yinghua, G.; Dadao, L.; Chao, Y. Build a People-Oriented Urbanization: China’s New-Type Urbanization Dream and Anhui Model. Land Use Policy 2019, 80, 1–9. [Google Scholar] [CrossRef]
  20. SunSheng, H.; Wenqi, L. Transforming Rural Housing Land to Farmland in Chongqing, China: The Land Coupon Approach and Farmers’ Complaints. Land Use Policy 2019, 83, 370–378. [Google Scholar] [CrossRef]
  21. Santé, I.; García, A.M.; Miranda, D.; Crecente, R. Cellular Automata Models for the Simulation of Real-World Urban Processes: A Review and Analysis. Landsc. Urban Plan. 2010, 96, 108–122. [Google Scholar] [CrossRef]
  22. Aburas, M.M.; Ho, Y.M.; Ramli, M.F.; Ash’aari, Z.H. The Simulation and Prediction of Spatio-Temporal Urban Growth Trends Using Cellular Automata Models: A Review. Int. J. Appl. Earth Obs. Geoinf. 2016, 52, 380–389. [Google Scholar] [CrossRef]
  23. Liu, Y.; Batty, M.; Wang, S.; Corcoran, J. Modelling Urban Change with Cellular Automata: Contemporary Issues and Future Research Directions. Prog. Hum. Geogr. 2021, 45, 3–24. [Google Scholar] [CrossRef]
  24. Meentemeyer, R.K.; Tang, W.; Dorning, M.A.; Vogler, J.B.; Cunniffe, N.J.; Shoemaker, D.A. FUTURES: Multilevel Simulations of Emerging Urban-Rural Landscape Structure Using a Stochastic Patch-Growing Algorithm. Ann. Assoc. Am. Geogr. 2013, 103, 785–807. [Google Scholar] [CrossRef]
  25. Dorning, M.A.; Koch, J.; Shoemaker, D.A.; Meentemeyer, R.K. Simulating Urbanization Scenarios Reveals Tradeoffs between Conservation Planning Strategies. Landsc. Urban Plan. 2015, 136, 28–39. [Google Scholar] [CrossRef]
  26. Shaanxi Provincial Bureau of Statistics. Population Numbers and GDP. In Xi’an Statistical Year Book; Shaanxi Provincial Bureau of Statistics: Xian, China, 2018. [Google Scholar]
  27. Pickard, B.R.; Van Berkel, D.; Petrasova, A.; Meentemeyer, R.K. Forecasts of Urbanization Scenarios Reveal Trade-Offs between Landscape Change and Ecosystem Services. Landsc. Ecol. 2017, 32, 617–634. [Google Scholar] [CrossRef]
  28. Koch, J.; Dorning, M.A.; Van Berkel, D.B.; Beck, S.M.; Sanchez, G.M.; Shashidharan, A.; Smart, L.S.; Zhang, Q.; Smith, J.W.; Meentemeyer, R.K. Modeling Landowner Interactions and Development Patterns at the Urban Fringe. Landsc. Urban Plan. 2019, 182, 101–113. [Google Scholar] [CrossRef]
  29. Petrasova, A.; Petras, V.; Van Berkel, D.; Harmon, B.A.; Meentemeyer, R.K. Approach to Urban Growth Simulation. Remote Sens. Spat. Inf. Sci. 2016, XLI-B7, 953. [Google Scholar]
  30. General Office of the People’s Government of Shaanxi Province. Population Development Plan of Shaanxi Province (2016–2030); General Office of the People’s Government of Shaanxi Province: Xian, China, 2017. [Google Scholar]
  31. Lei, H.; Koch, J.; Shi, H. An Analysis of Spatio-Temporal Urbanization Patterns in Northwest China. Land 2020, 9, 1–18. [Google Scholar] [CrossRef]
  32. GB50137-2011; Code for Classification of Urban Land Use and Planning Standards of Development Land. Ministry of Housing and Urban Rural Development; State Administration of Quality Supervision, Inspection and Quarantine, PRC: Beijing, China, 2012; p. 15.
  33. Zhang, W.; Wrenn, D.H.; Irwin, E.G. Spatial Heterogeneity, Accessibility, and Zoning: An Empirical Investigation of Leapfrog Development. J. Econ. Geogr. 2017, 17, 547–570. [Google Scholar] [CrossRef]
  34. West Data Center. Land Use/Land Cover Data. Available online: http://westdc.westgis.ac.cn (accessed on 18 April 2018).
  35. Xi’an City Planning and Design Institute. Road Network, Conservation Areas, and Development Zones. Available online: http://www.xaguihua.com (accessed on 25 April 2018).
  36. National Development and Reform Commission; Ministry of Housing and Urban Rural Development. Development Planning of Guanzhong Plain Urban Agglomeration; National Development and Reform Commission; Ministry of Housing and Urban Rural Development: Beijing, China, 2018. [Google Scholar]
  37. Data Application Environment of the Chinese Academy of Sciences. Chinese Administrative Zoning Map; Data Application Environment of the Chinese Academy of Sciences: Beijing, China, 2018. [Google Scholar]
  38. van Vliet, J.; Bregt, A.K.; Hagen-Zanker, A. Revisiting Kappa to Account for Change in the Accuracy Assessment of Land-Use Change Models. Ecol. Modell. 2011, 222, 1367–1375. [Google Scholar] [CrossRef]
  39. The State Council, PRC. The National New Urbanization Type (2014–2020). Available online: http://www.gov.cn/xinwen/2014-03/17/content_2639873.htm (accessed on 25 April 2018).
  40. Liu, S.; Wang, X. Reexamine the Value of Urban Pocket Parks under the Impact of the COVID-19. Urban For. Urban Green. 2021, 64, 127294. [Google Scholar] [CrossRef]
  41. Kerishnan, P.B.; Maruthaveeran, S. Factors Contributing to the Usage of Pocket Parks―A Review of the Evidence. Urban For. Urban Green. 2021, 58, 126985. [Google Scholar] [CrossRef]
  42. Defries, R.; Nagendra, H. Ecosystem Management as a Wicked Problem. Science 2017, 356, 265–270. [Google Scholar] [CrossRef] [PubMed]
  43. Koch, J.; Wimmer, F.; Schaldach, R. Analyzing the Relationship between Urbanization, Food Supply and Demand, and Irrigation Requirements in Jordan. Sci. Total Environ. 2018, 636, 1500–1509. [Google Scholar] [CrossRef] [PubMed]
  44. Yi, Q.U.; Hualou, L. A Framework of Multi-Disciplinary Comprehensive Research on Recessive Farmland Transition in China. ACTA Geogr. Sin. 2018, 73, 1226–1241. (In Chinese) [Google Scholar]
Figure 1. Land-use/cover and land-use change between the years 1995 and 2015 for Xi’an in China.
Land 11 01678 g001
Figure 2. Comparison of stimulated and observed land use in Xi’an 2015, (A) Simulated land use; (B) Observed land use.
Land 11 01678 g002
Figure 3. Results of the stimulus parameter sensitivity analysis. Patch number of new urban areas and mean patch area of the newly developed areas resulting from a varying stimulus parameter.
Land 11 01678 g003
Figure 4. Scenario comparisons of newly developed urban areas: (A) ratio of new urban areas located on former land-use types, and (B) difference of land-use types in the landscape as compared to the Status Quo Scenario.
Land 11 01678 g004
Figure 5. Fragmentation metrics for the different land-use types under different scenarios compared to the Status Quo Scenario: (A) patch area, and (B) patch number.
Land 11 01678 g005
Table 1. Parameters for FUTURES model input associated with urban growth.
Sub-ModelParametersDescriptionYears and Source
PotentialDynamicPressureNumber of developed grids in the study area, weighted by distance2005, 2015, 2030
GeographyTopographySlope of the terrain2005 [34]
Land-use/coverageDifferent land-use types at different research stages2005, 2015 [34]
Socio-
economic
RoadRoad accessibility2005, 2015 [35]
HighwayHighway accessibility, including national, provincial and district level2005, 2015 [35]
Road densityRoad density within 3 km2005, 2015 [35]
Travel costsTravel costs with neighboring cities within the Guanzhong Plain city aggolomeration2005, 2015 [36]
(Sub-)centerDistance to (Sub-)center2005, 2015 [34]
SubwayDistance to subway2005, 2015 [35]
Administrative BoundariesDistrict (County) Level2005, 2015 [37]
Policy/
Planning
Historic Site Preservation AreasDistance to Historic Site Preservation AreasFourth Round Master Plan [35]
Planning area1 for planning area, 0 for other areasFourth Round Master Plan [35]
Developed zoneDistance to developed zoneDevelopment zones [35] established before 2015
DEMANDPopulation growthHistorical population growth and projections1995, 2000, 2005, 2010, 2015 demographic data and prediction of population growth by district [26,30]
Land developmentHistorical land develpment and projections1980, 1990, 1995, 2000, 2005, 2010, 2015 [34]
PGAPatch sizeThe number of CA in the patch1980, 1990, 1995, 2000, 2005, 2010, 2015 Land use and simulation projections
Patch compactnessTo control the morphological complexity of each new growth patch1980, 1990, 1995, 2000, 2005, 2010, 2015
Stimulus or constraint factorsTo control the development of probability surfaces with power transformation
Weighting factorsWeighting factors for different surfaces
Time intervalTime interval during simulation
RandomnessPossibility of redistribution of development centers
Table 2. Ksimulation coefficients from comparing observed and simulated patches.
KhistogramKlocationKsimulationKtransitionKtranslocation
0.9090.8970.8220.9070.907
Table 3. Base scenarios, scenario combinations, and their abbreviations.
ScenariosAbbreviationThe Value of Scenario Parameterization
Status Quo ScenarioSQ70 m2
/
/
Stimulus ScenarioSTI70 m2
0.6
/
Decreased Density ScenarioDD75 m2
/
/
Infill ScenarioI70 m2
/
4
Decreased Density + Stimulus ScenarioDD + STI75 m2
0.6
/
Infill + Stimulus ScenarioI + STI70 m2
0.6
4
Infill + Decreased Density ScenarioI + DD75 m2
/
4
Infill + Decreased Density + Stimulus ScenarioI + DD + STI75 m2
0.6
4
The third column specified as: 1st value denoted as the urban land demand per capita; 2nd value denoted as the site transformation probability; 3rd value denoted as the influence of development potential.
Table 4. Calculated consumption areas during transition in square kilometers for all scenario simulations.
ScenarioFarmland
[km2]
Forest
[km2]
Grassland
[km2]
Rural Built-up Land [km2]Total Newly Urbanized Areas [km2]
SQ103.971.692.8334.87144.36
STI75.880.110.9066.87144.36
DD175.372.151.8251.66232.81
I108.961.371.0431.40144.36
DD + STI106.465.041.31118.82232.81
I + STI37.110.991.07104.42144.36
I + DD175.192.590.8851.70232.81
I + DD + STI69.113.270.15159.12232.81
Publisher’s Note: MDPI stays neutral with regard to jurisdictional claims in published maps and institutional affiliations.

