Article

Innovation-Driven Development and Urban Land Low-Carbon Use Efficiency: A Policy Assessment from China

1
School of Political Science and Public Administration, Henan Normal University, Xinxiang 453007, China
2
School of Business and Tourism Management, Yunnan University, Kunming 650500, China
3
School of Economics, Yunnan University, Kunming 650500, China
4
State Information Center, Beijing 100045, China
5
School of Geography and Information Engineering, China University of Geosciences, Wuhan 430074, China
*
Authors to whom correspondence should be addressed.
Land 2022, 11(10), 1634; https://doi.org/10.3390/land11101634
Submission received: 6 August 2022 / Revised: 17 September 2022 / Accepted: 21 September 2022 / Published: 23 September 2022
(This article belongs to the Special Issue Renewable Energy and Land Use towards Low-Carbon Transition)

Abstract

:
Improving the low-carbon utilization efficiency of urban land is crucial to the low-carbon transformation and sustainable development of China and the world economy. Innovation-driven development, especially the construction of National Independent Innovation Demonstration Zones (NIIDZs), is an important measure to realize the low-carbon transformation of urban land use and sustainable economic development in China. However, previous studies have neglected to study the impact of the construction of NIIDZs on the low-carbon utilization efficiency of urban land. Based on a theoretical analysis and using the panel data of 283 cities in China from 2006 to 2019, we took NIIDZ construction in China as a quasi-natural experiment and adopted the progressive difference-in-differences method (DID) to evaluate the impact and action mechanism of NIIDZ construction on urban land low-carbon utilization efficiency. We found that NIIDZ construction can significantly promote the improvement of the low-carbon utilization efficiency of urban land, and a series of robustness analysis results support this research conclusion. With the passage of time, this kind of promotion effect shows a trend of increasing fluctuation. NIIDZ construction mainly improves the low-carbon utilization efficiency of urban land by promoting green technology innovation and generating economies of scale. In addition, compared with eastern cities, small-scale cities and resource-based cities, the promotion effect of NIIDZ construction in central and western cities, large cities, and non-resource-based cities is more obvious. This study provides a theoretical basis and practical reference for the low-carbon utilization of urban land from the perspective of innovation in China.

1. Introduction

The global warming caused by carbon emissions from human production and daily activities seriously threatens the living environment of mankind, and the governments of all countries have taken active measures to deal with this problem. To cope with global climate change, in September 2020, the Chinese government clearly put forward the double carbon policy goals of “carbon emissions peak” in 2030 and “carbon neutrality” in 2060. Urban land is not only the spatial carrier of production, living, and ecology [1,2] but also the spatial carrier of urbanization [3]. Land development and expansion in the process of urbanization is one of the major sources of carbon emissions [4,5]. As the world’s second largest economy and the most important carbon dioxide emitter, China’s carbon emissions account for 30.66% of the world’s total emissions in 2020 [6]. The extensive land use mode of focusing on scale and speed is an important reason for the high carbon emissions [7], the continuous deterioration of the social ecological environment [8], and the low efficiency of urban land use [9]. Compared with the world average, China is still at the stage of deepening urbanization development, and there is still much room for improvement in terms of urbanization construction [10]. The pressure of energy demand and carbon emission reduction will continue to increase [11], which will continually threaten the sustainable use of urban land and the sustainable development of the economy and society in China. Therefore, under the background of global warming and urbanization, how to improve the efficiency of low-carbon use of urban land and realize the transformation of urban land use to make it more low-carbon, economical, and intensive has become an urgent problem to be solved in order to maintain a sustainable economy and social development in China and around the world.
Urban land low-carbon use efficiency is a measure of the integration of the unexpected output of carbon dioxide into the urban land use system using technical expertise with the aim of achieving the maximum economic and social output with the minimum input factors and the minimum carbon emissions [12] while taking into account the dual objectives of economic and social development and carbon reduction. For a long time, innovative development, especially technological innovation, has been considered an effective measure to reduce carbon emissions and achieve a low-carbon economy [13,14]. The Chinese government has formulated a series of innovation-driven development strategies to realize the transformation of land use to create a more low-carbon, economical, and intensive economy. Among them, the most typical is the construction of National Independent Innovation Demonstration Zones (NIIDZ). NIIDZs not only emphasize the stimulation of enterprise innovation through policy incentives, resource preferences, and strategic guidance but also entail the tasks of building a green, low-carbon, and recyclable ecological industrial system [15]. Thus, has the construction of NIIDZs effectively improved the low-carbon utilization efficiency of urban land? If the answer is yes, what is the impact mechanism? Is there any heterogeneity? Exploring these issues is of great significance for China in implementing its innovation-driven-development strategy and promoting the low-carbon and sustainable development of cities.
Studies closely related to the topic of this article are mainly focused on the following two branches of literature. The first branch focuses on the evaluation and influencing factors of urban land use efficiency. In terms of evaluation, some studies adopt economic output per unit land area (urban GDP per unit area or the ratio of total output value of secondary and tertiary industries to urban land area) to evaluate urban land use efficiency [16,17], which neglects the comprehensive effects of labor, capital, energy, pollution, and other factors [18]. Another part of the literature applies the concept of “green” to urban land use, including the comprehensive input elements (land, labor, capital, energy, etc.) and the comprehensive output elements (economic, social, environmental, and other unexpected outputs) of the land use system into the input–output decision-making unit. The data envelopment analysis (DEA) method is used to measure and evaluate the green use efficiency of urban land [1,19,20,21,22,23]. However, the data envelopment analysis method, which is based on the SBM (slack-based measure) model, cannot effectively deal with the radial and non-radial input–output relationship, which may lead to inaccurate measurement results when it comes to urban land green use efficiency [24].
In addition, with the deepening of global climate warming and the emergence of the concept of “low carbon”, there are also studies that aim to evaluate urban land use from the perspective of carbon emissions [3,25]. However, these works fail to include energy input and social output [3], and there may exist a correlation between multiple indicators in the indicator system, which is not conducive to the evaluation results [9,25]. In order to overcome the shortcomings of previous studies on the evaluation of urban land use efficiency and its influencing factors, this study incorporates energy input and social output into the evaluation system of urban land low-carbon use efficiency and adopts the EBM (epsilon-based measure) model, which can effectively deal with the input–output relationship with both radial and non-radial characteristics to measure urban land low-carbon use efficiency. In terms of influencing factors, most past studies have investigated the driving mechanism of urban land use efficiency in terms of such factors as industrial structure [26], urbanization [27], land transfer marketization [28], and population density [3] and have neglected the key factor of innovation-driven development. Therefore, this study will systematically investigate the impact of innovation-driven development, a key driving mechanism of the low-carbon utilization efficiency of urban land.
The second branch of the literature assesses the policy effects of NIIDZ construction. Most papers investigate the construction effect of innovative cities from the perspectives of carbon emissions [29], environmental pollution [30], green technology progress [31], and ecological efficiency [32]. Other studies look at the policy design, regional differences, and strategic positioning of NIIDZs [15] and evaluate the construction effect of NIIDZs from the perspectives of innovation capacity [33] and environmental pollution [15]. In addition, some studies point out that the government’s scientific and technological investment can effectively improve the green use efficiency of urban land [34], and others point out that urban innovation has indeed promoted the growth of urban land and emphasize that the research on the impact of innovation-driven development policies on urban land use need to be further improved [35]. However, these studies fail to solve the problem of mutual causality between urban innovation and the sustainable use of urban land and cannot accurately assess the impact of innovation-driven development on the sustainable use of urban land. In order to make up for these research deficiencies in the existing literature, this study takes NIIDZ construction, an innovation-driven development policy, as a quasi-natural experiment to accurately evaluate the impact of innovation-driven development on the low-carbon utilization efficiency of urban land in China.
By comprehensively and systematically investigating the impact of the NIIDZ construction on the low-carbon utilization efficiency of urban land in China from both theoretical and empirical perspectives, this study aims to accomplish the following three research objectives: (1) On the basis of accurately measuring the low-carbon utilization efficiency of urban land in 283 cities in China, we aim to accurately evaluate the impact of NIIDZ construction on the low-carbon utilization efficiency of urban land. (2) By combining theoretical and empirical analysis, this work tries to analyze and systematically examine the influence mechanisms of green technology innovation and economies of scale of NIIDZ construction on the low-carbon utilization efficiency of urban land in China in depth. (3) From the three dimensions of urban location, urban scale, and urban natural resource endowment, this study examines the differential influence of NIIDZ construction on the low-carbon utilization efficiency of urban land in China. Then, from the perspective of innovation-driven development in China, we formulate a theoretical basis and practical reference for global low-carbon sustainable use of urban land.

2. Policy Background and Theoretical Analysis

2.1. Policy Background

A NIIDZ is an area that takes the lead in promoting independent innovation and high-tech industry development, exploring experience, and making demonstrations. Their creation is approved by the State Council of the People’s Republic of China and is a forward position and pilot area for implementing innovation-driven development strategies. In 2009, China established the first, the “ZhongGuanCun National Independent Innovation Demonstration Zone”, in Beijing. By May 2022, China has built 23 NIIDZs in more than 60 cities in the country. At the same time, the Chinese government has successively issued many policy documents to design and plan the development goals and key tasks of NIIDZs to ensure the scientific and orderly implementation of this pilot policy [15]. Among the 283 cities included in this paper, 54 cities are NIIDZ pilot cities, and the remaining 229 cities are non-pilot cities. The sample of NIIDZ pilot cities in this paper is shown in Figure 1. It can be concluded that the numbers of NIIDZ pilot cities in the eastern, central, and western regions are 31, 17 and 6, respectively. The number of pilot cities decreases from the eastern region to the western region.
The basic geographic data were obtained from the Global Administrative Regionalization Database (http://www.gadm.org/, accessed on 21 September 2022).

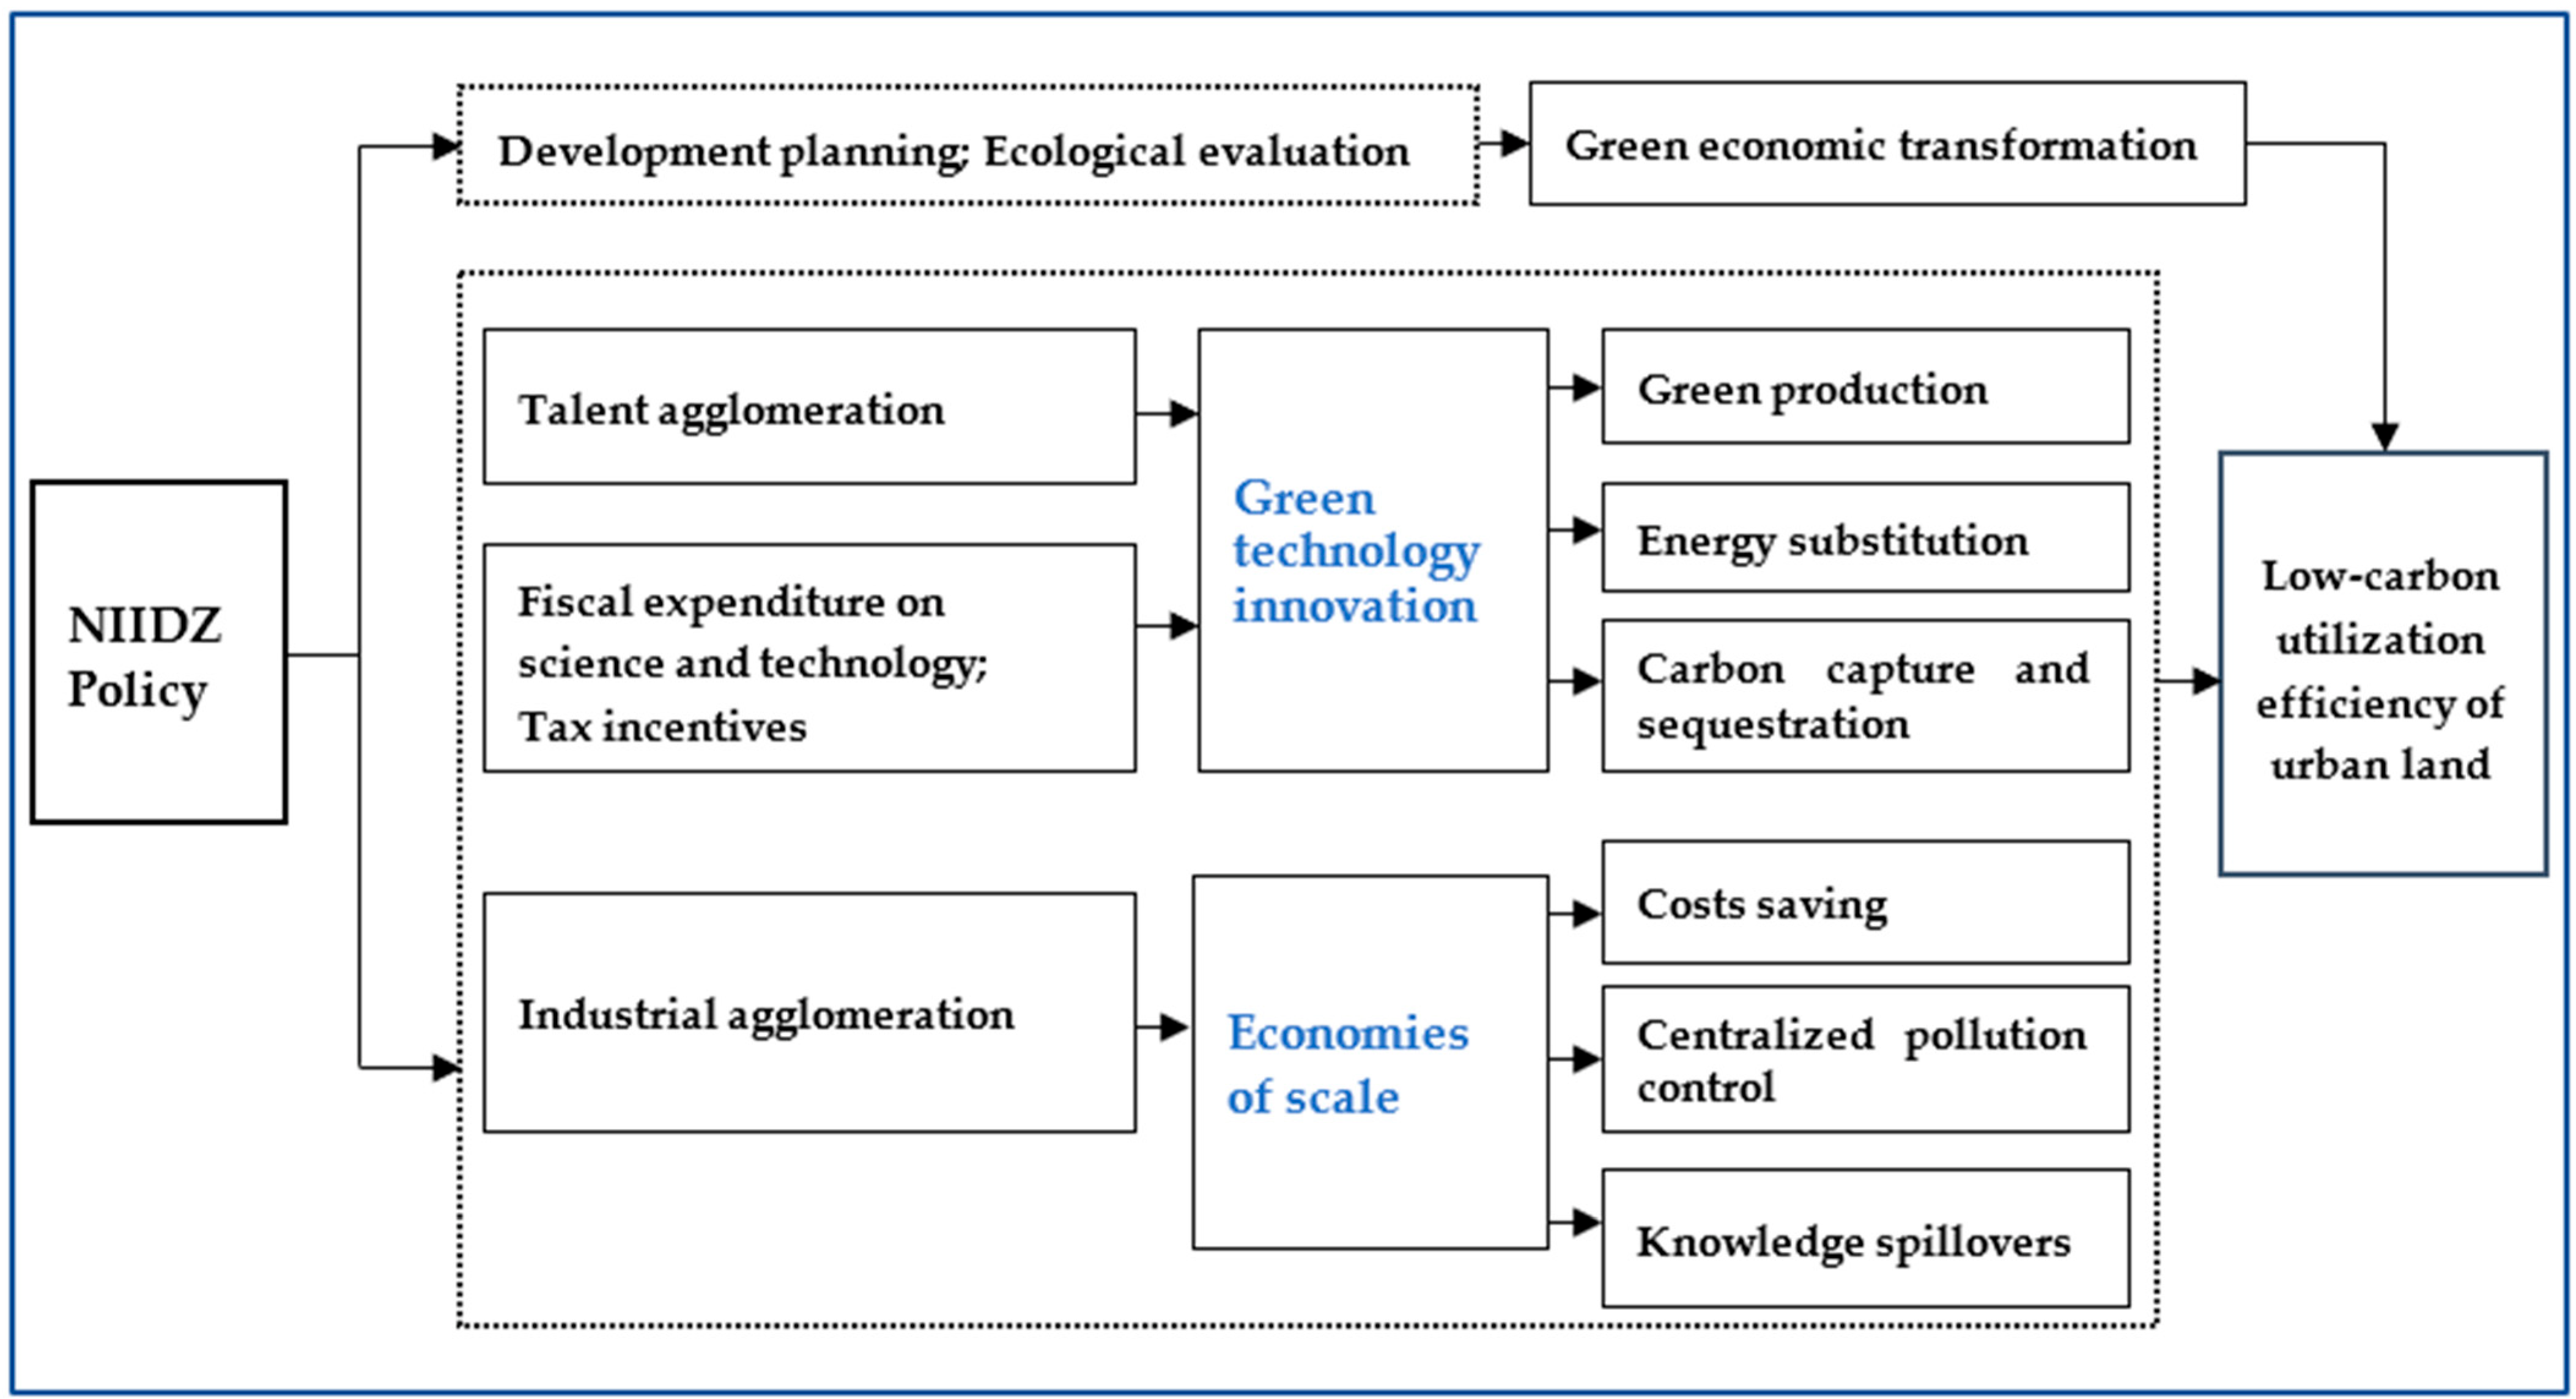
2.2. Theoretical Analysis

The improvement of urban land low-carbon utilization efficiency, on the one hand, benefits from the improvement of land use productivity, and on the other hand depends on a reduction in carbon emissions in land development. The construction of NIIDZs provide conditions for both. For one thing, under the guidance of the government’s land use planning policy for innovation development, the construction of a NIIDZ comprehensively implements the strategy of intensive and economical land use and promotes the improvement of urban land use efficiency by strengthening the adjustment of industrial structure and accelerating the transformation of the economy [36]. For another, the construction of a NIIDZ guides the production behavior of enterprises through development planning, environmental regulation, ecological evaluation, and fiscal expenditure so as to improve the energy efficiency and reduce carbon emissions in the process of land use [37]. Based on this, we propose the first hypothesis:
H1. 
The construction of National Independent Innovation Development Zones can help improve the low-carbon utilization efficiency of urban land.
In addition to the abovementioned direct effects, NIIDZ policies also exert indirect impacts on the low-carbon utilization efficiency of urban land.
First, the realization of “carbon peaking” and “carbon neutralization” strategies require green technology innovation, which is the key to achieving energy conservation and improving the efficiency of low-carbon land use [38,39]. According to the environmental Kuznets curve (EKC) [40], technological innovation is an important factor affecting environmental governance. Green technology innovation can enable enterprises to upgrade production technology and boost enterprises’ green production [41], thus improving the low-carbon use efficiency of land. Meanwhile, carbon emissions in land use mainly come from energy use [42]. Green technology innovation can accelerate the development of photovoltaic power, wind power, and other renewable energies, can effectively promote the development of new energy [38], and is conducive to the transformation of the energy consumption structure to green, low-carbon, and clean energy, thus helping to reduce carbon emissions from energy use and improve the low-carbon efficiency of land use. From the perspective of carbon emission control, green innovation technology provides technical support for the capture, storage, utilization, and carbon sequestration of carbon emissions [43] in land use. It can be seen that the improvement of low-carbon land use efficiency cannot be separated from support for green technology innovation.
It is worth emphasizing that the construction of National Independent Innovation Demonstration Zones can promote the development of green technology innovation in the following ways: for one thing, the construction of a NIIDZ can attract a large number of high-quality human capital [44], providing talent support for green technology innovation in enterprises (universities and scientific research institutions); for another thing, the NIIDZ provides fiscal expenditure on science and technology and tax incentives for the development of enterprises, alleviates the financial constraints of enterprises, and encourages enterprises to carry out green technology research and development.
Based on the above analysis, we propose the second hypothesis:
H2a. 
The construction of National Independent Innovation Demonstration Zones can improve the low-carbon utilization efficiency of urban land by promoting green technology innovation.
In addition to green technology innovation, NIIDZs can also generate the effects of economies of scale through industrial agglomeration [45], which in turn promotes the low carbon use of urban land. Specifically, economies of scale are reflected in the following aspects: On the one hand, industrial agglomeration can reduce the transportation, communication, and management costs of factors and reduce energy consumption and carbon emissions in land use. On the other hand, industrial agglomeration can encourage enterprises to carry out centralized production, centralized management, and centralized pollution control so as to promote emissions reductions in enterprise land use [46]. In addition, knowledge spillovers and the cost savings of economic agglomeration help enterprises to develop and improve green production technologies and further enhance their efficiency and emission reduction capabilities. Therefore, the third hypothesis can be proposed as follows:
H2b. 
The construction of National Independent Innovation Demonstration Zones can improve the low-carbon use efficiency of urban land via economies of scale.
The impact of the National Independent Innovation Demonstration Zone policy on the low-carbon use efficiency of urban land is summarized in Figure 2.

3. Methods and Variables

3.1. Model Setting

As a representative innovation pilot policy, the NIIDZ pilot is implemented in batches in many different cities. Judging from the geographical distribution of the pilots, NIIDZs are scattered all over the country, covering many economically developed regions and many economically backward regions, which proves that the site selection has a certain randomness. To explore the influence of NIIDZ on the low-carbon utilization efficiency of urban land, according to a staggered DID model, we set the model as Equation (1):
U L U i t = α 0 + α 1 d i d i t + φ X i t + μ i + v t + ε i t
Equation (1) is a two-way fixed effect model of the DID method. The explained variable ULUit represents the low-carbon utilization efficiency of the urban land of city i in year t. didit is the policy dummy variable of NIIDZ. Xit is a set of control variables affecting the low-carbon efficiency of urban land use. μi and vt indicate region and year fixed effects, respectively. εit is the random disturbance term. α0, α1, and φ are parameters to be estimated.
To further investigate the influencing mechanisms, referring to Baron & Kenny [47], on the basis of Equation (1), the mediating effect models are displayed as Equations (2) and (3):
M i t = β 0 + β 1 d i d i t + λ X i t + μ i + v t + ε i t
U L U i t = ρ 0 + ρ 1 d i d i t + ρ 2 M i t + γ X i t + μ i + v t + ε i t
where Mit represents the mediating variable. In this study, we regard green technology innovation and economies of scale as two mediating variables. Xit indicates a set of control variables the same as in Equation (1). If β1 and ρ2 are both significant, this implies that the mediating effect is effective. Furthermore, in Equation (3), if ρ2 is significant and ρ1 is not significant, this indicates that this mediating effect is a full mediating effect; otherwise, when ρ1 in Equation (3) is significant, this implies that there exists a partial mediating effect.

3.2. Variables

3.2.1. Explained Variable

We adopt the low-carbon utilization efficiency of urban land (ULUit) as the explained variable, which not only reflects the economic output capacity of urban land as a factor of production but also takes into account carbon emissions, implying the concept of “low-carbon development”. As for the calculation of the ULU, we were inspired by Tone and Tsutsui [48] to adopt the Super-EBM model. The calculation formula of the Super-EBM model with non-radial, undesirable output and variable return to scale is as follows:
γ = m i n θ ε x 1 i = 1 m ω i i = 1 m ω i s i x i k φ + ε y 1 r = 1 l ω r + r = 1 l ω r + s r + y r k + ε b 1 t = 1 p ω t b t = 1 p ω t b s t b b t k s . t .   j = 1 j k n x i j λ j + s i = θ x i k , i = 1 , , m   j = 1 j k n y r j λ j s r + = φ y r k , r = 1 , , l   t = 1 j k n b i j λ j + s t b = φ b t k , t = 1 , , p   j = 1 j k n λ j = 1     λ j 0 , s i , s r + , s t b 0 , θ 1 , φ 1
where γ indicates the best efficiency value of the EBM model under a variable return to scale and θ is the planning parameter of the radial part. ω r +   and   ω t b represent the weight of the desirable output and the weight of undesirable output, respectively. s r + and s t b are the slack variables of the desirable output of type r and the slack variables of the undesirable output of type t. b t k stands for the tth undesirable output of DMUk (the kth decision-making unit). m ,   l , and p denote the total number of inputs, desirable outputs, and undesirable outputs, respectively.
Meanwhile, the DEA method is adopted to calculate ULUit, which involves the indicators construction of input, desirable output, and undesirable output, which are demonstrated in Table 1.

3.2.2. Core Explanatory Variable

The core explanatory variable in this study is didit. didit = pilot × time. pilot equals 1 if the city covers a NIIDZ and is 0 otherwise. Similarly, in the year when the National Independent Innovation Demonstration Zone is approved and in subsequent years, the variable time is assigned 1, and 0 otherwise.

3.2.3. Mediating Variable

(1) Green technology innovation (Innov): Invention patents are highly innovative and can better measure regional innovation ability. This paper uses green invention patent applications per 10,000 people to measure the green technology innovation level [51].
(2) Economies of scale (EOS): Economies of scale can effectively improve economic efficiency and reduce pollution emissions. This paper uses GDP output per administrative area to measure economies of scale [14,52,53].

3.2.4. Other Control Variables

Based on the STIPAT model [54,55], this work selects other factors that affect urban carbon emissions and low-carbon use efficiency of urban land as control variables:
(1) Environmental regulation (ER): Environmental regulation may increase the emission cost per unit land area of enterprises and may also force enterprises to innovate, thus affecting the low-carbon utilization efficiency of urban land. In this paper, the removal rate of SO2, the removal rate of industrial smoke (dust), and the comprehensive utilization rate of industrial solid waste are selected, and the entropy method is used to comprehensively calculate the ER [56].
(2) Foreign direct investment (FDI): FDI, for one thing, may bring advanced green and low-carbon technologies to the host country, and for another it may also bring high pollution and high emission industries to the host country, thus affecting the low-carbon utilization efficiency of urban land. In this paper, the proportion of GDP that comes from actual foreign investment annually is used to measure the FDI [57].
(3) Marketization level (Market): Marketization is conducive to the flow of production factors to industries with high efficiency and low emissions and to the improvement of the low-carbon utilization efficiency of urban land. The proportion of employment by individual and private enterprises of total employment is used to measure the degree of marketization [58,59].
(4) Financial development level (Fin): Fin may help enterprises to invest in projects with high emissions and high pollution, which is not conducive to the improvement of the low-carbon utilization efficiency of urban land. This paper uses the proportion of loan balance at the end of the year to GDP to measure financial development [60,61].
(5) Industrial structure (Indus): The more reasonable the industrial structure, the higher the industrial efficiency per unit land area, which is conducive to the improvement of the low-carbon utilization efficiency of urban land. The proportion of the added value of the secondary industry in GDP is adopted to measure the Indus [62].
(6) Wealth level (Wealth): The higher the wealth level, the more residents may consume high-end green products, thus forcing enterprises to carry out green transformations. The average wage of urban employees is used to measure Wealth [55].
(7) Technology development level (Tech): Technological development contributes to the improvement of green and low-carbon technologies and the improvement of the low-carbon utilization efficiency of urban land. In this paper, total factor productivity is used to measure Tech [54,63].
(8) City size (Scale): Scale may increase the carbon emissions per unit land area. At the same time, it may reduce the population commuting cost and carbon emissions. In this paper, population density is used to measure Scale [54,64].
All the variable definitions are demonstrated in Table 2.

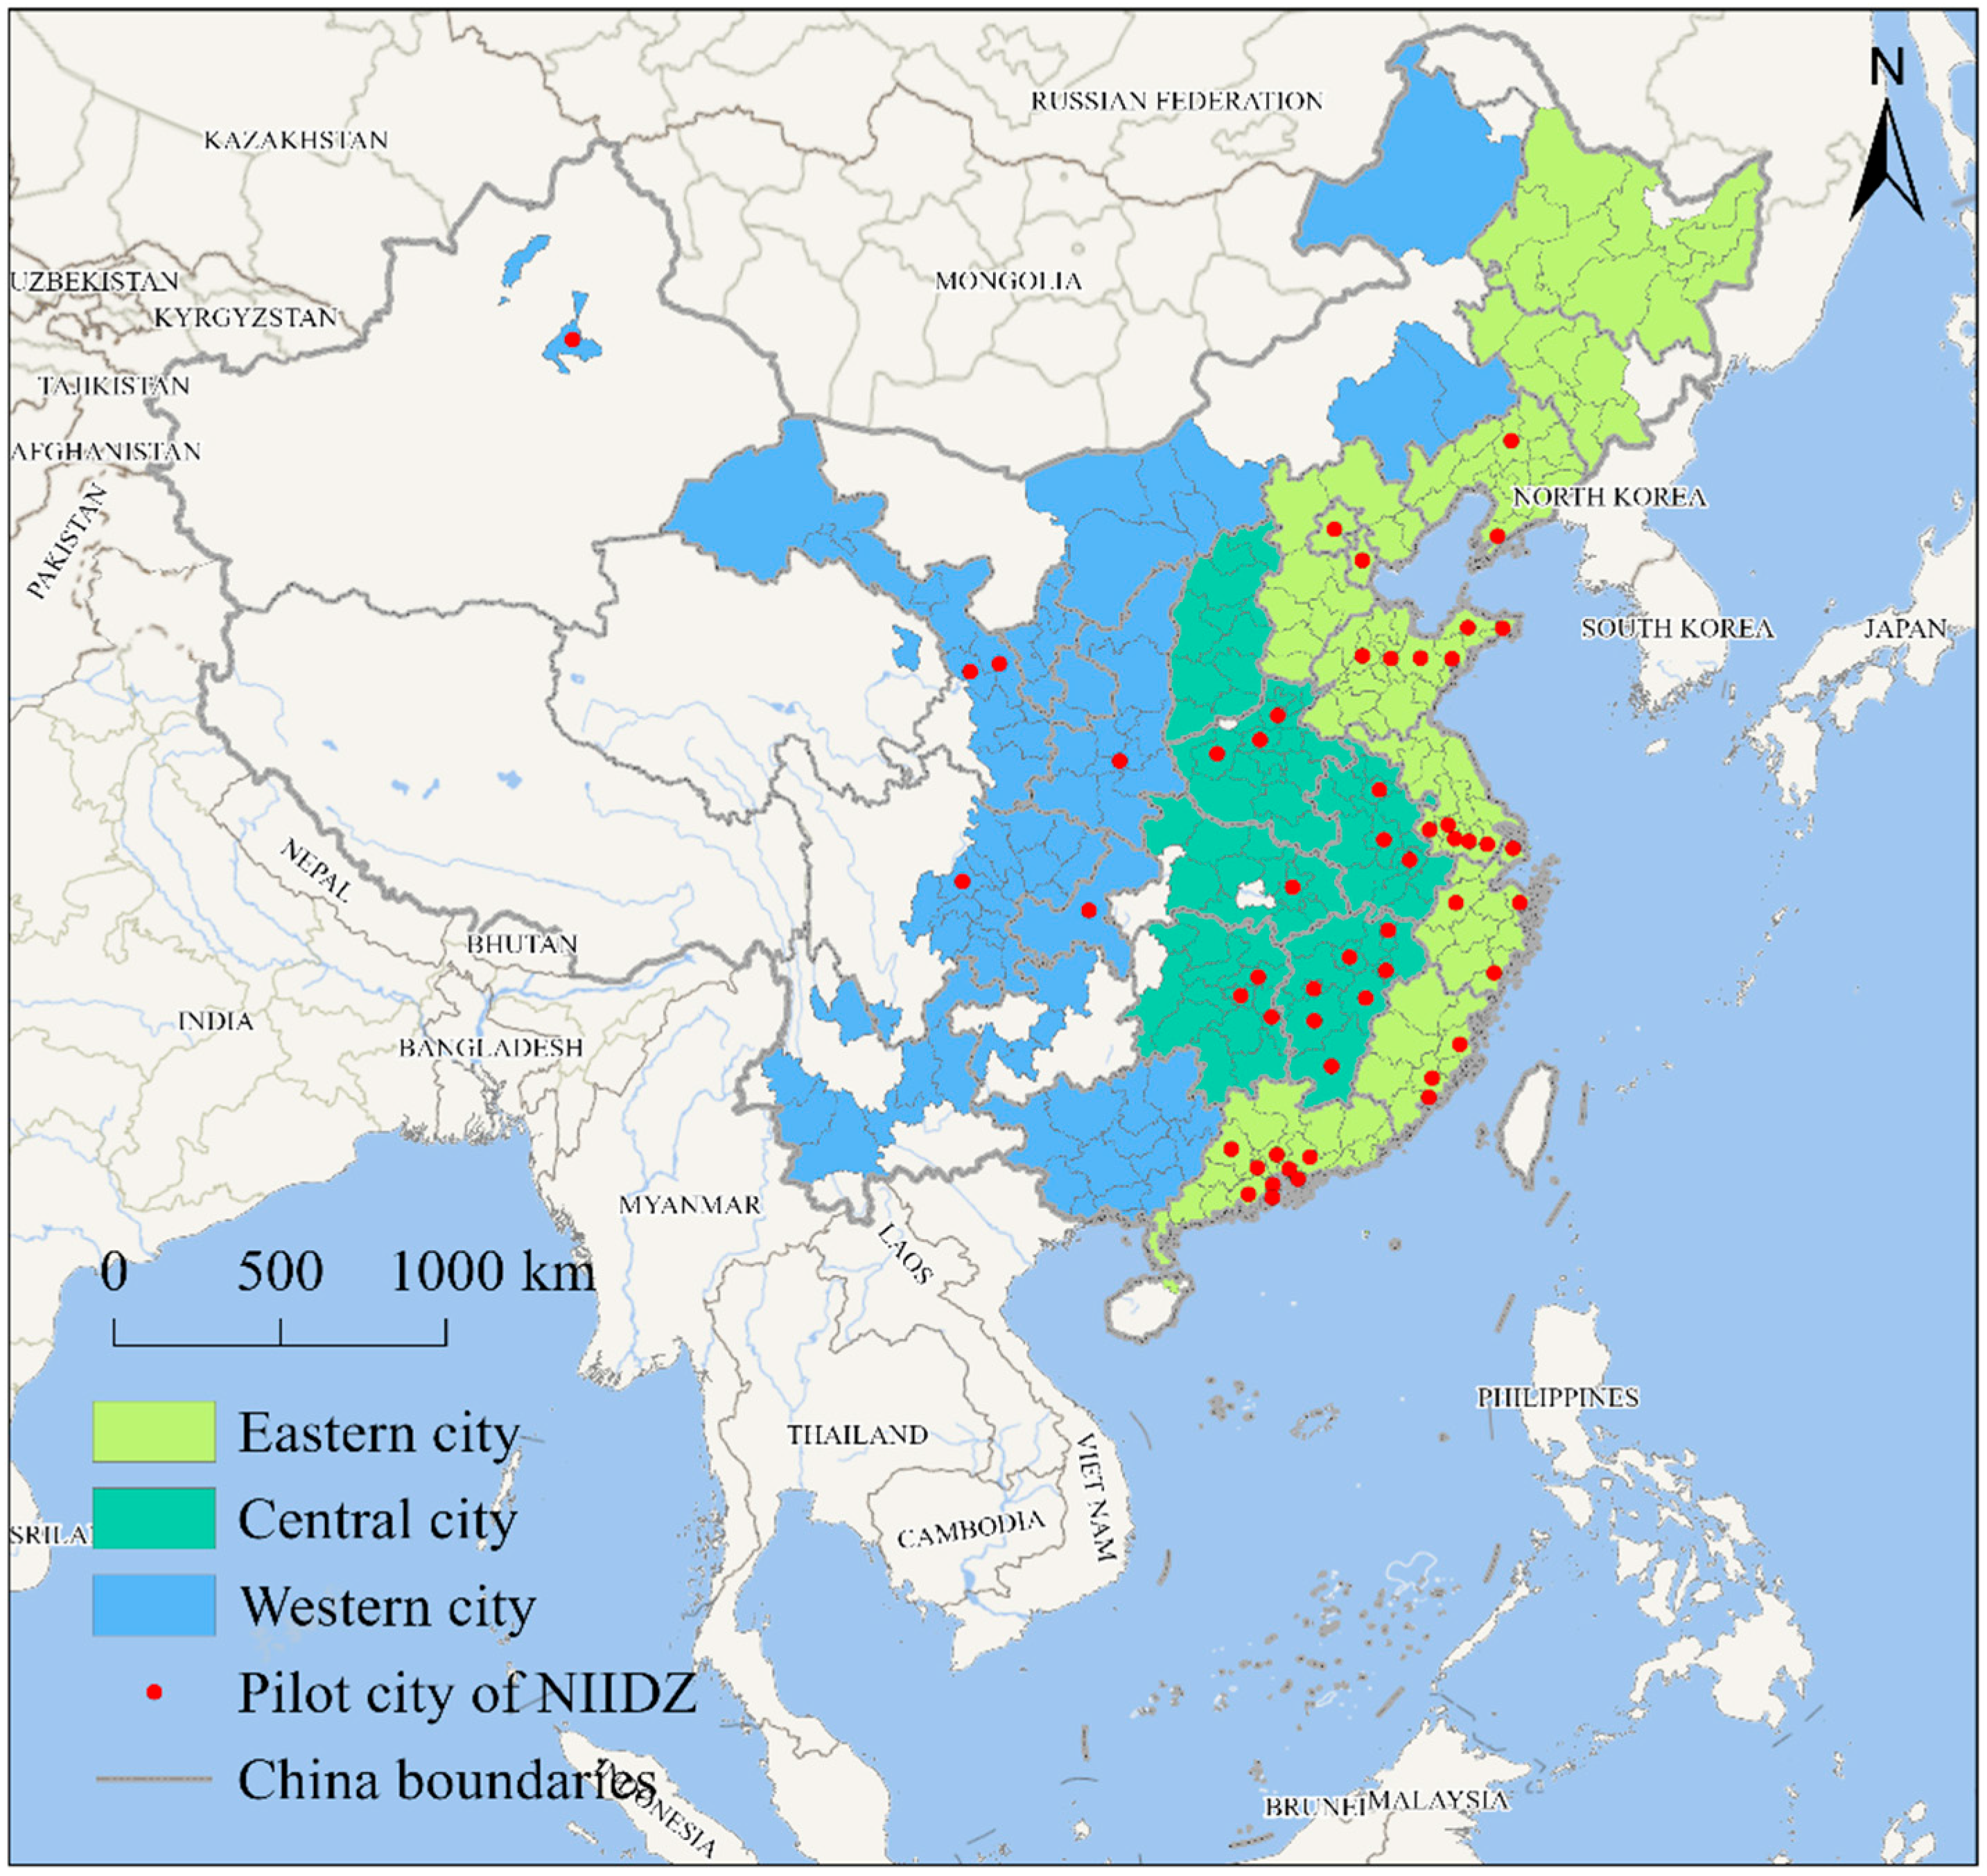
3.3. Data Resource and Description

This paper selects the panel data of 3962 observations from 283 prefecture level cities in China from 2006 to 2019 as the research sample. Among them, the experimental group includes 53 cities, and the control group includes 230 cities. The data come mainly from China City Statistical Yearbook (2007–2020), China Statistical Yearbook (2007–2020), and the EPS database. The descriptive statistical results of each variable are shown in Table 3.

4. Empirical Results Analysis

4.1. Baseline Regression

We use the progressive DID model to estimate Equation (1), and Table 4 reports the baseline regression results of Equation (1). First, without adding control variables, column (1) shows that the estimated coefficient of the policy variable (did) is 0.1083, which passes the significance level test at the 1% level; second, column (2) shows that the regression coefficient of did is 0.1093, which is significant at the 1% level when the control variables are added but the time fixed effect is not controlled; finally, column (3) implies that after controlling for the relevant influencing variables and two-way fixed effects, the estimated coefficient of did is 0.1126, which meets the significance level of 1%, indicating that the NIIDZ pilot policy can significantly promote the growth of the low-carbon utilization efficiency of urban land. Specifically, the construction of NIIDZs increased the low-carbon utilization efficiency of urban land by about 11.26%. This estimation result confirms research Hypothesis 1. This conclusion is also highly similar to the results of past studies [35,65]; that is, innovation-driven, development-oriented land use can reduce pollution emissions and promote sustainable urban land use.
Concerning the effects of other control variables, from column (3) it can be seen that Market, Indus, Wealth, Tech, and Scale all exert significantly positive impacts on the low-carbon utilization efficiency of urban land. Possible reasons include that the improvement of the degree of marketization is more conducive to using the price mechanism to adjust land supply and demand, which improves the low-carbon use of urban land. Moreover, industrial structure adjustments are conducive to an increase in the output per unit of urban land area and carbon emission reduction. Technological progress is an important factor in achieving economic growth and carbon emission reduction, and it will also have a positive impact on the low-carbon and efficient use of land. The expansion of the urban population can provide talent support for the efficient development and low-carbon utilization of urban land [38], and an increase in per capita wealth is conducive to the growth of green consumption, thus guiding the green transformation of the urban economy and contributing to the low-carbon utilization of urban land.

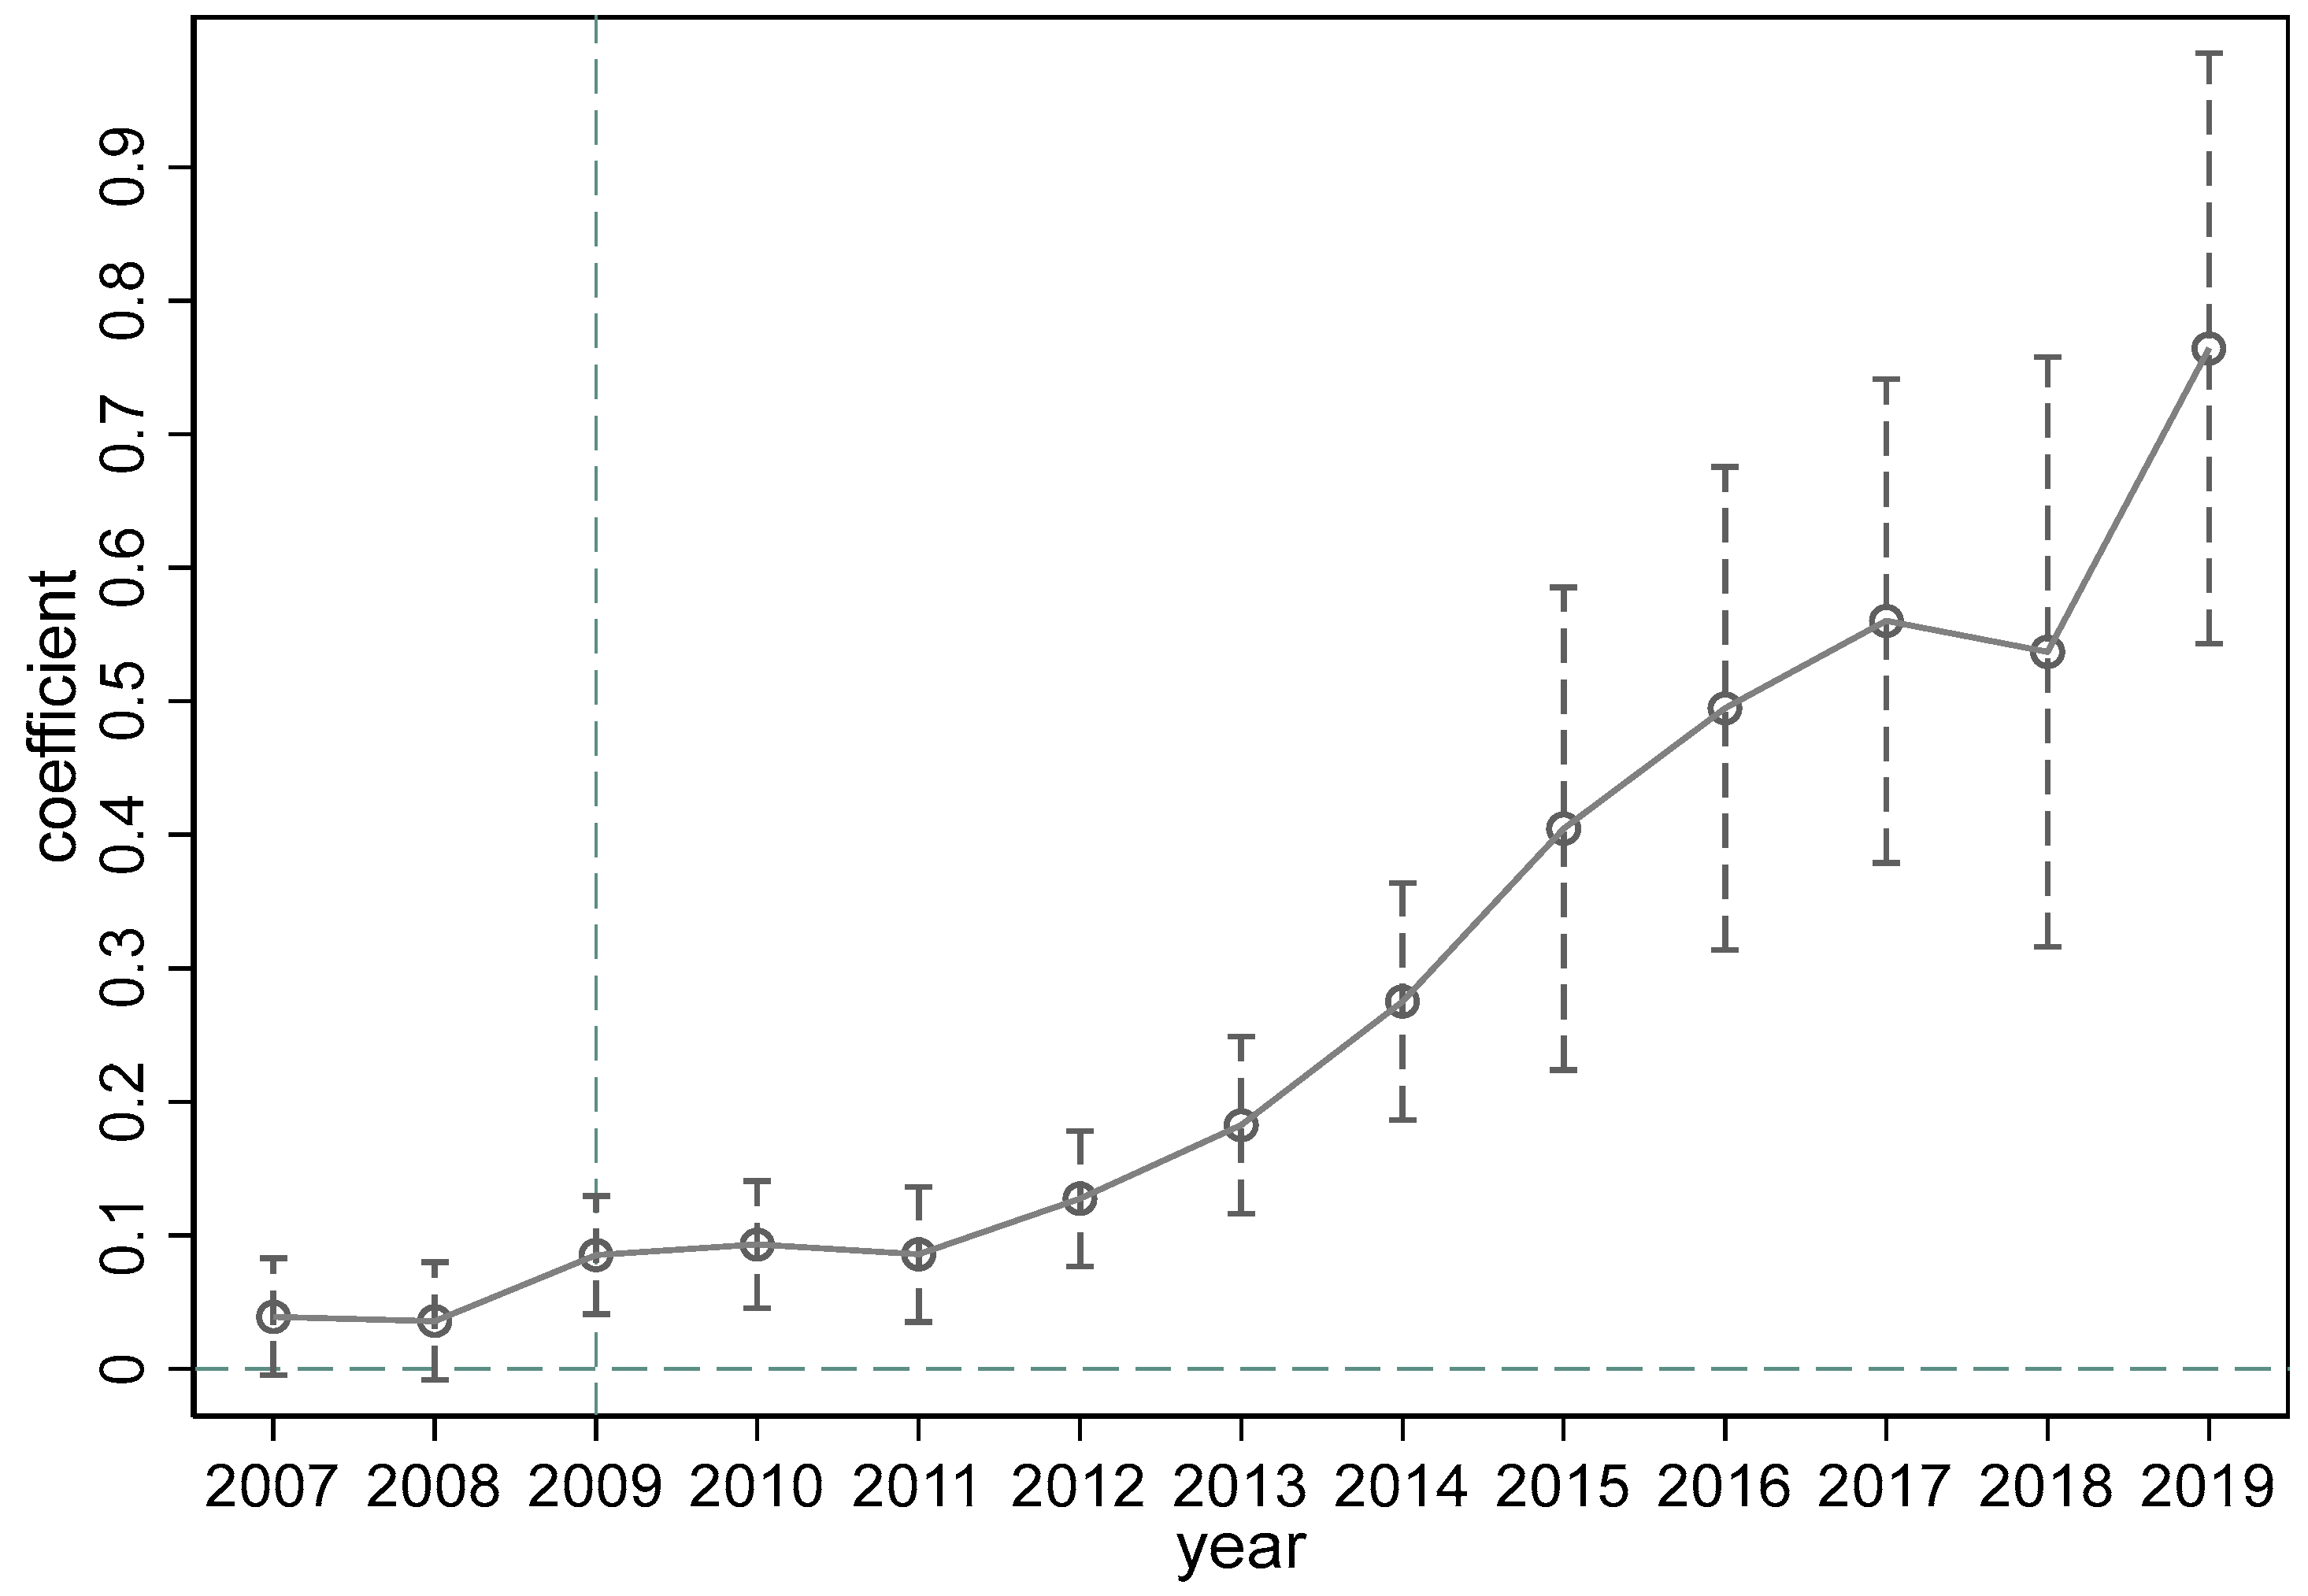
4.2. Parallel Trend Test

An essential premise for the accuracy of a DID model estimation is that the samples in the treatment group and the control group have the same or similar trends before the implementation of the policy. In order to test whether our research meets this premise, according to Zhi et al. [66], the dynamic effect of NIIDZs is tested by the following Equation:
U L U i t = θ 0 + t = 2 1 θ t ~ d i d i t + t = 1 11 θ t ~ d i d i t + γ X i t + μ i + v t + ε i t
where did = pilot × time. pilot equals 1 if the city covers a NIIDZ and 0 otherwise; time is assigned 1 when the NIIDZ is approved and in subsequent years, and 0 otherwise. In this study, the two years before and ten years after the implementation of the NIIDZ are used as observation points. Figure 3 shows the estimation results of Equation (5) with a 95% confidence interval.
From Figure 3, it can be seen that in the two periods before the implementation of the pilot policy, the coefficient of did in each period shows no significant difference from 0, indicating that it meets the parallel trend hypothesis; that is, the policy effect evaluation in this paper is applicable to the DID model. From the year of the NIIDZ implementation and in the ten-year period after the implementation of the NIIDZ, the coefficient of did in each period is significantly greater than 0, which also verifies that the NIIDZ policy pilot exerts a significant positive impact on the low-carbon efficiency of urban land use. In addition, this promotion effect shows a gradually increasing trend with fluctuation over time.

4.3. Robuness Test

4.3.1. Exclude Other Policy Pilots

In order to eliminate the interference of other pilot policies on the regression results, this paper brings the low-carbon city pilot policy, smart city construction policy, innovative city pilot policy, and innovative industrial cluster policy into the benchmark model and re-estimates the model. The estimated results are shown in Table 5. Column (1) shows the regression results of the inclusion of low-carbon city construction policies. It can be seen that the construction of a NIIDZ significantly promotes the improvement of the low-carbon use efficiency of urban land. When the smart city pilots, innovative city pilots, and innovative industrial cluster policy are further added, the NIIDZ policy still significantly promotes the improvement of low-carbon use efficiency of urban land, with a promotion coefficient of 0.0873. Compared with column (3) of Table 4, the regression coefficient of NIIDZ is decreased.

4.3.2. Samples Reselection

Taking into account the differences in urban administrative level and economic scale, we exclude municipalities directly under the central government and sub provincial cities from the original samples. Generally speaking, in China, municipalities and sub-provincial cities are usually better than other cities in terms of economic development level and political support. Therefore, in order to reduce the sample variance, we re-select the samples. The estimation results are reported in column (1) of Table 6. The coefficient of did is still significantly positive, which is consistent with the regression results in Table 4.

4.3.3. PSM-DID Estimation

The application of a DID model requires that samples in the experimental group and control group have similar individual characteristics before the policy is implemented, otherwise serious sample selection bias will occur. In our study, the samples cover 283 cities located in different provinces. In order to control for the self-selection bias, we use the propensity score matching combined with the difference-in-differences (PSM-DID) method to re-estimate the regression results. Specifically, we first use logit regression to calculate the propensity score and then use the 1:1 nearest neighbor matching method to match the NIIDZ cities with non-NIIDZ cities to obtain the regression samples. The characteristic variables we choose include all control variables. Finally, the DID method is used again for causal identification. Column (2) of Table 6 shows the estimation results, implying that the NIIDZ policy can help improve the low-carbon efficiency of urban land use. In addition, the coefficient of did is 0.1065, which is smaller than that found in the benchmark regression results, indicating that the PSM-DID reduced the sample selection bias effectively.

4.3.4. Replacement of the Dependent Variable

In the benchmark regression, we use the EBM-DEA model to measure the dependent variable. Here, we re-estimate ULU by adopting the SBM model. In response to the shortcomings of the traditional DEA slack variable calculations and its non-proportional assessments [67], a slacks-based model (SBM) was developed by Tone [68]. Therefore, to examine the robustness of the estimation results, we re-calculate ULU using the SBM method. After replacing the dependent variable, Equation (1) is estimated again and the result is shown in column (3) of Table 6. The coefficient of did is still significantly positive at the 1% level, indicating that the NIIDZ policy improves ULU after controlling for other variables, which is consistent with the above results.

4.3.5. Re-Estimation by Traditional DID
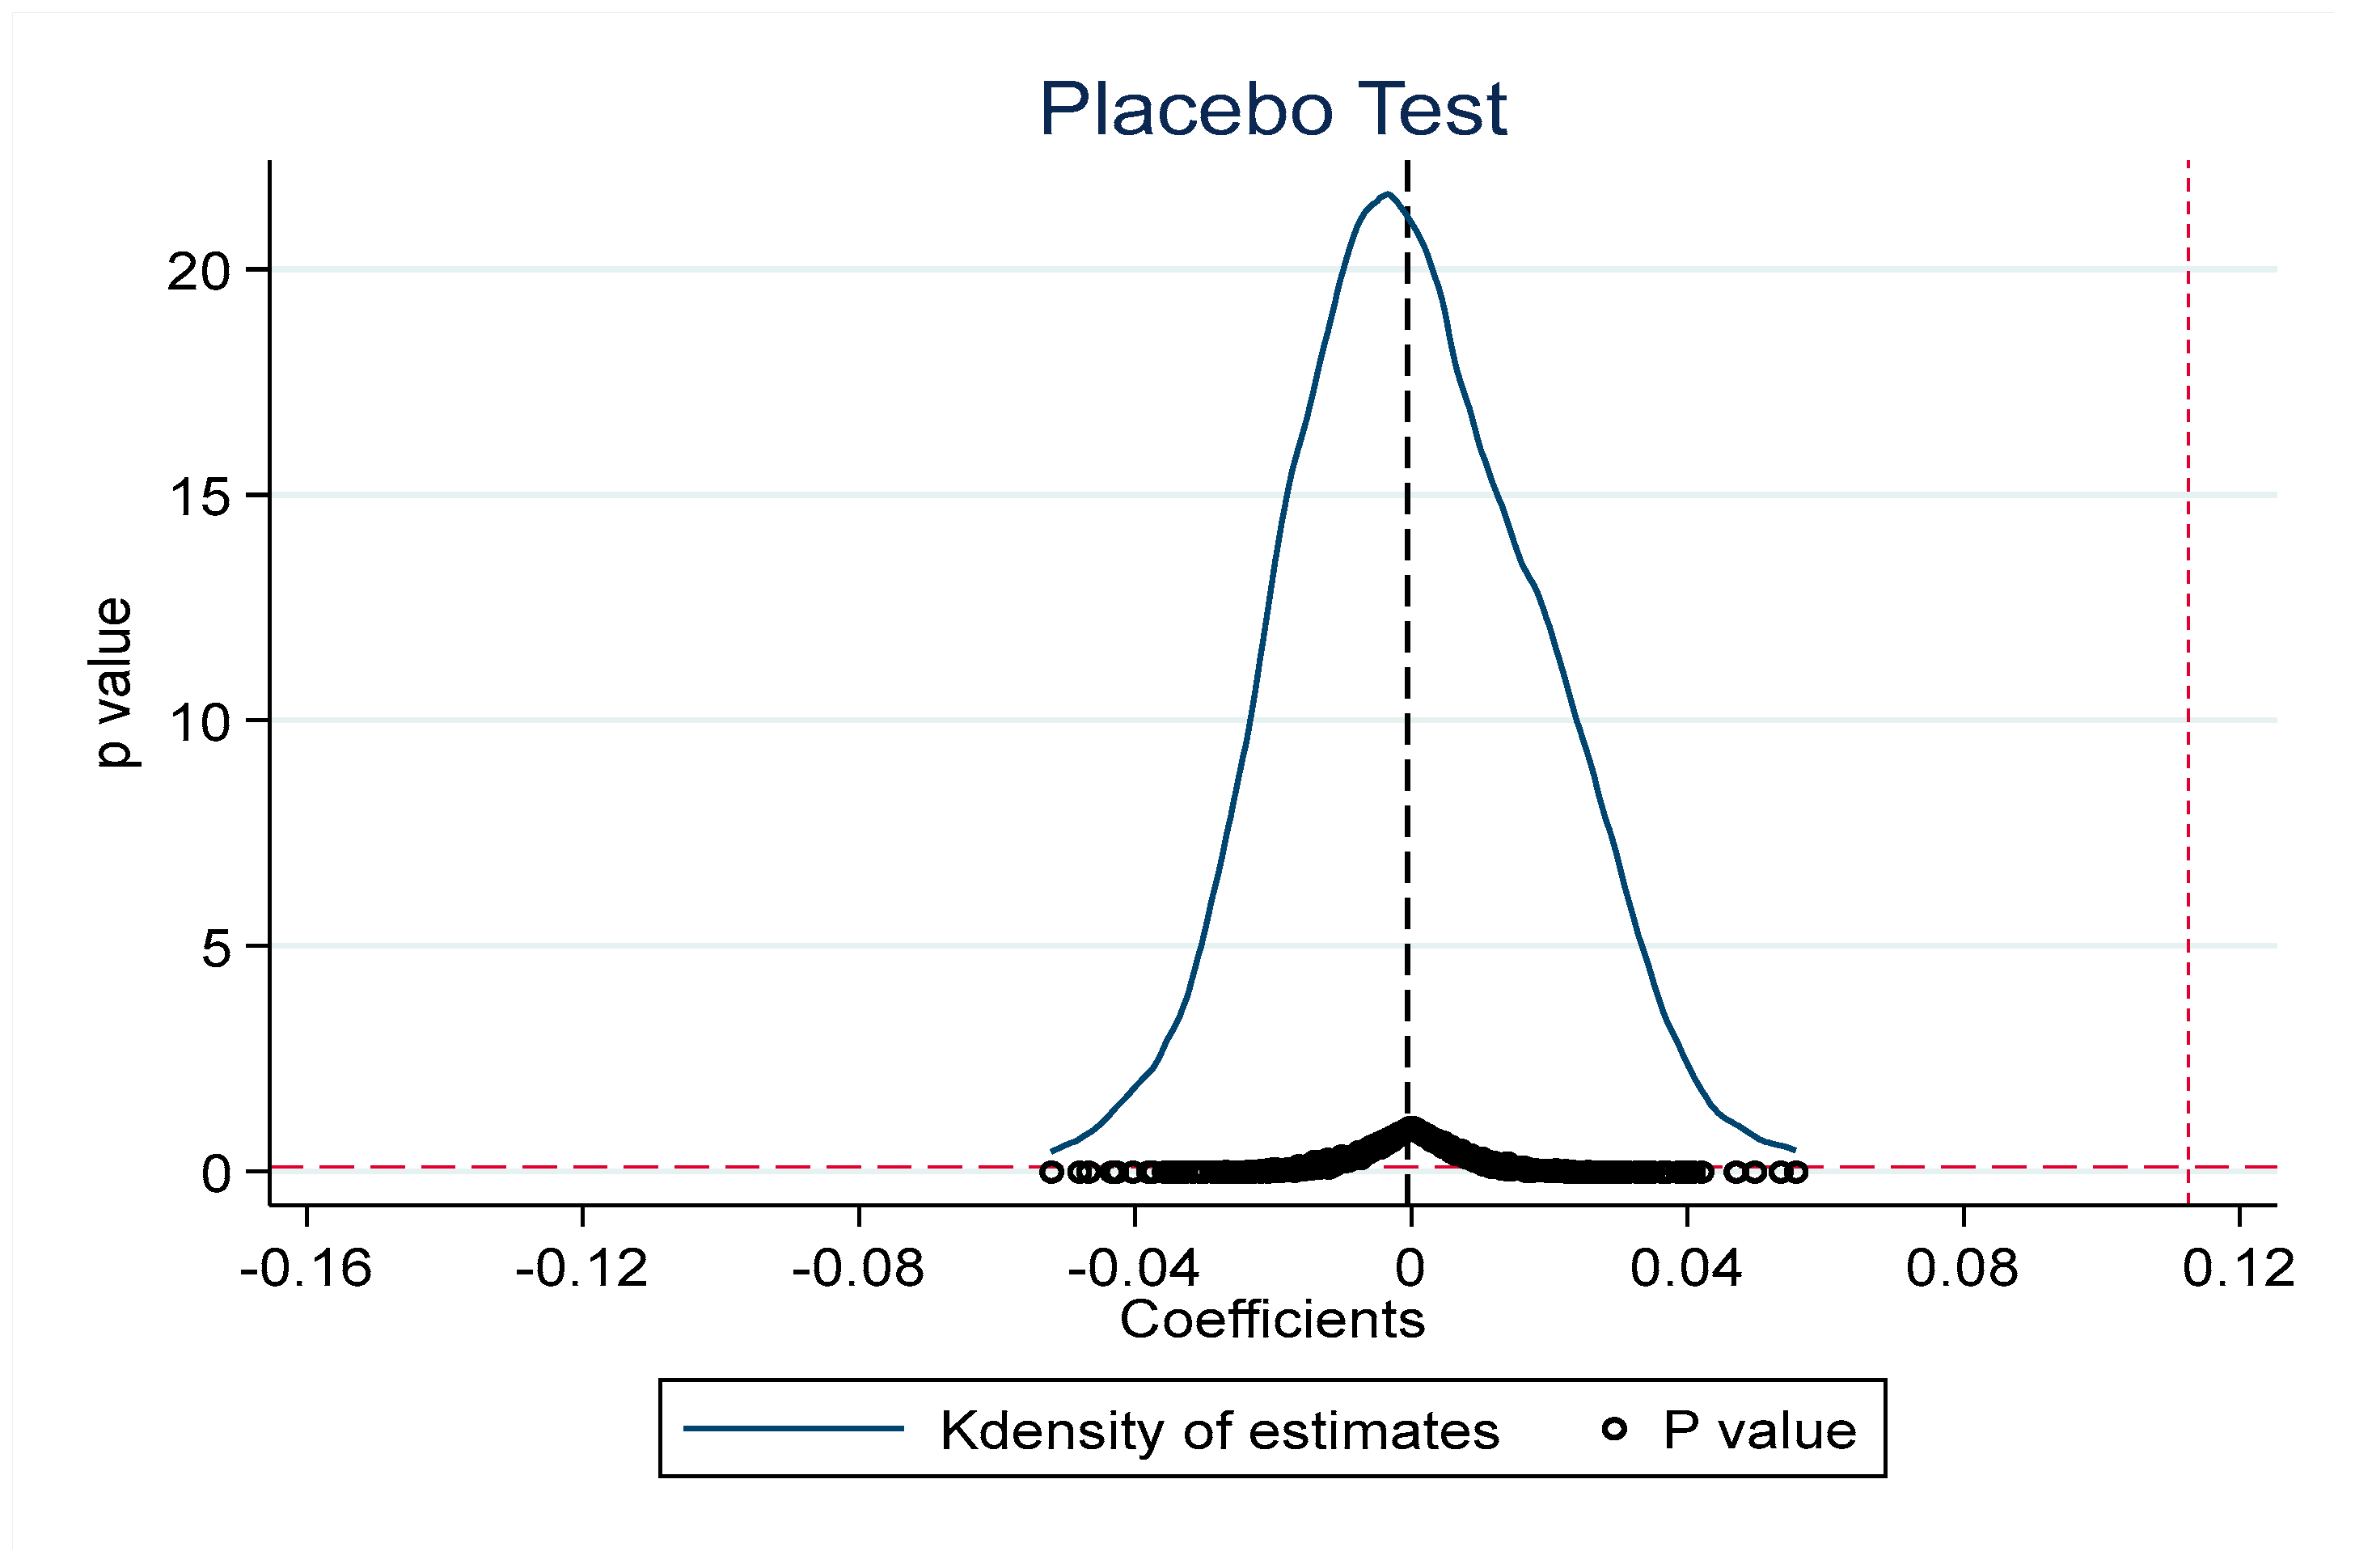
To further test the robustness of the abovementioned results, we use the traditional DID method to re-estimate the effect of NIIDZ on ULU. Take 2009 as the policy implementation year. The samples of cities that set up National Independent Innovation Demonstration Zones after 2009 are deleted. did0 indicates the policy variable, and the estimated coefficient of did0 in column (4) of Table 6 is still positive at the 1% significance level.

4.3.6. Placebo Test

We further performed a placebo test by randomly selecting the treatment group in the pilot year to eliminate the influence of unobserved factors. We repeated this process 500 times, and a DID estimation was conducted for each sample. Based on the 500 estimates, the kernel density diagram of the policy coefficients is shown in Figure 4. It was found that the kernel density plots of the estimated coefficients were basically normally distributed, with the symmetry axis at x = 0. Furthermore, most of the coefficients are distributed around 0, and most of the p-values are greater than 0.1. The red vertical dashed line represents the DID coefficient obtained based on actual policy evaluations. Obviously, the simulation results based on counterfactuals are quite different from the real results. Therefore, it is reasonable to believe that the previous estimation results are not accidental but real and effective.

4.4. Analysis of Action Mechanism

Both the benchmark regression results and the robustness test show that the establishment of the National Independent Innovation Demonstration Zone can significantly promote the low-carbon utilization efficiency of urban land. Thus, does NIIDZ affect ULU through green technology innovation and the effects of economies of scale? This section will answer this question. The mechanism analysis results are displayed in Table 7.
Columns (1) and (2) are the results when green technology innovation (Innov) is the mediating variable. Regression (1) examines the impact of the NIIDZ policy on Innov. The results show that the coefficient of the NIIDZ policy is positive and significant at the 1% level, indicating that the NIIDZ policy promotes green technology innovation. Regression (2) investigates the impact of the NIIDZ policy and Innov on ULU. The results show that the coefficient of the impact of Innov on ULU is positive and significant at the 1% level, indicating that Innov can prompt ULU. Combined with regression (1), NIIDZ can help improve ULU by exerting a positive impact on green technology. Based on the results, after controlling for the mediating effect of Innov, the coefficient of the effect of the NIIDZ policy on ULU is still positive and significant at the 1% level, indicating that Innov has a partial mediating effect. The mediating effect of Innov accounts for approximately 45.96% of the total effect.
Columns (3) and (4) report the results when economies of scale (EOS) is the mediating variable. Regression (3) shows that the NIIDZ policy exerts significant promotion effects on EOS. From regression (4), it can be seen that EOS and did both have a significant positive impact on ULU, implying that EOS has a partial mediating effect. Judging from the coefficient, the mediating effect of EOS accounts for about 6.44% of the total effect.
The results above show that Innov and EOS are two effective intermediary variables, and the reliability of Hypotheses 2a and 2b is verified. Furthermore, the NIIDZ policy can also improve the low-carbon use efficiency of urban land directly or through other indirect mechanisms.

4.5. Heterogeneity Discussion

In order to further investigate the heterogeneity of the impacts that the independent innovation demonstration zone pilot has on the low-carbon utilization efficiency of urban land, we classify the samples according to the different characteristics of cities and compare the regression results.
First of all, according to the geographical location and degree of economic development of the city, we divide the sample into the eastern, central, and western regions. Secondly, according to the population size of the city, cities with a population of more than 5 million are regarded as large size cities, and the rest are small and medium-sized cities. Finally, according to the differences in resource endowment, cities are divided into resource-based and non-resource-based. According to the classification of resource-based cities by the State Council, our sample includes 114 resource-based cities and 169 non resource-based cities.
The estimation results are shown in Table 8. The NIIDZ construction in the eastern, central, and western regions can significantly promote the low-carbon utilization efficiency of urban land with promotion coefficients of 0.0856 and 0.1345, respectively. The construction of NIIDZs in large cities can significantly promote the low-carbon utilization efficiency of urban land, while the construction of NIIDZ in small cities cannot promote the low-carbon utilization efficiency of urban land. The construction of NIIDZs in resource-based cities and non-resource-based cities can significantly promote the low-carbon utilization efficiency of urban land, and the promotion coefficient is 0.0492 and 0.1129, respectively. It can be concluded that the impact of NIIDZ construction on urban land low-carbon utilization efficiency is different in cities with different locations, scales, and resource endowments. Compared with eastern cities, small-scale cities, and resource-based cities, NIIDZ construction in central and western cities, large cities, and non-resource-based cities has a more obvious promotional effect.

5. Discussion

Urban land is the space carrier of low-carbon and sustainable development. How to improve the low-carbon utilization efficiency of urban land has become an urgent problem to be solved for the low-carbon sustainable development of China and the world. This study systematically and comprehensively examines the impact of China’s NIIDZ construction, a major innovation-driven strategy, on urban land low-carbon use efficiency, and draws many useful research conclusions. On the one hand, these research conclusions reveal the complex internal relationship between the construction of NIIDZs and the sustainable use of urban land in China, and provide a research basis for China to implement other innovation-driven development strategies to promote the sustainable use of urban land. On the other hand, it also provides theoretical reference and a practical basis for other countries to implement the innovation-driven development strategy, especially the construction of science and technology parks to promote the sustainable use of urban land, thus enriching the theoretical achievements and practical experience in innovation-driven development and sustainable use of urban land and other related fields. In addition, in the empirical operation of this study, the adoption of the progressive DID method and a series of robustness tests effectively support the reliability of the conclusions in this study. The discussion on the empirical results of this study is as follows.
This study for the first time brings innovation-driven development and the low-carbon use efficiency of urban land into the same analysis framework. Using the panel data of 283 cities in China from 2006 to 2019, the impact of the NIIDZ construction on the low-carbon use efficiency of urban land is investigated by adopting the progressive DID method. We find that compared with non-NIIDZ construction cities, the construction of NIIDZs help improve the land low-carbon utilization efficiency by 11.26% on average. With the passage of time, this lifting effect shows a trend of increasing volatility. Some researchers also point out that there are several links between urban innovation and urban land growth [35], and innovation-oriented land use transformation can reduce industrial pollution emissions in multiple ways [65]. In fact, the key task of NIIDZ construction is to transform the regional economic development model driven by innovation. One of its goals is to guide the allocation of land factors in green, low-carbon, and efficient innovative industrial clusters. Therefore, the construction of NIIDZs and the transformation of low-carbon use urban land have profound internal relations. This provides a reasonable explanation for the conclusion of this study. From the interpretation of the above conclusions, it can be seen that the construction of NIIDZs can indeed help the improvement of the low carbon utilization efficiency of urban land, which verifies hypothesis H1. In addition, China’s NIIDZ construction will continue to be promoted now and in the future. Its development model is gradually mature, its construction experience is constantly improving, and the number of pilot cities is constantly increasing; thus, the marginal utility of NIIDZ construction in improving the low-carbon utilization efficiency of urban land will gradually increase.
The theoretical and empirical results of the impact mechanism find that the NIIDZ construction promotes the low-carbon use efficiency of urban land by improving green technology innovation and generating economies of scale. Some documents point out that the construction of NIIDZ can significantly reduce the city’s carbon emissions by promoting technological innovation and optimizing the industrial structure [69]. Since the low-carbon use efficiency of urban land takes into account the economic efficiency and carbon emissions of unit land, the driving mechanism of NIIDZ construction to improve the low-carbon use efficiency of urban land is slightly different from this previous study because non-environmental technology innovation may expand the production scale per unit of land, increase energy consumption, and then offset the energy reduction brought by non-environmental technology innovation. In contrast, technological innovation in environmental protection can not only improve the economic efficiency of unit land but also reduce carbon emissions. Economies of scale can reduce the factor cost of the land input system, improve the economic efficiency of unit land, and help to obtain the largest output scale with less energy input. Therefore, from the interpretation of the above conclusions, it can be seen that the construction of NIIDZs can indeed improve the low-carbon use efficiency of urban land by promoting green technology innovation and generating economies of scale, which verifies hypotheses H2a and H2b.
Compared with eastern cities, small-scale cities, and resource-based cities, the construction of NIIDZs in central and western cities, large cities, and non-resource-based cities plays a more obvious role. Possible reasons include that compared with the eastern region, the central and western regions lack talent, capital, and technology, and thus the low-carbon utilization efficiency of urban land is not as high as that of the eastern region. In addition, some industries with high pollution and energy consumption characteristics in the eastern cities have been transferred to the central and western regions. The marginal effect of NIIDZ construction on promoting the low-carbon utilization efficiency of urban land in the central and western regions is greater than that in the eastern region. In addition, large cities have a high concentration of talent and scientific and technological expertise and have relatively complete information infrastructure in education, medical care, transportation, and other fields, which is more conducive to the green technology innovation and scale economy promotion mechanism of NIIDZ construction. Finally, the economic development of resource-based cities mainly depends on coal, oil, metal mines, and other resources. Their industrial structure is singular, and their ability to attract talent, capital, and innovation is weak, which weakens the land low-carbon transformation effect of NIIDZ construction [70]. These research conclusions undoubtedly furtherly deepen and enrich hypothesis H1.
Essentially, the NIIDZ is a science and technology park. From a worldwide perspective, the construction of science and technology parks in many countries is also an important measure to implement innovation-driven development strategies. Science and technology parks provide a good environment for the innovation of high-tech enterprises [71,72], and promote urban technological innovation and land use efficiency. In addition, innovation factors are the key to industrial agglomeration. Science and technology parks attach importance to innovation factors such as innovative talents [73], giving play to the scale effect of economic agglomeration. These international experiences have provided important enlightenment for this study. However, some scholars point out that science and technology parks in Israel fail to promote enterprises’ innovation [74], and there is no significant difference between the internal and external innovation capabilities of Italian science and technology parks [75]. Although there are few studies on the relationship between the construction of science and technology parks and the land use transformation in other countries, this study finds that green technology innovation is the impact mechanism of the NIIDZ constructions to promote China’s sustainable land use transformation. Therefore, we speculate that green technology innovation, an important mechanism to promote the transformation of sustainable land use, may not be applicable in Israel, Italy and other countries.
The construction of NIIDZs is a great measure for China to implement the innovation-driven development strategy to promote the sustainable use of urban land. In order to continue to promote the construction of NIIDZs with high quality and realize the high-quality development of China’s economy, this study puts forward the following policy recommendations:
(1) The Chinese government should pay more attention to innovation-driven development strategies, especially the leading and exemplary role of NIIDZ construction in promoting the transformation of the low-carbon use of urban land, and continue to plan the construction of NIIDZs efficiently and reasonably. It is necessary to summarize and refine the successful experience of NIIDZ construction in promoting the transformation of the low-carbon use of urban land and promote it. In addition, an innovation-oriented assessment system for low-carbon land use should be established and an exit mechanism for cities with poor NIIDZ construction results should be appropriately taken.
(2) It is crucial to give full play to the dual mechanism of NIIDZ construction to improve the low-carbon utilization efficiency of urban land. The Chinese government should further create a good innovation environment, increase government science and technology investment in NIIDZs, and play a leading and exemplary role in the green technology innovation of enterprises [76]. In addition, the effect of economies of scale cannot be achieved without the agglomeration of innovation factors. The Chinese government should continue to implement more preferential innovation service policies in NIIDZ, break down the obstacles to the flow of innovation between regions, build a talent gathering cycle mechanism, and create an innovation industry cluster center so as to ensure the full play of the promotion mechanism of economies of scale.
(3) The Chinese government should consider the differences in urban location, urban scale, and urban natural resources and promote the construction of NIIDZs according to local conditions. In the western region, the number of NIIDZs should be gradually increased, and in the eastern region efforts should be made to improve the quality of NIIDZ construction. In addition, it is necessary to give full play to the leading role that big cities play for small cities and establish a multi-dimensional cooperation mechanism between different types of cities in the construction of NIIDZs. Finally, the government should reasonably guide the transformation and upgrading of the industrial structure of resource-based cities and build a number of characteristic NIIDZs that rely on local natural resources.
There are also some limitations to our research. First, China’s innovation-driven development strategy also includes the construction of innovative cities. This study only examines the low-carbon land use of NIIDZs. In the future, we will continue to explore the low-carbon land use of innovative city construction and will even study the two together. In addition, there is a serious lack of relevant research on land use efficiency under the carbon constraint. To fill this gap, this research only examines the promotion role of innovation-driven development in the low-carbon use efficiency of urban land from the perspective of low carbon. In the future, pollution indicators such as industrial wastewater emissions, industrial SO2 emissions, and industrial smoke emissions can be included as evaluation indicators of low-carbon use efficiency of urban land to investigate the role of innovation-driven development in the green and low-carbon use efficiency of urban land. Third, this study only focuses on the impact of China’s innovation-driven development on the transformation of the low-carbon use of urban land. In the future, the research problems and scope can be extended to other developing countries.

6. Conclusions

In this study, the NIIDZ construction, a major innovation-driven development strategy, and low-carbon use of urban land are included in the same analysis framework. Based on theoretical and empirical analysis, the impact effect, impact mechanism, and impact difference of the construction of NIIDZ on the low-carbon use efficiency of urban land in China are investigated, which can provide some reference for future research on the relationship between innovation and land. The main conclusions of this study are as follows:
(1) The construction of China’s NIIDZ, a major innovation-driven development strategy, can effectively improve the low-carbon utilization efficiency of urban land. With the continuous promotion of this major innovation-driven development strategy, this positive effect will become more and more important. This conclusion can also provide some reference for the high-quality construction of science and technology parks in many countries.
(2) The construction of China’s NIIDZ promotes the low-carbon use efficiency of urban land by promoting green technology innovation and generating economies of scale, and the promotion effect of green technology innovation is far greater than that of economies of scale. This may also be an important mechanism for other innovation-driven development strategies in China to drive the transformation towards the low-carbon use of urban land.
(3) Compared with eastern cities, small cities, and resource-based cities, China’s NIIDZ construction, a major innovation-driven development strategy, can promote the improvement of low-carbon land use efficiency in central and western China, large cities, and non-resource-based cities. Therefore, it can be inferred that other innovation-driven development strategies in China also differ in the way they improve the low-carbon land use efficiency of cities with different characteristics.

Author Contributions

Conceptualization, N.X. and W.Z.; methodology, N.X. and W.Z.; software, N.X.; validation, M.J., W.C. and H.Z.; formal analysis, W.C.; investigation, W.C. and M.J.; resources, H.Z.; data curation, M.J.; writing—original draft preparation, N.X. and W.Z.; writing—review and editing, D.Z. and M.L.; visualization, N.X. and W.C.; supervision, H.Z.; project administration, H.Z. and D.Z.; funding acquisition, N.X., W.C. and D.Z. All authors have read and agreed to the published version of the manuscript.

Funding

This research was funded by Philosophy and Social Science Foundation of Henan Province, Grant number 2021CJJ149. The research was also funded by the Natural Science Foundation of China, Grant number 42001187. The research was also supported by the Philosophy and Social Science Planning Major Tender Project of Yunnan Province (Grant No: ZDZB202206), and Ten-thousand Talent Plans for Young Top-notch Talents of Yunnan Province (Grant No: YNWR-QNBJ-2019-220).

Data Availability Statement

The data comes mainly from China City Statistical Yearbook (2007–2020), China Statistical Yearbook (2007–2020) and EPS database.

Acknowledgments

Thanks for the support from Henan Normal University.

Conflicts of Interest

The authors declare no conflict of interest.

References

  1. Tan, S.; Hu, B.; Kuang, B.; Zhou, M. Regional differences and dynamic evolution of urban land green use efficiency within the Yangtze River Delta, China. Land Use Policy 2021, 106, 105449. [Google Scholar] [CrossRef]
  2. Chen, H.; Jia, B.; Lau, S. Sustainable urban form for Chinese compact cities: Challenges of a rapid urbanized economy. Habitat Int. 2008, 32, 28–40. [Google Scholar] [CrossRef]
  3. Chen, H.; Meng, C.; Cao, Q. Measurement and Influencing Factors of Low Carbon Urban Land Use Efficiency & mdash; Based on Non-Radial Directional Distance Function. Land 2022, 11, 1052. [Google Scholar]
  4. Ribeiro, H.V.; Rybski, D.; Kropp, J.P. Effects of changing population or density on urban carbon dioxide emissions. Nat. Commun. 2019, 10, 3204. [Google Scholar] [CrossRef]
  5. Arvin, M.B.; Pradhan, R.P.; Norman, N.R. Transportation intensity, urbanization, economic growth, and CO2 emissions in the G-20 countries. Util. Policy 2015, 35, 50–66. [Google Scholar] [CrossRef]
  6. Dudley, B. B.P. Statistical Review of World Energy; B.P. Statistical: London, UK, 2022. [Google Scholar]
  7. Cen, X.; Wu, C.; Xing, X.; Fang, M.; Garang, Z.; Wu, Y. Coupling intensive land use and landscape ecological security for urban sustainability: An integrated socioeconomic data and spatial metrics analysis in Hangzhou city. Sustainability 2015, 7, 1459–1482. [Google Scholar] [CrossRef]
  8. Ouyang, X.; Xu, J.; Li, J.; Wei, X.; Li, Y. Land space optimization of urban-agriculture-ecological functions in the Changsha-Zhuzhou-Xiangtan Urban Agglomeration, China. Land Use Policy 2022, 117, 106112. [Google Scholar] [CrossRef]
  9. Yang, K.; Zhong, T.; Zhang, Y.; Wen, Q. Total factor productivity of urban land use in China. Growth Change 2020, 51, 1784–1803. [Google Scholar] [CrossRef]
  10. Feng, Y.; Liu, Y.; Yuan, H. The spatial threshold effect and its regional boundary of new-type urbanization on energy efficiency. Energy Policy 2022, 164, 112866. [Google Scholar] [CrossRef]
  11. Shi, K.; Chen, Y.; Li, L.; Huang, C. Spatiotemporal variations of urban CO2 emissions in China: A multiscale perspective. Appl. Energy 2018, 211, 218–229. [Google Scholar] [CrossRef]
  12. Dou, Y.; Luo, X.; Dong, L.; Wu, C.; Liang, H.; Ren, J. An empirical study on transit-oriented low-carbon urban land use planning: Exploratory Spatial Data Analysis (ESDA) on Shanghai, China. Habitat Int. 2016, 53, 379–389. [Google Scholar] [CrossRef]
  13. Bosetti, V.; Carraro, C.; Galeotti, M.; Massetti, E.; Tavoni, M. A world induced technical change hybrid model. Energy J. 2006, 27, 13–37. [Google Scholar]
  14. Wang, Y.; Hou, L.; Zhu, J. Can Urban Innovation Help the Development of Low Carbon Economy? Impact Assessment and Mechanism Analysis of Innovative City Pilot Policy on Carbon Intensity. Sci. Technol. Prog. Policy 2022, 1–10. (In Chinese) [Google Scholar]
  15. Fang, L.; Tang, H.; Li, J. Impacts of National Innovation Demonstration Zone Construction on Urban Air Pollution: Evidence from a Quasi-natural Experiment. J. Xi’an Jiaotong Univ. Soc. Sci. 2022, 1–20. (In Chinese) [Google Scholar]
  16. Cui, X.; Wang, X. Urban land use change and its effect on social metabolism: An empirical study in Shanghai. Habitat Int. 2015, 49, 251–259. [Google Scholar] [CrossRef]
  17. Wu, C.; Wei, Y.D.; Huang, X.; Chen, B. Economic transition, spatial development and urban land use efficiency in the Yangtze River Delta, China. Habitat Int. 2017, 63, 67–78. [Google Scholar] [CrossRef]
  18. Zhang, D.; Wang, Y.; Liu, M. The policy-driven effect of new urbanization on the efficiency of green use of urban land: Based on the empirical test of 280 prefecture-level cities. Urban Probl. 2022, 45–54. (In Chinese) [Google Scholar]
  19. Lu, X.; Kuang, B.; Li, J. Regional difference decomposition and policy implications of China’s urban land use efficiency under the environmental restriction. Habitat Int. 2018, 77, 32–39. [Google Scholar] [CrossRef]
  20. Tang, Y.; Wang, K.; Ji, X.; Xu, H.; Xiao, Y. Assessment and spatial-temporal evolution analysis of urban land use efficiency under green development orientation: Case of the Yangtze River Delta urban agglomerations. Land 2021, 10, 715. [Google Scholar] [CrossRef]
  21. Cui, X.; Huang, S.; Liu, C.; Zhou, T.; Shan, L.; Zhang, F.; Chen, M.; Li, F.; de Vries, W.T. Applying SBM-GPA Model to Explore Urban Land Use Efficiency Considering Ecological Development in China. Land 2021, 10, 912. [Google Scholar] [CrossRef]
  22. Wang, A.; Lin, W.; Liu, B.; Wang, H.; Xu, H. Does Smart City Construction Improve the Green Utilization Efficiency of Urban Land? Land 2021, 10, 657. [Google Scholar] [CrossRef]
  23. Xie, X.; Fang, B.; Xu, H.; He, S.; Li, X. Study on the coordinated relationship between Urban Land use efficiency and ecosystem health in China. Land Use Policy 2021, 102, 105235. [Google Scholar] [CrossRef]
  24. Xue, D.; Yue, L.; Ahmad, F.; Draz, M.U.; Chandio, A.A.; Ahmad, M.; Amin, W. Empirical investigation of urban land use efficiency and influencing factors of the Yellow River basin Chinese cities. Land Use Policy 2022, 117, 106117. [Google Scholar] [CrossRef]
  25. Wang, Y.; Feng, Y.; Zuo, J.; Rameezdeen, R. From “Traditional” to “Low carbon” urban land use: Evaluation and obstacle analysis. Sustain. Cities Soc. 2019, 51, 101722. [Google Scholar] [CrossRef]
  26. Liu, J.; Hou, X.; Wang, Z.; Shen, Y. Study the effect of industrial structure optimization on urban land-use efficiency in China. Land Use Policy 2021, 105, 105390. [Google Scholar] [CrossRef]
  27. Koroso, N.H.; Lengoiboni, M.; Zevenbergen, J.A. Urbanization and urban land use efficiency: Evidence from regional and Addis Ababa satellite cities, Ethiopia. Habitat Int. 2021, 117, 102437. [Google Scholar] [CrossRef]
  28. Jiang, X.; Lu, X.; Liu, Q.; Chang, C.; Qu, L. The effects of land transfer marketization on the urban land use efficiency: An empirical study based on 285 cities in China. Ecol. Indic. 2021, 132, 108296. [Google Scholar] [CrossRef]
  29. Wei, C.; Kong, J.Y. The Effect of Innovation City Construction on Carbon Emissions in China. Land 2022, 11, 1099. [Google Scholar] [CrossRef]
  30. Gao, K.; Yuan, Y. The effect of innovation-driven development on pollution reduction: Empirical evidence from a quasi-natural experiment in China. Technol. Forecast. Soc. Change 2021, 172, 121047. [Google Scholar] [CrossRef]
  31. Zhang, M.; Hong, Y.; Zhu, B. Does national innovative city pilot policy promote green technology progress? Evidence from China. J. Clean. Prod. 2022, 363, 132461. [Google Scholar] [CrossRef]
  32. Li, Y.; Zhang, J.; Yang, X.; Wang, W.; Wu, H.; Ran, Q.; Luo, R. The impact of innovative city construction on ecological efficiency: A quasi-natural experiment from China. Sustain. Prod. Consum. 2021, 28, 1724–1735. [Google Scholar] [CrossRef]
  33. Zheng, S.; Li, Z. Pilot governance and the rise of China’s innovation. China Econ. Rev. 2020, 63, 101521. [Google Scholar] [CrossRef]
  34. Song, Y.; Yeung, G.; Zhu, D.; Xu, Y.; Zhang, L. Efficiency of urban land use in China’s resource-based cities, 2000–2018. Land Use Policy 2022, 115, 106009. [Google Scholar] [CrossRef]
  35. Tan, R.; Zhang, T.; Liu, D.; Xu, H. How will innovation-driven development policy affect sustainable urban land use: Evidence from 230 Chinese cities. Sustain. Cities Soc. 2021, 72, 103021. [Google Scholar] [CrossRef]
  36. Zeng, Z.; Jin, X.; Lu, F. Analysis on Intensive Use of Industrial Land in Zhongguancun Naional Demonstration Zone. Urban Dev. Stud. 2014, 21, 1–3+7. (In Chinese) [Google Scholar]
  37. Li, X.; Zheng, L.; Cheng, J. Research on the Dynamic Evaluation System of Innovation-Driven Development of the National Independent Innovation Demonstration Zone—Based on the Quadric Weighted Dynamic Evaluation Method. East China Econ. Manag. 2019, 33, 79–85. (In Chinese) [Google Scholar]
  38. Guo, F.; Yang, S.; Ren, Y. The digital economy, green technology innovation and carbon emissions: Empirical evidence from Chinese city level data. J. Shaanxi Norm. Univ. Philos. Soc. Sci. Ed. 2022, 51, 45–60. (In Chinese) [Google Scholar]
  39. Wang, G.; Han, Q. Assessment of the relation between land use and carbon emission in Eindhoven, the Netherlands. J. Environ. Manag. 2019, 247, 413–424. [Google Scholar] [CrossRef] [PubMed]
  40. Grossman, G.M.; Krueger, A.B. Economic growth and the environment. Q. J. Econ. 1995, 110, 353–377. [Google Scholar] [CrossRef]
  41. Zhao, M.; Sun, T.; Feng, Q. Capital allocation efficiency, technological innovation and vehicle carbon emissions: Evidence from a panel threshold model of Chinese new energy vehicles enterprises. Sci. Total Environ. 2021, 784, 147104. [Google Scholar] [CrossRef] [PubMed]
  42. You, H.; Wu, C. Carbon Emission Efficiency and Low Carbon Optimization of Land Use: Based on the Perspective of Energy Consumption. J. Nat. Resour. 2010, 25, 1875–1886. (In Chinese) [Google Scholar]
  43. Senatore, V.; Oliva, G.; Buonerba, A.; Zarra, T.; Borea, L.; Hasan, S.W.; Belgiorno, V.; Naddeo, V. An integrated algal membrane photobioreactor as a green-transition technology for the carbon capture and utilization. J. Environ. Chem. Eng. 2022, 10, 107344. [Google Scholar] [CrossRef]
  44. Qin, H.; Xiao, H.; Wu, J.; Zhang, X. National Independent Innovation Demonstration Zone, Government Innovation Preferences, and Regional Innovation Capability. East China Econ. Manag. 2021, 35, 52–62. (In Chinese) [Google Scholar]
  45. Zhang, Y.; Guan, Y. Research on the Effect of National Independent Innovation Demonstration Zone Policy on Regional Economy. Soft Sci. 2021, 35, 101–107. (In Chinese) [Google Scholar]
  46. Lin, B.; Zhu, J. Impact of China’s new-type urbanization on energy intensity: A city-level analysis. Energy Econ. 2021, 99, 105292. [Google Scholar] [CrossRef]
  47. Baron, R.M.; Kenny, D.A. The moderator–mediator variable distinction in social psychological research: Conceptual, strategic, and statistical considerations. J. Pers Soc. Psychol. 1986, 51, 1173. [Google Scholar] [CrossRef]
  48. Tone, K.; Tsutsui, M. An epsilon-based measure of efficiency in DEA—A third pole of technical efficiency. Eur. J. Oper Res. 2010, 207, 1554–1563. [Google Scholar] [CrossRef]
  49. Zhang, H.; Feng, C.; Zhou, X. Going carbon-neutral in China: Does the low-carbon city pilot policy improve carbon emission efficiency? Sustain. Prod. Consum. 2022, 33, 312–329. [Google Scholar] [CrossRef]
  50. Fang, G.; Gao, Z.; Tian, L.; Fu, M. What drives urban carbon emission efficiency?—Spatial analysis based on nighttime light data. Appl. Energy 2022, 312, 118772. [Google Scholar] [CrossRef]
  51. Li, L.; Li, M.; Ma, S.; Zheng, Y.; Pan, C. Does the construction of innovative cities promote urban green innovation? J. Environ. Manag. 2022, 318, 115605. [Google Scholar] [CrossRef] [PubMed]
  52. Wang, X.; Zhang, Q.; Chang, W. Does economic agglomeration affect haze pollution? Evidence from China’s Yellow River basin. J. Clean. Prod. 2022, 335, 130271. [Google Scholar] [CrossRef]
  53. Brock, W.A.; Taylor, M.S. Economic Growth and The Environment: A Review of Theory and Empirics. Handb. Econ. Growth 2005, 1, 1749–1821. [Google Scholar]
  54. York, R.; Rosa, E.A.; Dietz, T. STIRPAT, IPAT and ImPACT: Analytic tools for unpacking the driving forces of environmental impacts. Ecol. Econ. 2003, 46, 351–365. [Google Scholar] [CrossRef]
  55. Wen, S.; Jia, Z.; Chen, X. Can low-carbon city pilot policies significantly improve carbon emission efficiency? Empirical evidence from China. J. Clean. Prod. 2022, 346, 131131. [Google Scholar] [CrossRef]
  56. Zhang, W.; Liu, X.; Wang, D.; Zhou, J. Digital economy and carbon emission performance: Evidence at China’s city level. Energy Policy 2022, 165, 112927. [Google Scholar] [CrossRef]
  57. Luo, Y.; Lu, Z.; Long, X. Heterogeneous effects of endogenous and foreign innovation on CO2 emissions stochastic convergence across China. Energy Econ. 2020, 91, 104893. [Google Scholar] [CrossRef]
  58. Ji, X.; Gu, N. Does the Establishment of Intellectual Property Model Cities Affect Innovation Quality? J. Financ. Econ. 2021, 47, 49–63. (In Chinese) [Google Scholar]
  59. Lin, B.; Zhou, Y. Does the Internet development affect energy and carbon emission performance? Sustain. Prod. Consum. 2021, 28, 1–10. [Google Scholar] [CrossRef]
  60. Hussain, M.; Wang, W.; Wang, Y. Natural resources, consumer prices and financial development in China: Measures to control carbon emissions and ecological footprints. Resour. Policy 2022, 78, 102880. [Google Scholar] [CrossRef]
  61. Li, G.; Wei, W. Financial development, openness, innovation, carbon emissions, and economic growth in China. Energy Econ. 2021, 97, 105194. [Google Scholar] [CrossRef]
  62. Xu, L.; Fan, M.; Yang, L.; Shao, S. Heterogeneous green innovations and carbon emission performance: Evidence at China’s city level. Energy Econ. 2021, 99, 105269. [Google Scholar] [CrossRef]
  63. Solow, R.M. A contribution to the theory of economic growth. Q. J. Econ. 1956, 70, 65–94. [Google Scholar] [CrossRef]
  64. Li, X.; Cheng, Z. Does high-speed rail improve urban carbon emission efficiency in China? Socio-Econ. Plan. Sci. 2022, 101308. [Google Scholar] [CrossRef]
  65. Meng, Y.; Wang, K.; Lin, Y. The Role of Land Use Transition on Industrial Pollution Reduction in the Context of Innovation-Driven: The Case of 30 Provinces in China. Land 2021, 10, 353. [Google Scholar] [CrossRef]
  66. Zhi, H.; Ni, L.; Zhu, D. The impact of emission trading system on clean energy consumption of enterprises: Evidence from a quasi-natural experiment in China. J. Environ. Manag. 2022, 318, 115613. [Google Scholar] [CrossRef] [PubMed]
  67. Xie, H.; Wang, W. Spatiotemporal differences and convergence of urban industrial land use efficiency for China’s major economic zones. J. Geogr. Sci. 2015, 25, 1183–1198. [Google Scholar] [CrossRef]
  68. Tone, K. A slacks-based measure of efficiency in data envelopment analysis. Eur. J. Oper. Res. 2001, 130, 498–509. [Google Scholar] [CrossRef]
  69. Fang, L.; Tang, H.; Mou, M. Innovation-driven development and urban carbon emission reduction: A quasi-natural experiment in China. Environ. Sci. Pollut. Res. 2022. [Google Scholar] [CrossRef]
  70. Wu, J.; Bai, Z. Spatial and temporal changes of the ecological footprint of China’s resource-based cities in the process of urbanization. Resour. Policy 2022, 75, 102491. [Google Scholar] [CrossRef]
  71. Squicciarini, M. Science Parks’ tenants versus out-of-Park firms: Who innovates more? A duration model. J. Technol. Transf. 2008, 33, 45–71. [Google Scholar] [CrossRef]
  72. Steruska, J.; Simkova, N.; Pitner, T. Do science and technology parks improve technology transfer? Technol. Soc. 2019, 59, 101127. [Google Scholar] [CrossRef]
  73. Ma, Z.; Zhao, Q.; Jiang, X. Evaluation of the green and high-quality development in China’s national independent innovation demonstration zones. China Popul. Resour. Environ. 2022, 32, 118–127. (In Chinese) [Google Scholar]
  74. Felsenstein, D. University-related science parks—’seedbeds’ or ‘enclaves’ of innovation? Technovation 1994, 14, 93–110. [Google Scholar] [CrossRef]
  75. Colombo, M.G.; Delmastro, M. How effective are technology incubators? Evidence from Italy. Res. Policy 2002, 31, 1103–1122. [Google Scholar] [CrossRef]
  76. Guellec, D.; Potterie, B.V.P.D.L. The impact of public R&D expenditure on business R&D. Econ. Innov. New Technol. 2003, 12, 225–243. [Google Scholar]
Figure 1. Samples of NIIDZ pilot cities in China.
Land 11 01634 g001
Figure 2. The influencing mechanisms.
Land 11 01634 g002
Figure 3. Parallel trend test results of the estimated parameters in Formula (5). Note: The x-axis represents the year before and after the construction of the NIIDZ. 2007 and 2008 are years before NIIDZ implementation. Further, 2009 represents the current year of policy implementation, and 2010–2019 represent years after policy implementation.
Land 11 01634 g003
Figure 4. Placebo test.
Land 11 01634 g004
Table 1. Index system of the low-carbon utilization efficiency of urban land.
IndexSpecific IndexIndicator DescriptionReferences
InputLand inputUrban built-up area
(unit: km2)
Wang et al. [22]
Energy inputTotal energy consumption converted into standard coal
(unit: 10,000 tons)
Zhang et al. [49]
Labor inputTotal urban employment
(unit: ten thousand people)
Wang et al. [22]
Capital inputUrban capital stock
(unit: ten thousand yuan)
Fang et al. [50]
Expected outputEconomic benefit outputAdded value of urban secondary and tertiary industries
(unit: ten thousand yuan)
Wang et al. [22]
Social benefit outputAverage wage of employeesXie et al. [23]
Unexpected outputUrban carbon emissionsCarbon emissions calculated based on energy consumption
(unit: 10,000 tons)
Zhang et al. [49]
Table 2. Variable definitions.
VariableDefinitions
Explained
Variable
ULUThe super efficient EBM model with non-guided and variable return to scale characteristics is used to measure ULU
Explanatory
variable
diddid = pilot × time, The pilot equals to 1 if the city covers a NIIDZ and 0 otherwise; The time equals to 1 if the NIIDZ has been established in the city and 0 otherwise.
Mediating
variable
InnovGreen invention patent applications per 10,000 people in the city
EOSEconomies of scale is measured by value of GDP per unit administrative area
Control
variable
EREntropy method is used to comprehensively calculate the intensity of environmental regulation
FDIForeign direct investment/GDP
MarketEmployment of individual and private enterprises/total employment
FinYear-end loan balance/GDP
IndusAdded value of secondary industry/GDP
WealthAverage wage of urban employees
TechTechnology level is measured by total factor productivity
ScaleRegional population density
Table 3. Data descriptive statistics.
VariablesMeanS.D.Minp25p50p75Max
ULU0.5600.1700.1600.4400.5400.6601.060
did0.0600.2400.0000.0000.0000.0001.000
Innov0.5101.4600.0000.0300.1000.35026.820
EOS6.7901.4001.9705.8606.8007.72011.810
ER0.6100.2000.0600.4600.6600.7600.990
FDI1.9001.9800.0000.4601.2802.69015.320
Market0.4800.1400.0000.3800.4800.5800.940
Fin0.8800.5600.0800.5400.7101.0109.620
Indus47.79010.87010.68041.19048.03054.76090.970
Wealth10.5800.5008.51010.21010.63010.97012.060
Tec1.0400.2800.0800.9701.0401.10016.430
Scale5.7400.9101.6105.2105.8906.4607.880
Table 4. Benchmark regression results.
Variable(1)(2)(3)
ULUULUULU
did0.1083 ***0.1093 ***0.1126 ***
(13.979)(9.535)(14.718)
ER −0.0239−0.0418 ***
(−1.530)(−3.422)
FDI −0.0107 ***−0.0014
(−7.969)(−1.127)
Mark 0.0996 ***0.0807 ***
(5.246)(5.069)
Fin −0.0718 ***−0.0177 ***
(−13.448)(−3.597)
Indus −0.00040.0010 ***
(−1.348)(3.020)
Wealth 0.1585 ***0.1508 ***
(11.784)(10.304)
Tec 0.0166 *0.0333 ***
(1.889)(6.690)
Scale −0.0412 ***0.1043 ***
(−13.603)(2.851)
Constant0.5582 ***−0.8324 ***−1.7142 ***
(385.112)(−6.094)(−6.721)
N396239623962
Regional fixed effectYesYesYes
Time fixed effectYesNoYes
R20.76890.23210.7841
R2−Adjust0.75020.22790.7661
F−value195.414974.038251.8343
Note: The numbers in parentheses are robust t-statistics. *** and * represent significance levels of 1% and 10%, respectively.
Table 5. Exclude other policy pilots.
Variable(1)(2)(3)(4)
did0.1034 ***0.1034 ***0.0936 ***0.0873 ***
(13.429)(13.440)(12.234)(10.788)
low−carbon city pilots0.0406 ***0.0407 ***0.0370 ***0.0357 ***
(7.308)(7.328)(6.732)(6.479)
Smart city policy 0.0117 **0.00830.0078
(2.126)(1.527)(1.437)
Innovative city pilots 0.0720 ***0.0705 ***
(10.091)(9.853)
Innovative industrial cluster policy 0.0184 **
(2.390)
ControlsYesYesYesYes
Regional fixed effectYesYesYesYes
Time fixed effectYesYesYesYes
Constant−1.7602 ***−1.7852 ***−1.9280 ***−1.9125 ***
(−6.948)(−7.043)(−7.698)(−7.638)
N3962396239623962
R20.78720.78750.79320.7935
R2−Adjust0.76940.76970.77590.7761
F−value52.659848.329454.009650.3587
Note: The numbers in parentheses are robust t-statistics. *** and ** represent significance levels of 1% and 5%, respectively.
Table 6. Other robustness tests.
Variable(1)(2)(3)(4)
Reselect SamplesPSM−DIDULU Estimated by SBM MethodTraditional DID
did0.0488 ***0.1065 ***0.1365 ***
(4.006)(11.592)(4.213)
did0 0.2180 ***
(6.291)
ControlsYesYesYesYes
Constant−0.9264 ***−1.7070 ***−0.9303−1.3999 ***
(−2.578)(−4.903)(−0.937)(−3.806)
Regional fixed effectYesYesYesYes
Time fixed effectYesYesYesYes
N3472383439623234
R20.78210.79570.18470.7884
R2−Adjust0.76380.77840.11690.7705
F−value18.471031.23185.760320.5520
Note: The numbers in parentheses are robust t-statistics. *** represent significance levels of 1%.
Table 7. Mechanism examination.
Variable(1)(2)(3)(4)
InnovULUEOSULU
did2.1508 ***0.0557 ***0.0426 ***0.1057 ***
(31.883)(6.626)(4.231)(14.107)
Innov 0.0264 ***
(14.495)
EOS 0.1607 ***
(13.089)
ControlsYesYesYesYes
Constant−13.2772 ***−1.3633 ***−1.6706 ***−1.4456 ***
(−5.901)(−5.470)(−4.976)(−5.779)
Regional fixed effectYesYesYesYes
Time fixed effectYesYesYesYes
N3962396239623962
R20.76380.79580.99430.7938
R2−Adjust0.74420.77880.99380.7765
F−value163.730870.3299418.488765.9564
Intermediary effect/total effect45.96%6.44%
Sobel Test0.05500.0077
[0.0000][0.0000]
Note: The dependent variables in column (1) and (3) are Innov and EOS, respectively. The dependent variables in column (2) and (4) is ULU. The numbers in parentheses are robust t-statistics. *** represent significance levels of 1%, 5% and 10%, respectively.
Table 8. Heterogeneity analysis.
VariableLocationPopulation ScaleResource Endowment
Eastern CitiesCentral and Western CitiesLarge ScaleMedium and Small ScaleResource−Based CitiesNon−Resource−Based Cities
(1)(2)(3)(4)(5)(6)
did0.0856 ***0.1345 ***0.1086 ***0.00270.0492 *0.1129 ***
(8.041)(11.673)(13.101)(0.109)(1.834)(13.877)
ControlsYesYesYesYesYesYes
Constant−2.4597 ***−1.4157 ***−1.8559 ***−1.5499 ***−1.0901 ***−1.9276 ***
(−5.494)(−4.649)(−4.921)(−4.637)(−2.694)(−5.883)
Regional fixed effectYesYesYesYesYesYes
Time fixed effectYesYesYesYesYesYes
N166622961960200215962366
R20.73950.82460.76830.78870.75820.8097
R2−Adjust0.71560.80930.74750.76990.73580.7931
F−value25.285942.969935.569223.424214.346041.5929
Note: The numbers in parentheses are robust t-statistics. *** and * represent significance levels of 1% and 10%, respectively.
Publisher’s Note: MDPI stays neutral with regard to jurisdictional claims in published maps and institutional affiliations.

