Article

The Impacts of Urbanization to Improve Agriculture Water Use Efficiency—An Empirical Analysis Based on Spatial Perspective of Panel Data of 30 Provinces of China

College of Economics & Management, Northwest A&F University, Xianyang 712100, China
*
Author to whom correspondence should be addressed.
These authors contributed equally to this work.
Land 2022, 11(1), 80; https://doi.org/10.3390/land11010080
Submission received: 28 November 2021 / Revised: 29 December 2021 / Accepted: 30 December 2021 / Published: 5 January 2022
(This article belongs to the Special Issue Water Resources and Land Use Planning)

Abstract

:
China has witnessed accelerated urbanization since the reforms and open policies which began in 1978. This eventually resulted in increased residential water requirements and worsening water shortages, particularly in the current century. In the context of resource and environmental constraints, improving agricultural water use efficiency (AWUE) is a crucial issue to ensure food security, improve the ecological environment, and meet the needs of sustainable agricultural development. Based on the panel data of 30 provinces in China from 1999 to 2018, the article uses the Super-SBM model to measure the AWUE. Moreover, the study uses the entropy method to establish the urbanization evaluation index system from the dimensions of population, land, economy, measures the comprehensive level of urbanization development, and further constructs a dynamic spatial econometric model. We use the unconditional maximum likelihood estimation method to evaluate the impact of urbanization development on AWUE and its heterogeneity. The findings reveal that the AWUE considering undesired outcomes has generally shown a steady improvement, but there is ample space for resource conservation and environmental protection, and there are noticeable differences among regions. The decomposition of spatial effects shows that urbanization development in each region has a short-term positive effect on AWUE in the region and neighboring regions, and a long-term effect exists only in the western region. The impact of urbanization in different dimensions has been found that both land urbanization and economic urbanization contribute to the improvement of AWUE, while population urbanization helps to improve AWUE by improving the awareness level of the farmers.

1. Introduction

From human and ecology to food and energy security, water resources play a pivotal role in contributing to social well-being and economic growth [1,2]. Water is also a vital element in food production, agricultural practice, maintaining food security, and alleviating poverty. However, due to population and economic growth, urbanization and industrialization, climate change, water pollution, poor management of water resources, the quantity and quality of water resources are decreasing, and human beings are experiencing unprecedented, severe water shortage [3,4]. As a conventional agricultural-based country, China’s agricultural sector consumes around 60–65% of total global water consumption. China has to feed its huge population (22% of the global population) with only 7% of global arable land [5,6]. The recent progression of agricultural production, ever-increasing industrialization, population boom, and more water-concentrated lifestyles had a severe burden on China’s existing water resources [7,8]. The extensive mode of production relying on large-scale irrigation water makes the water productivity relatively poor [9]. In addition, the discharge of agricultural wastewater pollutants (COD, TN, TP, etc.) has remained at a high level for many years [10,11], which has led to significant pressure on the existing water resources. With relatively low per capita water resources, uneven land distribution, and the contradiction between social and economic development, severe groundwater shortage has significantly worsened the situation. The situation has seriously affected AWUE and endangers ecological safety and security [12,13].
At the same time, China has experienced an unprecedented process of rapid urbanization. The recent urbanization trends in China are decisive factors for regional development and shaping worldwide economic expansions [14,15]. The urbanization rate measured by the permanent urban population has increased from 17.92% in 1978 to 60.60% in 2019 [16]. Ensuring food security is an essential element for promoting urbanization. Improving the AWUE will help increase food supply capacity under the scarcity of water resources and deterioration of the water environment [17]. Chinese legislators have also identified urbanization as a key driving force of economic and social development. With the rapid development of urbanization, the distorted allocation of production factors, such as the rapid increase in total non-agricultural water demand, reduction in arable land, loss of rural labor, and increased non-point source pollution has gradually become prominent [18], which will eventually AWUE and increase the uncertainty factors for the realization of agricultural water-saving and efficiency. Apart from land, growing urbanization stresses water distribution between rural and urban regions [19]. Several researchers have indicated that unsustainable development of urbanization may significantly impact decreasing water usage in agricultural productions [20,21,22]. Even though water is increasingly scarce, various researchers have focused on its critical role in supporting agricultural productivity and the environmental consequences (such as Yu et al. [23], Cai et al. [24], and Singh [25]).
Interestingly, most of the literature regarding the impacts of urbanization and water resources in agriculture primarily covered the externalities of urbanizations (For example, Fang et al. [26], Li et al. [27], Wang [28]). However, little study has examined the impacts of urbanization to improve agriculture water use efficiency. In order to secure the country’s economic sustainability and progressive development of livelihood of people, the Chinese government has also recently addressed significant tactical legislation for availing agricultural water efficiency and has thoroughly highlighted this subject at the local level [29]. Therefore, in the context of resource and environmental constraints, it is essential to investigate whether urbanization development can improve AWUE, which is an essential theoretical reference and practical significance for sustainable agricultural development, ensuring food security, and improving the ecological environment.
Some crucial questions need to be addressed to cope with the inevitable challenges of urbanization within agricultural sectors: What are the key effects of urbanization on agricultural water use efficiency in China? What are the probable effects of reduced agricultural water supply owing to urbanization on local or national agricultural productivity and farming framework? Especially, how would urbanization alter the groundwater distribution to various crops within several provinces in China? What policies should China formulate to make a balance between urbanization and sustainable water resource management?
The study intended to explore such questions by evaluating the impact of comprehensive urbanization levels on agricultural water use efficiency and further refined the differential impact of population, land, and economic urbanization on agricultural water use efficiency. More specifically, the study used agricultural carbon emissions and agricultural non-point source pollution emissions as undesired output indicators. We used the global reference super-efficiency slacks-Based Measure (SBM) model to measure the agricultural water use efficiency of 30 provinces in China from 1999 to 2018. The entropy value method is also used for providing a comprehensive evaluation of urbanization development in each region in terms of population, land, and economic urbanization. In terms of research content, the article explored the spatial effects of urbanization development on agricultural water use efficiency and its differential characteristics from the level of regional heterogeneity. It will be conducive to grasping the effect of urbanization on agricultural water use efficiency from the spatial level but also will be helpful to explore and adjust the corresponding urbanization development strategy and agricultural water use.
Scientific evaluation of the factors associated with improving agricultural water usage is the fundamental prerequisite for the comprehensive utilization of AWUE [30]. Existing research has gradually shifted from the research on the engineering efficiency of irrigation water transportation and field utilization to the various efficiency researches on the water resources productivity as the index [31,32,33,34]. In terms of influencing factors of AWUE, scholars have studied the level of economic development, resource endowments, technological progress, and other perspectives on AWUE [2,35,36,37]. However, urbanization is one of the important ways to solve rural issues, few scholars pay attention to its impact on AWUE, and the conclusions are inconsistent. A group of scholars believes that urbanization positively affects AWUE (for example, Bao and Chen [38], Wang [39]). This positive effect comes from the economic effects of agglomeration economies, cost savings, and various spillover effects, which are conducive to promoting technological progress and improving AWUE [40,41]. Another part of scholars holds the opposite attitude (for example, Ahmed et al. [42], Danish et al. [43], Hassan Rashid et al. [44]), and they highlighted that the rapid development of urbanization had brought the problem of distorted allocation of production factors, such as the imbalance of water use structure. At the same time, with the concentration of economic activities, the expansion of output scale will also lead to the increase in pollution emissions per unit space and increase environmental pollution, which will harm the realization of the goal of improving the AWUE [15].
Generally, the existing pieces of literature have laid an essential foundation for the in-depth study of AWUE, while many deficiencies remain to be improved. Firstly, existing studies only use a single factor or only consider the total factor productivity of the desired output to measure the level of AWUE in a region. Undesirable output, such as agricultural non-point source pollution caused by negative externalities in agricultural economic growth, is often ignored in the assessment, so the estimated efficiency is also very different. Secondly, urbanization is a multi-dimensional and complex system including population urbanization, land urbanization, and economic urbanization. Moreover, there are complex interactions and constraints between the sub-systems [45]. However, most literature only calculates the urbanization level from a single dimension of population urbanization [46] or discusses the impact of urbanization while ignoring the multi-dimensional complexity of urbanization development. Thirdly, with the improvement of China’s agricultural market economy and the expansion of regional openness, the spatial mobility of agricultural production factors is becoming more and more frequent, and the spatial connection between agricultural productions is becoming more and more close [47]. However, most of the existing literature ignores the role of spatial effect in the impact of urbanization on AWUE and measures the level of urbanization or discusses the impact of urbanization, ignoring the multi-dimensional complexity of urbanization development may be providing a vogue assumption to this crucial issue.

2. Materials and Methods

2.1. Materials

2.1.1. AWUE Evaluation Indicator System

Agricultural production resulted in severe environmental pollution caused by excessive use of chemical products, such as fertilizers, pesticides, and agricultural films [48,49], this kind of output is considered undesirable [50,51]. The study utilized a combination of the Super-SBM model to evaluate the undesirable output of agriculture. SBM is the model for measuring efficiency first proposed by Tone [52]. SBM can effectively solve the “crowded” or “slack” phenomenon of input factors caused by the traditional data envelopment model (DEA) model by providing a radial and comprehensive evaluation of the complex relationship among the factors. However, the SBM model also has difficulties distinguishing further the differences among the efficient decision-making units and the actual level of an efficiency unit. Therefore, Tone [53] suggested using the Super-SBM model to combine the Super-DEA and SBM models. Compared with the general SBM model, the Super-SBM model can further compare and distinguish the efficient decision-making units at the frontier [54]. The Super-SBM model is constructed as follows:
M i n ρ = 1 m i = 1 m ( x ¯ x i k ) 1 r 1 + r 2 ( s = 1 r 1 y d ¯ / y s k d + q = 1 r 2 y u ¯ / y q k u )
{ x ¯ j = 1 , k n x i j λ j ; y d ¯ j = 1 , k n y s j d λ j ; y d ¯ j = 1 , k n y q j d λ j ; x ¯ x k ; y d ¯ y k d ; y u ¯ y k u ; λ j 0 , i = 1 , 2 , , m ; j = 1 , 2 , , n , j 0 ; s = 1 , 2 , , r 1 ; q = 1 , 2 , , r 2 ;
In the formula, assuming that there are n of decision-making units, each decision-making unit consists of input m, expected output r 1 , and undesirable output r 2 , and x presents the element of the corresponding input matrix, desirable output matrix, undesirable output matrix, and y stands for the efficiency value of agricultural production.
Further, the article drew the definition of total factor water use efficiency (WUE) by Hu et al. [55] and modified it as “according to the ratio of the target water consumption to the actual water consumption”. The AWUE under the Super-SBM model of the undesirable output with global benchmark technology is calculated according to this idea, as follows:
A W E j t = P A W j t A A W j t = A A W j t ρ j t s j , w t A A W j t
where A W E j t , ρ j t denote AWUE and agricultural production efficiency of region j in period t, respectively; P A W j t denote the target agricultural water use for area j in period t, A A W j t denote the actual agricultural water use for area j in period t, s j , w t denote the slack in agricultural water inputs for area j in period t.

2.1.2. Dynamic Spatial Econometric Models

This study used a spatial econometric model to examine the impact of urbanization on AWUE, as suggested by Bao and Chen [56] and Jiadai et al. [57]. The classical econometric method assumes that regions are independent [58]. However, the production factors flow such as rural labor force transfer, cross-regional operation of mechanical services, and trends in the urbanization development of a specific region can promote the improvement of AWUE in regions through the demonstration effect [59,60]. Therefore, it is necessary to use the spatial panel econometric model to test this effect. The basic models of traditional spatial measurement mainly include the spatial lag model (SLM) and spatial error model (SEM). The SLM examines the spatial spillover effect caused by the spatial dependence of the variables, and the SEM examines the spillover effect of the impact of the error term in the adjacent areas on the regions [61]. Furthermore, the pattern change of AWUE is a dynamic and cumulative process [62]. The regional AWUE has path dependence related to the current mode of production and the past mode of production. The static model analysis of the impact of AWUE within agricultural production has been derived as a systematic and continuous economic activity. It not only affects the current agricultural production activities but also affects the later period. The impact of potential factors not included in the dynamic model skill test on AWUE can also examine the lag effect of influencing factors [63,64]. Moreover, the dynamic spatial panel model can not only effectively deal with the endogenous problems caused by other variables except the time lag and spatial lag of the dependent variable, but also significantly reduce the bias of the spatial lag coefficient, which can effectively compensate for the defects of the fundamental spatial econometric model [65]. Based on this, the study uses a dynamic spatial panel model for empirical analysis to propose possible endogenous interference and carefully explore the possible causal relationship between urbanization and AWUE. The model is set as follows:
y i t = θ y i t 1 + ρ W y i t + β u i t + σ X i t + α i + γ t + ε i t
{ y i t = θ y i t 1 + β u i t + σ X i t + α i + γ t + ε i t ε i t = λ W ε i t + μ i t
where Formula (4) is a dynamic spatial lag model, Formula (5) is a dynamic spatial error model, y i t is the AWUE of region i in period t; y i t 1 is the lag first order of AWUE to study the dynamic adjustment and continuity of AWUE; u i t is the level of urbanization, including population urbanization (Purban), land urbanization (Lurban) and economic urbanization (Eurban); α i is the regional fixed effect, γ t is the time fixed effect, ε i t i i d ( 0 , δ 2 ) is a random perturbation term; ρ , λ are spatial lag coefficient and spatial error coefficient, respectively; X i t is the control variable affecting AWUE.

2.2. Variable Selection

2.2.1. AWUE as Explained Variables

Essentially, the AWUE is to obtain as much agricultural economic output and ecological protection as possible with as little agricultural water resources input and minimum environmental costs. This comprehensively reflects the coordinated development relationship among agricultural economy, resource utilization, and environmental protection. The construction of the evaluation index system refers to the agricultural input and output index system in the literature of Hou [66] and BaoYi and WeiGuo [67]. Combined with the availability of data and the consistency of statistical caliber, land, labor, mechanical power, irrigation, chemical fertilizer, and pesticide are used as regional agricultural resources input indicators. Agricultural intermediate input generally refers to the material consumption in the agricultural production process, including the number of seeds, fertilizers, fuels, pesticides, and electricity consumption. Due to data collection reasons and considering China’s agricultural production characteristics, the intermediate agricultural inputs in the article refer to pesticide and fertilizer inputs. The undesirable output index mainly includes agricultural non-point source pollution emissions and agricultural carbon emissions, with the total agricultural output value as the desirable output index. The construction of AWUE index system is shown in Table 1. Due to space constraints, the specific calculation methods of agricultural non-point source pollution and agricultural carbon emissions should refer to relevant literature Hou [66] and BaoYi and WeiGuo [67]. MaxDEA software (MaxDEA Software Ltd., developed by Beijing Real World Research and Consultation Company Limited, Beijing, China) was used to measure the AWUE of 30 provinces and cities from 1999 to 2018 based on the ratio of target water use to actual water use on the production frontier in the Super-SBM framework. Table 2 represents the description of variables.

2.2.2. Urbanization as Core Explanatory Variables

The selected urbanization indicators include population urbanization, land urbanization, and economic urbanization. Population urbanization mainly refers to the agglomeration of rural population to cities and towns and the carrying capacity of cities and towns to population and selects the urbanization rate of permanent population and urban population density to characterize. Land urbanization mainly refers to land occupation by urban expansion and the improvement of urban infrastructure, characterized by urban built-up area and per capita urban road area [68]. Economic urbanization mainly improves urban economic benefits and the upgrading of industrial structure and per capita GDP and the proportion of non-agricultural industries to characterize [69]. The entropy method is an objective weighting method, and the weight determined by the entropy method can greatly eliminate the interference of human factors [70]. Therefore, the study utilizes population urbanization, land urbanization, and economic urbanization, respectively, and obtains comprehensive indicators reflecting the level of urbanization through summary.

2.2.3. Control Variables

The control variables selected in this paper from the aspects of social economy, endowment conditions, and natural conditions mainly include the effective irrigation area (area), reflecting farmland irrigation effectiveness on AWUE. Agricultural mechanization level (mach) is characterized by the ratio of the total power of agricultural machinery to the total sowing area of crops to reflect the impact of agricultural technological progress on AWUE. Existing studies showed that, mechanization represents advanced productivity [71,72]. The mechanization of farmland operations mainly includes cultivation, irrigation, plant protection, and harvesting. At present, the level of mechanization of farming and harvesting in China’s farmland operations has exceeded 80%, and the mode of agricultural production has basically realized the transformation from relying mainly on human and animal power to mainly relying on mechanical power. The development of mechanization level includes the progress of irrigation technology [73]. Agriculture may also adopt traditional irrigation methods, which can hardly reflect the progress of irrigation technology, and irrigation methods are also difficult to reflect through statistical data. The impact of adequate irrigation (area) on AWUE has been used as a control variable in the article. The article mainly focuses on the impact of the power intensity of agricultural machinery on the efficiency of agricultural water use, taking into account that the level of mechanization can reflect the upgrading of agricultural production equipment and increase labor productivity to replace labor effectively. Although the level of mechanization is an index with a more extensive coverage than irrigation technology, it can effectively reflect the technological progress in the agricultural field. Based on this, the article chooses the agricultural mechanization level (mach) indicator as the control variable to measure the impact of agricultural technology progress on agricultural water efficiency. The proportion of the primary industry (indus) is represented by the proportion of agricultural value-added in GDP, reflecting the impact of industrial structure changes on AWUE. The average education level (edu) of residents is calculated by the weighted sum of years at each educational level and its proportion in the total population, reflecting the impact of the educational attainment of workforce on AWUE. Existing literature shows that, the education level of the labor force can actively improve the utilization of water resources in the process of agricultural production [74,75]. The higher level of education rectifies mastery of agricultural production technology, which helps to improve their agricultural production capacity than the lower educated labor [76,77]. In the study, the summation weights of the years of education at each level and its share in the total population are aggregated and measured, where illiteracy is set at 0 years, elementary school at six years, junior high school at nine years, high school and junior college at 12 years, a specialist at 15 years, and undergraduate and above at 16 years. Per capita water resources (water), namely the proportion of total water resources to population size, reflect the impact of water resources endowment conditions on AWUE. The urban–rural income gap (gap) is characterized by the ratio of urban per capita disposable income to rural per capita net income, reflecting the impact of rural income conditions on AWUE. The degree of economic openness (open) is characterized by the proportion of total import and export trade in GDP (gdp), reflecting the impact of changes in factor input structure caused by openness on AWUE. The meteorological condition index is represented by precipitation (pre) to reflect the impact of precipitation conditions on irrigation water use and its efficiency. In addition, numerical variables take natural logarithm to reduce heteroscedasticity.

2.3. Data Sources and Regional Distribution

The sample of this study is 30 provinces in mainland China (Tibet, Hong Kong, Macao, and Taiwan are not involved in empirical research due to a lack of available data). The period is 20 years, from 1999 to 2018. The relevant data are collected from China Statistical Yearbook, China Rural Statistical Yearbook, and provincial (municipalities) statistical data. According to the economic zoning of the National Bureau of Statistics (www.stats.gov.cn accessed on 12 December 2021), the country is divided into three zones: Western region (Beijing, Tianjin, Hebei, Liaoning, Shanghai, Jiangsu, Zhejiang, Fujian, Shandong, Guangdong, and Hainan), Central region (Shanxi, Jilin, Heilongjiang, Anhui, Jiangxi, Henan, Hubei, and Hunan) and Eastern region (Neimenggu, Guangxi, Chongqing, Sichuan, Guizhou, Yunnan, Shaanxi, Gansu, Qinghai, Ningxia, and Xinjiang). A total of ten datasets are missing, namely data on total agricultural water input in five provinces (Beijing, Hebei, Shanxi, Jiangxi, and Ningxia), for the years 2000 and 2001. The missing data are calculated and supplemented by the interpolation method. Interpolation is a statistical method by which related known values are used to estimate an unknown price or potential yield of a security. Interpolation is achieved by using other established values that are located in sequence with the unknown value. Interpolation is at root a simple mathematical concept. The following formula has been used to perform the linear interpolation process:
Y = Y 1 + ( X X 1 ) ( Y 2 Y 1 ) ( X 2 X 1 )
where x is the known value, y is the unknown value, x1 and y1 are the coordinates that are below the known x value, and x2 and y2 are the coordinates that are above the x value.

3. Results and Discussions

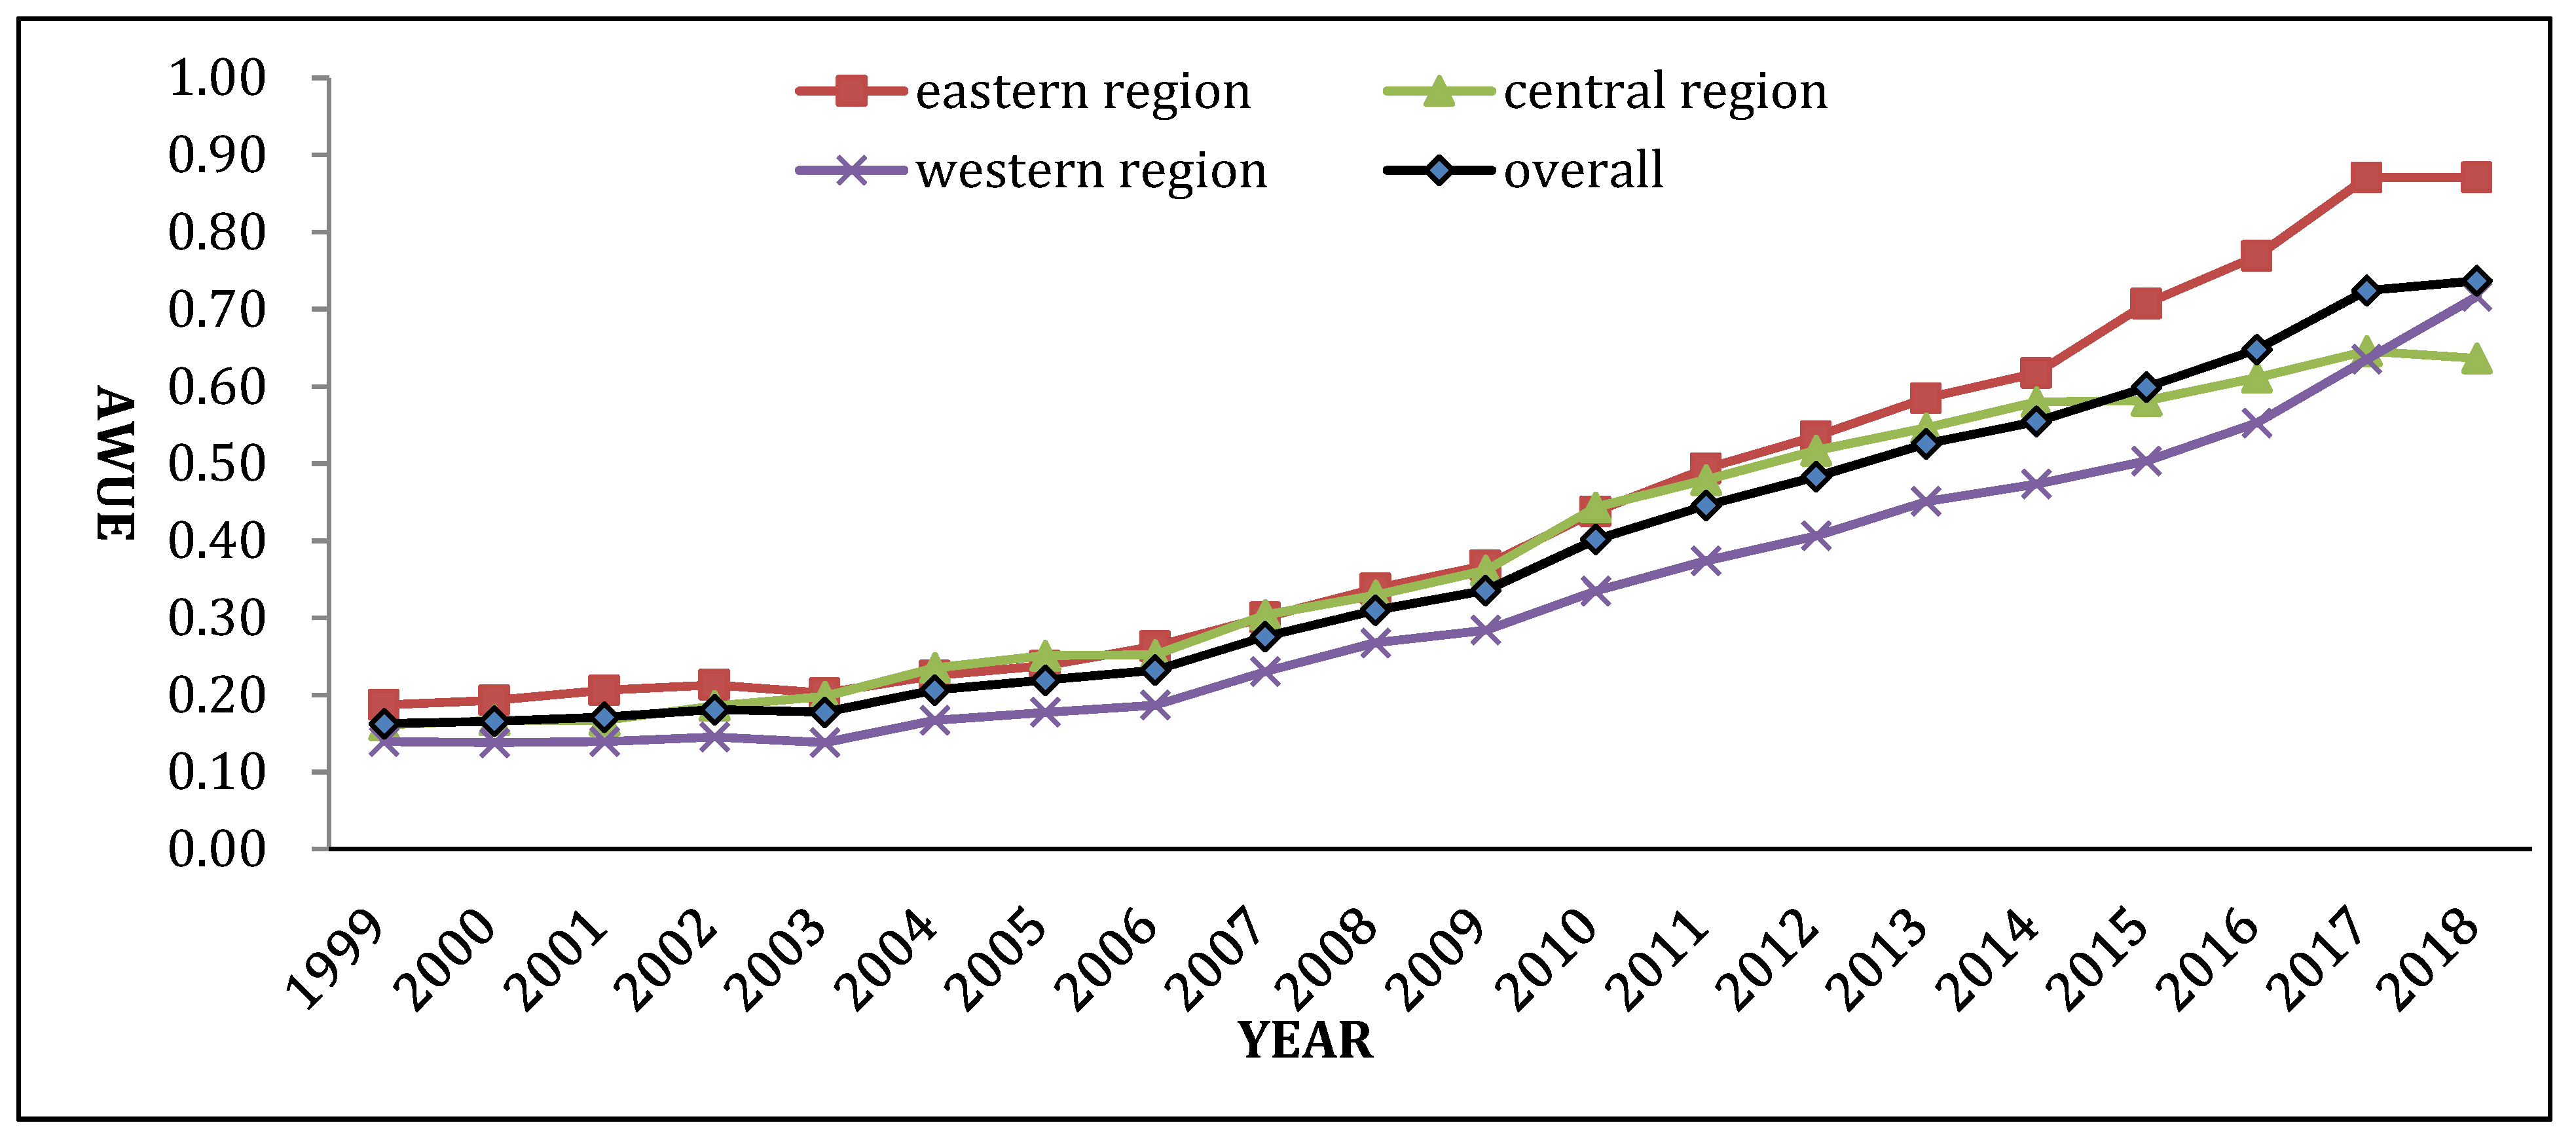
3.1. Calculation of AWUE in China

Based on MAXDEA software version no 6.3 [78], the non-radial and constant returns scale of the Super-SBM model is used to calculate the AWUE of 30 provinces from 1999 to 2018 average value of each year is calculated (Table 3). The entire country is divided into three regions by western region, central region, and eastern region, and the average AWUE in different regions is portrayed in Figure 1.
By observing the trend in Figure 1, the average AWUE in each year in China is basically below 0.9, and there is still much room for resource conservation and environmental protection in the green development of AWUE. From 1999 to 2003, AWUE indicated a stable trend, but the change was small, and the overall efficiency was low. In 2006, the Chinese government undertook the 11th Five-Year Plan to accelerate the construction of a water-saving society and an environmentally friendly society, and put forward the effective utilization of agricultural irrigation water from 0.45 to 0.50 binding indicators. Therefore, the overall AWUE showed a steady upward trend since 2006. Meanwhile, since 2011, when the Chinese government explicitly called for implementing the strictest water resource management system, the increase in AWUE in China has increased significantly. It indicates that the government’s emphasis and determination have significantly fostered water saving and efficiency improvement and promoting the improvement of AWUE.
By comparing the AWUE of the three regions, the provinces with higher AWUE are concentrated in the eastern region, and the provinces with lower AWUE are concentrated in the western region. In contrast, the spatial distribution of AWUE in China shows the non-equilibrium characteristics, which is roughly the same as the pattern of economic level difference. With the continuous development of the agricultural economy, agricultural technology in the eastern region has made significant progress, and more attention has been paid to agricultural modernization and scale development. Moreover, the coordination among agricultural production, resource conservation, and environmental protection has been consciously protected. The development of agricultural technology in the western region has been traced slowly. Whereas the degree of agricultural mechanization in western regions was found low, and the mode of agricultural economic development is relatively weaker. Compared with the eastern region with the advanced development of the economy, the increase in agricultural water use proportion brings more redundant input of water resources, and the improvement of AWUE is also relatively slow. However, with the implementation of policies, such as the Western development and the Belt and Road Initiative, the western provinces represented by Shaanxi, Chongqing, and Sichuan enjoy national policy benefits, and their AWUE has greatly improved. The trend has gradually narrowed the average gap between the western and central regions, even exceeding the central region in 2017.

3.2. Econometric Test Results and Regional Variability

3.2.1. Spatial Correlation Test and Econometric Model Selection

The level of urbanization in an area not only affects the local AWUE but may also affect the AWUE of neighboring areas [79]. This spatial effect can be produced and demonstrated by reconfiguring production factors within a region and the flow of production factors between regions. In addition, the current AWUE in a specific area is also affected by the previous AWUE. Therefore, the subsection mainly constructs the dynamic spatial measurement to investigate the spatial effect of urbanization development on AWUE.
The premise of constructing a spatial econometric model is to set a spatial weight matrix. The article constructs three forms of the spatial weight matrix. The first form is the Rook adjacency weight matrix (W01) with public boundaries. When the two provinces have common boundaries, the elements in the matrix are set to 1, otherwise set to 0. The second form is the geographical distance weight matrix (WD). The matrix elements are constructed based on the square of the reciprocal of the latitude and longitude distance of the regional geometric center. The third is the economic matrix (WE), which is the product of the reciprocal of the nearest highway, mileage between provincial capitals, and the proportion of the annual average value of regional per capita GDP in the annual average value of per capita GDP in all regions as suggested by Shao et al. [80]. The above three weight matrices are standardized.
The global Moran’s (I) was used to analyze the spatial correlation between AWUE and urbanization level in China (Table 4). The Moran index of AWUE is significantly greater than 0 at the 5% level, and the AWUE of each region shows a significant positive spatial autocorrelation [81]. Therefore, the demonstration effect of adjacent areas will affect the AWUE of the region, showing spatial agglomeration.
Two Lagrange multipliers (LM-lag and LM-error) and their robust forms (Robust LM-lag and Robust LM-error) are used to identify the specific forms of the dynamic spatial panel model as suggested by Rebel et al. [82]. Table 5 shows that LM-lag and LM-error passed the significance test under three weight matrices, and Robust LM-lag passed the significance test, while Robust LM-error passed the significance test only under WD [82]. Overall, spatial autocorrelation is selected as the test model of spatial effect analysis [83].

3.2.2. Analysis of the Impact of China’s Urbanization on AWUE

Table 6 represents the estimation results of the spatial panel model under different weight matrices. In order to facilitate comparative analysis, the measurement results (model, model 2, and model 4) are also reported. From the regression estimation results, we found that urbanization has a significant positive impact on AWUE. At the same time, the coefficients of the time lag effect. Spatial spillover effect ρ were significantly positive, indicating significant path dependence characteristics and spatial spillover effects of AWUE among provinces.
On the one hand, path dependence means that the change of AWUE in the current period is positively affected by the AWUE in the previous period, which indicates that the AWUE in various regions has specific dynamic and related characteristics in time. The agricultural production and water saving methods in the previous period will affect the agricultural activities in the next period and then affect the region’s improvement. On the other hand, spatial spillover means that the AWUE will form a strong demonstration effect and radiation driving effect on the AWUE in adjacent areas. The similarity of resource endowment, production conditions, and irrigation traditions among adjacent areas will strengthen the demonstration effect and mutual impact of agricultural water use in adjacent areas.
Under the two spatial weight matrices, the estimated coefficients of urbanization are significantly positive at the 5% statistical level. Thus, it can be stated that urbanization development promotes the improvement of AWUE in each province. The spatial agglomeration in the development of urbanization can promote the flow and agglomeration of population, reduce the scale of land and labor factors in agricultural production, and reconfigure the factor input structure. Moreover, the spatial agglomeration can promote the progress of agricultural technology and improve the AWUE. At the same time, urbanization has led to the increase in income of urban and rural residents and improves the awareness of water-saving of rural residents.

3.2.3. Analysis of the Impact of Different Regions Urbanization

Usually, there are significant systematic differences in urbanization development, agricultural production, resource endowments, and other aspects in each region. There are differences in the urbanization process between different regions and their effects and paths on AWUE may also be different. In order to further investigate the regional heterogeneity of the impact of urbanization on AWUE, we have conducted a sub-sample study on the three major regions in the eastern, central, and western regions (Table 7).
The eastern region consists with coastal regions has gentle terrain and good conditions for agricultural interventions. This region plays a leading role in overall economic development due to its long history of development, favorable geographical location, and high cultural quality of its labor force, strong technical force, and strong industrial and agricultural base [84]. However, the central region is located inland and is a traditional grain production base in China, with better agricultural production conditions and a specific economic base, a better heavy industry base, and an east to west geographically [85]. The western region is vast, with complex terrain, and most of it is alpine and water-scarce [86]. On the one hand, due to natural conditions, the agricultural infrastructure in the western region is weak, and agricultural production is self-sufficient. On the other hand, the gap between economic development and technical management level in the east and central regions is primarily due to the late development history. However, with the economic growth and the investment support from the central and local finance to support agriculture in the western region, the agricultural development in the western region is gradually narrowing the gap with the east and central regions.
Under the two spatial weight matrices, the impact of urbanization on AWUE in the three regions was positive at a 5% significant level, mainly manifested as central > western > eastern. At the same time, the time lag and spatial lag coefficients of AWUE are significant, and path dependence and spatial spillover characteristics still exist. For the eastern region, the overall stage of urbanization is dominated by the service sector. In terms of slowing down the expansion of large-scale industrialization and the evolution of urbanization to a mature stage, the proportion of the primary industry is decreasing, and the agricultural technology and management system are constantly innovating. Therefore, the pressure on agricultural water consumption and the environment is relatively low, and its AWUE remains relatively high. According to the principle of diminishing marginal returns [87], urbanization development benefits are smaller than the other two regions. The share of agriculture is more significant for the central and western regions, and agricultural modernization is relatively slower. In the context of rapid urbanization, it can effectively realize the effective allocation of redundant resources for agricultural production and the technological progress brought by large-scale operation, promoting AWUE.

3.3. Analysis of the Spatial Effect Decomposition

According to Lesage’s theory [88], the regression coefficients are valid only in terms of direction and significance due to lagged terms of the variables in the dynamic spatial panel model. Further, the impact of urbanization on AWUE is decomposed into direct and indirect effects. The direct effect represents the impact of urbanization within the region on the AWUE, and the indirect effect represents the impact of urbanization in the region on the AWUE in other regions. The effect decomposition can also be decomposed into short-term effects and long-term effects in the time dimension, reflecting the short-term effect of urbanization on AWUE and the long-term effect of time lag. Table 8 reports the decomposition results of the impact effect obtained by further calculation.
Overall, the impact direction and significance of urbanization under the three weight matrices are generally consistent. The short-term effects of urbanization development on AWUE in each region are significantly positive at a 1% level. The long-term effect and the long-term effect are only significant for the western region. This shows that at the present stage, the development of urbanization has a more profound long-term impact on the AWUE in the western region, only a short-term impact on the whole country and the eastern and central regions.
It can be seen that the direct and indirect effects of urbanization on AWUE are significantly positive, and the direct effect is significantly greater than the indirect effect, meaning that urbanization will promote AWUE in the short term. Due to the spatial spillover effect, AWUE is transmitted to adjacent areas and has a significant degree of positive impact. The possible reasons are the improvement of economic level and technological progress brought about by urbanization in the short term, the popularization of agricultural machinery and water-saving irrigation services, and the promotion of AWUE. The similarity of AWUE in adjacent areas in terms of resource endowment, production conditions, planting traditions, irrigation methods, and other aspects will strengthen the demonstration and interaction of AWUE in adjacent areas. The local and neighboring regions often have spatial linkages to protect water resources, and there is competition and imitation. When the local region makes a positive response to improve the AWUE and the neighboring regions do not take timely action, it is likely to widen the gap between the AWUE and the local region, resulting in changes in the proportion of agricultural water use between regions. However, in the decomposition results of the long-term effect, there are significant differences in the impact of urbanization development on various regions.
Urbanization has only long-term adverse direct effects and a positive spillover effect on the western region, and the effect of other regions is not significant. The reason may be that the western region is a mainly reserved economy and is significantly impacted by policies. With the implementation of regional coordinated development strategies, such as the Western Development, many industries in the eastern region are transferred to the western region. However, the transferred industries are mainly high energy consumption and high pollution industries, which will undoubtedly increase the burden of energy conservation, emission reduction, and environmental protection in the western region. At the same time, the economic development of the western region is relatively backward, the level of urbanization is in the primary stage. Thus, the local government is under the pressure of performance assessment or promotion, long-term blind pursuit of rapid economic development and agricultural modernization level is not matching. The increasing demand for chemical fertilizers and pesticides in agricultural production has directly caused water pollution.
Meanwhile, the development of ecological agriculture has not yet fully incorporated with the national management system and incentive system, which will negatively impact the AWUE in the long run. The positive spillover effect is caused by the agricultural water pollution caused by severe agricultural pollution, which may increase the demand for environmental governance in the local and surrounding areas. Increase in the supervision and punishment of the national environmental protection department on the local environmental pollution, thus causing the government in the surrounding areas to pay more attention to the governance of agricultural water use and strengthen environmental regulation to improve AWUE.

3.4. Analysis of the Impact of Different Dimensions of Urbanization

Urbanization development is a gradual process. The reform of the urban–rural dual structure system and the gradual elimination of mobility barriers first show the migration and agglomeration of rural populations to urban areas. It constitutes the main driving force to promote urbanization in China. However, the limited urban land area will inevitably lead to limited population carrying capacity. In the process of expansion, cities and towns are bound to meet the needs of matching infrastructure and economic development levels to promote the urbanization of economic development levels. Therefore, urbanization is mainly composed of population urbanization, land urbanization, Economic Urbanization, and other sub-systems. It is worth noting that similar natural endowment conditions, climate conditions, and agricultural production conditions between adjacent regions increase mobility.
Moreover, the substitutability of agricultural production factors in adjacent regions and provides the possibility of technology spillover. Moreover, the cross-regional flow and transfer of rural labor are inherently spatially related, changing the factor input structure and planting, the willingness of labor transfer regions, and increasing the demand for agricultural production areas in neighboring regions. Therefore, from a spatial perspective, urbanization can also indirectly affect the efficiency of agricultural water use in neighboring areas through knowledge spillover and technology spillover.
In this part, the paper will discuss the impacts of urbanization development in different dimensions on AWUE, further tested from the dimensions of population urbanization, land urbanization, and economic urbanization (Table 9). Overall, the impact of population urbanization, land urbanization, and economic urbanization on AWUE under different weight matrices shows significant differences, but the direction of impact is consistent. Specifically, land urbanization and economic urbanization under three weight matrices significantly positively impact AWUE and significantly improve AWUE in a region. The urbanization of land and economy is the development process of population concentration from rural to urban, agricultural production to industrial and service production, and economic factors to urban areas. On the one hand, reducing cultivated land resources caused by urban expansion leads to the corresponding increase in farmers’ per capita cultivated land scale, which stimulates the demand for scale and mechanization in agricultural production, and the scale and intensive utilization of cultivated land also promote the improvement of AWUE.
On the other hand, economic urbanization is the spatial carrier of industrial agglomeration. Industrial agglomeration can give full play to the advantages of centralized utilization of resources, promote the agglomeration effect and scale effect, and improve the intensive utilization of agricultural input factors. Optimize the matching between input and output of factors and then improve agricultural water use efficiency. This also confirms why the level of AWUE in the eastern region remains at a high level. Population urbanization has a significant positive impact on AWUE only in the adjacency matrix. It means that the knowledge spillover caused by rural labor transfer among adjacent areas will improve the AWUE, and the relative transfer of rural surplus labor in the process of urbanization facilitates the flow of technology, information, and capital, which is beneficial to guide the marketization and benefit development of agriculture, improve the level of technical efficiency, and then improve the AWUE.

3.5. Policy Implications

Water distribution is one of the greatest essential aspects of the agriculture system. Interestingly, a variety of variables influence water consumption in the agriculture sector. Evaluating the coordinated relationship between urbanization development and the utilization of agricultural water resources is an important way to improve agricultural water use efficiency and solve the shortage of agricultural water resources [20]. China’s economy has entered a new stage, and the economic development is gradually changing from the extensive mode of pursuing growth rate to the innovative model of pursuing structural adjustment and environmental efficiency [89]. In order to promote the high-quality development of urbanization and improve the AWUE, this paper puts forward the following policy implications:
(i) Local governments should focus on the integrated and coordinated development of new urbanization and agricultural resources, maintain a rational attitude toward the urbanization process, pay attention to the heterogeneous differences between regions, and formulate local policies according to local conditions. The eastern provinces should give full play to their “demonstration role” and driving advantages, strengthen policy support for the central and western regions, and promote inter-regional synergistic development. The central and western regions should further promote the development process of new urbanization. Following the inherent requirements for the transformation and development of new urbanization in the National Plan for New Urbanization (2014–2020), efforts should be made to improve the high-quality development of urbanization. The local government should reasonably promote labor, capital, technology, and other production factors and promote regional agricultural water efficiency improvement.
(ii) In the context of the rapid increase in urbanization and the continued enhancement of the spatial mobility of agricultural factors, the restrictive factors should be reduced that affect the re-allocation of agricultural production factors and give full attention to spatial spillover effects. The imbalanced development pattern of the regional agricultural economy should be balanced by breaking down administrative barriers and local protectionism. As short-term economic development cannot be achieved at the expense of the ecological environment, the western region should establish a more long-term environmental protection assessment mechanism in response to the long-term negative impact of current urbanization on AWUE. Moreover, the local authority should reduce dependence on high energy consumption and high pollution production patterns.
(iii) Different dimensions of urbanization have different impacts on changes in AWUE, depending on the region’s population agglomeration, development stage, and industrial structure. Therefore, to ensure the efficient use and sustainable development of agricultural water resources, all regions must formulate scientific and reasonable urbanization promotion strategies according to the sectorial demand. On the one hand, all regions should pay more attention to the positive transmission effect of land urbanization and economic urbanization on AWUE and coordinate the relationship between urbanization development and agricultural water resources. It will open up the channels for the transfer of rural labor in neighboring regions in close proximity, speed up the establishment of social security mechanisms for the mobilized population, guide the full release of the potential for the transfer of rural labor, and develop the construction of a new type of people-oriented urbanization.

4. Conclusions

The urban transformation, which came after the agriculture and industrial revolutions, is one of the most critical concerns in a country’s socio-economic growth. Urbanization is a complex multi-dimensional system that includes sub-systems, such as population urbanization, land urbanization, and economic urbanization. In addition, there are complex interactions and mutual constraints between the sub-systems. Urbanization has two effects on water resources usage. It raises food demands and domestic water intake, resulting in a loss of existing water resources. The study aims to evaluate the impacts of urbanization in terms of facilitating effective water usage in the agricultural sector. The article uses the panel data of 30 provinces in China from 1999 to 2018 to measure the comprehensive level of urbanization by entropy method, adopts the dynamic spatial panel econometric model, and uses the unconditional maximum likelihood estimation method to craft the findings.
Existing research mainly uses a single factor or considers the productivity of the expected output to measure the agricultural water efficiency of a single region or single-dimensional population. The study considers the agricultural non-point source pollution and agricultural source pollution caused by negative externalities in agricultural economic growth when evaluating agricultural water efficiency. It evaluated two types of undesired output of agricultural carbon emissions, so the estimated efficiency is more robust. We have explored the spatial effect of urbanization development on agricultural water use efficiency and its differential characteristics from regional heterogeneity, which is conducive to grasping the effect of urbanization on agricultural water use efficiency from the spatial level and conducive to discussing and adjusting regional heterogeneity. Moreover, the corresponding urbanization development strategy and agricultural water use strategy under natural conditions have also been critically explored in the study. The results indicate that the average AWUE in each year in China is relatively low, and there is still much room for resource conservation and environmental protection in the green development of AWUE. We also traced structural differences between the eastern and western regions. In contrast, the central regions have a moderate level of efficiencies regarding AWUE.
The continuous improvement of China’s agricultural resources and energy consumption (agricultural machinery, pesticides, and fertilizers) and other data monitoring, reporting, and verification data provide a wide base of research regarding resources conversations. Future research can focus on the city or county scale to measure agricultural water use efficiency and urbanization level and explore the relationship between the two, revealing the regional differences and dynamic evolution trends of the coordinated development of the two on a deeper level. The article focuses on demonstrating the impact of urbanization on agricultural water use efficiency from a spatial perspective but lacks analysis and testing of the mechanism of action. Future research should use econometric techniques, such as rolling regression and structural equation modeling to reveal the complex relationship among the associated factors. Water distribution differs by economic section, as water goes first, then to the household sector, the industries, and finally to the agriculture sector. Thus, if this preference can be represented in water source allocation, more accurate findings and validation with lower errors can achieve. It is recommended that multivariate mathematical programming can be used in this case. The study used “the rate of mechanization” as a control variable however it may not be generalized for the every case. Therefore, future studies should carefully evaluate the background of the study regions and if the actual effects of mechanization in water saving technology could be measured it will be more appropriate. Due to the unavailability and time limitations of the data, the study used the amount of precipitation as a meteorological parameter determining water needs, which may not be a perfect measurement option. The information on evapotranspiration is much more accurate and widely applied in the irrigation calculation process. Therefore, future researches should utilize evapotranspiration.

Author Contributions

Conceptualization, W.L. (Weinan Lu) and A.S.; methodology, W.L. (Weinan Lu) and A.S.; software, M.H. and W.L. (Wenxin Liu); validation, W.L. (Weinan Lu), M.H., and A.S.; formal analysis, W.L. (Weinan Lu) and A.S.; investigation, X.G. and A.S.; resources, M.Z. and K.Z.; data-curation, W.L. (Weinan Lu) and A.S.; writing—original draft preparation, W.L. (Weinan Lu), A.S., M.H., and W.L. (Wenxin Liu); writing—review and editing, W.L. (Weinan Lu) and A.S.; visualization, X.G., K.Z., and M.Z.; supervision, K.Z. and M.Z., project administration, A.S. and K.Z.; funding acquisition, K.Z., and M.Z. All authors have read and agreed to the published version of the manuscript.

Funding

This study was funded by the National Natural Science Foundation of China (Grant No: 71973105 and 15ZDA052).

Institutional Review Board Statement

As the study does not involve any personal data and the respondent was well aware that they can opt-out anytime during the data collection phase, any written institutional review board statement is not required.

Informed Consent Statement

As the study does not involve any personal data and the respondent was well aware that they can opt-out anytime during the data collection phase, any written institutional review board statement is not required.

Data Availability Statement

The associated dataset of the study is available upon request to the corresponding author.

Conflicts of Interest

The authors declare no conflict of interest.

References

  1. Gil, J. Water Value in Agriculture. Nat. Food 2020, 1, 530. [Google Scholar] [CrossRef]
  2. Wang, F.; Yu, C.; Xiong, L.; Chang, Y. How Can Agricultural Water Use Efficiency Be Promoted in China? A Spatial-Temporal Analysis. Resour. Conserv. Recycl. 2019, 145, 411–418. [Google Scholar] [CrossRef]
  3. Vörösmarty, C.J.; McIntyre, P.B.; Gessner, M.O.; Dudgeon, D.; Prusevich, A.; Green, P.; Glidden, S.; Bunn, S.E.; Sullivan, C.A.; Liermann, C.R.; et al. Global Threats to Human Water Security and River Biodiversity. Nature 2010, 467, 555–561. [Google Scholar] [CrossRef] [PubMed]
  4. United Nations World Water Assessment Programme. The United Nations World Water Development Report 2018: Nature-Based Solutions for Water; Unesco: Paris, France, 2017. [Google Scholar]
  5. Shen, X.; Lin, B. The Shadow Prices and Demand Elasticities of Agricultural Water in China: A StoNED-Based Analysis. Resour. Conserv. Recycl. 2017, 127, 21–28. [Google Scholar] [CrossRef]
  6. Wang, Z.; Li, J.; Li, Y. Using Reclaimed Water for Agricultural and Landscape Irrigation in China: A Review. Irrig. Drain. 2017, 66, 672–686. [Google Scholar] [CrossRef]
  7. Tian, J.; Guo, S.; Deng, L.; Yin, J.; Pan, Z.; He, S.; Li, Q. Adaptive Optimal Allocation of Water Resources Response to Future Water Availability and Water Demand in the Han River Basin, China. Sci. Rep. 2021, 11, 1–18. [Google Scholar] [CrossRef]
  8. Yao, L.; Zhao, M.; Xu, T. China’s Water-Saving Irrigation Management System: Policy, Implementation, and Challenge. Sustainability 2017, 9, 2339. [Google Scholar] [CrossRef] [Green Version]
  9. Piao, S.; Ciais, P.; Huang, Y.; Shen, Z.; Peng, S.; Li, J.; Zhou, L.; Liu, H.; Ma, Y.; Ding, Y.; et al. The Impacts of Climate Change on Water Resources and Agriculture in China. Nature 2010, 467, 43–51. [Google Scholar] [CrossRef]
  10. Huang, G.; Hoekstra, A.Y.; Krol, M.S.; Jägermeyr, J.; Galindo, A.; Yu, C.; Wang, R. Water-Saving Agriculture Can Deliver Deep Water Cuts for China. Resour. Conserv. Recycl. 2020, 154, 104578. [Google Scholar] [CrossRef]
  11. Liu, L. Assessment of Water Resource Security in Karst Area of Guizhou Province, China. Sci. Rep. 2021, 11, 7641. [Google Scholar] [CrossRef]
  12. Ma, T.; Sun, S.; Fu, G.; Hall, J.W.; Ni, Y.; He, L.; Yi, J.; Zhao, N.; Du, Y.; Pei, T.; et al. Pollution Exacerbates China’s Water Scarcity and Its Regional Inequality. Nat. Commun. 2020, 11, 650. [Google Scholar] [CrossRef] [Green Version]
  13. Ozcelik, N.; Rodríguez, M.; Lutter, S.; Sartal, A. Indicating the Wrong Track? A Critical Appraisal of Water Productivity as an Indicator to Inform Water Efficiency Policies. Resour. Conserv. Recycl. 2021, 168, 105452. [Google Scholar] [CrossRef]
  14. Liu, Y. Is the Natural Resource Production a Blessing or Curse for China’s Urbanization? Evidence from a Space–Time Panel Data Model. Econ. Model. 2014, 38, 404–416. [Google Scholar] [CrossRef]
  15. Zhang, X.; Kong, Y.; Ding, X. How High-Quality Urbanization Affects Utilization Efficiency of Agricultural Water Resources in the Yellow River Basin under Double Control Action? Sustainability 2020, 12, 2869. [Google Scholar] [CrossRef] [Green Version]
  16. Zhang, Z.; Shi, M.; Chen, K.Z.; Yang, H.; Wang, S. Water Scarcity Will Constrain the Formation of a World-Class Megalopolis in North China. NPJ Urban Sustain. 2021, 1, 1–10. [Google Scholar] [CrossRef]
  17. Zhao, Y.; Zhu, Y.; Lin, Z.; Wang, J.; He, G.; Li, H.; Li, L.; Wang, H.; Jiang, S.; He, F.; et al. Energy Reduction Effect of the South-to-North Water Diversion Project in China. Sci. Rep. 2017, 7, 15956. [Google Scholar] [CrossRef] [Green Version]
  18. Li, X.; Zhang, X.; Niu, J.; Tong, L.; Kang, S.; Du, T.; Li, S.; Ding, R. Irrigation Water Productivity Is More Influenced by Agronomic Practice Factors than by Climatic Factors in Hexi Corridor, Northwest China. Sci. Rep. 2016, 6, 37971. [Google Scholar] [CrossRef] [Green Version]
  19. Ommani, A.R.; Chizari, M. Analysis of Sustainable Water Resources Management (SWRM) in Agriculture. Nat. Prec. 2009, 1. [Google Scholar] [CrossRef]
  20. Avazdahandeh, S.; Khalilian, S. The Effect of Urbanization on Agricultural Water Consumption and Production: The Extended Positive Mathematical Programming Approach. Environ. Geochem. Health 2021, 43, 247–258. [Google Scholar] [CrossRef] [PubMed]
  21. Florke, M.; Schneider, C.; McDonald, R.I. Water Competition between Cities and Agriculture Driven by Climate Change and Urban Growth. Nat. Sustain. 2018, 1, 51–58. [Google Scholar] [CrossRef]
  22. Jat, M.L.; Chakraborty, D.; Ladha, J.K.; Rana, D.S.; Gathala, M.K.; McDonald, A.; Gerard, B. Conservation Agriculture for Sustainable Intensification in South Asia. Nat. Sustain. 2020, 3, 336–343. [Google Scholar] [CrossRef]
  23. Yu, H.; Yang, Z.; Li, B. Sustainability Assessment of Water Resources in Beijing. Water 2020, 12, 1999. [Google Scholar] [CrossRef]
  24. Cai, Y.; Yue, W.; Xu, L.; Yang, Z.; Rong, Q. Sustainable Urban Water Resources Management Considering Life-Cycle Environmental Impacts of Water Utilization under Uncertainty. Resour. Conserv. Recycl. 2016, 108, 21–40. [Google Scholar] [CrossRef] [Green Version]
  25. Singh, A. Conjunctive Use of Water Resources for Sustainable Irrigated Agriculture. J. Hydrol. 2014, 519, 1688–1697. [Google Scholar] [CrossRef]
  26. Fang, Q.X.; Ma, L.; Green, T.R.; Yu, Q.; Wang, T.D.; Ahuja, L.R. Water Resources and Water Use Efficiency in the North China Plain: Current Status and Agronomic Management Options. Agric. Water Manag. 2010, 97, 1102–1116. [Google Scholar] [CrossRef]
  27. Li, W.; Hai, X.; Han, L.; Mao, J.; Tian, M. Does Urbanization Intensify Regional Water Scarcity? Evidence and Implications from a Megaregion of China. J. Clean. Prod. 2020, 244, 118592. [Google Scholar] [CrossRef]
  28. Wang, Y. The Challenges and Strategies of Food Security under Rapid Urbanization in China. Sustainability 2019, 11, 542. [Google Scholar] [CrossRef] [Green Version]
  29. Yan, T.; Wang, J.; Huang, J. Urbanization, Agricultural Water Use, and Regional and National Crop Production in China. Ecol. Model. 2015, 318, 226–235. [Google Scholar] [CrossRef]
  30. Xu, Z.; Chen, X.; Liu, J.; Zhang, Y.; Chau, S.; Bhattarai, N.; Wang, Y.; Li, Y.; Connor, T.; Li, Y. Impacts of Irrigated Agriculture on Food–Energy–Water–CO 2 Nexus across Metacoupled Systems. Nat. Commun. 2020, 11, 5837. [Google Scholar] [CrossRef] [PubMed]
  31. Cao, X.; Zeng, W.; Wu, M.; Guo, X.; Wang, W. Hybrid Analytical Framework for Regional Agricultural Water Resource Utilization and Efficiency Evaluation. Agric. Water Manag. 2020, 231, 106027. [Google Scholar] [CrossRef]
  32. Hu, J.-L.; Wang, S.-C.; Yeh, F.-Y. Total-Factor Water Efficiency of Regions in China. Resour. Policy 2006, 31, 217–230. [Google Scholar] [CrossRef]
  33. Kaneko, S.; Tanaka, K.; Toyota, T.; Managi, S. Water Efficiency of Agricultural Production in China: Regional Comparison from 1999 to 2002. Int. J. Agric. Resour. Gov. Ecol. 2004, 3, 231–251. [Google Scholar] [CrossRef]
  34. van Halsema, G.E.; Vincent, L. Efficiency and Productivity Terms for Water Management: A Matter of Contextual Relativism versus General Absolutism. Agric. Water Manag. 2012, 108, 9–15. [Google Scholar] [CrossRef]
  35. Liu, Y.; Hu, X.; Zhang, Q.; Zheng, M. Improving Agricultural Water Use Efficiency: A Quantitative Study of Zhangye City Using the Static CGE Model with a CES Water−Land Resources Account. Sustainability 2017, 9, 308. [Google Scholar] [CrossRef] [Green Version]
  36. Wang, G.; Chen, J.; Wu, F.; Li, Z. An Integrated Analysis of Agricultural Water-Use Efficiency: A Case Study in the Heihe River Basin in Northwest China. Phys. Chem. Earth Parts A/B/C 2015, 89–90, 3–9. [Google Scholar] [CrossRef]
  37. Xue, S.; Yang, T.; Zhang, K.; Feng, J. Spatial Effect and Influencing Factors of Agricultural Water Environmental Efficiency in China. Appl. Ecol. Environ. Res. 2018, 16, 4491–4504. [Google Scholar] [CrossRef]
  38. Bao, C.; Chen, X. The Driving Effects of Urbanization on Economic Growth and Water Use Change in China: A Provincial-Level Analysis in 1997–2011. J. Geogr. Sci. 2015, 25. [Google Scholar] [CrossRef] [Green Version]
  39. Wang, Y. Urban Land and Sustainable Resource Use: Unpacking the Countervailing Effects of Urbanization on Water Use in China, 1990–2014. Land Use Policy 2020, 90, 104307. [Google Scholar] [CrossRef]
  40. Ding, X.; Fu, Z.; Jia, H. Study on Urbanization Level, Urban Primacy and Industrial Water Utilization Efficiency in the Yangtze River Economic Belt. Sustainability 2019, 11, 6571. [Google Scholar] [CrossRef] [Green Version]
  41. Mao, X.; Liu, M.; Wang, X.; Liu, C.; Hou, Z.; Shi, J. Effects of Deficit Irrigation on Yield and Water Use of Greenhouse Grown Cucumber in the North China Plain. Agric. Water Manag. 2003, 61, 219–228. [Google Scholar] [CrossRef]
  42. Ahmed, Z.; Asghar, M.M.; Malik, M.N.; Nawaz, K. Moving towards a Sustainable Environment: The Dynamic Linkage between Natural Resources, Human Capital, Urbanization, Economic Growth, and Ecological Footprint in China. Resour. Policy 2020, 67, 101677. [Google Scholar] [CrossRef]
  43. Danish; Ulucak, R.; Khan, S.U.-D. Determinants of the Ecological Footprint: Role of Renewable Energy, Natural Resources, and Urbanization. Sustain. Cities Soc. 2020, 54, 101996. [Google Scholar] [CrossRef]
  44. Rashid, H.; Manzoor, M.M.; Mukhtar, S. Urbanization and Its Effects on Water Resources: An Exploratory Analysis. Asian J. Water Environ. Pollut. 2018, 15, 67–74. [Google Scholar] [CrossRef]
  45. Bai, X.; Chen, J.; Shi, P. Landscape Urbanization and Economic Growth in China: Positive Feedbacks and Sustainability Dilemmas. Environ. Sci. Technol. 2012, 46, 132–139. [Google Scholar] [CrossRef]
  46. Liu, X.; Xu, Y.; Engel, B.A.; Sun, S.; Zhao, X.; Wu, P.; Wang, Y. The Impact of Urbanization and Aging on Food Security in Developing Countries: The View from Northwest China. J. Clean. Prod. 2021, 292, 126067. [Google Scholar] [CrossRef]
  47. Wu, Y.M. Estimation of Input-Output Elasticity of Regional Agricultural Production Elements in China: An Empirical Study Based on Spatial Econometric Model. Chin. Rural Econ 2010, 6, 25–37. [Google Scholar]
  48. Abbasi, A.; Sajid, A.; Haq, N.; Rahman, S.; Misbah, Z.; Sanober, G.; Ashraf, M.; Kazi, A.G. Agricultural Pollution: An Emerging Issue. Improv. Crops Era Clim. Chang. 2014, 347–387. [Google Scholar] [CrossRef]
  49. Tang, F.H.M.; Lenzen, M.; McBratney, A.; Maggi, F. Risk of Pesticide Pollution at the Global Scale. Nat. Geosci. 2021, 14, 206–210. [Google Scholar] [CrossRef]
  50. Balwinder-Singh; McDonald, A.J.; Srivastava, A.K.; Gerard, B. Addendum: Tradeoffs between Groundwater Conservation and Air Pollution from Agricultural Fires in Northwest India. Nat. Sustain. 2020, 3, 972. [Google Scholar] [CrossRef]
  51. Eisenstein, M. Natural Solutions for Agricultural Productivity. Nature 2020, 588, S58–S59. [Google Scholar] [CrossRef] [PubMed]
  52. Tone, K. A Slacks-Based Measure of Efficiency in Data Envelopment Analysis. Eur. J. Oper. Res. 2001, 130, 498–509. [Google Scholar] [CrossRef] [Green Version]
  53. Tone, K. A Strange Case of the Cost and Allocative Efficiencies in DEA. J. Oper. Res. Soc. 2002, 53, 1225–1231. [Google Scholar] [CrossRef]
  54. Tone, K. Slacks-Based Measure of Efficiency. Handb. Data Envel. Anal. 2011, 195–209. [Google Scholar] [CrossRef]
  55. Hu, Z.; Yu, G.; Fu, Y.; Sun, X.; Li, Y.; Shi, P.; Wang, Y.; Zheng, Z. Effects of Vegetation Control on Ecosystem Water Use Efficiency within and among Four Grassland Ecosystems in China. Glob. Chang. Biol. 2008, 14, 1609–1619. [Google Scholar] [CrossRef]
  56. Bao, C.; Chen, X. Spatial Econometric Analysis on Influencing Factors of Water Consumption Efficiency in Urbanizing China. J. Geogr. Sci. 2017, 27, 1450–1462. [Google Scholar] [CrossRef] [Green Version]
  57. Jiadai, Y.; Pengpeng, X.; Zhijin, H. Impact of Urbanization on Ecological Efficiency in China: An Empirical Analysis Based on Provincial Panel Data. Ecol. Indic. 2021, 129, 107827. [Google Scholar] [CrossRef]
  58. LeSage, J.; Pace, R.K. Introduction to Spatial Econometrics; Chapman and Hall/CRC: New York, NY, USA, 2009; ISBN 0-429-13808-3. [Google Scholar]
  59. Bai, Y.; Deng, X.; Jiang, S.; Zhang, Q.; Wang, Z. Exploring the Relationship between Urbanization and Urban Eco-Efficiency: Evidence from Prefecture-Level Cities in China. J. Clean. Prod. 2018, 195, 1487–1496. [Google Scholar] [CrossRef]
  60. Rehman, A.; Ma, H.; Chishti, M.Z.; Ozturk, I.; Irfan, M.; Ahmad, M. Asymmetric Investigation to Track the Effect of Urbanization, Energy Utilization, Fossil Fuel Energy and CO2 Emission on Economic Efficiency in China: Another Outlook. Environ. Sci. Pollut. Res. 2021, 28, 17319–17330. [Google Scholar] [CrossRef] [PubMed]
  61. Anselin, L. Lagrange Multiplier Test Diagnostics for Spatial Dependence and Spatial Heterogeneity. Geogr. Anal. 1988, 20, 1–17. [Google Scholar] [CrossRef]
  62. Tolk, J.A.; Howell, T.A. Water Use Efficiencies of Grain Sorghum Grown in Three USA Southern Great Plains Soils. Agric. Water Manag. 2003, 59, 97–111. [Google Scholar] [CrossRef]
  63. Tallec, T.; Béziat, P.; Jarosz, N.; Rivalland, V.; Ceschia, E. Crops’ Water Use Efficiencies in Temperate Climate: Comparison of Stand, Ecosystem and Agronomical Approaches. Agric. For. Meteorol. 2013, 168, 69–81. [Google Scholar] [CrossRef]
  64. Wallace, J.S. Increasing Agricultural Water Use Efficiency to Meet Future Food Production. Agric. Ecosyst. Environ. 2000, 82, 105–119. [Google Scholar] [CrossRef]
  65. Bai, Z.; Ma, W.; Ma, L.; Velthof, G.L.; Wei, Z.; Havlík, P.; Oenema, O.; Lee, M.R.F.; Zhang, F. China’s Livestock Transition: Driving Forces, Impacts, and Consequences. Sci. Adv. 2018, 4, eaar8534. [Google Scholar] [CrossRef] [Green Version]
  66. Hou, S.; Yao, M. Spatial-Temporal Evolution and Trend Prediction of Agricultural Eco-Efficiency in China: 1978–2016. Acta Geogr. Sin. 2018, 73, 2168–2183. [Google Scholar]
  67. BaoYi, W.; WeiGuo, Z. Cross-provincial differences in determinants of agricultural eco-efficiency in China: An analysis based on panel data from 31 provinces in 1996–2015. China Rural Econ. 2018, 1, 12–34. [Google Scholar]
  68. Mughal, M.A.Z. Rural Urbanization, Land, and Agriculture in Pakistan. Asian Geogr. 2019, 36, 81–91. [Google Scholar] [CrossRef]
  69. Brückner, M. Economic Growth, Size of the Agricultural Sector, and Urbanization in Africa. J. Urban Econ. 2012, 71, 26–36. [Google Scholar] [CrossRef]
  70. Liu, X.; Zhang, W.; Qu, Z.; Guo, T.; Sun, Y.; Rabiei, M.; Cao, Q. Feasibility Evaluation of Hydraulic Fracturing in Hydrate-Bearing Sediments Based on Analytic Hierarchy Process-Entropy Method (AHP-EM). J. Nat. Gas Sci. Eng. 2020, 81, 103434. [Google Scholar] [CrossRef]
  71. Sharma, R.; Kamble, S.S.; Gunasekaran, A.; Kumar, V.; Kumar, A. A Systematic Literature Review on Machine Learning Applications for Sustainable Agriculture Supply Chain Performance. Comput. Oper. Res. 2020, 119, 104926. [Google Scholar] [CrossRef]
  72. Tokarev, K.E. Agricultural Crops Programmed Cultivation Using Intelligent System of Irrigated Agrocoenoses Productivity Analyzing. J. Phys. Conf. Ser. 2021, 1801, 012030. [Google Scholar] [CrossRef]
  73. Zhou, X.; Ma, W.; Li, G.; Qiu, H. Farm Machinery Use and Maize Yields in China: An Analysis Accounting for Selection Bias and Heterogeneity. Aust. J. Agric. Resour. Econ. 2020, 64, 1282–1307. [Google Scholar] [CrossRef]
  74. Jin, W.; Zhang, H.; Liu, S.; Zhang, H. Technological Innovation, Environmental Regulation, and Green Total Factor Efficiency of Industrial Water Resources. J. Clean. Prod. 2019, 211, 61–69. [Google Scholar] [CrossRef]
  75. Tan, Y.; Qian, L.; Sarkar, A.; Nurgazina, Z.; Ali, U. Farmer’s Adoption Tendency towards Drought Shock, Risk-Taking Networks and Modern Irrigation Technology: Evidence from Zhangye, Gansu, PRC. Int. J. Clim. Chang. Strateg. Manag. 2020. [Google Scholar] [CrossRef]
  76. Chuchird, R.; Sasaki, N.; Abe, I. Influencing Factors of the Adoption of Agricultural Irrigation Technologies and the Economic Returns: A Case Study in Chaiyaphum Province, Thailand. Sustainability 2017, 9, 1524. [Google Scholar] [CrossRef] [Green Version]
  77. Samian, M.; Mahdei, K.N.; Saadi, H.; Movahedi, R. Identifying Factors Affecting Optimal Management of Agricultural Water. J. Saudi Soc. Agric. Sci. 2015, 14, 11–18. [Google Scholar] [CrossRef] [Green Version]
  78. Cheng, G.; Qian, Z. MaxDea Pro 6.3 Manual; Beijing Realworld Softw. Co. Ltd.: Beijing, China, 2014. [Google Scholar]
  79. Bao, C.; Fang, C. Water Resources Flows Related to Urbanization in China: Challenges and Perspectives for Water Management and Urban Development. Water Resour. Manag. 2012, 26, 531–552. [Google Scholar] [CrossRef]
  80. Shao, Y.; Xie, Y.; Wang, C.; Yue, J.; Yao, Y.; Li, X.; Liu, W.; Zhu, Y.; Guo, T. Effects of Different Soil Conservation Tillage Approaches on Soil Nutrients, Water Use and Wheat-Maize Yield in Rainfed Dry-Land Regions of North China. Eur. J. Agron. 2016, 81, 37–45. [Google Scholar] [CrossRef]
  81. Franczyk, J.; Chang, H. Spatial Analysis of Water Use in Oregon, USA, 1985–2005. Water Resour. Manag. 2009, 23, 755–774. [Google Scholar] [CrossRef]
  82. Rebel, G.; Park, K.C.; Felippa, C.A. A Contact Formulation Based on Localized Lagrange Multipliers: Formulation and Application to Two-Dimensional Problems. Int. J. Numer. Methods Eng. 2002, 54, 263–297. [Google Scholar] [CrossRef]
  83. Kissling, W.D.; Carl, G. Spatial Autocorrelation and the Selection of Simultaneous Autoregressive Models. Glob. Ecol. Biogeogr. 2008, 17, 59–71. [Google Scholar] [CrossRef]
  84. Chen, Z.; Song, S. Efficiency and Technology Gap in China’s Agriculture: A Regional Meta-Frontier Analysis. China Econ. Rev. 2008, 19, 287–296. [Google Scholar] [CrossRef]
  85. Carter, C.A.; Zhong, F.; Zhu, J. Advances in Chinese Agriculture and Its Global Implications. Appl. Econ. Perspect. Policy 2012, 34, 1–36. [Google Scholar] [CrossRef]
  86. Li, Z.; Zhang, H. Productivity Growth in China’s Agriculture During 1985–2010. J. Integr. Agric. 2013, 12, 1896–1904. [Google Scholar] [CrossRef]
  87. Vazquez-Cognet, J.J. The Production of Mathematical Problems: A Diminishing Marginal Returns Experiment. Int. Rev. Econ. Educ. 2008, 7, 103–116. [Google Scholar] [CrossRef] [Green Version]
  88. LeSage, J.P. The Theory and Practice of Spatial Econometrics; University of Toledo: Toledo, OH, USA, 1999; Volume 28. [Google Scholar]
  89. Zhang, B.; Fu, Z.; Wang, J.; Zhang, L. Farmers’ Adoption of Water-Saving Irrigation Technology Alleviates Water Scarcity in Metropolis Suburbs: A Case Study of Beijing, China. Agric. Water Manag. 2019, 212, 349–357. [Google Scholar] [CrossRef]
Figure 1. The trend of AWUE during the period 1999 to 2018.
Land 11 00080 g001
Table 1. Evaluation index system of AWUE.
VariableUnitVariable Definition
InputsPlanting areakhm2Total area planted by agriculture
Labor input10,000 laborTotal agricultural labor input
Mechanical power10,000 kWTotal agricultural machinery power
Water input10,000 m3Total agricultural water input
Fertilizer input10,000 tTotal agricultural fertilizer input
Pesticide input10,000 tTotal agricultural pesticide input
Desirable OutputsAgricultural output valueHundred million yuan
(1999 prices)
The total agricultural output value
Undesirable outputscarbon emission10,000 tDirect or indirect carbon emissions for fertilizers, pesticides, agricultural film, agricultural diesel, irrigation, and water consumption, and tillage loss
non-point source pollution10,000 tChemical fertilizer loss, pesticide residue, and film residue
Table 2. Description of variables between 1999 and 2018.
VariablesMeanStd.MinMax
Explained variableAWUE0.3760.2720.0211.146
Core explanatory
variables
purban0.0880.0480.0030.313
lurban0.1120.0730.0020.353
eurban0.1170.0970.0020.509
urban0.3330.1890.0751.000
Control
variables
indus12.6706.9190.35036.450
edu8.4411.1055.43812.675
pre934.044519.22796.3902346.610
gap2.8630.5681.8454.758
open0.3130.3830.0161.799
water2132.0052476.41127.216,134.400
area1977.4961493.353109.7006119.600
mach0.5320.2690.1201.420
Table 3. AWUE and ranking by region from 1999 to 2018.
199920032007201120152018MeanRanking
Eastern regionBeijing0.200.220.340.530.761.000.469
Tianjin0.250.270.290.510.751.000.488
Hebei0.180.220.370.680.850.820.515
Liaoning0.190.210.320.500.810.750.4412
Shanghai0.180.210.270.350.390.450.3021
Jiangsu0.170.150.200.300.751.000.3517
Zhejiang0.150.170.250.430.590.710.3815
Fujian0.130.160.230.400.600.690.3716
Shandong0.240.350.560.891.001.000.663
Guangdong0.130.120.250.420.670.840.3813
Hainan0.220.150.220.410.620.770.3814
Mean0.190.200.300.490.710.820.43
Central regionShanxi0.210.260.330.610.740.710.487
Jilin0.190.220.330.430.540.410.3518
Heilongjiang0.080.100.160.230.320.720.2324
Anhui0.180.230.300.350.480.510.3319
Jiangxi0.090.130.140.180.300.330.1926
Henan0.280.350.651.001.001.000.712
Hubei0.150.190.300.570.700.930.4510
Hunan0.100.110.220.450.580.470.3220
Mean0.160.200.300.480.580.640.38
Western regionNeimenggu0.080.080.150.260.330.340.2025
Guangxi0.080.080.170.360.440.870.2822
Chongqing0.470.450.741.001.001.150.791
Sichuan0.220.230.380.650.661.070.506
Guizhou0.200.180.280.430.911.000.4511
Yunnan0.050.040.060.090.140.660.1429
Shaanxi0.220.230.350.680.961.060.564
Gansu0.090.100.170.310.450.450.2423
Qinghai0.070.050.120.140.210.490.1527
Ningxia0.020.030.050.100.140.160.0828
Xinjiang0.030.040.060.080.290.740.1730
Mean0.140.140.230.370.500.730.32
ChinaMean0.160.180.280.450.600.740.38
Table 4. Moran’s I index.
YearW01WDWEYearW01WDWE
19990.213 **
(2.139)
0.007
(1.038)
0.037 ***
(2.539)
20090.254 ***
(2.427)
0.024
(1.443)
0.053 ***
(3.081)
20000.242 ***
(2.368)
0.014
(1.20)
0.044 ***
(2.806)
20100.308 ***
(2.845)
0.039 *
(1.784)
0.066 ***
(3.54)
20010.21 **
(2.042)
0.015
(1.215)
0.050 ***
(2.993)
20110.278 ***
(2.567)
0.01
(1.064)
0.054 ***
(3.128)
20020.247 ***
(2.369)
0.022
(1.376)
0.048 ***
(2.931)
20120.316 ***
(2.857)
0.04 *
(1.78)
0.073 ***
(3.795)
20030.303 ***
(2.787)
0.047**
(1.977)
0.066 ***
(3.545)
20130.302 ***
(2.726)
0.033
(1.602)
0.075 ***
(3.837)
20040.290 ***
(2.716)
0.027
(1.509)
0.050 ***
(3.006)
20140.296 ***
(2.665)
0.029
(1.506)
0.067 ***
(3.562)
20050.282 ***
(2.664)
0.022
(1.374)
0.051 ***
(3.037)
20150.266 ***
(2.413)
0.037 *
(1.70)
0.073 ***
(3.778)
20060.257 **
(2.449)
0.027
(1.512)
0.058 ***
(3.264)
20160.246 **
(2.246)
0.045 *
(1.873)
0.083 ***
(4.13)
20070.253 ***
(2.432)
0.017
(1.258)
0.051***
(3.014)
20170.143 *
(1.422)
0.027
(0.180)
0.062 ***
(3.395)
20080.233 **
(2.264)
0.015
(1.217)
0.048 ***
(2.923)
20180.152 *
(1.502)
0.004
(0.725)
0.038 ***
(2.531)
Note: W01—adjacent weights matrix, WD—geographical distance weight matrix, and WE—economic weight matrix. And, *, **, *** represent significance at 10%, 5%, and 1%, respectively; value in the bracket is Z-test value.
Table 5. Spatial correlation test results.
TestW01WDWE
χ2p Valueχ2p Valueχ2p Value
LM-lag533.4910.000877.7560.000189.8440.000
Robust LM-lag204.1570.000475.1540.00085.4780.000
LM-error330.1740.000407.0190.000104.6590.000
Robust LM-error0.5390.3594.4180.0360.29350.588
Table 6. Regression results of the spatial panel lag model.
VariableW01WE
Model 1Model 2Model 3Model 4
l.lnurban1.022 ***
(25.61)
1.025 ***
(28.80)
0.092 ***
(31.06)
1.164 ***
(33.18)
lnurban0.095 **
(1.96)
0.154 ***
(2.88)
0.092 **
(1.88)
0.163 ***
(3.23)
ρ0.383 ***
(7.30)
0.220 ***
(4.39)
0.276 ***
(5.61)
0.229 ***
(6.78)
control
variable
YESYESYESYES
Adj-R20.9140.9140.9100.910
LogL196.455196.455168.316174.794
Sigma20.020 ***
(5.47)
0.021 ***
(5.35)
0.022 ***
(5.68)
0.022 ***
(5.53)
Sample size600600600600
Notes: **, *** represent significance at 10%, 5%, and 1%, respectively; value in the bracket is Z-test value.
Table 7. Regression results of the spatial panel lag model in different regions.
VariableW01WE
EastCen.WestEastCen.West
l.lneff0.882 ***
(19.62)
1.164 ***
(37.89)
1.331 ***
(30.26)
0.929 ***
(21.83)
1.091 ***
(21.88)
1.519 ***
(39.16)
lnurban0.270 **
(3.93)
1.061 ***
(7.56)
0.308 ***
(4.24)
0.156 **
(2.21)
1.582 **
(13.70)
0.712 ***
6.51
ρ0.195 ***
(3.21)
0.541 ***
(7.34)
0.221 ***
(3.11)
0.172
(1.60)
0.548 ***
(7.38)
0.386 ***
(5.23)
control variableYESYESYESYESYESYES
Adj-R20.9270.5330.8660.9320.6280.565
LogL108.764−123.220−78.310115.217−354.402−1074.11
Sigma20.019 ***
3.39
0.016 ***
3.78
0.024 ***
3.15
0.019 ***
3.40
0.017 ***
4.47
0.028 ***
3.41
sample size220160220220160220
Note: **, *** represent significance at 10%, 5%, and 1%, respectively; value in the bracket is Z-test value.
Table 8. Effect analysis of the dynamic spatial panel lag model.
VariableOverall (China)EastCen.West
Short-term effectDirect0.153 ***
(2.94)
0.269 ***
(3.39)
1.196 ***
(3.57)
0.308 ***
(4.31)
Indirect0.040 ***
(2.33)
0.042 *
(1.91)
0.731 *
(1.69)
0.065 **
(2.01)
Long-term effectDirect−0.943
(−0.13)
3.292
(0.04)
−0.519
(−0.05)
−1.080 ***
(−3.97)
Indirect0.714
(0.10)
−2.822
(−0.986)
−2.530
(−0.27)
0.443 **
(2.31)
Note: *, **, *** represent significance at 10%, 5%, and 1%, respectively; value in the bracket is Z-test value.
Table 9. Regression results of the spatial panel lag model at different dimensions.
VariableW01WE
EastCen.WestEastCen.West
L.lneff1.106 ***
(29.16)
1.116 ***
(28.94)
1.129 ***
(29.07)
1.023 ***
(26.44)
1.283 ***
(33.86)
1.428 ***
(37.72)
lnPurban0.050 *
(1.93)
0.003
(0.14)
lnLurban 0.100 ***
(4.56)
0.139 ***
(6.50)
lnEurban 0.088 ***
3.35
0.119 ***
(6.52)
ρ0.334 ***
(6.51)
0.313 ***
(6.63)
0.322 ***
(6.22)
0.061 *
(1.87)
0.307 ***
(9.33)
0.686 ***
(14.40)
control variableYESYESYESYESYESYES
Sigma20.021 ***
(5.35)
0.021 ***
(5.24)
0.021 ***
(5.29)
0.022 ***
(5.57)
0.022 ***
(5.34)
0.021 ***
(5.51)
R20.90620.9060.9040.9230.8850.775
LogL156.786166.388154.495240.85349.017−210.406
Note: *, *** represent significance at 10%, 5%, and 1%, respectively; value in the bracket is Z-test value.
Publisher’s Note: MDPI stays neutral with regard to jurisdictional claims in published maps and institutional affiliations.

