
A Multivariate Approach to Evaluate Reduced Tillage Systems and Cover Crop Sustainability


Department of Agronomy, Food, Natural Resources, Animals and Environment, University of Padova, Viale dell’Università 16, 35020 Legnaro, Italy
*
Author to whom correspondence should be addressed.
Land 2022, 11(1), 55; https://doi.org/10.3390/land11010055
Submission received: 14 December 2021
/
Revised: 27 December 2021
/
Accepted: 30 December 2021
/
Published: 31 December 2021
(This article belongs to the Special Issue Soil Improving Cropping Systems for Sustainable and Profitable Farming in Europe)
Abstract
:The evaluation of the effects of conservation agriculture during the transition from conventional tillage to no-tillage requires numerous indicators to be considered. For this purpose, we monitored changes in a multi-parameter dataset during a three-year experiment that combined three tillage intensities (conventional tillage—CT; minimum tillage—MT; and no tillage—NT) with three soil covering managements (tillage radish cover crop, winter wheat cover crop and bare soil). Using a multivariate analysis, we developed a Relative Sustainability Index (RSI) based on 11 physical (e.g., bulk density and penetration resistance), chemical (e.g., soil organic carbon and pH) and biological soil properties (e.g., earthworm density) to evaluate cropping systems sustainability. The RSI was most affected by tillage intensity showing higher RSI values (i.e., better performances) in reduced tillage systems. Specifically, the RSI under NT was 42% greater than that of CT and 13% greater than that of MT. Soil covering had little impact on the RSI. Among the tested parameters, the RSI was increased most by saturated hydraulic conductivity (+193%) and earthworm density (+339%) across CT and NT treatments. Our results suggest that conservation agriculture and, particularly, reduced tillage systems, have the potential to increase farm environmental and agronomic sustainability.
1. Introduction
Conservation agriculture (CA) is defined as the combination of three principles: minimum soil disturbance, permanent soil organic cover and species diversification [1]. In addition to reduced management costs, CA is considered to enhance several ecosystem services (soil physical and chemical properties, soil organic carbon (SOC) and biodiversity) [2,3] and prevent some soil threats, such as soil erosion [4,5,6]. Although some of these benefits remain less clear, the worldwide adoption of CA grew to 12.5% of 2016 global cropland. At odds with this growth trend, there is Europe, where only 5% of total cropland is managed with CA. One country that has shown particularly limited adoption is Italy—less than 300,000 ha (a mere 2% of agricultural land) [7].
Adoption of CA has suffered slow adoption in Europe primarily due to the long transition time that follows conversion from conventional agriculture to CA before the positive effects are realized. During this crucial period, farmers face reduced crop yield and new equipment expenditures. Conversion to CA also requires a permanent soil covering, yet another cost that would benefit from economic support [8]. A key reason behind the very limited use of CA in Italian agrosystems is the long conversion time (more than five years) required before SOC, fertility and nutrient use efficiency benefits are observed [9,10]. Most studies have considered transition time only as a function of a single parameter, such as soil physical properties [11,12], yield [13,14,15,16], net SOC stock [17,18], soil aggregate stability, biodiversity, SOC content [19,20], earthworm density, or CO2 emission reduction [21]. However, each of these exerts an effect on CA. As such, we suggest that a holistic approach capable of considering multiple parameters may provide a better means by which to evaluate the effects of CA.
The ecosystem services delivered by CA justify the need for environmentally conscious policymakers to consider economic support of the practice through a program such as the “green payments” program already established in the EU Common Agricultural Policy [22]. Alternatively, yield losses and/or other negative effects could be limited or compensated in some fashion. In either case, programs such as these are effective only when the protocol created is adaptable to local area specifics but is assessable by a single, consistent set of criteria. As is often described in the literature, an index represents one way to determine and compare the impact of different management strategies [23,24]. Similarly, the literature has already identified potential soil quality indicators to comprise an index: physical soil property measures (soil hydraulics, penetration resistance and bulk density) [25,26] plus soil aggregate stability [27], soil C and N content and earthworm density [28]. Masto et al. [29] previously adopted a statistical methodology to determine the impact of different management strategies on soil quality and sustainability using a dataset with several soil characteristics, as reported above. The method involved the application of a principal component analysis (PCA) to derive the weight of the different soil parameters in promoting the sustainability. The derived index showed to be a reliable tool to assess the performance and impacts of alternative land uses and soil management options [23].
In this work, three tillage systems (no tillage, minimum tillage and conventional tillage) were combined with three different soil coverings (tillage radish cover crop, winter wheat cover crop and bare soil) to compare the effects of the main factors influencing CA. A multivariate approach was applied to a dataset of soil quality measures taken during a north Italy field experiment. A sustainability index was calculated to compare different treatment combinations as a function of the selected indicator variability. This study aims to determine the short-term effects of reduced tillage and cover crops on the studied parameters. Our starting hypothesis was that a reduced tillage system combined with tillage radish could minimize conversion time side effects and improve soil properties.
2. Materials and Methods
2.1. Experimental Design
The experiment took place at the Lucio Toniolo Experimental Farm, located in Legnaro, PD (NE Italy, 45°21 N; 11°58 E; 6 m a.s.l.). The climate is sub-humid with average temperatures between −1.5 °C in January and 27.2 °C in July. Rainfalls reaches 850 mm annually. The reference evapotranspiration of 945 mm exceeds rainfalls from April to September. The highest rainfalls occur in June (100 m) and October (90 mm), while winter is the driest season, with average rainfalls of 55 mm. The shallow water table ranges in depth from 0.5 to 2 m, with the lowest values recorded in summer.
This three-year study began in spring 2018 and it was designed as a split plot, with two replicates located in a flat area of the Po valley with a maximum slope < 1%. An area of 2 ha was divided into 18 plots, each of 1111 m2. The soil at the site was Fluvi-Calcaric Cambisol [30] with a silt loam texture (25% clay, 50% silt and 25% sand), pH 7.8, 27.1% total carbonate content, <1% soil organic carbon and <0.1% total nitrogen. The main factor was tillage intensity; conventional tillage (CT) was ploughed to a depth of 30 cm and then harrowed to 15 cm; minimum tillage (MT) was tilled with a harrow to a depth of 15 cm; no tillage (NT) was sod seeded with a zero-tillage seeder that included double disks for furrow openers and press wheels for soil firming. Within each main plot, three winter soil coverings were randomized: tillage radish (TR—Raphanus sativus L.), winter wheat (WW—Triticum aestivum L.) and bare soil (BS), where only residues from the previous year crop were present. Cover crops were seeded on residues from the main crop (always maize, Zea mays L.) in autumn 2018 and 2019.
2.2. Field Surveys
According to what already reported by other authors [25,26,27,28], we chose 11 parameters to monitor changes in the condition of the soil: (1) aggregate stability (Agg), (2) bulk density (BD), (3) soil organic carbon (C org), (4) total nitrogen (N tot), (5) gravimetric water content (GWC), (6) penetration resistance (PR), (7) saturated hydraulic conductivity (Ks), (8) earthworm density (EW), (9) mineral nitrogen (N min), (10) pH and (11) cash crop yield (Y) (Table 1). Each parameter was measured at two times. The first measurement was taken immediately after treatment combination adoption (T0) and the second measurement was taken at the end of the three-year period (T1). The method for determination of the measure of each parameter is fully described below.
A continuous value of Agg was determined. The Slakes application [27,31] was employed to soil aggregates in the 0.2–2 cm fraction sampled from the 0–20 cm soil layer. Three randomly selected aggregates from each sample were analyzed to produce a dimensionless slaking index (SI) with a value ≥ 0. A low SI (<3) represents high aggregate stability, an SI between 3 and 7 indicates moderate stability and an SI above 7 indicates that the aggregates have low stability. The SI was calculated as the difference between the wet aggregate area (At) after 10 min of water saturation and the dry aggregate area (At0), divided by At0, as shown in Equation (1).
The BD was measured in the 0–30 cm soil profile with the core method as described in Grossman and Reinsch [32]. In the studied soil, a BD value of 1.55 g cm−3 was considered a limiting condition to the growth of plant roots [33].
The C org and N tot contents were determined from shallow layer (0–30 cm) samples. The soil was air-dried and sieved at 0.5 mm and the inorganic carbon was removed with an acid pre-treatment. Subsequently, SOC and N tot were determined with flash combustion using a CNS Elemental analyzer (Vario Max; Analysensysteme GmbH, Langenselbold, Germany).
Four sampling areas were selected in each plot for GWC and PR measurements. For the PR, the measures were taken from the 0–20 cm layer and an average PR value was calculated. In each sampling area, a disturbed soil core was collected, weighted and oven-dried at 105 °C to determine the GWC. For the PR, the measures were taken in each plot with the Penetrologger (Eijkelkamp, Giesbeek, The Netherland). A PR value above 2.5 MPa was considered a limiting factor to plant root growth [34].
The Ks [35] was determined using the double-ring infiltrometer method [36]. An inner ring of 60 cm in diameter was used to measure both the row and inter-row areas in the tillage radish plots. The water within the inner ring was maintained at two levels. As one operator measured the time for the water to reach the lower level from the upper level, another added more water to reach the upper level again. This operation was replicated until the infiltration rate was constant. Meanwhile, the water in the external ring was suspended at an average value between the two levels of the inner ring. Then, the data were analyzed by fitting Philip’s equations [37] with the Solver Add-in for Microsoft Excel.
where i(t) is the water infiltration (m) and v(t) is the infiltration rate (m s−1) expressed as a function of time. Parameters S and A were calculated with the Solver add-in by minimizing the square difference between predicted and observed i(t) and v(t). The Ks was calculated as below and m is a constant equal to 2/3.
The EW was measured with a mustard extraction as described by Valckx et al. [38]. The measure was performed by taking an earthworm extraction from the soil surface using a water-suspended mustard in a 25 × 25 cm2 frame [38]. First, we used the number of extracted earthworms to score soil quality [39]. A density of <4 was the lowest score or of “poor” soil condition, a density of 4–8 was “moderate” soil condition and the highest density (>8) was “good” soil condition. Then, the earthworm count was compared amongst the different treatment combinations.
We estimated N min based on samples of the 0–20 cm soil layer. Concentrations of ammonium, nitrite and nitrate were measured using a KCl extraction followed by photometry, as described by García-Robledo et al. [40].
Soil pH was determined from air dried, mixed and sieved (0.5 mm) samples taken from the 0–20 cm soil layer. The pH was measured in a 1 M KCl solution (1:2.5 solid–liquid ratio) [41].
At the end of the cropping season, four biomass samples were collected from each subplot to determine maize grain Y at 27% grain moisture. After the harvest, a grain sample was oven dried at 105 °C until it maintained a constant weight to determine the dry mass weight. The Y was expressed in kilogram of dry grain per hectare.
2.3. Data Analyses and Statistics
First, a mixed-effects model was constructed using tillage, covering and their interactions in each monitored year. These effects were treated as fixed effects and the block effects as random. Post hoc pairwise comparisons of least-squares means were performed, using Tukey’s method to adjust for multiple comparisons, with a p < 0.05.
To calculate a soil quality index, we relied on the method of Masto et al. [23,29]. The procedure requires that indicators be selected once they have been surveyed and normalized with linear or non-linear scoring functions, so that higher scores represent better-performing observations. The indicators and their weights were determined using the multivariate analysis method of Andrews et al. [42,43], which has been adapted and applied to many studies evaluating long-term practices [23,29], combinations of various crop rotations under different residue managements [44,45] and different tillage practices [46].
The sampled data were normalized with a linear scoring function [23] by applying Equations (5)–(7).
where xi max is the maximum value measured during the i parameter survey and xi min is the smallest. The S value ranges between 0 and 1, which corresponds to the minimum and maximum values, respectively, observed in the i parameter. Equation (5) was used as a “more is better” scoring function for C org, GWC, Ks, EW, N min, N tot and Y. Alternatively, the parameters Agg, BD and PR were scored with Equation (6), according to a “less is better” approach. Finally, Equation (7) was used for pH scoring. In this way, treatment combinations that most favorably impacted the parameters scored highest.
The Relative Sustainability Index (RSI) was calculated as the sum of the observed parameter score, weighted with principal component analysis weighting factors (PWs). These factors were calculated according to Masto et al. [23], by selecting principal components (PCs) explaining at least 10% of the variability. Within each of these PCs, loaded factors (values > |0.2|) were selected and their correlations were measured [43]. In cases in which r > |0.8|, only the factor with the highest load was used for RSI calculation, together with all the other uncorrelated highly loaded factors. The percentage of variation explained by each PC provided the PW. The RSI was calculated with Equation (8).
To normalize the RSI, this was divided by the highest RSI value obtained. A total of 36 RSIs were calculated, one per treatment combination replication in survey T0 and another in T1.
RSI differences amongst tillage, soil covering and their interaction were tested with mixed models and the model with the smallest Akaike’s Information Criterion (AIC) was selected [47]. Post hoc pairwise comparisons of least-squares means were performed using Tukey’s method to adjust for multiple comparisons, with a p < 0.05. The statistical analyses were performed using Microsoft Excel 2016, ClustVis [48] and SAS (SAS Institute Inc., Cary, NC, USA), version 5.1.
3. Results
Below is a description of the mixed model results comparing changes in the 11 indicators of soil quality under the tested treatments over time (Table 2). Table 3 reports the average 2019 and 2020 values used to calculate RSIs.
All values of Agg, GWC and pH were significantly higher at T0 than at T1. Overall, average Agg was higher at T0 (4.50) than at T1 (3.19) and was characterized as of high-to-moderate stability, according to the SI range (0.3–6.1). At T0, all aggregate samples, except one, were of moderate stability (>3). The exception sample value, collected from treatment combination MT–BS, was 2.9. During the T1 survey, 44% of the observations were <3 (high aggregate stability) and the lowest values found in the reduced tillage systems (NT and MT). The measures of the GWC were strictly related to the pedoclimatic conditions on the sampling dates, with the GWC ranging from 20% to 25% in 2019 and from 12% to 22% in 2020. Cover crop treatments showed significant effects on GWC, as demonstrated by values of 18.3% in TR and 20.3% in WW, while BS had an intermediate value. Despite the significantly lower pH values at T0 versus T1, the pH values maintained non-critical averages (7.36 in T0 and 7.05 in T1).
Between survey T0 and T1, the N tot, PR and Ks all increased significantly. The N tot rose from 0.88‰ at T0 to 1.01‰ at T1. During each survey, the N tot maintained a modest variability, as indicated by the coefficients of variation at T0 (0.26) and T1 (0.13). The PR test values differed from an average of 0.70 MPa in T0 to an average of 1.34 MPa in T1. In the second survey, the PR was not only significantly higher, but also more variable than it was in T0; all of the PR observations across both surveys registered below the 2.5 MPa threshold. The PR differences occurred among the differing tillage systems. Specifically, CT reported a PR of 0.88 MPa, which proved to be significantly higher than the 1.18 MPa observed under NT. The PR result under MT was intermediate. Last, the Ks increased by 158% between T0 (3.4 × 10⁻⁵ m s−1) and T1 (8.7 × 10⁻⁵ m s−1). This parameter showed it was also significantly impacted by different tillage intensities, as shown by the average Ks values of 1.05 × 10⁻⁴ m s−1 in NT, 3.58 × 10⁻⁵ m s−1 in CT and an intermediate value in MT.
The parameters BD and EW were affected by the time × tillage interaction. Despite a generally limited effect on the BD across the various treatments, the average BD under CT was lower during the first survey (1.39 g cm−3) versus the second survey (1.45 g cm−3). All measures of BD were less than its 1.55 g cm−3 threshold. In the case of EW, variability was higher; it ranged between 0 and 20 (Table 3). Among the treatments, during T1, the EW differences were, on average, significantly higher (13.17) under NT than under CT (3.00).
The C org, Y and N min parameters resulted as unaffected by all factors tested. On average, the C org was 0.83% and displayed only a modest variability within and between the surveys. Similarly, Y (10.00 Mg ha−1, on average) and N min (24.54 mg kg−1, on average) showed no significance among the treatment combinations in the different surveys.
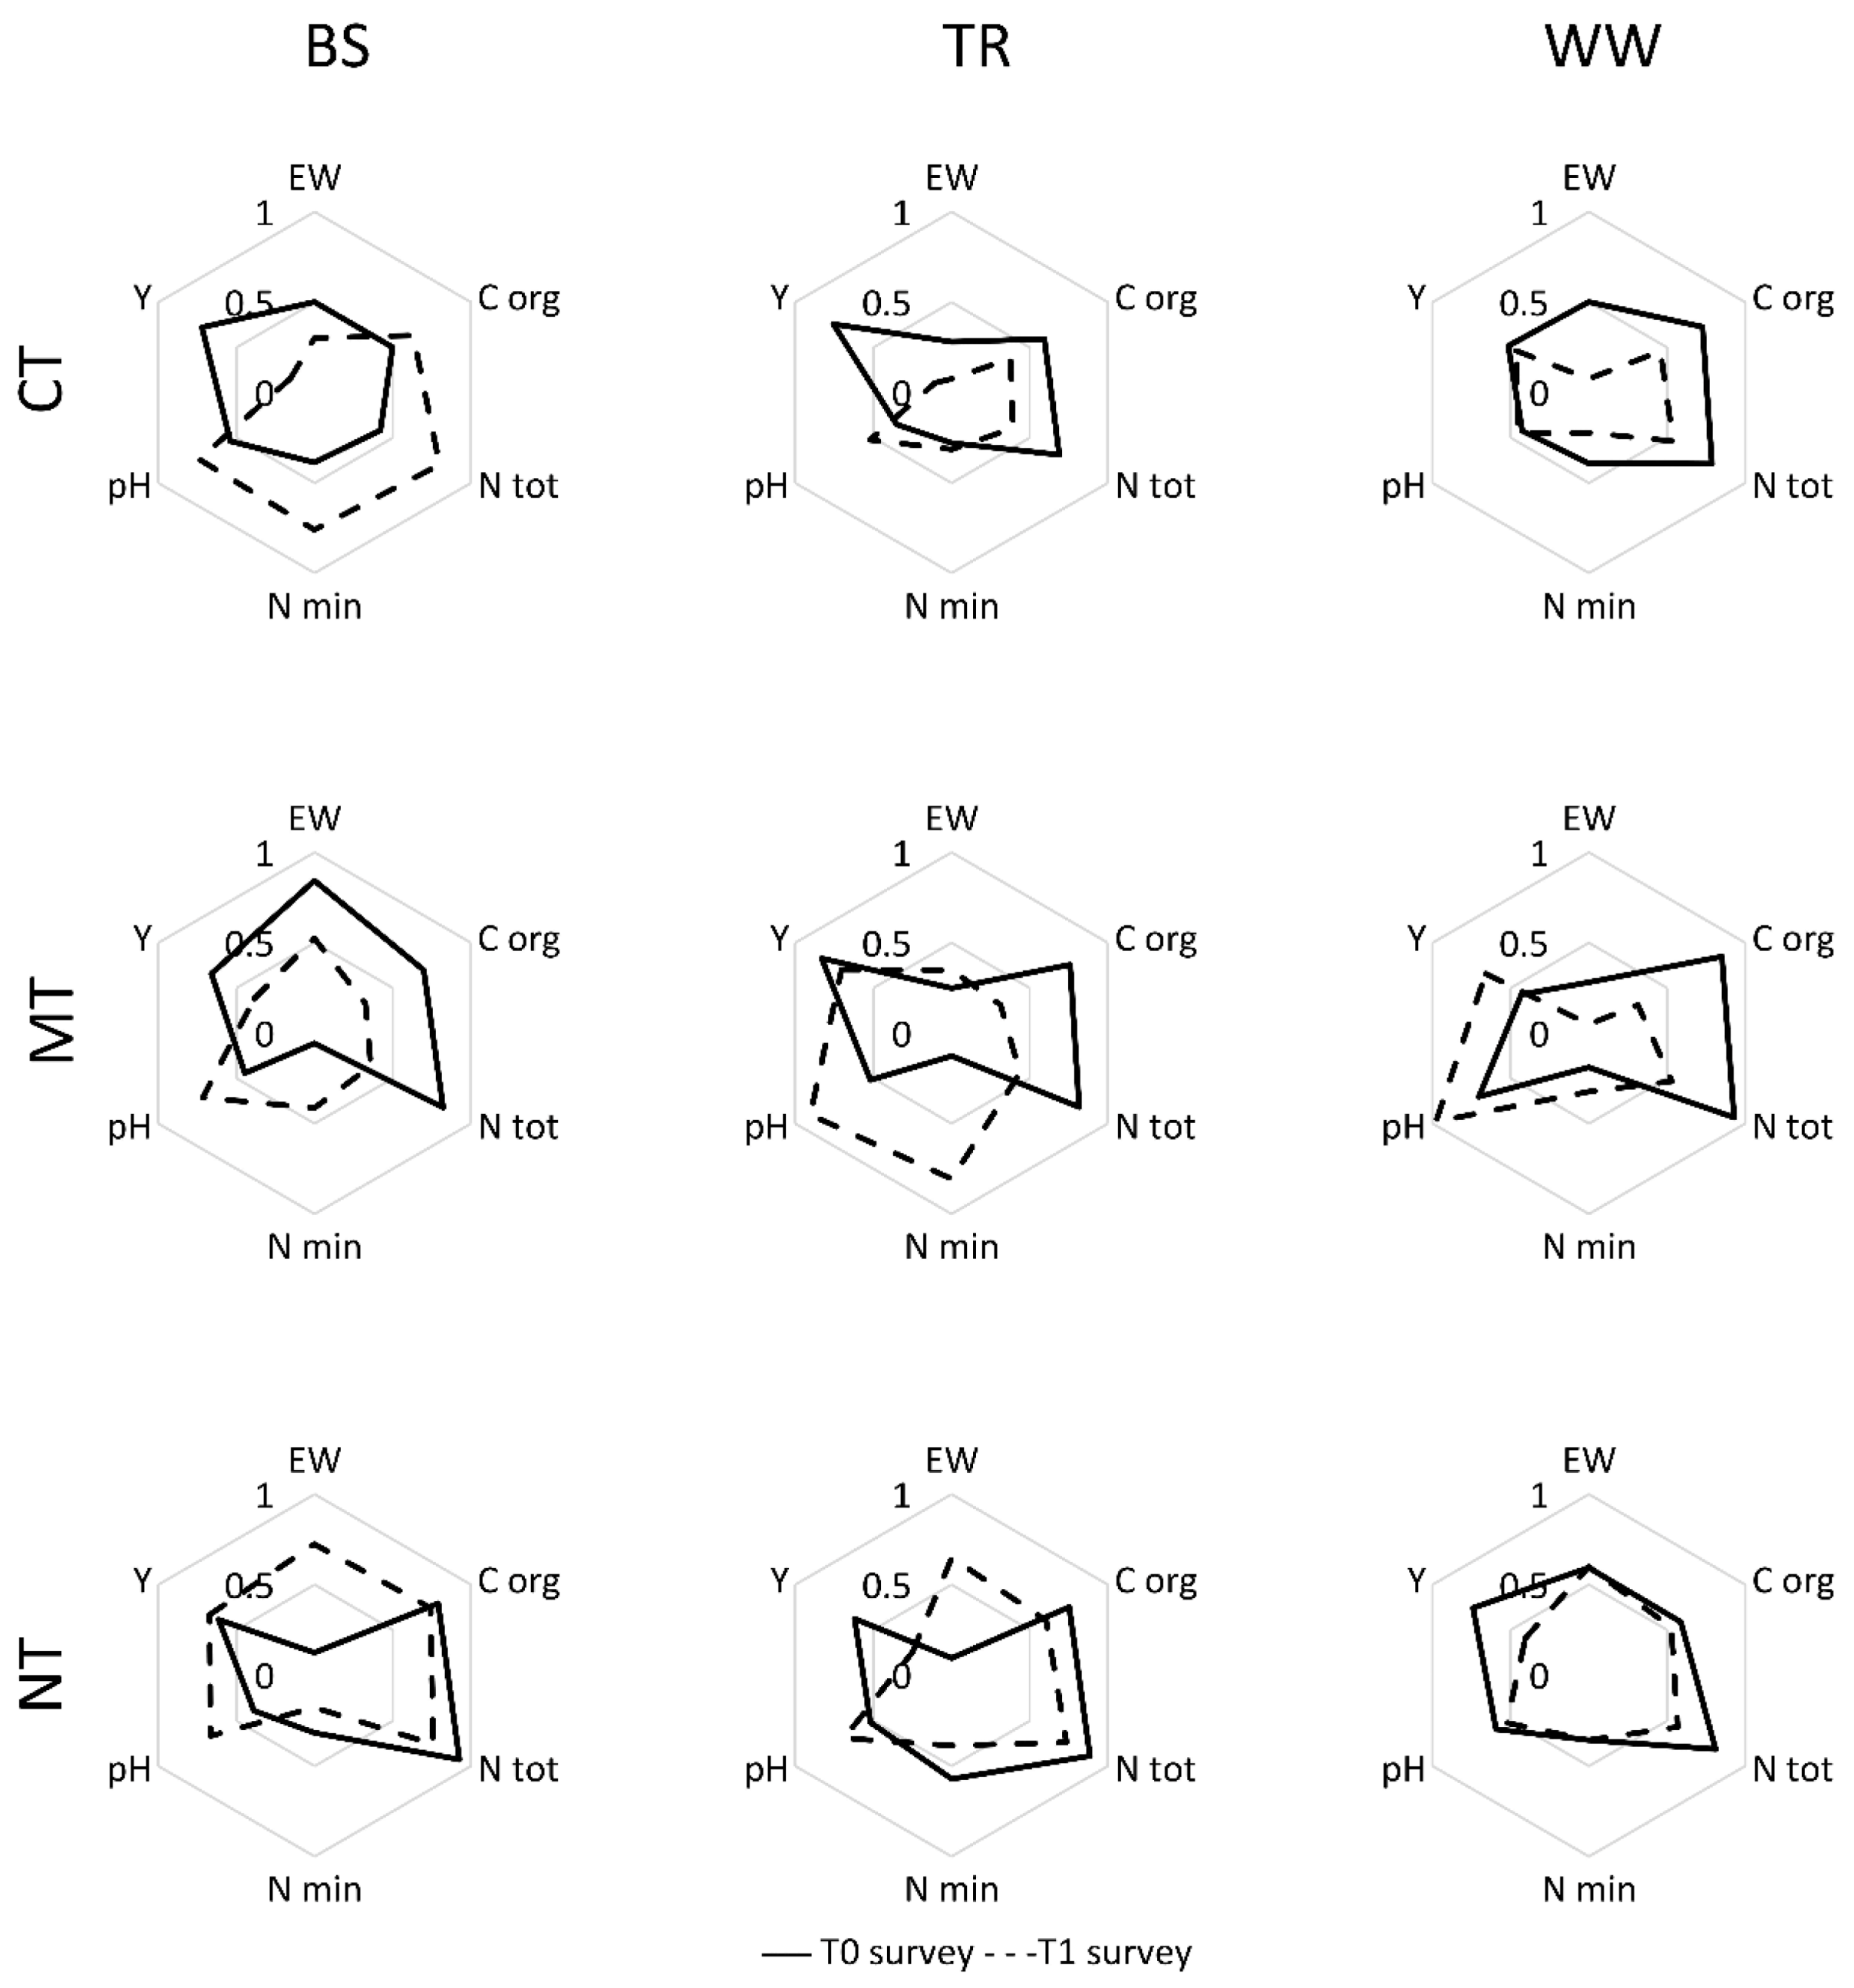
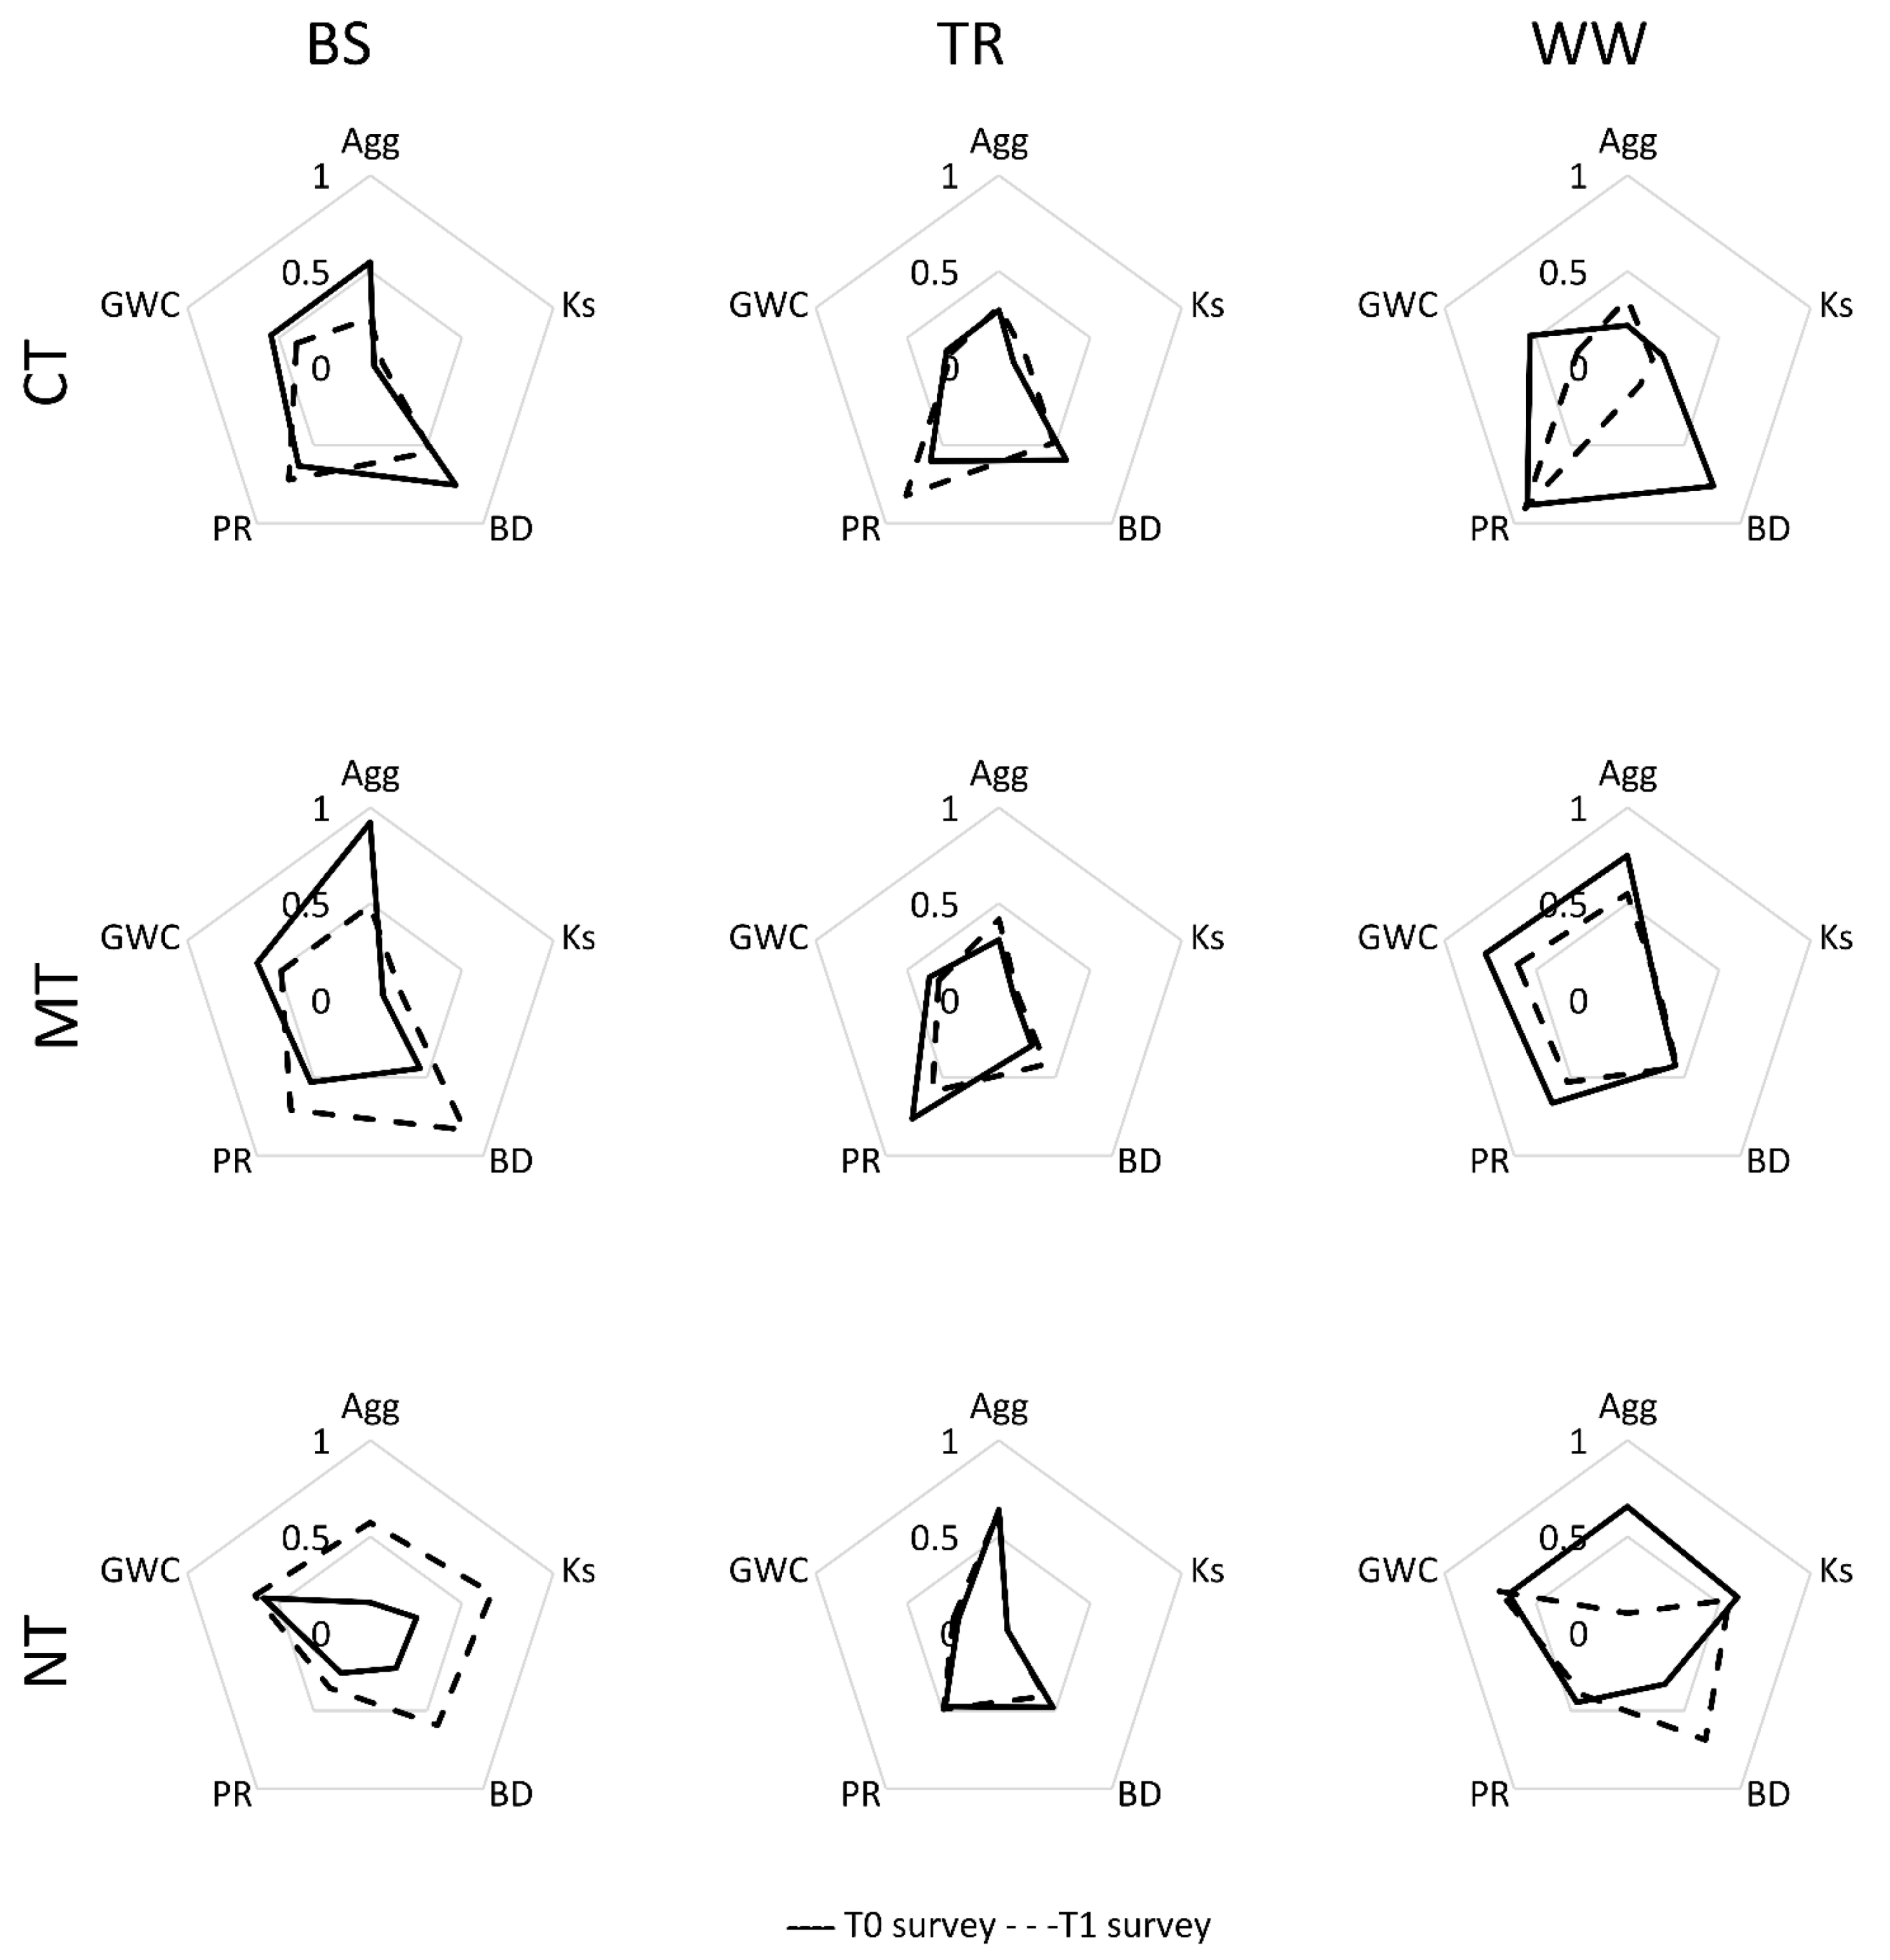
The values presented in Table 3 were normalized. The average of each treatment combination is presented in Figure 1 (biochemical parameters) and Figure 2 (physical parameters). Normalization allows higher values to be associated with parameter improvement and wider areas to represent an overall sustainability increment.
Figure 1 and Figure 2 show sizeable differences between the treatment combinations and two years. The correlation matrix between each parameter pair is shown in Table 4. As expected, the highest correlation resulted between the C org and N tot (r = 0.924). To identify which of these highly-correlated parameters could best explain treatment variation—and warrant inclusion in the RSI—we performed a principal component analysis (PCA).
Table 5 presents the PCA results. Each parameter was weighted according to the treatment variation it explained based on the PC selected.
The parameters selected in PC-1 were N tot, GWC, Ks and EW. It showed that the N tot should be included in the RSI because it had the highest weight and it was highly correlated to the C org. In PC-2, the highly weighted parameters BD, PR and Y were all included in the RSI as they showed limited correlation amongst them. In PC-3, the Agg and N min were selected and, in PC-4, the pH was chosen. The PW of each parameter equals the variability explained by the PC selected for that specific factor (0.241 for PC-1, 0.149 for PC-2, 0.135 for PC-3 and 0.117 for PC-4). To normalize the RSI, the sum of the weighted parameters was divided by the highest sum of the weighted parameters reported across all observations (1.247). The value was reported under NT–WW (block 1) during the survey T0. The lowest value (0.358) was under CT–TR (block 2) in T1. Then, the resulting RSI was expressed by Equation (9).
Then, mixed models were calculated on RSI values, considering the combination of tillage and CC effects. The smallest AIC for the RSI linear mixed model was obtained when intercept, tillage and covering were tested as fixed factors and block was a random factor. Table 6 summarizes the p-values for the selected mixed model.
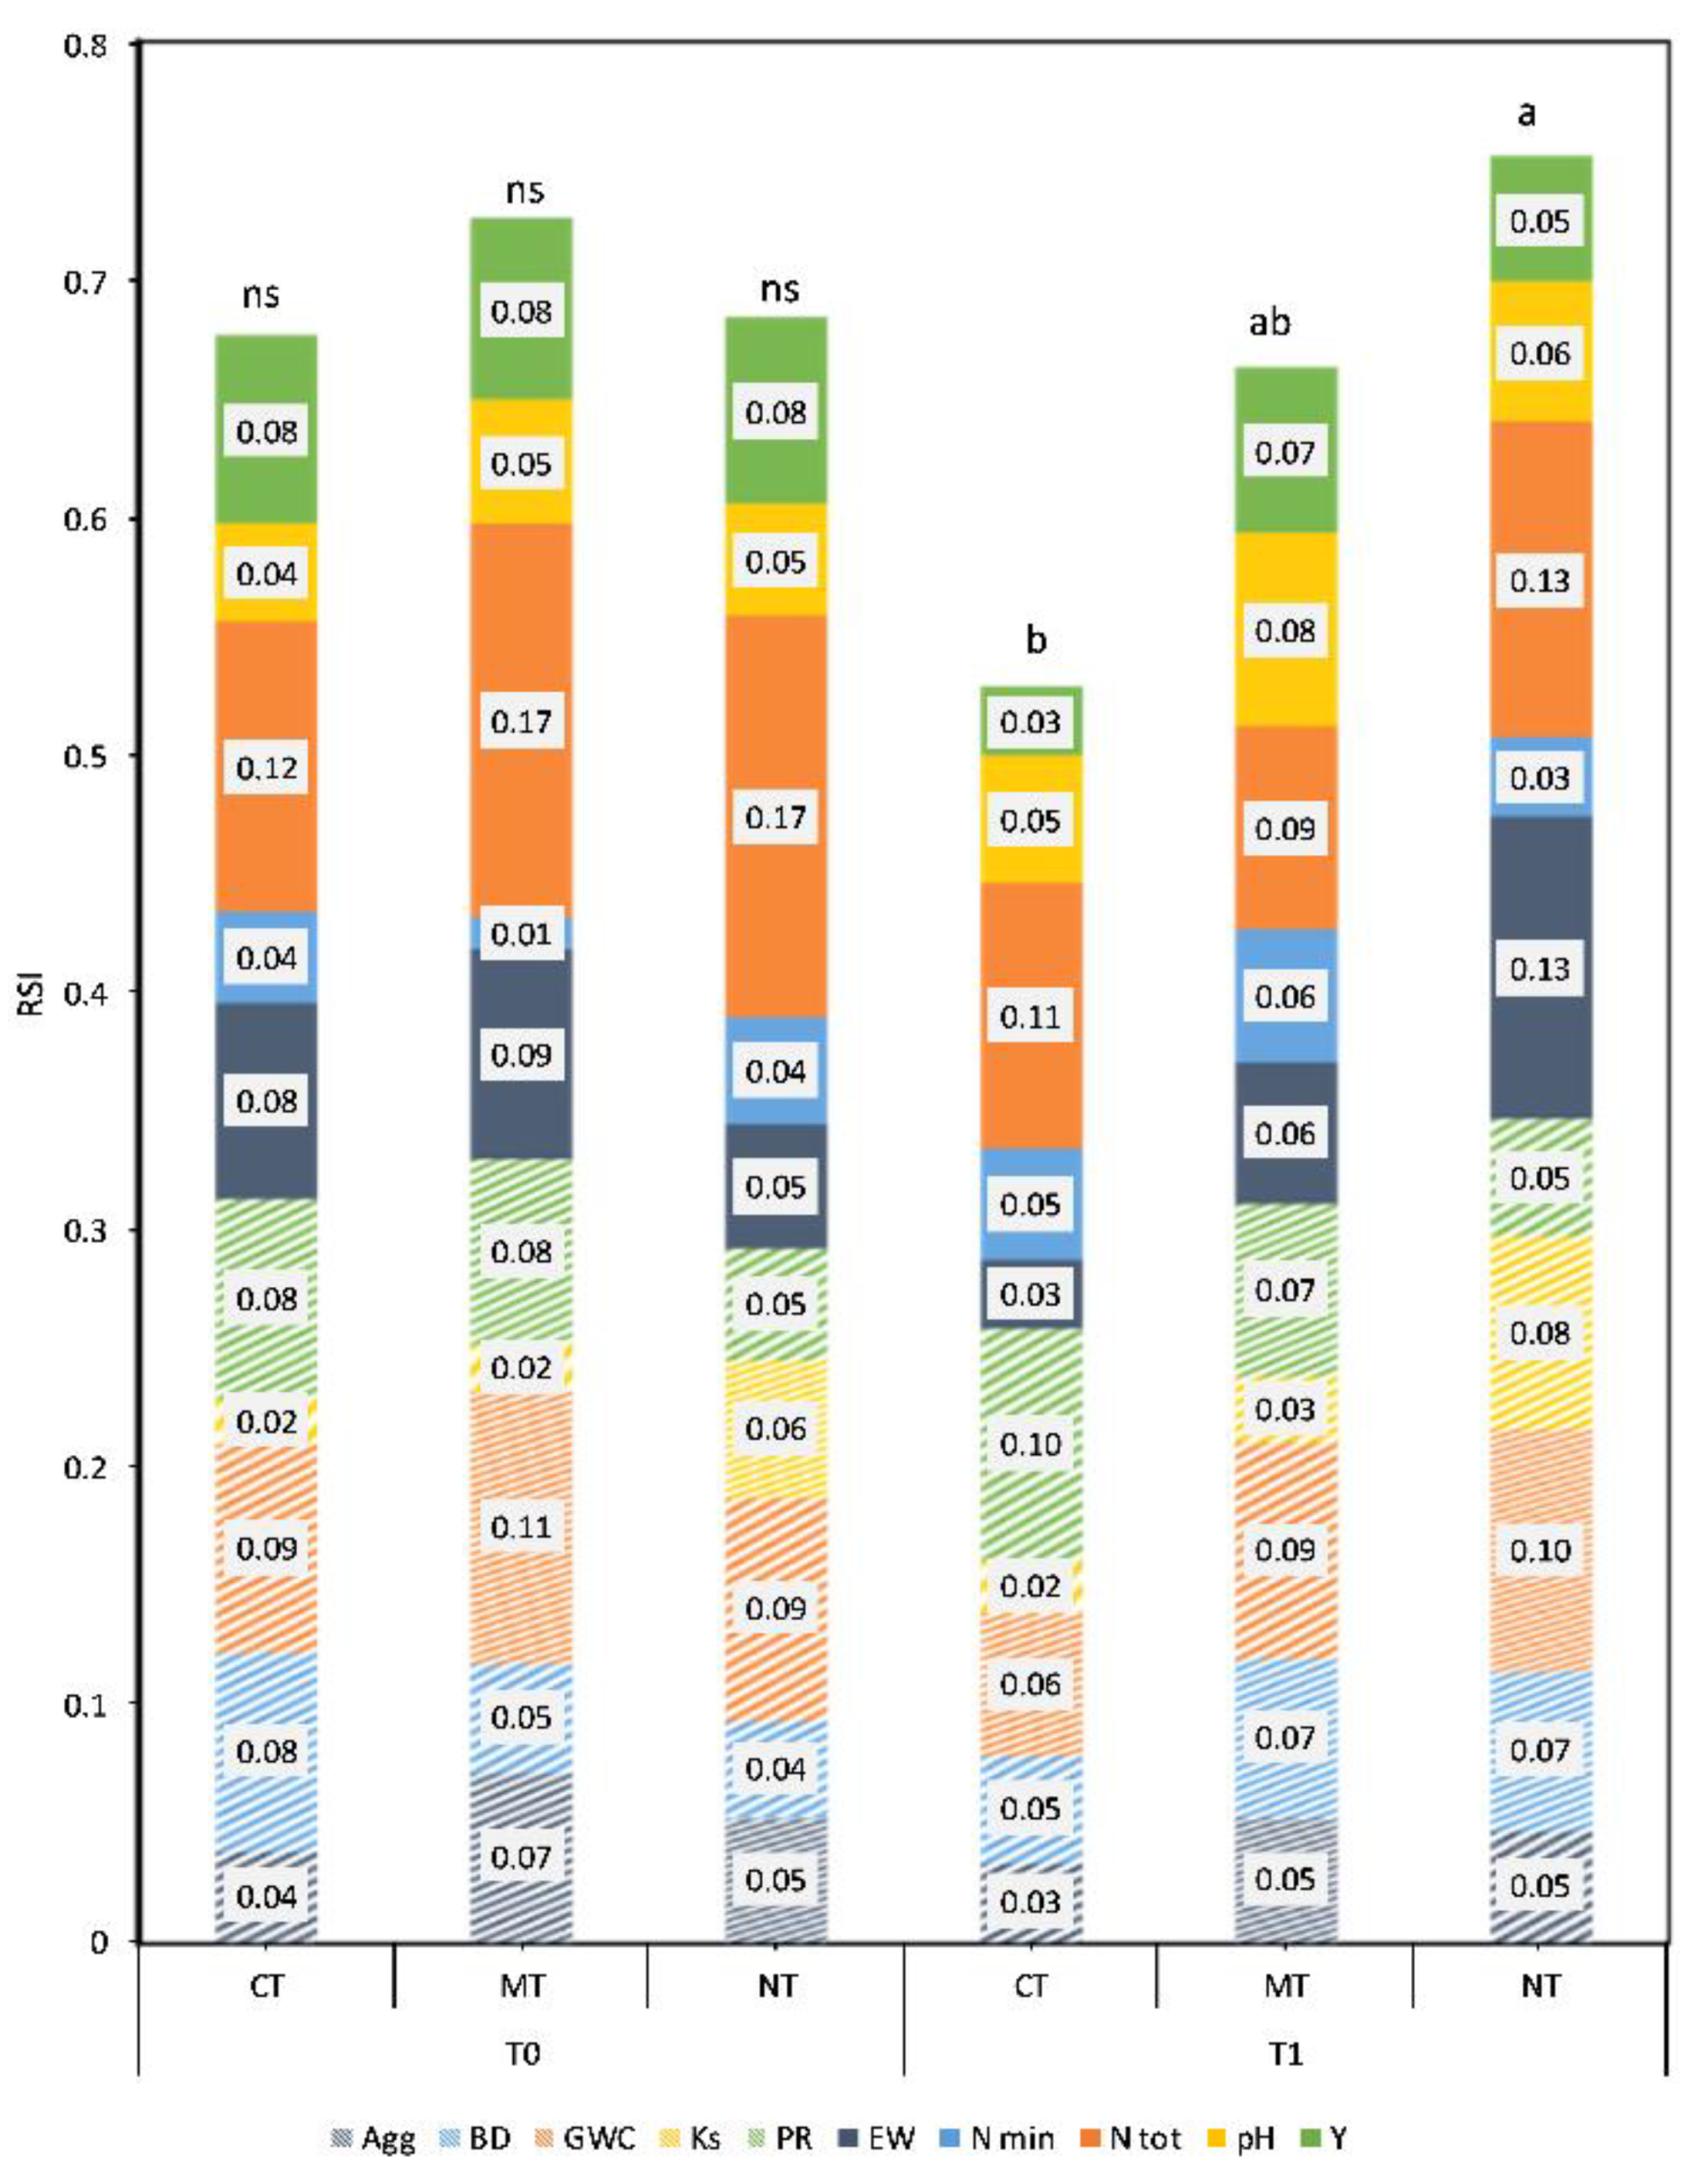
Figure 3 displays the average RSIs and corresponding contribution from each parameter to it under each treatment. On average, the GWC (0.09) and N tot (0.13) impacted the RSI the most. During T1, their highest scores were in NT (GWC = 0.10 and N tot = 0.13.) Observations of the Ks and EW were notable in that they contributed little to the RSI, yet they were high variable across treatments. During T1, the Ks averaged 0.08 under NT, which was three-fold the value observed under MT (0.03) or CT (0.02). Similarly, the EW averaged 0.13 in NT, which was double that in MT (0.06) and four-fold the value observed in CT (0.03).
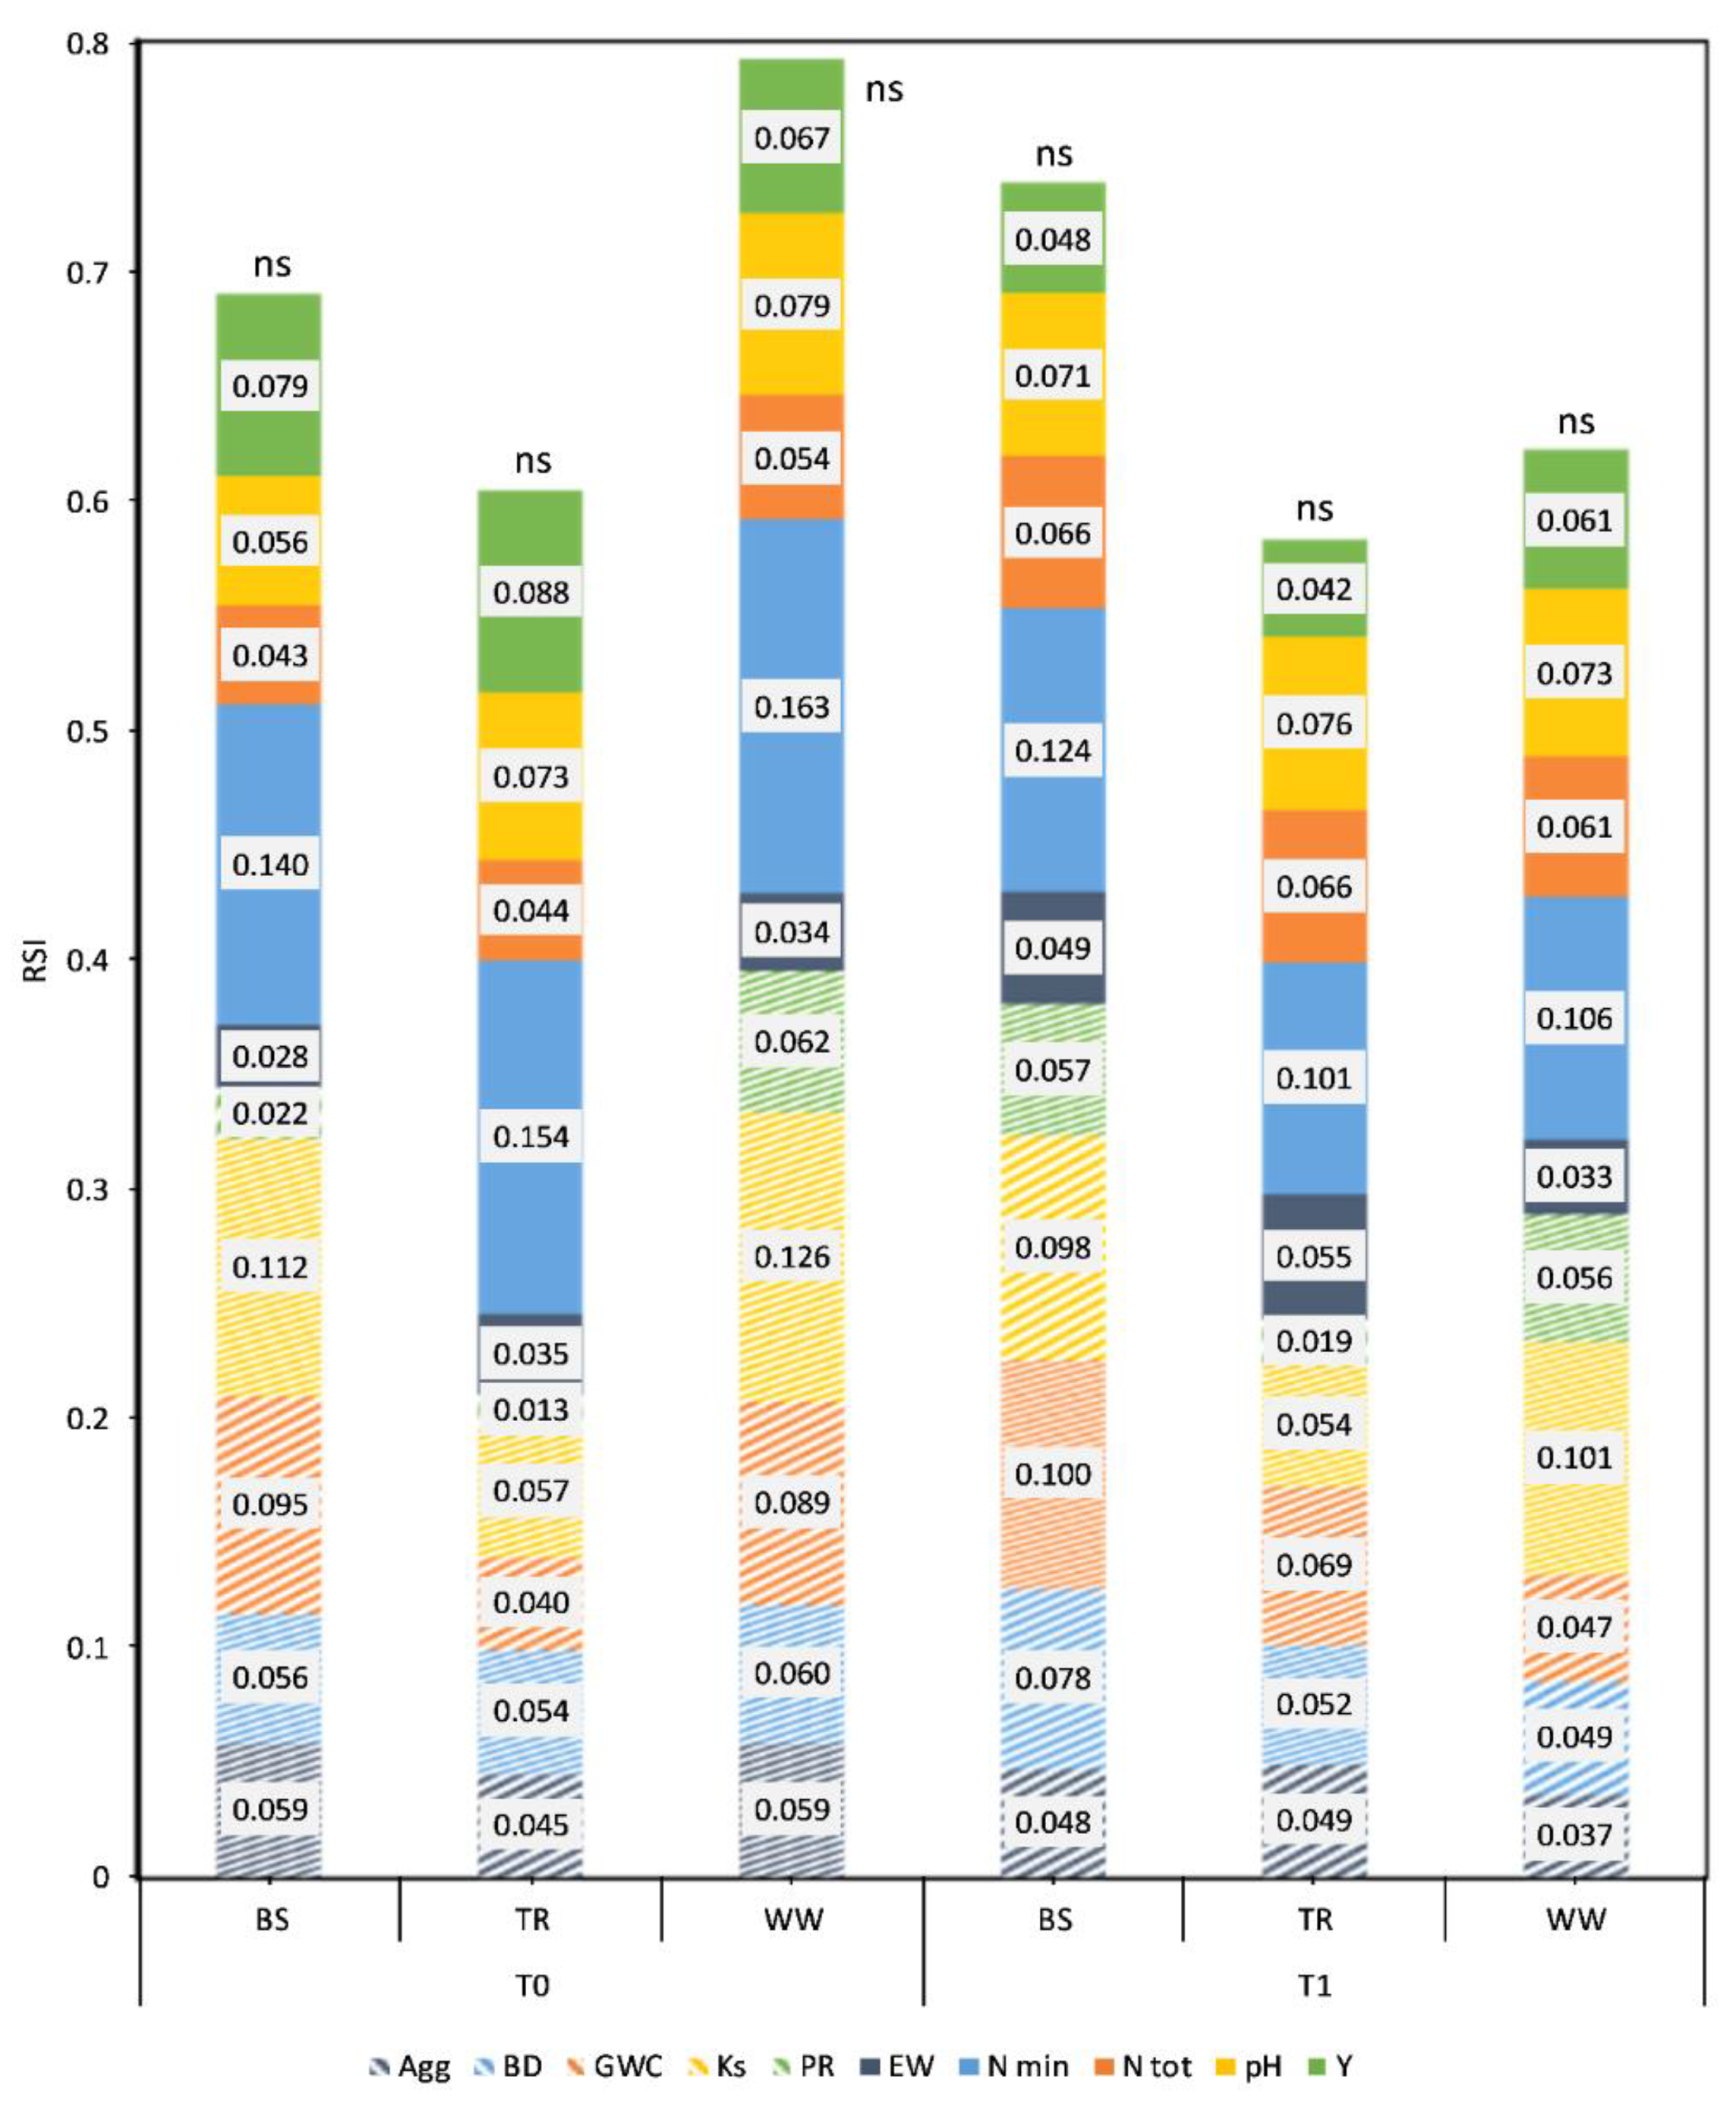
No clear effect was observed for the soil covering treatment in either year and no statistical difference was found. During both years under TR, the minimum RSI was always reached (0.604 in 2019 and 0.583 in 2020). Higher values were recorded for coverings WW in 2019 and BS in 2020 (Figure 4).
4. Discussion
In total, 8 of the 11 parameters revealed significant differences between T0 and T1, which suggests that the soil system was changing regardless of the agronomic management applied. One potential cause of these results may be attributed to differences in the environmental conditions at T0 and T1. The GWC was found to be affected by CC. For those who have considered the effects of CC on water cycle, the results have been contradictory. Some have found CC to improve water balance and water availability [49], while others have reported soil water reduction in the subsequent crop after CC termination [50]. Our results, where under WW, the GWC was high and, under TR, the GWC was at its lowest, are also mixed. In both instances, the results can be equally attributed to either better maintenance of soil water content by WW, or higher soil evaporation under TR, due to a lesser soil covering.
The different tillage systems seemed to have a stronger impact, especially on some parameters (BD, PR, Ks and EW), if compared to the CC effect. For example, under CT, the BD and PR values aligned with previous evidence that reduced tillage systems can increase soil strength and bulk density, especially in the first years [51]. The reduced BD and PR values were expected tillage effects under CT, given that that they were measured in the 0–20 cm soil layer. This result may also relate to instrument resolution; the PR can be negatively impacted by the high spatial variability in reduced tillage systems [52]. However, in this instance, the BD almost always remained below its threshold (1.55 g cm−3) for which it is known to limit plant root growth in silty loam soils [33]. Similarly, the PR values (0.46–1.96 MPa) fell well below the growth-limiting threshold usually set at 2.5 MPa [34]. Finally, the soil at the experimental site was characterized as having structural inertia in response to management changes [53,54,55].
Although the BD and PR values worsened slightly (i.e., soil strength increased) under reduced tillage systems, soil function was improved in NT, as evidenced by an increase of 193% in the Ks under NT relative to CT during T1. The highest EW value observed in this study may relate to the significant contributions made by earthworm bio-macropores to soil function and, in particular, air and water permeability, even in compacted soils. Earthworms can improve soil structure [56] and hydraulic properties [57] by burrowing and casting. The positive effects of NT on the EW confirm previous studies evidence [9,21,28].
The computation of the RSI highlighted the strong effect of the EW as it carried a high relative weight (11%, on average) within the index. It also showed a high variability among the different treatments. Additional parameters that averaged high impact on the RSI were the N tot (17%), GWC, (14%) and PR (11%), which, together, accounted for more than 50% of the RSI. In addition to the EW, RSI variability was driven by the Ks, N min and Y. In absolute terms, the Ks, N min and Y each had impacts of less than 10% on the RSI, but their variation coefficients ranged the highest (from 0.67 for the Ks to 0.31 for the Y). These two conditions suggest that this set of measures should be considered as the best to indicate soil quality changes during the conversion from conventional tillage to CA. The RSI results also suggest that the Ks and EW are two sustainability indicators that were positively affected by NT.
The final RSI score evaluates the combination of tillage intensity and soil covering with an holistic approach [58]. It showed the positive effect of NT relative to conventional tillage, even in the short term. Midway between the effects of CT and NT lay the MT system. It mitigated the negative effects on some physical parameters but lessened the improvements of biological parameters (EW). According to Issaka et al. [59], both the minimum and no-tillage systems resulted as sustainable techniques, considering the nutrient cycles. As opposed to other studies [9,10,54], clear negative effects during the transition time were not detected during this three-year experiment.
The limited differences reported for the various soil coverings may be evidence that a CC effect was masked by the strong effects of reduced tillage systems combined with the sampling methods used. It may be that longer conversion times or different sampling methods are required for CC effects to be revealed [60]. Even in the case of BS, a partial and spontaneous covering (weeds) may impact soil properties in a way not unlike that expected with CCs. Indeed, “spontaneous CCs” have provided ecosystem services [61,62,63,64,65]. In the presence of plant residues, microbial diversity [66] could improve to the point where it should even be considered an environmental sustainability indicator [67].
From another perspective, the modest TR effect could relate to sample timing. Most TR-related benefits (improved porosity and pore connectivity) occur only when taproots are degraded. At the same time, reports of short-term tillage radish benefits exist [68,69], although it seems that longer timespans are necessary to exploit the benefits of TR on soil properties [10]. The bio-tillage effect, which was expected from TR, as suggested by Zhang et al. [70], could be masked by earthworm activity in NT treatments, irrespectively from the presence of TR. The high EW values observed under NT could have performed this bio-tillage effect, which, according to the authors, could replace conventional tillage.
Then, even if the WW fibrous root apparatus had a limited impact on soil structure, many Poaceae CC improved overall system sustainability [71,72] and aggregate stability [49,65,73], or nutrient cycles [74,75,76]. The combination of grass CC and reduced tillage systems proved to positively affect environmental sustainability, fostering biodiversity [77] and soil organic carbon [78].
In conclusion, to correctly evaluate the CA effect, especially on the soil system, a holistic approach should be preferred to consider both the effects on crop production and on soil physics, considering different soil function at different scales.
5. Conclusions
A multivariate analysis of selected sustainability indicators revealed a positive effect of reduced tillage systems management and in particular NT, despite the limited variation in the observed parameters.
Despite the short-term nature of the experiment, this positive result could be the effect of an increase in soil fauna activity, which could have contributed to soil structure improvement. As a consequence, NT seemed to impact soil physics and soil habitability, resulting in a significantly higher RSI value. The effect of CC was limited, but WW reported the best results in the short term, with a tendency to have higher RSI values.
Collectively, the combination of NT and WW can be considered the most promising in terms of sustainability improvement. In this study, only the short-term effect of different tillage and soil cover management results were reported. Therefore, longer-term experiments could better evaluate the effects of these management systems on some parameters, such as soil organic carbon, which have a wide impact on sustainability, yet vary little in the short term.
In conclusion, to correctly evaluate the CA effect, especially on the soil system, a holistic approach should be preferred to consider both the effects on crop production and on soil physics, considering different soil functions at different scales.
Author Contributions
Conceptualization, F.S.; formal analysis, F.S. and A.B.; investigation, F.S. and R.P.; data curation, F.S. and R.P.; writing—original draft preparation, F.S.; writing—review and editing, F.S., I.P., R.P. and A.B.; visualization, F.S.; supervision, I.P. and A.B.; project administration, A.B.; funding acquisition, A.B. All authors have read and agreed to the published version of the manuscript.
Funding
The research leading to these results received funding from the European Union HORIZON2020 Programme for Research, Technological Development and Demonstration under Grant Agreement No. 677407 (SOILCARE Project).
Institutional Review Board Statement
Not applicable.
Informed Consent Statement
Not applicable.
Data Availability Statement
The data that support the findings of this study are available from the corresponding author upon reasonable request.
Acknowledgments
We thank Rudi Hessel (project coordinator) and all the work package leaders for coordinating the project activities.
Conflicts of Interest
The authors declare no conflict of interest.
References
- FAO. Conservation Agriculture. Available online: http://www.fao.org/conservation-agriculture/en/ (accessed on 23 October 2020).
- Baveye, P.C.; Rangel, D.; Jacobson, A.R.; Laba, M.; Darnault, C.; Otten, W.; Radulovich, R.; Camargo, F.A.O. From Dust Bowl to Dust Bowl: Soils are Still Very Much a Frontier of Science. Soil Sci. Soc. Am. J. 2011, 75, 2037–2048. [Google Scholar] [CrossRef] [Green Version]
- Palm, C.; Blanco-Canqui, H.; DeClerck, F.; Gatere, L.; Grace, P. Conservation agriculture and ecosystem services: An overview. Agric. Ecosyst. Environ. 2014, 187, 87–105. [Google Scholar] [CrossRef] [Green Version]
- Komissarov, M.A.; Klik, A. The Impact of no-Till, conservation, and conventional tillage systems on erosion and soil properties in lower Austria. Eurasian Soil Sci. 2020, 53, 503–511. [Google Scholar] [CrossRef]
- Carretta, L.; Tarolli, P.; Cardinali, A.; Nasta, P.; Romano, N.; Masin, R. Evaluation of runoff and soil erosion under conventional tillage and no-till management: A case study in northeast Italy. Catena 2021, 197, 104972. [Google Scholar] [CrossRef]
- Derpsch, R.; Friedrich, T.; Kassam, A.; Li, H. Current status of adoption of no-till farming in the world and some of its main benefits. Int. J. Agric. Biol. Eng. 2010, 3, 1–25. [Google Scholar]
- Kassam, A.; Friedrich, T.; Derpsch, R. Global spread of Conservation Agriculture. Int. J. Environ. Stud. 2019, 76, 29–51. [Google Scholar] [CrossRef]
- Troccoli, A.; Maddaluno, C.; Mucci, M.; Russo, M.; Rinaldi, M. Is it appropriate to support the farmers for adopting conservation agriculture? Economic and environmental impact assessment. Ital. J. Agron. 2015, 10, 169–177. [Google Scholar] [CrossRef] [Green Version]
- Perego, A.; Rocca, A.; Cattivelli, V.; Tabaglio, V.; Fiorini, A.; Barbieri, S.; Schillaci, C.; Chiodini, M.E.; Brenna, S.; Acutis, M. Agro-environmental aspects of conservation agriculture compared to conventional systems: A 3-year experience on 20 farms in the Po valley (Northern Italy). Agric. Syst. 2019, 168, 73–87. [Google Scholar] [CrossRef] [Green Version]
- Camarotto, C.; Piccoli, I.; Dal Ferro, N.; Polese, R.; Chiarini, F.; Furlan, L.; Morari, F. Have we reached the turning point? Looking for evidence of SOC increase under conservation agriculture and cover crop practices. Eur. J. Soil Sci. 2020, 71, 1050–1063. [Google Scholar] [CrossRef]
- Piccoli, I.; Camarotto, C.; Lazzaro, B.; Furlan, L.; Morari, F. Conservation agriculture had a poor impact on the soil porosity of Veneto low-lying plain silty soils after a 5-year transition period. Land Degrad. Dev. 2017, 28, 2039–2050. [Google Scholar] [CrossRef]
- Pagnani, G.; Galieni, A.; D’Egidio, S.; Visioli, G.; Stagnari, F.; Pisante, M. Effect of soil tillage and crop sequence on grain yield and quality of durum wheat in Mediterranean areas. Agronomy 2019, 9, 488. [Google Scholar]
- Piccoli, I.; Lazzaro, B.; Furlan, L.; Berti, A.; Morari, F. Examining crop root apparatus traits in a maize-soybean-winter wheat rotation under conservation agriculture management. Eur. J. Agron. 2021, 122, 126171. [Google Scholar] [CrossRef]
- Calzarano, F.; Stagnari, F.; D’egidio, S.; Pagnani, G.; Galieni, A.; Di Marco, S.; Metruccio, E.G.; Pisante, M. Durum wheat quality, yield and sanitary status under conservation agriculture. Agriculture 2018, 8, 140. [Google Scholar]
- Vastola, A.; Zdruli, P.; D’Amico, M.; Pappalardo, G.; Viccaro, M.; Di Napoli, F.; Cozzi, M.; Romano, S. A comparative multidimensional evaluation of conservation agriculture systems: A case study from a Mediterranean area of Southern Italy. Land Use Policy 2017, 68, 326–333. [Google Scholar] [CrossRef]
- Ruisi, P.; Giambalvo, D.; Saia, S.; Di Miceli, G.; Frenda, A.S.; Plaia, A.; Amato, G. Conservation tillage in a semiarid Mediterranean environment: Results of 20 years of research. Ital. J. Agron. 2014, 9, 1–7. [Google Scholar] [CrossRef] [Green Version]
- Piccoli, I.; Chiarini, F.; Carletti, P.; Furlan, L.; Lazzaro, B.; Nardi, S.; Berti, A.; Sartori, L.; Dalconi, M.C.C.; Morari, F. Disentangling the effects of conservation agriculture practices on the vertical distribution of soil organic carbon. Evidence of poor carbon sequestration in North-eastern Italy. Agric. Ecosyst. Environ. 2016, 230, 68–78. [Google Scholar] [CrossRef]
- Longo, M.; Piccoli, I.; Minasny, B.; Morari, F. Soil apparent electrical conductivity-directed sampling design for advancing soil characterization in agricultural fields. Vadose Zone J. 2020, 19, e20060. [Google Scholar] [CrossRef]
- Massaccesi, L.; Rondoni, G.; Tosti, G.; Conti, E.; Guiducci, M.; Agnelli, A. Soil functions are affected by transition from conventional to organic mulch-based cropping system. Appl. Soil Ecol. 2020, 153, 103639. [Google Scholar] [CrossRef]
- Piazza, G.; Pellegrino, E.; Moscatelli, M.C.; Ercoli, L. Long-term conservation tillage and nitrogen fertilization effects on soil aggregate distribution, nutrient stocks and enzymatic activities in bulk soil and occluded microaggregates. Soil Tillage Res. 2020, 196, 104482. [Google Scholar] [CrossRef]
- Stagnari, F.; Pagnani, G.; Galieni, A.; D’Egidio, S.; Matteucci, F.; Pisante, M. Effects of conservation agriculture practices on soil quality indicators: A case-study in a wheat-based cropping systems of Mediterranean areas. Soil Sci. Plant Nutr. 2020, 66, 624–635. [Google Scholar] [CrossRef]
- European Commission. Report from the Commission to the European Parliament and the Council on the Implementation of the European Statistical Programme 2013–2017; European Commission: Brussels, Belgium, 2017. [Google Scholar]
- Masto, R.E.; Chhonkar, P.K.; Purakayastha, T.J.; Patra, A.K.; Singh, D. Soil quality indices for evaluation of long-term land use and soil management practices in semi-arid sub-tropical India. Land Degrad. Dev. 2008, 19, 516–529. [Google Scholar] [CrossRef]
- Xuefang, H.; Juanling, W.; Mingjing, H.; Cong, Z.; Huatao, L. Sustainability of soil-crop systems under different long-term fertilizations in Chestnut Cinnamon soil areas. Zhongguo Shengtai Nongye Xuebao Chin. J. Eco-Agric. 2018, 26, 1107–1116. [Google Scholar]
- Blanco-Canqui, H.; Mikha, M.M.; Presley, D.R.; Claassen, M.M. Addition of Cover Crops Enhances No-Till Potential for Improving Soil Physical Properties. Soil Sci. Soc. Am. J. 2011, 75, 1471–1482. [Google Scholar] [CrossRef]
- Blanco-Canqui, H.; Ruis, S.J. Cover crop impacts on soil physical properties: A review. Soil Sci. Soc. Am. J. 2020, 84, 1527–1576. [Google Scholar] [CrossRef]
- Fajardo, M.; McBratney, A.B.; Field, D.J.; Minasny, B. Soil slaking assessment using image recognition. Soil Tillage Res. 2016, 163, 119–129. [Google Scholar] [CrossRef]
- Crotty, F.V.; Stoate, C. The legacy of cover crops on the soil habitat and ecosystem services in a heavy clay, minimum tillage rotation. Food Energy Secur. 2019, 8, e00169. [Google Scholar] [CrossRef] [Green Version]
- Masto, R.E.; Chhonkar, P.K.; Singh, D.; Patra, A.K. Soil quality response to long-term nutrient and crop management on a semi-arid Inceptisol. Agric. Ecosyst. Environ. 2007, 118, 130–142. [Google Scholar] [CrossRef]
- FAO-UNESCO. Soil Map of the World. Revised Legend; Food and Agriculture Organization of the United Nations: Rome, Italy, 2008. [Google Scholar]
- Flynn, K.D.; Bagnall, D.K.; Morgan, C.L.S. Evaluation of SLAKES, a smartphone application for quantifying aggregate stability, in high-clay soils. Soil Sci. Soc. Am. J. 2020, 84, 345–353. [Google Scholar] [CrossRef]
- Grossman, R.B.; Reinsch, T.G. 2.1 Bulk density and linear extensibility. In Methods of Soil Analysis: Part 4 Physical Methods; Dane, J.H., Topp, C.G., Eds.; Soil Science Society of America: Madison, WI, USA, 2002; pp. 201–228. [Google Scholar]
- USDA NRCS. Soil Quality Information Sheet Soil Quality Resource Concerns: Compaction USDA Natural Resources Conservation Service; USDA: Washington, DC, USA, 1996.
- Groenevelt, P.H.; Grant, C.D.; Semetsa, S. A new procedure to determine soil water availability. Aust. J. Soil Res. 2001, 39, 577–598. [Google Scholar] [CrossRef]
- Parr, J.F.; Bertrand, A.R. Water infiltration into soils. Adv. Agron. 1960, 12, 311–363. [Google Scholar]
- Lai, J.; Ren, L. Assessing the Size Dependency of Measured Hydraulic Conductivity Using Double-Ring Infiltrometers and Numerical Simulation. Soil Sci. Soc. Am. J. 2007, 71, 1667. [Google Scholar] [CrossRef]
- Philip, J.R. The theory of infiltration: 4. Sorptivity and algebraic infiltration equations. Soil Sci. 1957, 84, 257–264. [Google Scholar] [CrossRef]
- Valckx, J.; Govers, G.; Hermy, M.; Muys, B.; Valckx, J.; Govers, G.; Hermy, M.; Muys, B. Optimizing Earthworm Sampling in Ecosystems. Soil Biol. 2011, 24, 19–38. [Google Scholar]
- Shepherd, G.; Janssen, H. Visual Soil Assessment, Field Guide for Cropping; Landcare Research: Palmerston North, New Zealand, 2000; ISBN 1-877221-92-9. [Google Scholar]
- García-Robledo, E.; Corzo, A.; Papaspyrou, S. A fast and direct spectrophotometric method for the sequential determination of nitrate and nitrite at low concentrations in small volumes. Mar. Chem. 2014, 162, 30–36. [Google Scholar] [CrossRef] [Green Version]
- Van Reeuwijk, L.P. Procedures for soil analysis. Int. Soil Ref. Inf. Cent. 1986, 9, 106. [Google Scholar]
- Andrews, S.S.; Mitchell, J.P.; Mancinelli, R.; Karlen, D.L.; Hartz, T.K.; Horwath, W.R.; Pettygrove, G.S.; Scow, K.M.; Munk, D.S. On-Farm Assessment of Soil Quality in California’s Central Valley. Agron. J. 2002, 94, 12–23. [Google Scholar]
- Andrews, S.S.; Karlen, D.L.; Mitchell, J.P. A comparison of soil quality indexing methods for vegetable production systems in Northern California. Agric. Ecosyst. Environ. 2002, 90, 25–45. [Google Scholar] [CrossRef]
- Armenise, E.; Redmile-Gordon, M.A.; Stellacci, A.M.; Ciccarese, A.; Rubino, P. Developing a soil quality index to compare soil fitness for agricultural use under different managements in the mediterranean environment. Soil Tillage Res. 2013, 130, 91–98. [Google Scholar] [CrossRef]
- Kumar, M.; Mitra, S.; Mazumdar, S.P.; Majumdar, B.; Saha, A.R.; Singh, S.R.; Pramanick, B.; Gaber, A.; Alsanie, W.F.; Hossain, A. Improvement of Soil Health and System Productivity through Crop Diversification and Residue Incorporation under Jute-Based Different Cropping Systems. Agronomy 2021, 11, 1622. [Google Scholar] [CrossRef]
- Raiesi, F.; Kabiri, V. Identification of soil quality indicators for assessing the effect of different tillage practices through a soil quality index in a semi-arid environment. Ecol. Indic. 2016, 71, 198–207. [Google Scholar] [CrossRef]
- Schabenberger, O.; Pierce, F. Contemporary Statistical Models for the Plant and Soil Sciences; CRC Press: Boca Raton, FL, USA, 2001; ISBN 978-1-58488-111-7. [Google Scholar]
- Metsalu, T.; Vilo, J. ClustVis: A web tool for visualizing clustering of multivariate data using Principal Component Analysis and heatmap. Nucleic Acids Res. 2015, 43, W566–W570. [Google Scholar] [CrossRef] [PubMed]
- García-González, I.; Hontoria, C.; Gabriel, J.L.; Alonso-Ayuso, M.; Quemada, M. Cover crops to mitigate soil degradation and enhance soil functionality in irrigated land. Geoderma 2018, 322, 81–88. [Google Scholar] [CrossRef]
- Krstić, D.; Vujić, S.; Jaćimović, G.; D’Ottavio, P.; Radanović, Z.; Erić, P.; Ćupina, B. The Effect of Cover Crops on Soil Water Balance in Rain-Fed Conditions. Atmosphere 2018, 9, 492. [Google Scholar] [CrossRef] [Green Version]
- Blanco-Canqui, H.; Ruis, S.J. No-tillage and soil physical environment. Geoderma 2018, 326, 164–200. [Google Scholar] [CrossRef]
- Piccoli, I.; Schjønning, P.; Lamandé, M.; Zanini, F.; Morari, F. Coupling gas transport measurements and X-ray tomography scans for multiscale analysis in silty soils. Geoderma 2019, 338, 576–584. [Google Scholar] [CrossRef]
- Camarotto, C.; Dal Ferro, N.; Piccoli, I.; Polese, R.; Furlan, L.; Chiarini, F.; Morari, F. Conservation agriculture and cover crop practices to regulate water, carbon and nitrogen cycles in the low-lying Venetian plain. Catena 2018, 167, 236–249. [Google Scholar] [CrossRef]
- Piccoli, I.; Furlan, L.; Lazzaro, B.; Morari, F. Examining conservation agriculture soil profiles: Outcomes from northeastern Italian silty soils combining indirect geophysical and direct assessment methods. Eur. J. Soil Sci. 2020, 71, 1064–1075. [Google Scholar] [CrossRef]
- Piccoli, I.; Schjønning, P.; Lamandé, M.; Furlan, L.; Morari, F. Challenges of conservation agriculture practices on silty soils. Effects on soil pore and gas transport characteristics in North-eastern Italy. Soil Tillage Res. 2017, 172, 12–21. [Google Scholar] [CrossRef]
- Bertrand, M.; Barot, S.; Blouin, M.; Whalen, J.; de Oliveira, T.; Roger-Estrade, J. Earthworm services for cropping systems. A review. Agron. Sustain. Dev. 2015, 35, 553–567. [Google Scholar] [CrossRef]
- van Schaik, L.; Palm, J.; Klaus, J.; Zehe, E.; Schröder, B. Linking spatial earthworm distribution to macropore numbers and hydrological effectiveness. Ecohydrology 2014, 7, 401–408. [Google Scholar] [CrossRef]
- Vogel, H.-J.; Balseiro-Romero, M.; Kravchenko, A.; Otten, W.; Pot, V.; Schlüter, S.; Weller, U.; Baveye, P.C. A holistic perspective on soil architecture is needed as a key to soil functions. Eur. J. Soil Sci. 2021, 1–14. [Google Scholar] [CrossRef]
- Issaka, F.; Zhang, Z.; Zhao, Z.-Q.; Asenso, E.; Li, J.-H.; Li, Y.-T.; Wang, J.-J. Sustainable conservation tillage improves soil nutrients and reduces nitrogen and Phosphorous losses in maize farmland in southern China. Sustainability 2019, 11, 2397. [Google Scholar] [CrossRef] [Green Version]
- Wagger, M.G.; Denton, H.P. Influence of Cover Crop and Wheel Traffic on Soil Physical Properties in Continuous No-Till Corn. Soil Sci. Soc. Am. J. 1989, 53, 1206–1210. [Google Scholar] [CrossRef]
- Herencia, J.F. Soil quality indicators in response to long-term cover crop management in a Mediterranean organic olive system. Biol. Agric. Hortic. 2017, 34, 211–231. [Google Scholar] [CrossRef]
- de Torres, M.A.R.-R.; Ordóñez-Fernández, R.; Giráldez, J.V.; Márquez-García, J.; Laguna, A.; Carbonell-Bojollo, R. Efficiency of four different seeded plants and native vegetation as cover crops in the control of soil and carbon losses by water erosion in olive orchards. Land Degrad. Dev. 2018, 29, 2278–2290. [Google Scholar] [CrossRef]
- Carpio, A.J.; Castro, J.; Tortosa, F.S. Arthropod biodiversity in olive groves under two soil management systems: Presence versus absence of herbaceous cover crop. Agric. For. Entomol. 2019, 21, 58–68. [Google Scholar] [CrossRef]
- Guzmán, G.; Cabezas, J.M.; Sánchez-Cuesta, R.; Lora, Á.; Bauer, T.; Strauss, P.; Winter, S.; Zaller, J.G.; Gómez, J.A. A field evaluation of the impact of temporary cover crops on soil properties and vegetation communities in southern Spain vineyards. Agric. Ecosyst. Environ. 2019, 272, 135–145. [Google Scholar] [CrossRef]
- Guzmán, G.; Perea-Moreno, A.-J.; Gómez, J.A.; Cabrerizo-Morales, M.Á.; Martínez, G.; Giráldez, J.V. Water Related Properties to Assess Soil Quality in Two Olive Orchards of South Spain under Different Management Strategies. Water 2019, 11, 367. [Google Scholar] [CrossRef] [Green Version]
- Li, Y.; Song, D.; Liang, S.; Dang, P.; Qin, X.; Liao, Y.; Siddique, K.H.M. Effect of no-tillage on soil bacterial and fungal community diversity: A meta-analysis. Soil Tillage Res. 2020, 204, 104721. [Google Scholar] [CrossRef]
- Anyanzwa, H.; Okalebo, J.R.; Othieno, C.O.; Bationo, A.; Waswa, B.S.; Kihara, J. Effects of conservation tillage, crop residue and cropping systems on changes in soil organic matter and maize–legume production: A case study in Teso District. Nutr. Cycl. Agroecosystems 2008, 88, 39–47. [Google Scholar] [CrossRef]
- Toom, M.; Talgre, L.; Mäe, A.; Tamm, S.; Narits, L.; Edesi, L.; Haljak, M.; Lauringson, E. Selecting winter cover crop species for northern climatic conditions. Biol. Agric. Hortic. 2019, 35, 263–274. [Google Scholar] [CrossRef]
- Wittwer, R.A.; van der Heijden, M.G.A. Cover crops as a tool to reduce reliance on intensive tillage and nitrogen fertilization in conventional arable cropping systems. Field Crops Res. 2020, 249, 107736. [Google Scholar] [CrossRef]
- Zhang, Z.; Peng, X. Bio-tillage: A new perspective for sustainable agriculture. Soil Tillage Res. 2021, 206, 104844. [Google Scholar] [CrossRef]
- Diacono, M.; Persiani, A.; Testani, E.; Montemurro, F. Sustainability of agro-ecological practices in organic horticulture: Yield, energy-use and carbon footprint. Agroecol. Sustain. Food Syst. 2019, 44, 726–746. [Google Scholar] [CrossRef]
- Ciaccia, C.; Ceglie, F.G.; Burgio, G.; Madžarić, S.; Testani, E.; Muzzi, E.; Mimiola, G.; Tittarelli, F. Impact of Agroecological Practices on Greenhouse Vegetable Production: Comparison among Organic Production Systems. Agronomy 2019, 9, 372. [Google Scholar] [CrossRef] [Green Version]
- Domagała-Świątkiewicz, I.; Siwek, P.; Bucki, P.; Rabiasz, K. Effect of hairy vetch (Vicia villosa Roth.) and vetch-rye (Secale cereale L.) biculture cover crops and plastic mulching in high tunnel vegetable production under organic management. Biol. Agric. Hortic. 2019, 35, 248–262. [Google Scholar] [CrossRef]
- Wen, Y.; Zang, H.; Freeman, B.; Ma, Q.; Chadwick, D.R.; Jones, D.L. Rye cover crop incorporation and high watertable mitigate greenhouse gas emissions in cultivated peatland. Land Degrad. Dev. 2019, 30, 1928–1938. [Google Scholar] [CrossRef]
- Fiorini, A.; Maris, S.C.; Abalos, D.; Amaducci, S.; Tabaglio, V. Combining no-till with rye (Secale cereale L.) cover crop mitigates nitrous oxide emissions without decreasing yield. Soil Tillage Res. 2020, 196, 104442. [Google Scholar] [CrossRef]
- Norberg, L.; Aronsson, H. Effects of cover crops sown in autumn on N and P leaching. Soil Use Manag. 2020, 36, 200–211. [Google Scholar] [CrossRef]
- Reeves, D.W. The role of soil organic matter in maintaining soil quality in continuous cropping systems. Soil Tillage Res. 1997, 43, 131–167. [Google Scholar] [CrossRef]
- Calegari, A.; Hargrove, W.L.; Rheinheimer, D.D.S.; Ralisch, R.; Tessier, D.; de Tourdonnet, S.; de Fatima Guimarães, M. Impact of long-term no-tillage and cropping system management on soil organic carbon in an oxisol: A model for sustainability. Agron. J. 2008, 100, 1013–1019. [Google Scholar] [CrossRef]
Figure 1.
Biochemical parameter scores with average values in treatment combinations at T0 and T1 surveys (C org—soil organic carbon; N tot—soil total nitrogen; EW—earthworm density; N min—mineral nitrogen; Y—yield; BS—bare soil; TR—tillage radish; WW—winter wheat; CT—conventional tillage; MT—minimum tillage; NT—no tillage).

Figure 2.
Physical parameter scores with average values in treatment combinations in T0 and T1 surveys (Agg—aggregate stability; BD—bulk density; GWC—gravimetric water content; PR—penetration resistance; Ks—saturated hydraulic conductivity; BS—bare soil; TR—tillage radish; WW—winter wheat; CT—conventional tillage; MT—minimum tillage; NT—no tillage).

Figure 3.
Average RSIs and the contribution of each parameter under different tillage systems in different years. Agg—aggregate stability; BD—bulk density; GWC—gravimetric water content; Ks—saturated hydraulic conductivity; PR—penetration resistance; EW—earthworm density; N min—mineral nitrogen; N tot—soil total nitrogen; Y—yield; CT—conventional tillage; MT—minimum tillage; NT—no tillage. Different letters represent significant differences of the global treatment RSI at p < 0.05.

Figure 4.
Average RSI values for different soil coverings in different years. BS—bare soil; TR—tillage radish; WW—winter wheat. Agg—aggregate stability; BD—bulk density; GWC—gravimetric water content; Ks—saturated hydraulic conductivity; PR—penetration resistance; EW—earthworm density; N min—mineral nitrogen; N tot—soil total nitrogen; Y—yield; CT—conventional tillage; MT—minimum tillage; NT—no tillage. Different letters represent significant differences of the global treatment RSI at p < 0.05.


Table 1.
Soil parameters used for building the sustainability index.
| Soil Characteristic | Acronym | Used Method |
|---|---|---|
| Aggregate stability | Agg | Slakes application |
| Bulk density | BD | Core method |
| Soil organic carbon | C org | CNS Elemental analyzer |
| Total nitrogen | N tot | CNS Elemental analyzer |
| Gravimetric water content | GWC | Oven-dried at 105 °C |
| Penetration resistance | PR | Penetrologger |
| Saturated hydraulic conductivity | Ks | Infiltrometer method |
| Earthworm density | EW | Mustard extraction |
| Mineral nitrogen | N min | Photometry |
| pH | pH | 1 M KCl solution |
| Cash crop yield | Y | Oven-dried at 105 °C |
Table 2.
Comparison of p-values among the linear mixed-effect model analysis of observed parameters (Agg—aggregate stability; BD—bulk density; C org—soil organic carbon; N tot—soil total nitrogen; GWC—gravimetric water content; PR—penetration resistance; Ks—saturated hydraulic conductivity; EW—earthworm density; N min—mineral nitrogen; Y—yield, CC—cover crop).
| Time | Tillage | CC | Time × Till | Time × CC | Till × CC | Time × Till × CC | |
|---|---|---|---|---|---|---|---|
| Agg | 0.001 ** | 0.111 | 0.831 | 0.928 | 0.507 | 0.227 | 0.112 |
| BD | 0.155 | 0.663 | 0.529 | 0.043 * | 0.469 | 0.672 | 0.536 |
| C org | 0.715 | 0.633 | 0.99 | 0.35 | 0.768 | 0.778 | 0.882 |
| N tot | 0.052 | 0.188 | 0.87 | 0.192 | 0.545 | 0.766 | 0.566 |
| GWC | <0.001 *** | 0.255 | 0.03 * | 0.443 | 0.808 | 0.677 | 0.915 |
| PR | <0.001 *** | 0.004 ** | 0.635 | 0.334 | 0.815 | 0.724 | 0.877 |
| Ks | 0.034 * | 0.046 * | 0.187 | 0.39 | 0.564 | 0.252 | 0.68 |
| EW | 0.389 | 0.126 | 0.104 | 0.006 ** | 0.199 | 0.161 | 0.796 |
| N min | 0.451 | 0.906 | 0.615 | 0.169 | 0.589 | 0.343 | 0.501 |
| pH | <0.001 *** | 0.159 | 0.982 | 0.551 | 0.612 | 0.867 | 0.97 |
| Y | 0.84 | 0.904 | 0.68 | 0.76 | 0.378 | 0.648 | 0.589 |
*, ** and *** mean p < 0.05, <0.01 and <0.001, respectively.
Table 3.
Descriptive statistics of studied parameters for T0 and T1 surveys (Agg—aggregate stability; BD—bulk density; C org—soil organic carbon; N tot—soil total nitrogen; GWC—gravimetric water content; PR—penetration resistance; Ks—saturated hydraulic conductivity; EW—earthworm density; N min—mineral nitrogen; St. Dev.—standard deviation; Var. Coef.—coefficient of variation).
| Survey | Parameter | Unit | Min | Max | Mean | St. Dev. | Var. Coef. |
|---|---|---|---|---|---|---|---|
| T0 | Agg | - | 2.90 | 6.10 | 4.50 | 0.92 | 0.20 |
| BD | g cm−3 | 1.32 | 1.54 | 1.43 | 0.05 | 0.04 | |
| C org | % | 0.64 | 1.07 | 0.83 | 0.12 | 0.14 | |
| N tot | ‰ | 0.08 | 1.09 | 0.88 | 0.23 | 0.26 | |
| GWC | % | 20 | 25 | 23 | 1 | 0.06 | |
| PR | MPa | 0.46 | 1.05 | 0.70 | 0.14 | 0.21 | |
| Ks | m s−1 | 6.7 × 10⁻⁶ | 1.7 × 10⁻⁴ | 3.4 × 10⁻⁵ | 3.9 × 10⁻⁵ | 1.15 | |
| EW | n m−2 | 0.00 | 16.00 | 6.17 | 4.69 | 0.76 | |
| N min | mg kg−1 | 12.85 | 46.90 | 22.97 | 8.91 | 0.39 | |
| pH | - | 7.22 | 7.49 | 7.36 | 0.06 | 0.008 | |
| Yield | Mg ha−1 | 5.41 | 12.36 | 9.96 | 1.62 | 0.16 | |
| T1 | Agg | - | 0.30 | 5.20 | 3.19 | 1.25 | 0.39 |
| BD | g cm−3 | 1.36 | 1.56 | 1.46 | 0.06 | 0.04 | |
| C org | % | 0.63 | 1.01 | 0.82 | 0.11 | 0.13 | |
| N tot | ‰ | 0.74 | 1.21 | 1.01 | 0.13 | 0.13 | |
| GWC | % | 12 | 22 | 16 | 2 | 0.13 | |
| PR | MPa | 0.96 | 1.96 | 1.34 | 0.25 | 0.19 | |
| Ks | m s−1 | 8.2 × 10⁻⁶ | 3.6 × 10⁻⁴ | 8.7 × 10⁻⁵ | 1.0 × 10⁻⁴ | 1.16 | |
| EW | n m−2 | 0.00 | 20.00 | 7.44 | 6.21 | 0.83 | |
| N min | mg kg−1 | 6.49 | 53.41 | 26.11 | 14.37 | 0.55 | |
| pH | - | 6.93 | 7.22 | 7.05 | 0.08 | 0.01 | |
| Yield | Mg ha−1 | 9.28 | 11.09 | 10.04 | 0.55 | 0.05 |
Table 4.
Correlation among the parameters. Boldface indicates highly-correlated values (r > 0.8). (Agg—aggregate stability; BD—bulk density; C org—soil organic carbon; N tot—soil total nitrogen; GWC—gravimetric water content; PR—penetration resistance; Ks—saturated hydraulic conductivity; EW—earthworm density; N min—mineral nitrogen).
| Agg | BD | C Org | EW | GWC | Ks | N Min | N Tot | pH | PR | Y | |
|---|---|---|---|---|---|---|---|---|---|---|---|
| Agg | 1 | ||||||||||
| BD | −0.009 | 1 | |||||||||
| C org | −0.131 | 0.187 | 1 | ||||||||
| EW | −0.274 | 0.234 | 0.033 | 1 | |||||||
| GWC | −0.152 | 0.299 | 0.340 | 0.175 | 1 | ||||||
| Ks | 0.032 | 0.007 | 0.256 | 0.310 | 0.344 | 1 | |||||
| N min | 0.385 | 0.091 | −0.134 | −0.153 | −0.150 | −0.037 | 1 | ||||
| N tot | −0.165 | 0.100 | 0.924 | 0.038 | 0.328 | 0.293 | −0.022 | 1 | |||
| pH | −0.091 | −0.038 | 0.000 | −0.069 | 0.115 | 0.100 | 0.182 | −0.086 | 1 | ||
| PR | 0.038 | 0.130 | −0.203 | −0.271 | 0.012 | −0.469 | −0.154 | −0.284 | −0.039 | 1 | |
| Y | −0.043 | −0.119 | 0.009 | 0.104 | −0.182 | 0.144 | −0.088 | 0.024 | −0.037 | −0.332 | 1 |
Table 5.
Results of principal component analysis under different treatment combination in different years. Bolded factor loads were considered as high. Bolded and underlined factor loads determined for each variable were those the PC considered in the RSI calculation. The weighting factor (PW) for each variable was equal to the variation explained by the PC selected (Agg—aggregate stability; BD—bulk density; C org—soil organic carbon; N tot—soil total nitrogen; GWC—gravimetric water content; PR—penetration resistance; Ks—saturated hydraulic conductivity; EW—earthworm density; N min—mineral nitrogen).
| Principal Components | PC-1 | PC-2 | PC-3 | PC-4 |
|---|---|---|---|---|
| Variation | 0.241 | 0.149 | 0.135 | 0.117 |
| Cumulative variation | 0.241 | 0.389 | 0.525 | 0.642 |
| Agg | 0.196 | −0.134 | 0.536 | −0.062 |
| BD | 0.153 | −0.355 | −0.072 | 0.420 |
| C org | 0.498 | −0.168 | −0.222 | −0.334 |
| EW | 0.248 | 0.131 | 0.403 | 0.441 |
| GWC | 0.355 | −0.326 | −0.018 | 0.302 |
| Ks | 0.378 | 0.304 | −0.057 | 0.277 |
| N min | −0.124 | 0.176 | −0.601 | 0.265 |
| N tot | 0.504 | −0.097 | −0.244 | −0.357 |
| pH | 0.010 | 0.046 | −0.169 | 0.338 |
| PR | −0.291 | −0.563 | 0.073 | −0.056 |
| Y | 0.079 | 0.502 | 0.196 | −0.174 |
Table 6.
Linear mixed model analysis of RSI output.
| T0 | T1 | |||||
|---|---|---|---|---|---|---|
| Effect | F | p | F | p | ||
| Intercept | 75.81 | <0.001 | *** | 81.27 | <0.001 | *** |
| Tillage | 0.20 | 0.823 | 5.57 | 0.019 | * | |
| Covering | 2.48 | 0.125 | 2.88 | 0.095 | ||
* and *** mean p < 0.05 and <0.001, respectively.
Publisher’s Note: MDPI stays neutral with regard to jurisdictional claims in published maps and institutional affiliations. |
© 2021 by the authors. Licensee MDPI, Basel, Switzerland. This article is an open access article distributed under the terms and conditions of the Creative Commons Attribution (CC BY) license (https://creativecommons.org/licenses/by/4.0/).
Share and Cite
MDPI and ACS Style
Sartori, F.; Piccoli, I.; Polese, R.; Berti, A. A Multivariate Approach to Evaluate Reduced Tillage Systems and Cover Crop Sustainability. Land 2022, 11, 55. https://doi.org/10.3390/land11010055
AMA Style
Sartori F, Piccoli I, Polese R, Berti A. A Multivariate Approach to Evaluate Reduced Tillage Systems and Cover Crop Sustainability. Land. 2022; 11(1):55. https://doi.org/10.3390/land11010055
Chicago/Turabian StyleSartori, Felice, Ilaria Piccoli, Riccardo Polese, and Antonio Berti. 2022. "A Multivariate Approach to Evaluate Reduced Tillage Systems and Cover Crop Sustainability" Land 11, no. 1: 55. https://doi.org/10.3390/land11010055
Note that from the first issue of 2016, this journal uses article numbers instead of page numbers. See further details here.