Article

Systematic Conservation Planning as a Tool for the Assessment of Protected Areas Network in Jordan

1
The International Union for the Conservation of Nature—Regional Office for West Asia, Amman 11194, Jordan
2
Department of Geography, Faculty of Social Sciences, Mutah University, AlKarak 61710, Jordan
3
Department of Earth Sciences, Institute of Geographical Sciences, Freie Universität Berlin, Malteserstraße 74-100, 12449 Berlin, Germany
4
The United Nations Development Programme, Amman 11194, Jordan
*
Author to whom correspondence should be addressed.
Land 2022, 11(1), 56; https://doi.org/10.3390/land11010056
Submission received: 30 November 2021 / Revised: 22 December 2021 / Accepted: 27 December 2021 / Published: 31 December 2021

Abstract

:
The present study aims to use systematic conservation planning to analyse and review the national protected areas (PAs) network in Jordan. The analysis included the application of three modules: the environmental risk surface (ERS), the relative biodiversity index (RBI), and the application of Marxan. The methodology was based on using Marxan to achieve solutions for three scenarios for the PAs network. Marxan was applied to the input data, which included vegetation types, distribution of threatened mammals and plants, locations of currently established PAs and other types of designations. The first two scenarios aimed to conserve 4% and 17%, respectively, of each vegetation type, and 10% and 20%, respectively, of the extent of occurrence of threatened mammals and plants. The third scenario aimed to conserve 17% of each vegetation type and 10% of the extent of occurrence of threatened plants and mammals, except for forest and the Hammada vegetation which had the target of 30% and 4%, respectively. The results of the three scenarios indicated that the boundaries of existing reserves should be extended to achieve the conservation targets. Some currently proposed (PAs), such as the Aqaba Mountains, did not appear in any of the solutions for the three scenarios indicating that the inclusion of these sites in the proposed (PAs) network should be reconsidered. All three scenarios highlighted the importance of having conservation areas between the western and eastern parts of the country. Systematic conservation planning is a structured, replicable, transparent, and defensible method for designing PA networks. It allows for finding efficient solutions building on what is currently conserved and minimizing the fragmentation and cost of the proposed solution for conservation areas.

1. Introduction

The International Union for the Conservation of Nature (IUCN) defines protected areas as “A clearly defined geographical space, recognised, dedicated and managed, through legal or other effective means, to achieve the long-term conservation of nature with associated ecosystem services and cultural values” [1]. Protected areas (PAs) are an integral part of national and international biodiversity conservation strategies. They have a significant role in minimizing the extinction risk of threatened species, acting as refuges for species where the natural or semi-natural ecological processes can be maintained. PAs also provide benefits to the communities living in and around them because of the recreational use, genetic resources, and other ecosystem services that they provide [2].
GIS applications have been applied in many fields related to protected area design and planning, for example, PAs zoning, eco-tourism zoning, habitat suitability modelling, fire risk modelling, and PAs design [3,4,5,6,7,8]. GIS and remote sensing are also widely used in vegetation analysis and wetland monitoring [9,10,11,12]. Several software packages are applied in systematic conservation planning. Among the most commonly used software, Marxan is widely used in the identification of gaps in protected area networks, and in identifying potential priority areas to be included in a well-designed representative protected area network that meets pre-set conservation targets [13]. It is also one of the most widely used conservation-planning, decision-support tools [14]. Particularly, this software uses a minimum-set approach to identify portfolios of planning units that achieve conservation targets at near-minimal cost [15,16].
Systematic conservation planning has five fundamental principles, which are representation, complementarity, adequacy, efficiency, and spatial compactness [15,17]. It is widely applied in Australia, the United States, and South Africa [18,19,20]. For example, in Ecuador, systematic conservation planning using Marxan software was applied in combination with species distribution modelling using Maxent with the aim of increasing the representation of terrestrial species diversity in the protected areas network [21,22]. However, its application in the Arab region in general, and Jordan remains very limited.
Many innovative systematic conservation planning approaches have been explored and applied in one of the 19 world’s most important biodiversity hotspots, which is the Mediterranean Sea [18,23]. A study from the Mediterranean Egadi Islands explored alternative conservation strategies within two scenarios: with and without considering human uses in marine spatial planning. The study highlighted the importance of combining ecological and socioeconomic aspects to achieve nature conservation sustainability using Marxan software [24]. Systematic conservation planning was used to produce a priority ranking of the arid zones of southeast Spain. The zones were prioritized according to the rarity and richness of the characteristic flora and based on their status and level of endangerment. This study shows that it is important to conserve areas by establishing micro-reserves outside the boundaries of the protected areas network to ensure the conservation of priority sites.
Three main habitats occur in the Mediterranean region showing that systematic conservation planning using Marxan software was used for comparison between two planning scenarios: (1) a whole-basin scenario, which involves the selection of priority areas across the Mediterranean Sea, and (2) an eco-regional scenario, where areas were selected within the predefined ecoregions. The results of this study showed that the eco-regional approach yields better representativeness of conservation features [25]. The Abu Dhabi Global Environmental Data Initiative (AGEDI) organized a GIS and systematic conservation planning workshop in 2010 as part of the Biodiversity Conservation Conference at the Arabian Peninsula. The workshop aimed at testing the potential for conducting a rapid systematic conservation assessment for the Arabian Peninsula using datasets available from participating countries. This assessment for the Arabian Peninsula covered Jordan but there were inconsistencies and limitations in the data used for different countries [26]. This assessment introduced the methodology to apply Marxan software to the region and prepared for conducting a more robust assessment in the future [27]. Systematic conservation planning was applied in the United Arab Emirates (UAE) to assess if conservation features were adequately represented in the system of marine protected areas (MPAs), and to identify complementary coastal and marine priority areas for conservation and management [28].
Previous studies on protected areas in Jordan used different mapping and GIS techniques. GIS was used in the first review of a network of 20 national protected areas in the 1990s and later on in 2008 where representation percentage of each of Jordan’s 13 vegetation types within the boundaries of established and proposed protected areas were calculated using overlay analysis [29]. On an individual site level, Boulad (2014) applied spatial multi-criteria evaluation techniques in developing zoning plans for protected areas in Jordan using Dibeen Forest Reserve as a case study. This approach was afterwards applied in other protected areas in Jordan such as Wadi Rum, Ajloun, and Yarmouk Forest reserves.
Although the total area of the established protected areas in Jordan exceeds the national target of 4% from the country’s total area, this percentage is not evenly distributed across the different vegetation types. There are still some vegetation types that are considerably under-represented such as evergreen oak forest, Mediterranean non-forest vegetation, Juniperus forest, and steppe vegetation, while other vegetation types such as sand dune vegetation and mudflat are highly over-represented. The vegetation representation gap still exists even when considering the proposed sites. These gaps imply that the current design of the established and proposed PAs does not offer a balanced representation of all vegetation types even under the current target of 4%. Table 1 shows the representation percentages for the established and proposed PAs under the current conditions. This implies that an extensive review and update for the national PAs network is urgently needed.
This approach was also used in developing the first seasonal zoning plan for a dynamic Ramsar site using Sabkhat Al Jabboul in Syria as a case study [30]. As for the application of systematic conservation planning using the Marxan model, this is the first time it has been applied to Jordan and surrounding countries integrating several important datasets and pre-set targets. Correspondingly, in this study, the systematic conservation planning techniques were used to provide scenarios for the update of the national network of protected areas in Jordan according to international criteria and design principles, and to identify new and complementary potential areas for species conservation. To accomplish this aim, we tested the application of three modules: the environmental risk surface (ERS), the relative biodiversity index (RBI), and the application of Marxan. The methodology was based on using Marxan to achieve solutions for three scenarios for the PAs network. As such, we seek to improve protected area networks in Jordan and other highly diverse countries.

2. Study Area

The study area includes the whole geographic extent of Jordan with its strategic location at the intersection of three continents (Figure 1). Jordan is located in west Asia between 29°11′ to 33°22.6′ N, and 34°57′ to 39°18′ E with a total area of 89,342 km2. The topography of the land varies, ranging from the Jordan valley lowlands, western highlands, and the eastern Badia spanning altitudes from approximately 400 m below mean sea level at the Dead Sea in the west, to around 1854 m above mean sea level at Jabal Um Addami Mountain in the south.
Jordan is a semi-arid and drought-prone country. Precipitation ranges from approximately 500 mm in the highlands to less than 50 mm in the eastern Badia. Jordan’s landscape is reflected in its rich and diverse ecosystems as it encompasses four different bio-geographical zones, which are: the Mediterranean, Irano-Turanian, Saharo-Arabian, and the Sudanian penetration, transforming into thirteen different vegetation types [31].The highlands of Jordan have a Mediterranean climate which is characterized by hot dry summers with the long term mean maximum air temperature reaching up to 31.1 °C, and cool, wet winters with the long term mean minimum air temperature reaching 10.7 °C; Mediterranean climate occurs in the southern and eastern parts of the country.
The history of (PAs) planning in Jordan goes back to the first study on PAs which was carried out by the International Union for the Conservation of Nature IUCN and the World Wildlife Fund WWF in collaboration with the Royal Society for the Conservation of Nature RSCN in 1974. This study, also known as “John Clarke’s study” proposed 12 PAs to represent Jordan’s different ecosystems and landscapes, among which are Shaumari, Azraq, Ajloun, Mujib, Dana, and Wadi Rum PAs (RSCN). Twenty years later, in 1998, RSCN conducted the first review of protected areas in Jordan. In 2008, the Jordan Ministry of Environment published the “National Network of Protected Areas” report. The report included an update of the protected areas network using the CBD international criteria, with a proposed target to conserve 4% of Jordan’s 13 vegetation types [29]. Since the publishing of Jordan’s National Network of Protected Areas report in 2008, the network has undergone several updates. The National Network of Protected Areas currently consists of 12 designated sites with a total area of 4766 km2 and six proposed terrestrial sites (Figure 1) in addition to the marine reserve in Aqaba. The designated terrestrial protected areas cover around 5.3% of the country, exceeding the national coverage target.
As for biodiversity, in Jordan 2622 species of plants can be found, among which 100 are endemic, including the black iris (Iris nigricans). A total of 644 animal species have been recorded in Jordan, among which 83 are mammal species, including the globally threatened Nubian ibex (Capra nubiana) and the Arabian oryx (Oryx leucoryx). Jordan is also rich in avi-fauna due to its location along the Rift Valley, which is a major migratory bird route. Key bird species recorded in Jordan include the northern bald ibis (Geronticus eremita) and the sociable lapwing (Vanellus gregarious) [31].

3. Methods and Database

This study applied systematic conservation planning using a combination of open source and non-open-source software packages in different stages of assessment. ArcGIS 10.8.1 released in July 2020 by the Environmental Systems and Research Institute ESRI was used to prepare the input layers, and produce map layouts. Marxan, developed by the University of Queensland in Australia, is the most widely used conservation planning software and was used to perform the conservation planning analysis [14,15]. Marxan was designed to solve the minimum-set problem, where the goal is to achieve certain amounts of each biodiversity feature for the smallest cost [32]. It has several graphical user interfaces (GUI) and user-friendly plug-ins and toolboxes such as ArcMarxan python toolbox [33] and Zoning CLUZ for ArcView 3.x [34].
The methodology followed to apply Marxan conservation planning software consisted of the following steps:
1.
Preparation of planning units:
Jordan’s map was divided into planning units with a hexagon shape covering the whole country area. Each planning unit has the size of (8.9 km2). The planning units were created using the extension “Repeat shapes for ArcGIS 10.x” from Jenness Enterprises http://www.jennessent.com (accessed on 25 May 2019). The hexagon planning unit’s shapefile was superimposed with the boundaries of the established and proposed PAs. Each PA was considered as an individual planning unit and was not subdivided into hexagons. The resulting number of planning units totalled 9812.
2.
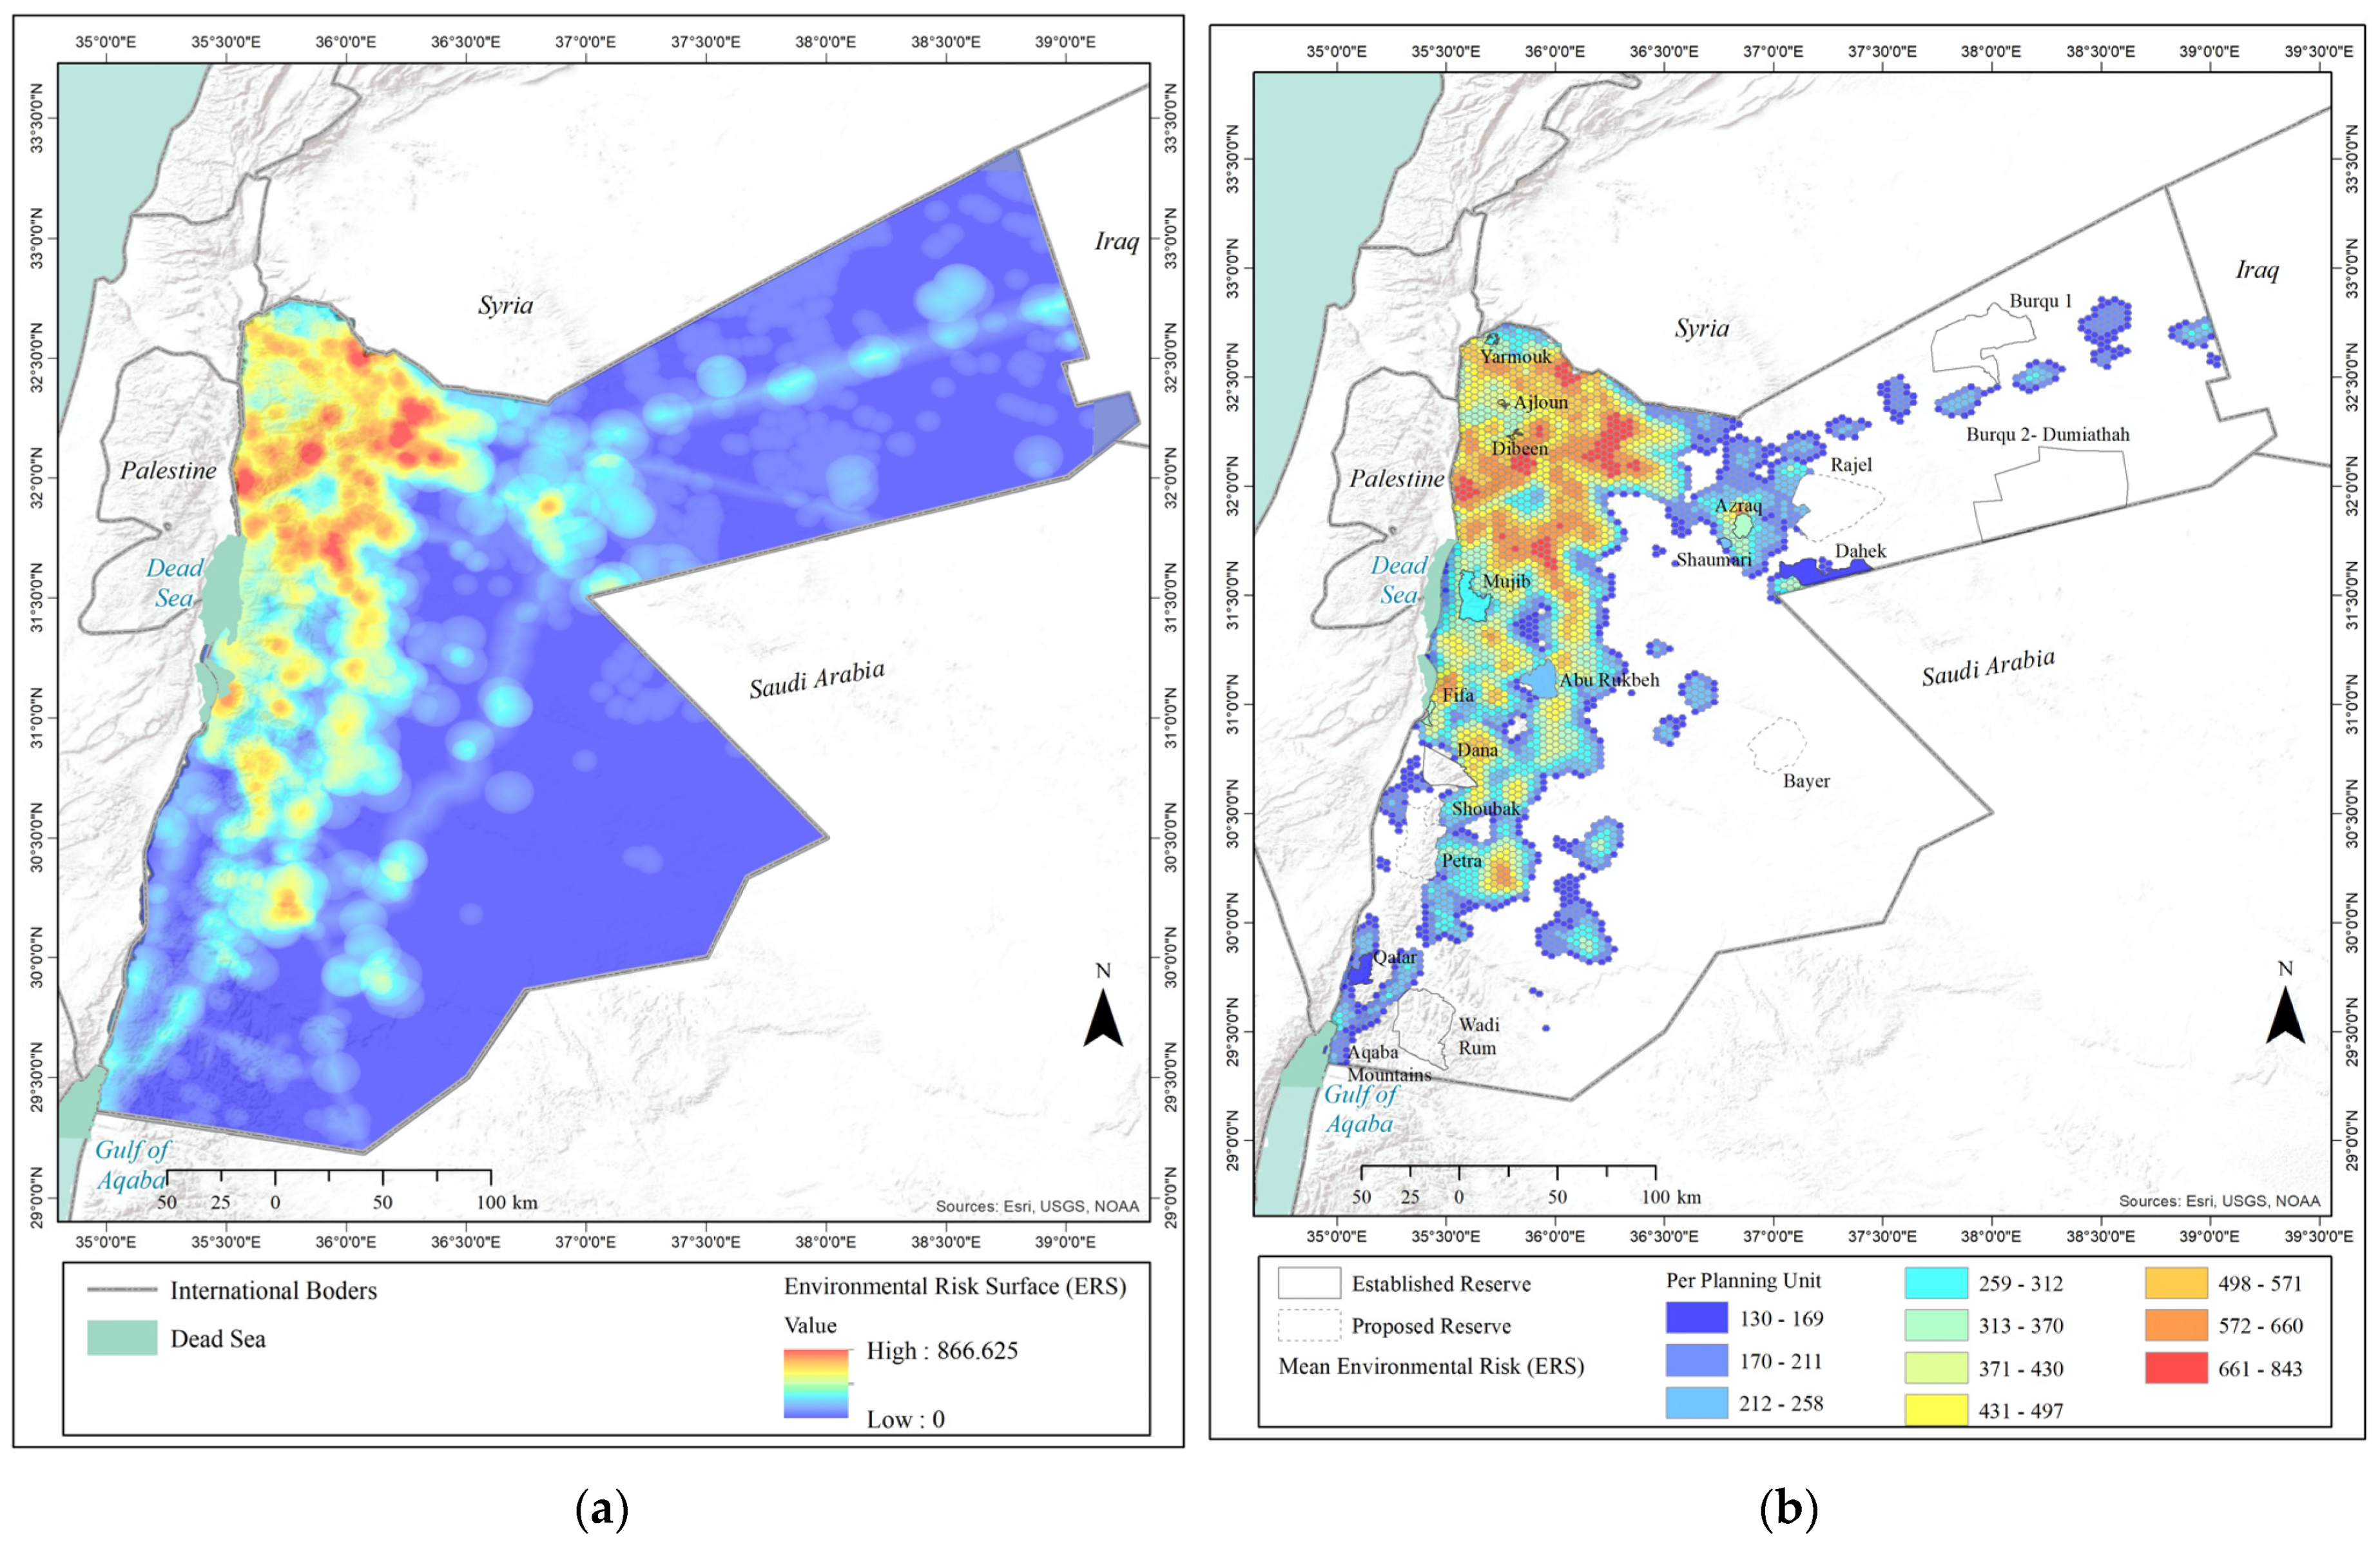
Identifying environmental risk surface (ERS):
ERS for this study was created using the “Protected Area Tools for ArcGIS” plug-in developed by the Nature Conservancy in 2008 [35]. In order to produce a modelled risk surface, each risk element was mapped individually, then all risk elements were combined. Each risk element was then assigned the following values: intensity value, influence distance, and distance decay function. ERS was applied in this study upon discussion with biodiversity and land use experts. Datasets included in the analysis and the parameters applied are described in Table 2. The overlay function that was used to combine the environmental risk from each risk factor was the “mean” function, whereas, the arithmetic average for the environmental risk is calculated, and all environmental risk layers were given the same weight, with a value of “1”.
3.
Calculating the relative biodiversity rareness index (RBI):
The RBI index calculation is complementary to the Marxan analysis. While Marxan analysis aims to identify the best solution for a protected area network design problem by having an efficient design that has representation of all targets, the Marxan solution might miss some planning units that have the highest remaining biodiversity elements. The RBI analysis was used to calculate the relative uniqueness or rareness of habitats across a study area and to quantify the area weighted relative contribution of each planning unit compared with the total distribution of each conservation target using the following equation as stated in [35]:
n   R B I = R B I R A I
where:
RBI: abundance (planning unit_)/abundance (study area)
RAI: area (plsnning unit)/area (study area)
The RBI was applied using PAT for ArcGIS. The tool requires the identification of the analysis domain (study area or analysis extent), in addition to the input layers representing the distribution of biodiversity targets such as the distributions of rare plants and animals (Table 3). The module calculated the index based on the overlaps of these biodiversity targets in the different planning units, and by comparing the area covered by each biodiversity target in each planning unit compared with its distribution across the whole analysis extent.
4.
Preparation of Marxan inputs and running Marxan:
The application of Marxan software to produce solutions for different scenarios for protected area networks includes several steps as follows:
I—Preparation of Marxan input files: Marxan uses a special file format with a specified structure, and has mandatory and optional files as shown in Table 4 below.
II—Data sources: Marxan input files were prepared and processed using ArcGIS 10.8.1. Three types of datasets were required to produce these input files: A datasets selected to prepare conservation features (conservation targets), which included: the vegetation types map, the distribution of threatened and key plant species, the distribution of endangered mammal species (obtained from the national Red list for Jordan); B datasets representing the cost of achieving conservation targets, and these include layers representing the limitations for conservation such as distribution of settlements and urban areas, distribution of development projects, major roads, and land use types; and C datasets representing types of existing designations, such as established and proposed protected areas, boundaries of special conservation areas, and boundaries of important bird areas, etc. (Table 5).
III—Application of the Marxan analysis scenarios based on conservation targets: Three main scenarios were applied for conservation features (targets):
Scenario 1 was applied referring to the national representation target proposed in the National network of protected areas report [29]. This scenario aimed to conserve 4% of each vegetation type in addition to 10% of the extent of occurrence of threatened mammals and plants. This national representation target is below the international target of 17% known as the AICHI target adopted globally for 2020 [36].
Scenario 2 aimed to conserve 17% of each vegetation type and 20% of the extent of occurrence of threatened plants and mammals. This scenario meets the AICHI biodiversity target for the year 2020.
Scenario 3 is a customized scenario that was planned with biodiversity and protected areas experts. It gives more weight to the less abundant habitats, and those that are most vulnerable to climate change, meanwhile, it gives less weight to the most abundant habitats and those that are less vulnerable to climate change. This scenario aimed to conserve 17% of each vegetation type except for forest vegetation types, which had the target of 30%, and the Hammada vegetation type which had the target of 4%, in addition to 10% of the extent of occurrence of threatened plants and mammals.
These three scenarios with their different representation targets for each conservation feature were reflected in the conservation feature file which reflected the proportion or percentage for the conservation features in each scenario.
IV—Running Marxan software: Arc Marxan toolbox was used to run Marxan in the ArcGIS environment [33].
V—Mapping the outputs: Output for each of the three analysis scenarios resulting from applying Marxan software was produced in “~.dat” file format. The “output.dat” file was displayed in ArcGIS and joined with the planning units using the planning unit ID field. The output contained one new field named “solution” with an integer value of “0” and “1”. Value “0” indicated that the corresponding planning unit was not part of the Marxan solution for this scenario, while the value “1” indicated that this planning unit was part of the Marxan solution for the scenario. The results and output maps were produced using ArcGIS 10.8.1 released in July 2020 by the Environmental Systems and Research Institute (ESRI).

4. Results

4.1. Environmental Risk Surfaces (ERS)

The environmental risk values ranged from 0 to 866.625, with 0 representing low risk and 866.625 representing high risk. The results of the environmental risk surface (ERS) analysis showed that the eastern part of the country—including the eastern desert—has relatively low ERS values except for some spots and fragments representing quarries, mining areas, and other industries. The highest ERS values were found in Zarqa, and eastern and southern Amman, with fragmented hotspots in Maan, Madaba, and Mafraq governorates. Figure 2a shows the resulting environmental risk surfaces in Jordan. Figure 2b shows the planning units that have above average ERS values (µERS = 130.3). These planning units include the western part of the country with fragmented hotspots in the eastern and southern desert. The total area of the planning units that had above average ERS values amounts 28,724 km2 representing 32% of the country.

4.2. Relative Biodiversity Index (RBI)

The relative biodiversity index (RBI) values ranged from 0 to 6.9, with 0 representing a low relative biodiversity index and 6.9 representing high relative biodiversity index. Figure 3a shows that high relative biodiversity index values were clustered around established protected areas and some of the proposed protected areas. Additionally, the rift valley and rift margins had relatively high RBI scores compared with the eastern and southern desert. Figure 3b shows the areas that had above average relative biodiversity index RBI scores (µRBI = 0.010). All established protected areas had above average RBI, while some of the proposed protected areas such as Bayer, Abu Rukbeh, and the Aqaba Mountains had below average RBI. The total area of the planning units in the country which scored above average RBI amounts was 11,412 km2 representing only 13% of the country.

4.3. Marxan Analysis

Marxan analysis for the three introduced scenarios provided different results according to the parameters and targets set for each scenario. The section below provides a detailed description of the results of each scenario:
Scenario 1 aimed to conserve 4% of each vegetation type and 10% of the extent of occurrence of threatened mammals and plants. Table 6 shows the representation percentage of each vegetation type in the resulting solution compared with the total area of the vegetation type in Jordan. The table shows that the resulting representation percentages ranged between 4.1% for the Mediterranean non-forest vegetation to 36.9% for the sand dune vegetation. This range indicates that this scenario met the minimum representation target of 4%, while some vegetation types achieved well above the target as they were either already over-represented in the current established PAs or because it was necessary to increase the representation as they fell within the extent of occurrence for threatened plants and mammals.
Figure 4a shows the currently established protected areas (green) with the additional areas proposed for conservation resulting from the Marxan (red). From the figure it is obvious that this scenario proposes minor extension of a number of established protected areas including Yarmouk, Dibeen, Dana, and Burqu. It also suggested to include two of the currently proposed protected areas (i.e., Abu Rukbeh and Shoubak), while other currently proposed protected areas (i.e., Bayer, Rajel, Petra, and the Aqaba Mountains) did not appear in the Marxan solution results.
Scenario 1 mainly focused on enhancing the representation of Hammada and Mediterranean non-forest vegetation to meet the 4% representation target in addition to wildlife corridors and the overlapping extents of occurrence of threatened plants and mammals. A total of 524 planning units with a spatial extent of 9164 km2 representing 10% of the total area of the country were included in Marxan’s solution for scenario 1.
Scenario 2 aimed to conserve 17% of each vegetation type and 20% of the extent of occurrence of threatened plants and mammals. Table 7 shows the representation percentage of each vegetation type in the resulting solution compared with the total area of the vegetation type in Jordan. The table shows that the resulting representation percentages ranged between 16.8% for the saline vegetation to 37.2% for the sand dune vegetation. This shows that this scenario met the minimum representation target of 17%, while some vegetation types achieved well above the target as they were already over-represented in the current established PAs.
Figure 4b shows the established protected areas with the additional areas proposed for conservation. Marxan’s solution for scenario 2 proposed extensions to several established protected areas including Yarmouk, Ajloun, Dibeen, Dana, and minor extension to Wadi Rum, Fifa, and Mujib. This scenario also included three of the currently proposed protected areas in the final solution: Abu Rukbeh, Shoubak, and Petra. Three of the currently proposed protected areas did not appear in the final solution: Rajel, Aqaba Mountains, and Bayer.
The scenario 2 solution focused on extending the boundaries of forest reserves, and increasing the representation of the Hammada in areas that are less exposed to environmental risk. This solution included 1471 planning units with a total area of 17,948 km2 representing 20% of the country.
Scenario 3 aimed to conserve 17% of each vegetation type except for forest vegetation types, which had the target of 30%, and the Hammada vegetation type which had the target of 4%, in addition to 10% of the extent of occurrence of threatened plants and mammals. Table 8 shows the representation percentage of each vegetation type in the resulting solution which ranged between 8.8% for the Hammada vegetation to 36.4% for the sand dune vegetation.
Figure 4c shows the established protected areas with the additional areas proposed for conservation according to this solution. Marxan’s solution for scenario 3 proposed extensions to most of the currently established and proposed nature reserves, including Yarmouk, Ajloun, Dibeen, Mujib, Fifa, Dana, Qatar, and Wadi Rum. This solution also included two of the currently proposed protected areas, namely, Shoubak and Petra, while four of the currently proposed protected areas, namely, Abu Rukbeh, Rajel, Aqaba Mountains, and Bayer did not appear in the solution. This solution also suggested connecting Dana with Shoubak and Petra proposed reserves through a conservation corridor.
The solution for the third scenario focused on extending the boundaries of forest reserves, while slightly increasing the representation of Hammada in areas that are less exposed to environmental risk factors and where extents of occurrence for different species overlapped. This solution includes 675 planning units with a total area of 10,423 km2 representing 12% of the country.

5. Discussion

The paper addresses representation gaps in the current protected areas network compared with the national and global representation targets and provides solutions for addressing these gaps. It is a contribution in putting Jordan in alignment with the international trends and best practices in protected area system design, and will provide potential for showcasing Jordan as a unique case study in the region [37]. Previous proposals and reviews for protected areas networks in Jordan did not apply the principles of systematic conservation planning, and the target for conservation areas was based merely on vegetation representation without having any target for conserving certain percentages of the extent of occurrence for individual target species. Previous assessments included mapping the boundaries of individual protected areas based on field observations and land use and land tenure data, using available maps and without considering the PA design principles that are addressed through systematic conservation planning. Principles such as minimizing the overall boundary cost of PAs, adjacency of planning units, and targets for species range representations were not explicitly addressed in these assessments [31].
Previous efforts, however, applied PA selection criteria after the boundaries of each protected area were developed for the purpose of identifying eligible PAs and for identifying site priority for establishment. Systematic conservation planning, however, provides solutions for the planning units that should be included in the PA network formulating proposed boundaries or extensions to existing PAs to meet certain conservation targets. Thus, GIS-based systematic conservation planning techniques were applied to the area of Jordan using updated biodiversity data and a combination of targets covering both vegetation types and species extents.
Marxan was applied in this research for three different scenarios. Although each of these scenarios provided a different result, they all suggested to extend the boundaries of existing reserves to achieve the conservation targets. Some currently proposed protected areas, such as the Aqaba Mountains, Rajel, and Bayer did not appear in any of the solutions for the three scenarios, which indicates that the inclusion of these sites in the proposed PA network should be reconsidered. The respective outcomes of the three different scenarios all highlight the importance of having conservation areas between the western and eastern parts of the country. Although each scenario-related result has a different proposal to the extension, all outcomes emphasize that some sort of conservation action should be assigned to the planning units that connect the protected areas in the western part of the country and the protected areas in the eastern part of the country.
Scenario 2 is the only one that achieves the AICHI representation target for Jordan; however, this scenario suggests a considerable increase in the areas of the PAs and might not be applicable in the short term. It is proposed to take Marxan’s solution for scenario 2 as a long-term target that could be reviewed and updated based on the new Global Biodiversity Targets, and the Post-2020 Global Biodiversity Framework.
Marxan’s solution for scenario 3, which was a customized scenario, gives preference to the forest types which are less abundant compared with other vegetation types in the country, by increasing the representation target and assigning a high species penalty factor for forest vegetation types. These outcomes applying a customised scenario are also able to accommodate that highly abundant vegetation types such as Hammada may not need to have high representation targets. The outcomes provided by Marxan’s solution for scenario 3 are the ones preferred by the authors under the current conditions, which are:
  • Forest vegetation types are among the most restricted vegetation types in Jordan, and forest vegetation types represent less than 1% of the total area of the country;
  • Forest vegetation types, especially in northern Jordan, are among the most climate vulnerable ecosystems in Jordan according to Jordan’s Third National Communication on Climate Change [38];
  • About 65% of forest cover in northern Jordan might be converted to agricultural lands, built up areas, and other types of landcover according to an unpublished study by RSCN, so higher representation target for forest vegetation types would be preferred;
  • The Hammada vegetation type is the most abundant in the country with a total area of 66,394 km2 representing 74% of the country, therefore, a lower representation target is proposed.
The size of the planning units was one of the factors that might have affected the quality of the results for this planning exercise. The study area, which was the total terrestrial area of Jordan, was divided into 9812 hexagon planning units, each with an area of 8.9 km2. The hexagon planning units were updated with the boundaries of existing established protected areas in order to have them locked within any proposed solution for the PAs network. Smaller planning units would have been preferred but due to the large number of planning units needed to cover the whole study area, we decided to keep the number of planning units below 10,000 for an optimized run of the analysis, and to avoid having the software crash due to a larger number of planning units [34].
Our approach in conservation planning and to outline protected areas for Jordan comes in parallel to the global efforts to agree on the post-2020 Global Biodiversity Framework [39]. This framework is expected to set new biodiversity conservation targets including setting a new representation target for protected areas. Jordan set its national protected area representation of 4% in 2008, which is already behind the current global target for the representation of terrestrial PAs which is 17% of each habitat or ecosystem. If the post-2020 Global Biodiversity Framework succeeds to set new targets for the terrestrial PAs representation, the gap for Jordan to meet the new targets will increase and the planning challenge will become even more complicated. Integrating higher representation targets for terrestrial PAs will help to prepare Jordan for the new challenging targets of the Post-2020 Global Biodiversity Framework and may contribute in reducing the gaps between the current national target and the expected post-2020 PAs representation target. The expected impacts of climate change on Jordan’s biodiversity and ecosystems according to the Third National Communication (TNC) report on climate change include forest die back and expansion of drier biomes into marginal lands with forest and water ecosystems being identified as priority for climate adaptation actions [38]. Jordan’s Intended Nationally Determined Contribution (INDC) document has called for a review of protected areas as one of the top priority adaptation measures for the biodiversity and ecosystems sector. The review of the national protected areas network was planned to aim at identifying and validating climate-vulnerable ecosystems, extending conservation efforts in PA surroundings, and designing buffer zones as deemed necessary for strengthening the adaptive capacities of key ecological hotspots by 2020 [31]. The current research is in alignment with the measures identified in the INDC as it has identified a higher conservation target for forest ecosystems. This analysis has also followed the principles of conservation planning which give priority to extend existing PAs and propose corridors which could be integrated within different governance types for protected areas.
A similar study in Guyana showed that systematic conservation planning can be used to apply scientifically sound principles and criteria with the flexibility to adapt the criteria to the national context [7]. Other larger scale studies tested the systematic conservation approach for regional scale analysis such as the whole Arabian Peninsula, while the acquisition of high quality and homogeneous data was a limiting factor affecting the results of the analysis [27]. Göke et al. (2018) found that the application of scenarios in Marxan can be useful for the identification of alternatives for development projects in maritime spatial planning.

6. Recommendations and Conclusions

Marxan is a powerful decision support tool that can be applied to solve complex conservation planning problems, however, the power and effectiveness of Marxan largely depends on the quality and availability of input data [13]. The two main limitations for this research were the quality of available input data, and the maximum number of planning units that could be used to run Marxan efficiently. The analysis could have been considerably improved by applying input datasets with higher quality than available (see Table 5). The main dataset that needs to be improved is the one on the spatial distribution of vegetation types which is the base for calculating the representation target. The spatial and temporal resolution of the input data such as reptiles and birds is also a key factor in determining the quality of Marxan solutions [40].
Application of different scenarios offers options for discussion with decision makers and allows for developing short- and long-term targets for the protected area systems. The study provides three solutions based on the implementation of three scenarios, each meeting different pre-set targets. Although suggestions based on applying scenario 1 seem to be relatively easily achievable as it resembles the current status of established and proposed protected areas network, the authors recommend to adopt the solution provided by scenario 3. Marxan solution for scenario 3 has many advantages as it considered the abundance of vegetation types and assigned higher targets to forest vegetation types which have a restricted distribution range in Jordan, and which have high vulnerability to projected impacts of climate change. Marxan’s solution for scenario 3, which will achieve an overall coverage percentage of 12% for protected areas compared with the total area of the country, could be identified as a medium-term target for Jordan. Its implementation will reduce the gap between the current national target of 4% and the current AICHI target of 17% for terrestrial habitats and ecosystems.
Systematic conservation planning should be promoted in the Arab and west Asia regions since different countries are currently using different methods that are mostly ad hoc methods for designing protected area networks. Applying this approach on a regional scale with high quality data will allow for identifying priority areas for conservation across the boundaries of neighbouring countries and will provide the opportunity for the proposal of cross border PAs (data are available from the first author upon request).

Author Contributions

Conceptualization, N.B.; methodology, N.B., N.A.-O. and S.A.S.; validation, N.A.-O.; formal analysis, N.B.; investigation, N.B. and S.A.S.; data curation, N.B.; writing—original draft preparation, S.A.S. and N.B.; writing—review and editing, W.S. and B.S.; and project administration, S.A.S., W.S., and B.S. All authors have read and agreed to the published version of the manuscript.

Funding

The publication of this article was funded by Freie Universität Berlin.

Data Availability Statement

The data presented in this study are available on request from the first author.

Acknowledgments

We are grateful to the Royal Society for the Conservation of Nature (RSCN), the Jordanian Ministry of Environment, and The International Union for Conservation of Nature, Regional Office for West Asia IUCN ROWA, for sharing data with us. A heartfelt thanks to the Department of Physical Geography at the Freie Universität Berlin for all support and the integration of this work within the activities of the project “Geo-IT The Technology of Data Acquisition for Sustainable Development and Crisis Management”, funded by the German Academic Exchange Service, DAAD.

Conflicts of Interest

The authors declare no conflict of interest. The roles in the design of the study; in the collection, analyses, or interpretation of data; in the writing of the manuscript, and the decision to publish the results are solely by the authors.

References

  1. Dudley, N. Guidelines for Applying Protected Area Management Categories; IUCN: Gland, Switzerland, 2008. [Google Scholar]
  2. Díaz, S.M.; Settele, J.; Brondízio, E.; Ngo, H.; Guèze, M.; Agard, J.; Arneth, A.; Balvanera, P.; Brauman, K.; Butchart, S.; et al. The Global Assessment Report on Biodiversity and Ecosystem Services: Summary for Policy Makers; Intergovernmental Science-Policy Platform on Biodiversity and Ecosystem Services: Bonn, Germany, 2019. [Google Scholar]
  3. Villa, F.; Tunesi, L.; Agardy, T. Zoning Marine Protected Areas through Spatial Multiple-Criteria Analysis: The Case of the Asinara Island National Marine Reserve of Italy. Conserv. Biol. 2002, 16, 515–526. [Google Scholar] [CrossRef]
  4. Suffling, R.; Grant, A.; Feick, R. Modeling prescribed burns to serve as regional firebreaks to allow wildfire activity in protected areas. For. Ecol. Manag. 2008, 256, 1815–1824. [Google Scholar] [CrossRef]
  5. Damhoureyeh, S.; Disi, A.; Al-Khader, I.; Abu-Dieyeh, M.H. Development of a zoning management plan for petra archaeological park (PAP), Jordan. Nat. Sci. 2011, 3, 1040–1049. Available online: https://www.scirp.org/html/9235.html (accessed on 15 June 2019). [CrossRef] [Green Version]
  6. Ohadi, S.; Dorbeiki, M.; Bahmanpour, H. Ecotourism zoning in protected areas using GIS. Adv. Environ. Biol. 2013, 677–684. Available online: https://go.gale.com/ps/i.do?id=GALE%7CA343258994&sid=googleScholar&v=2.1&it=r&linkaccess=abs&issn=19950756&p=AONE&sw=w&userGroupName=anon%7Ece910202 (accessed on 29 November 2021).
  7. Bicknell, J.E.; Collins, M.B.; Pickles, R.S.; McCann, N.P.; Bernard, C.R.; Fernandes, D.J.; Miller, M.G.; James, S.M.; Williams, A.U.; Struebig, M.J.; et al. Designing protected area networks that translate international conservation commitments into national action. Biol. Conserv. 2017, 214, 168–175. [Google Scholar] [CrossRef]
  8. Boulad, N. The use of multi-criteria evaluation and expert knowledge in developing protected area zoning plans in Jordan. Jordan J. Nat. Hist. 2014, 1, 165–180. Available online: https://www.rscn.org.jo/use-multi-criteria-evaluation-and-expert-knowledge-developing-protected-area-zoning-plans-jordan (accessed on 17 August 2019).
  9. Al-Bakri, J.T.; Taylor, J.C. Application of NOAA AVHRR for monitoring vegetation conditions and biomass in Jordan. J. Arid Environ. 2003, 54, 579–593. [Google Scholar] [CrossRef] [Green Version]
  10. Howari, F.M.; Jordan, B.R.; Bouhouche, N.; Wyllie-Echeverria, S. Field and Remote-Sensing Assessment of Mangrove Forests and Seagrass Beds in the Northwestern Part of the United Arab Emirates. J. Coast. Res. 2009, 251, 48–56. [Google Scholar] [CrossRef]
  11. Chebud, Y.; Naja, G.M.; Rivero, R.G.; Melesse, A.M. Water Quality Monitoring Using Remote Sensing and an Artificial Neural Network. Water Air Soil Pollut. 2012, 223, 4875–4887. Available online: https://link.springer.com/article/10.1007/s11270-012-1243-0 (accessed on 16 November 2019). [CrossRef]
  12. Makhamreh, Z. Derivation of vegetation density and land-use type pattern in mountain regions of Jordan using multi-seasonal SPOT images. Environ. Earth Sci. 2018, 77, 1–12. Available online: https://idp.springer.com/authorize/casa?redirect_uri=https://link.springer.com/article/10.1007/s12665-018-7534-z&casa_token=8mjieeie22maaaaa:rcy-vdvg3-ak9-spawmom_dzwukluq4u1yrpfrlkvj2qf9xll5lxixe_bewxe77ygaxweqyp0pw31p63 (accessed on 1 February 2020). [CrossRef]
  13. Watts, M.E.; Stewart, R.R.; Martin, T.G.; Klein, C.J.; Carwardine, J.; Possingham, H.P. Systematic Conservation Planning with Marxan. In Learning Landscape Ecology; Springer: New York, NY, USA, 2017. [Google Scholar]
  14. Moilanen, A.; Wilson, K.; Possingham, H. Spatial Conservation Prioritization: Quantitative Methods and Computational Tools; Oxford University Press: Oxford, UK, 2009. [Google Scholar]
  15. Ball, I.R.; Possingham, H.P. MARXAN (V1.8.2). Marine Reserve Design Using Spatially Explicit Annealing, a Manual. 2000. Available online: https://courses.washington.edu/cfr590/software/Marxan1810/marxan_manual_1_8_2.pdf (accessed on 29 November 2021).
  16. Possingham, H.; Ball, I.; Andelman, S. Mathematical methods for identifying representative reserve networks. In Quantitative Methods for Conservation Biology; Springer: Berlin/Heidelberg, Germany, 2000. [Google Scholar]
  17. Margules, C.R.; Pressey, R.L. Systematic conservation planning. Nature 2000, 405, 243–253. Available online: https://www.nature.com/articles/35012251?report=reader (accessed on 30 August 2019).
  18. Knight, A.T.; Driver, A.; Cowling, R.M.; Maze, K.; Desmet, P.G.; Lombard, A.T.; Rouget, M.; Botha, M.A.; Boshoff, A.F.; Castley, J.G.; et al. Designing systematic conservation assessments that promote effective implementation: Best practice from South Africa. Conserv. Biol. J. Soc. Conserv. Biol. 2006, 20, 739–750. [Google Scholar] [CrossRef]
  19. Hermoso, V.; Kennard, M.J.; Linke, S. Integrating multidirectional connectivity requirements in systematic conservation planning for freshwater systems. Divers. Distrib. 2012, 18, 448–458. [Google Scholar] [CrossRef] [Green Version]
  20. Levin, N.; Mazor, T.; Brokovich, E.; Jablon, P.E.; Kark, S. Sensitivity analysis of conservation targets in systematic conservation planning. Ecol. Appl. 2015, 25, 1997–2010. [Google Scholar] [CrossRef]
  21. Groves, C.R.; Game, E.T.; Anderson, M.G.; Cross, M.; Enquist, C.; Ferdaña, Z.; Girvetz, E.; Gondor, A.; Hall, K.R.; Higgins, J.; et al. Incorporating climate change into systematic conservation planning. Biodivers. Conserv. 2012, 21, 1651–1671. Available online: https://link.springer.com/article/10.1007/s10531-012-0269-3 (accessed on 18 September 2019). [CrossRef]
  22. Lessmann, J.; Muñoz, J.; Bonaccorso, E. Maximizing species conservation in continental Ecuador: A case of systematic conservation planning for biodiverse regions. Ecol. Evol. 2014, 4, 2410–2422. [Google Scholar] [CrossRef] [PubMed]
  23. Levin, N.; Coll, M.; Fraschetti, S.; Gal, G.; Giakoumi, S.; Göke, C.; Heymans, J.J.; Katsanevakis, S.; Mazor, T.; Öztürk, B.; et al. Biodiversity data requirements for systematic conservation planning in the Mediterranean Sea. Mar. Ecol. Prog. Ser. 2014, 508, 261–281. [Google Scholar] [CrossRef] [Green Version]
  24. Picone, F.; Buonocore, E.; D’Agostaro, R.; Donati, S.; Chemello, R.; Franzese, P.P. Integrating natural capital assessment and marine spatial planning: A case study in the Mediterranean sea. Ecol. Model. 2017, 361, 1–13. [Google Scholar] [CrossRef]
  25. Mendoza-Fernández, A.; Pérez-García, F.J.; Martínez-Hernández, F.; Medina-Cazorla, J.M.; Garrido-Becerra, J.A.; Merlo Calvente, M.E.; Guirado Romero, J.S.; Mota, J.F. Threatened plants of arid ecosystems in the Mediterranean Basin: A case study of the south-eastern Iberian Peninsula. Oryx 2014, 48, 548–554. [Google Scholar] [CrossRef] [Green Version]
  26. Giakoumi, S.; Sini, M.; Gerovasileiou, V.; Mazor, T.; Beher, J.; Possingham, H.P.; Abdulla, A.; Çinar, M.E.; Dendrinos, P.; Gucu, A.C.; et al. Ecoregion-based conservation planning in the Mediterranean: Dealing with large-scale heterogeneity. PLoS ONE 2013, 8, e76449. Available online: https://journals.plos.org/plosone/article?id=10.1371/journal.pone.0076449 (accessed on 4 September 2019).
  27. Holness, S.; Knight, M.; Sorensen, M.; Othman, Y.R.A. Towards a systematic conservation plan for the Arabian Peninsula. Zool. Middle East 2011, 54 (Suppl. 3), 197–208. [Google Scholar] [CrossRef] [Green Version]
  28. Lamine, E.B.; Mateos-Molina, D.; Antonopoulou, M.; Burt, J.A.; Das, H.S.; Javed, S.; Muzaffar, S.; Giakoumi, S. Identifying coastal and marine priority areas for conservation in the United Arab Emirates. Biodivers. Conserv. 2020, 29, 2967–2983. [Google Scholar] [CrossRef]
  29. Ministry of Environment. The National Network of Protected Areas; Ministry of Environment: Amman, Jordan, 2008.
  30. Boulad, N.; Hamidan, N. The use of a GIS-based multi-criteria evaluation technique for the development of a zoning plan for a seasonally variable Ramsar wetland site in Syria: Sabkhat Al-Jabboul. Wetl. Ecol. Manag. 2018, 26, 253–264. Available online: https://idp.springer.com/authorize/casa?redirect_uri=https://link.springer.com/article/10.1007/s11273-017-9568-5&casa_token=b2j2w-jq5wgaaaaa:uu-amrlovyntye-x8s5ix97z2tjkrmojmrfsd1djhru7ttqcridabpwcryqbrayxs1yagxfntr1nxufs (accessed on 4 September 2019). [CrossRef]
  31. Ministry of Environment. National Biodiversity Strategy and Action Plan; Ministry of Environment: Amman, Jordan, 2015.
  32. McDonnell, M.D.; Possingham, H.P.; Ball, I.R.; Cousins, E.A. Mathematical methods for spatially cohesive reserve design. Environ. Model. Assess. 2002, 7, 107–114. [Google Scholar] [CrossRef]
  33. Apropos Information Systems Inc. ArcMarxan Toolbox. 2019. Available online: https://aproposinfosystems.com/en/ (accessed on 29 November 2021).
  34. Game, E.T.; Grantham, H.S. Marxan User Manual: For Marxan Version 1.8.10; University of Queensland: St. Lucia, Australia; Pacific Marine Analysis and Research: Victoria, BC, Canada, 2008. [Google Scholar]
  35. Schill, S.; Raber, G. Protected Area Tools (PAT) for ArcGIS 9.3, User Manual and Tutorial. 2009. Available online: http://www.mesmacentralexchange.eu/tools/tool/8/pat.html (accessed on 29 November 2021).
  36. Smith, R.J.; Goodman, P.S.; Matthews, W.S. Systematic conservation planning: A review of perceived limitations and an illustration of the benefits, using a case study from Maputaland, South Africa. Oryx 2006, 40, 400–410. [Google Scholar] [CrossRef]
  37. Dudley, N.; Shadie, P.; Stolton, S. (Eds.) Guidelines for Applying Protected Area Management Categories including IUCN WCPA Best Practice Guidance on Recognising Protected Areas and Assigning Management Categories and Governance Types; Best Practice Protected Area Guidelines Series; IUCN: Gland, Switzerland, 2013; Volume 21. [Google Scholar]
  38. Ministry of Environment. Jordan’s Third National Communication on Climate Change; Ministry of Environment: Amman, Jordan, 2014.
  39. Bhola, N.; Klimmek, H.; Kingston, N.; Burgess, N.D.; van Soesbergen, A.; Corrigan, C.; Harrison, J.; Kok, M.T.J. Perspectives on area-based conservation and its meaning for future biodiversity policy. Conserv. Biol. 2021, 35, 168–178. [Google Scholar] [CrossRef] [PubMed] [Green Version]
  40. Göke, C.; Dahl, K.; Mohn, C. Maritime Spatial Planning supported by systematic site selection: Applying Marxan for offshore wind power in the western Baltic Sea. PLoS ONE 2018, 13, e0194362. Available online: https://journals.plos.org/plosone/article?id=10.1371/journal.pone.0194362 (accessed on 8 September 2020). [CrossRef]
Figure 1. Current status of the national network of protected areas in Jordan.
Land 11 00056 g001
Figure 2. (a) The environmental risk surface ERS; (b) planning units with above mean environmental risk surface ERS values.
Land 11 00056 g002
Figure 3. (a) Relative biodiversity index RBI; (b) planning units with above average RBI values.
Land 11 00056 g003
Figure 4. Marxan solution: (a) for scenario 1; (b) for scenario 2; and (c) for scenario 3.
Land 11 00056 g004
Table 1. The representation percentages for the established and proposed PAs under the current conditions.
Vegetation TypeArea in Jordan km2Representation Percentage in Established and Proposed PasRepresentation Percentage in Established PAs
Acacia and rocky Sudanian2599.4416.16.93
Deciduous oak forest425.923.83.84
Evergreen oak forest747.471.31.30
Hammada vegetation66,393.977.25.21
Juniperus forest283.9727.40.68
Mediterranean non-forest4590.263.72.20
Mudflat631.6923.723.73
Pine forest105.906.36.29
Saline vegetation1055.813.73.68
Sand dune vegetation1300.7434.734.49
Steppe vegetation9672.717.32.56
Tropical vegetation451.1711.611.62
Water vegetation656.796.15.86
Table 2. Datasets used in producing ERS with corresponding parameters in this study.
Risk ElementGeometry TypeIntensity ValueInfluence Distance (m)Risk Element
Development projects, central licensing committee database
https://jo.chm-cbd.net/, accessed on 16 January 2020
Points1005000Concave
Development projects, environmental impact assessment database
https://jo.chm-cbd.net/, accessed on 16 January 2020
Points1005000Concave
Major roads https://www.arcgis.com/index.html, accessed on 25 December 2019Lines802000Convex
Minor roads https://www.arcgis.com/index.html, accessed on 25 December 2019Lines60500Convex
Negative land use types
https://jo.chm-cbd.net/, accessed on 16 January 2020
Polygons1001000Concave
Table 3. The layers used to create the RBI in this study.
Layer NameGeometry TypeSource
Threatened plants’ extent of occurrencePolygonshttps://jo.chm-cbd.net/biodiversty/species-diversity/flora-jordan (accessed on 12 December 2019)
Threatened mammals’ extent of occurrencePolygonshttps://portals.iucn.org/library/node/49117 (accessed on 15 October 2020)
Distribution of all recorded plantsPointshttps://www.gbif.org/ (accessed on 30 January 2020)
Distribution of all recorded birdsPointshttps://www.gbif.org/ (accessed on 30 January 2020)
Distribution of all recorded animalsPointshttps://www.gbif.org/ (accessed on 30 January 2020)
Vegetation typePolygonhttp://bims.rscn.org.jo (accessed on 23 December 2019)
Table 4. Marxan input files, their default names [35].
Nr.Input File NameShort Name
1Planning unit filePu.dat
2Input parameter fileInput.dat
3Conservation feature fileSpec.dat
4Planning unit versus conservation feature filepuvspr.dat
5Boundary length fileBound.dat
Table 5. Datasets included in preparing Marxan input files in this study.
Nr.DatasetSourceDate
ABiodiversity features and conservation values
1Vegetation typeshttp://bims.rscn.orgAccessed on 23 December 2019
2Locations of threatened plantshttp://bims.rscn.orgAccessed on 12 December 2019
3Nationally red listed mammalshttps://portals.iucn.org/library/node/49117Accessed on 15 October 2020
4Distributions of species using Global Biodiversity Information Facility Database (GBIF)https://www.gbif.org/Accessed on 30 January 2020
BDatasets representing land use, threats, and limitations to biodiversity
5Locations of development projectshttps://jo.chm-cbd.net/Accessed on 16 January 2020
6Land use/land cover mapRoyal Jordanian Geographic Centre RJGCAccessed on 15 December 2008
7Major roadshttps://www.arcgis.com/index.htmlAccessed on 25 December 2019
CExisting designations
8Established and proposed protected areashttp://bims.rscn.org.joAccessed on 16 January 2020
9Special Conservation Areas SCAshttp://bims.rscn.org.joAccessed on 16 January 2020
10Key Biodiversity Areas KBAshttp://bims.rscn.org.joAccessed on 16 January 2020
11Important Bird Areas IBAshttp://bims.rscn.org.joAccessed on 16 January 2020
12Important Plant Areas IPAshttp://bims.rscn.org.joAccessed on 16 January 2020
13Forestry lands (Haraj lands)http://bims.rscn.org.joAccessed on 16 January 2020
Table 6. The area and representation percentage of each vegetation type in solution for scenario 1.
Vegetation TypeArea Covered in Scenario (km2)Total Area (km2)Representation Percentage
Acacia and rocky Sudanian233.012599.449.0
Deciduous oak forest66.83425.9215.7
Evergreen oak forest36.91747.474.9
Hammada vegetation7123.6566,393.9710.7
Juniperus forest14.57283.975.1
Mediterranean non-forest187.994590.264.1
Mudflat149.89631.6923.7
Pine forest7.59105.907.2
Saline vegetation53.391055.815.1
Sand dune vegetation480.261300.7436.9
Steppe vegetation632.829672.716.5
Tropical vegetation57.25451.1712.7
Water vegetation75.15656.7911.4
Table 7. The area and representation areas and percentage of each vegetation type in solution for scenario 2.
Vegetation TypeArea Covered in Scenario 2 (km2)Total Area (km2)Representation Percentage
Acacia and rocky Sudanian447.222599.4417.2
Deciduous oak forest74.40425.9217.5
Evergreen oak forest128.89747.4717.2
Hammada vegetation13,642.8566,393.9720.5
Juniperus forest88.82283.9731.3
Mediterranean non-forest780.334590.2617.0
Mudflat197.13631.6931.2
Pine forest31.67105.9029.9
Saline vegetation177.751055.8116.8
Sand Dune vegetation483.441300.7437.2
Steppe vegetation1644.139672.7117.0
Tropical vegetation76.41451.1716.9
Water vegetation117.99656.7918.0
Table 8. The representation percentage of each vegetation type in solution for scenario 3.
Vegetation TypeArea Covered in Scenario 3 (km2)Total Area (km2)Representation Percentage
Acacia and rocky Sudanian639.262599.4424.6
Deciduous oak forest129.98425.9230.5
Evergreen oak forest229.52747.4730.7
Hammada vegetation5830.1066,393.978.8
Juniperus forest92.15283.9732.5
Mediterranean non-forest781.844590.2617.0
Mudflat151.13631.6923.9
Pine forest35.81105.9033.8
Saline vegetation178.511055.8116.9
Sand dune vegetation473.201300.7436.4
Steppe vegetation1642.369672.7117.0
Tropical vegetation78.33451.1717.4
Water vegetation117.20656.7917.8
Publisher’s Note: MDPI stays neutral with regard to jurisdictional claims in published maps and institutional affiliations.

