Article

The Influence of Land Use Evolution on the Visitor Economy in Wuhan from the Perspective of Ecological Service Value

1
School of Tourism and Hospitality Management, Hubei University of Economics, Wuhan 430205, China
2
Department of Marketing, Events and Tourism, Greenwich Business School, University of Greenwich, London SE10 9SL, UK
*
Author to whom correspondence should be addressed.
Submission received: 5 December 2021 / Revised: 17 December 2021 / Accepted: 19 December 2021 / Published: 21 December 2021
(This article belongs to the Special Issue Land Issues and Their Impact on Tourism Development)

Abstract

:
This research used transfer matrix, dynamic attitude, and a linear regression model to investigate the characteristics of land-use change and evolution of ecological service values and their impacts on Wuhan’s visitor economy. The results showed that: (1) the land-use scale in the Wuhan metropolitan area changed significantly from 1990 to 2018. The area of arable land, forest land, and grassland decreased at a faster rate, whereas that of water and construction land continued to increase; (2) there were differences in the dynamic attitudes of land-use at different stages. The dynamic attitude of construction land-use changed the most with cultivated land, water area, forest land, unused land, and grassland. From 1990 to 2005, land-use change exhibited a relatively gentle trend, whereas from 2005 to 2020, it accelerated; (3) although land-use regulation service, support service, and cultural service values positively responded to tourism economic growth, their influences were dissimilar. This study clarifies the effects of urban land-use on tourism economic development and provides a reference for its effective control.

1. Introduction

Land is an important natural resource and a spatial carrier of human economic and social activities, and ecology. Land-use change reflects the impact of human activities on the natural environment, causing changes in surface structure (i.e., water bodies, climate, and ecology) and affect the ecosystem service value (ESV). With the rapid development of tourism in China, the urban ESV caused by changes in land-use forms has a crucial impact on the development of the visitor economy. With rapid urbanization in China, natural landscapes, such as forests, grasslands, and water bodies, have been gradually replaced by construction [1]. The contradictions between urban construction and tourism resource protection have become increasingly noticeable. Tourism is an important component of urban economies. The relationship between land use and the visitor economy has received significant academic research attention. McMurry (1930) raised the issue of the relationship between tourism and land-use in his book “The Relationship between Recreational Activities and Land-use” [2]. Since then, the land use issues associated with tourism development have gradually become a popular topic for tourism researchers.
International scholars have analyzed the impacts of different types of tourism activities, such as leisure experiences, resorts, and sightseeing tours on land use patterns [3,4]. With the rapid development of urban tourism, Weaver (1993) developed a spatial model of land use in the urban tourism belt after studying its spatial structure. He took the urban core area as the tourism center and formed the urban, suburban, rural, and remote zones in its periphery, thus, forming a spatial land layout with complementary functions [5]. Due to population growth, increased disposable time and income, improved transport accessibility, and being driven by new policies and governance systems, the land used for tourism and recreation is changing. As a result, land use demand has gradually shifted to urban, rural, and coastal areas [6]. Tyrväinen et al. (2014) found that the land use development mode of tourist destinations has a significant impact on the environmental quality and tourist satisfaction with destinations [7]. A good ecological environment provides many opportunities for tourism development. Saha and Paul (2020) constructed a land use change matrix to identify land use/land cover change and found that cultivated land, vegetation cover, aquaculture, water bodies, and dunes around coastal tourist attractions are rapidly decreasing [8]. Agricultural lands, fallow areas, dunes, and vegetation have been cleared to make way for the establishment of hotels, resorts, and other tourism-related enterprises, thus, gradually transforming these areas into tourist zones. Hjalager (2020) investigated 213 land use conflicts in coastal tourism in Denmark and found that the issues causing tensions included construction and reconstruction, infrastructure transformation, and landscape transformation. These are the main contradictions between land use and tourism development [9].
In contrast, domestic scholars in China have had more of a focus on the study of urban land use patterns, with tourism and recreation functions at the core. Tourism is typically regarded as an effective way to promote economic growth in the coastal areas of developing countries. Wang (2013) took Sanya, a coastal area in the south of Hainan Island, to analyze the changes in land use patterns caused by tourism development and the huge pressure brought to the local ecological environment [10]. Du (2020) studied the relationship between land use change and red tourism in Jinggangshan, China’s red tourism base, and found that the demand for tourism infrastructure and service facilities increased, which promoted the conversion of forest and agricultural land to tourism. There are four tourism land use patterns, including integrated development, reach of scenic areas, traffic reach, and traditional town reach [11]. Wu (2001) provided a quantitative description of the spatial scope of urban tourism land use and explained the formation of land-use employing the extreme rent theory. He considered that the reason behind the formation of the ring-city recreation belt is that investors and tourists reach a compromise under the influence of land rent and travel costs [12]. Subsequently, more studies on the relationship between urban land use and tourism development have been conducted. All indicate that the relationship between urban land use and urban tourism is inseparable [11]. The development process of tourism activities is essentially a process of land use, which is also one of the major reasons for changes in land use patterns [13]. Tourism development has a direct or indirect impact on land use [14]. Especially, in cities where all economic activity revolves around tourism and tourism is the main industry, the demand for tourism land can become the driving force of urban land use change [15]. Chai (2021) studied the tourism driving force of land use change and found that tourism development was connected with regional land use change [16]. Campbell et al. (2005) studied the tourist land of different tourist destinations in Anhui Province and concluded that tourism development has led to evident changes in land use patterns in tourist areas and has become the main driving force of land use change in some [17]. Su (2011) found that tourism product development strategies led by eco-tourism, landscape leisure tourism, and agricultural tourism are conducive to local ecological environment protection and promote the continuous improvement of land ESVs [18]. Cao et al. (2021) determined that tourism economic development significantly impacts land use change [19]. The development of tourism and leisure has led to the rapid expansion of tourism facilities and construction land, reduction in cultivated land areas, and concentration of urban and tourism facilities land in areas rich in landscape resources [20].
Overall, it is indisputable that tourism development is one of the driving factors for urban land use change [21]. However, is the relationship between tourism development and land use only one-way? In particular, with the rapid advancement in urbanization and industrialization, will the changes in the spatial structure of urban land use also affect the development of the visitor economy? Will changes in urban land use directly determine or influence the levels of urban tourism economic development? Taking the Wuhan metropolitan area (the largest urban grouping in central China) as the example, this study analyzed scale change, dynamic attitude, and ecological value of land use using remote sensing images from 1990 to 2020 and explored the impact of land use changes on tourism economic development to provide a theoretical basis and practical guidance for urban tourism economic development and effective land use control.
The research contributions are as follows: (1) Most of the existing literature focuses on conflicts and contradictions between tourism and land use. There is a lack of research on the impact of land use on tourism economic development. Based on the perspective of ESV, this research examines the impacts of urban land use change on tourism development, representing an important supplement to the existing research literature; (2) a majority of the current research on land use change focuses on single cities, concentrating on the characteristics of change and influential factors, and the results are relatively rich. However, there are fewer studies on urban areas with river basins, and quantitative analyses of relationships between land use change and tourism development are minimal. Therefore, this research employed an econometric model to empirically test impacts, and the findings provides useful reference for the literature and future research.

2. Data Sources and Research Method
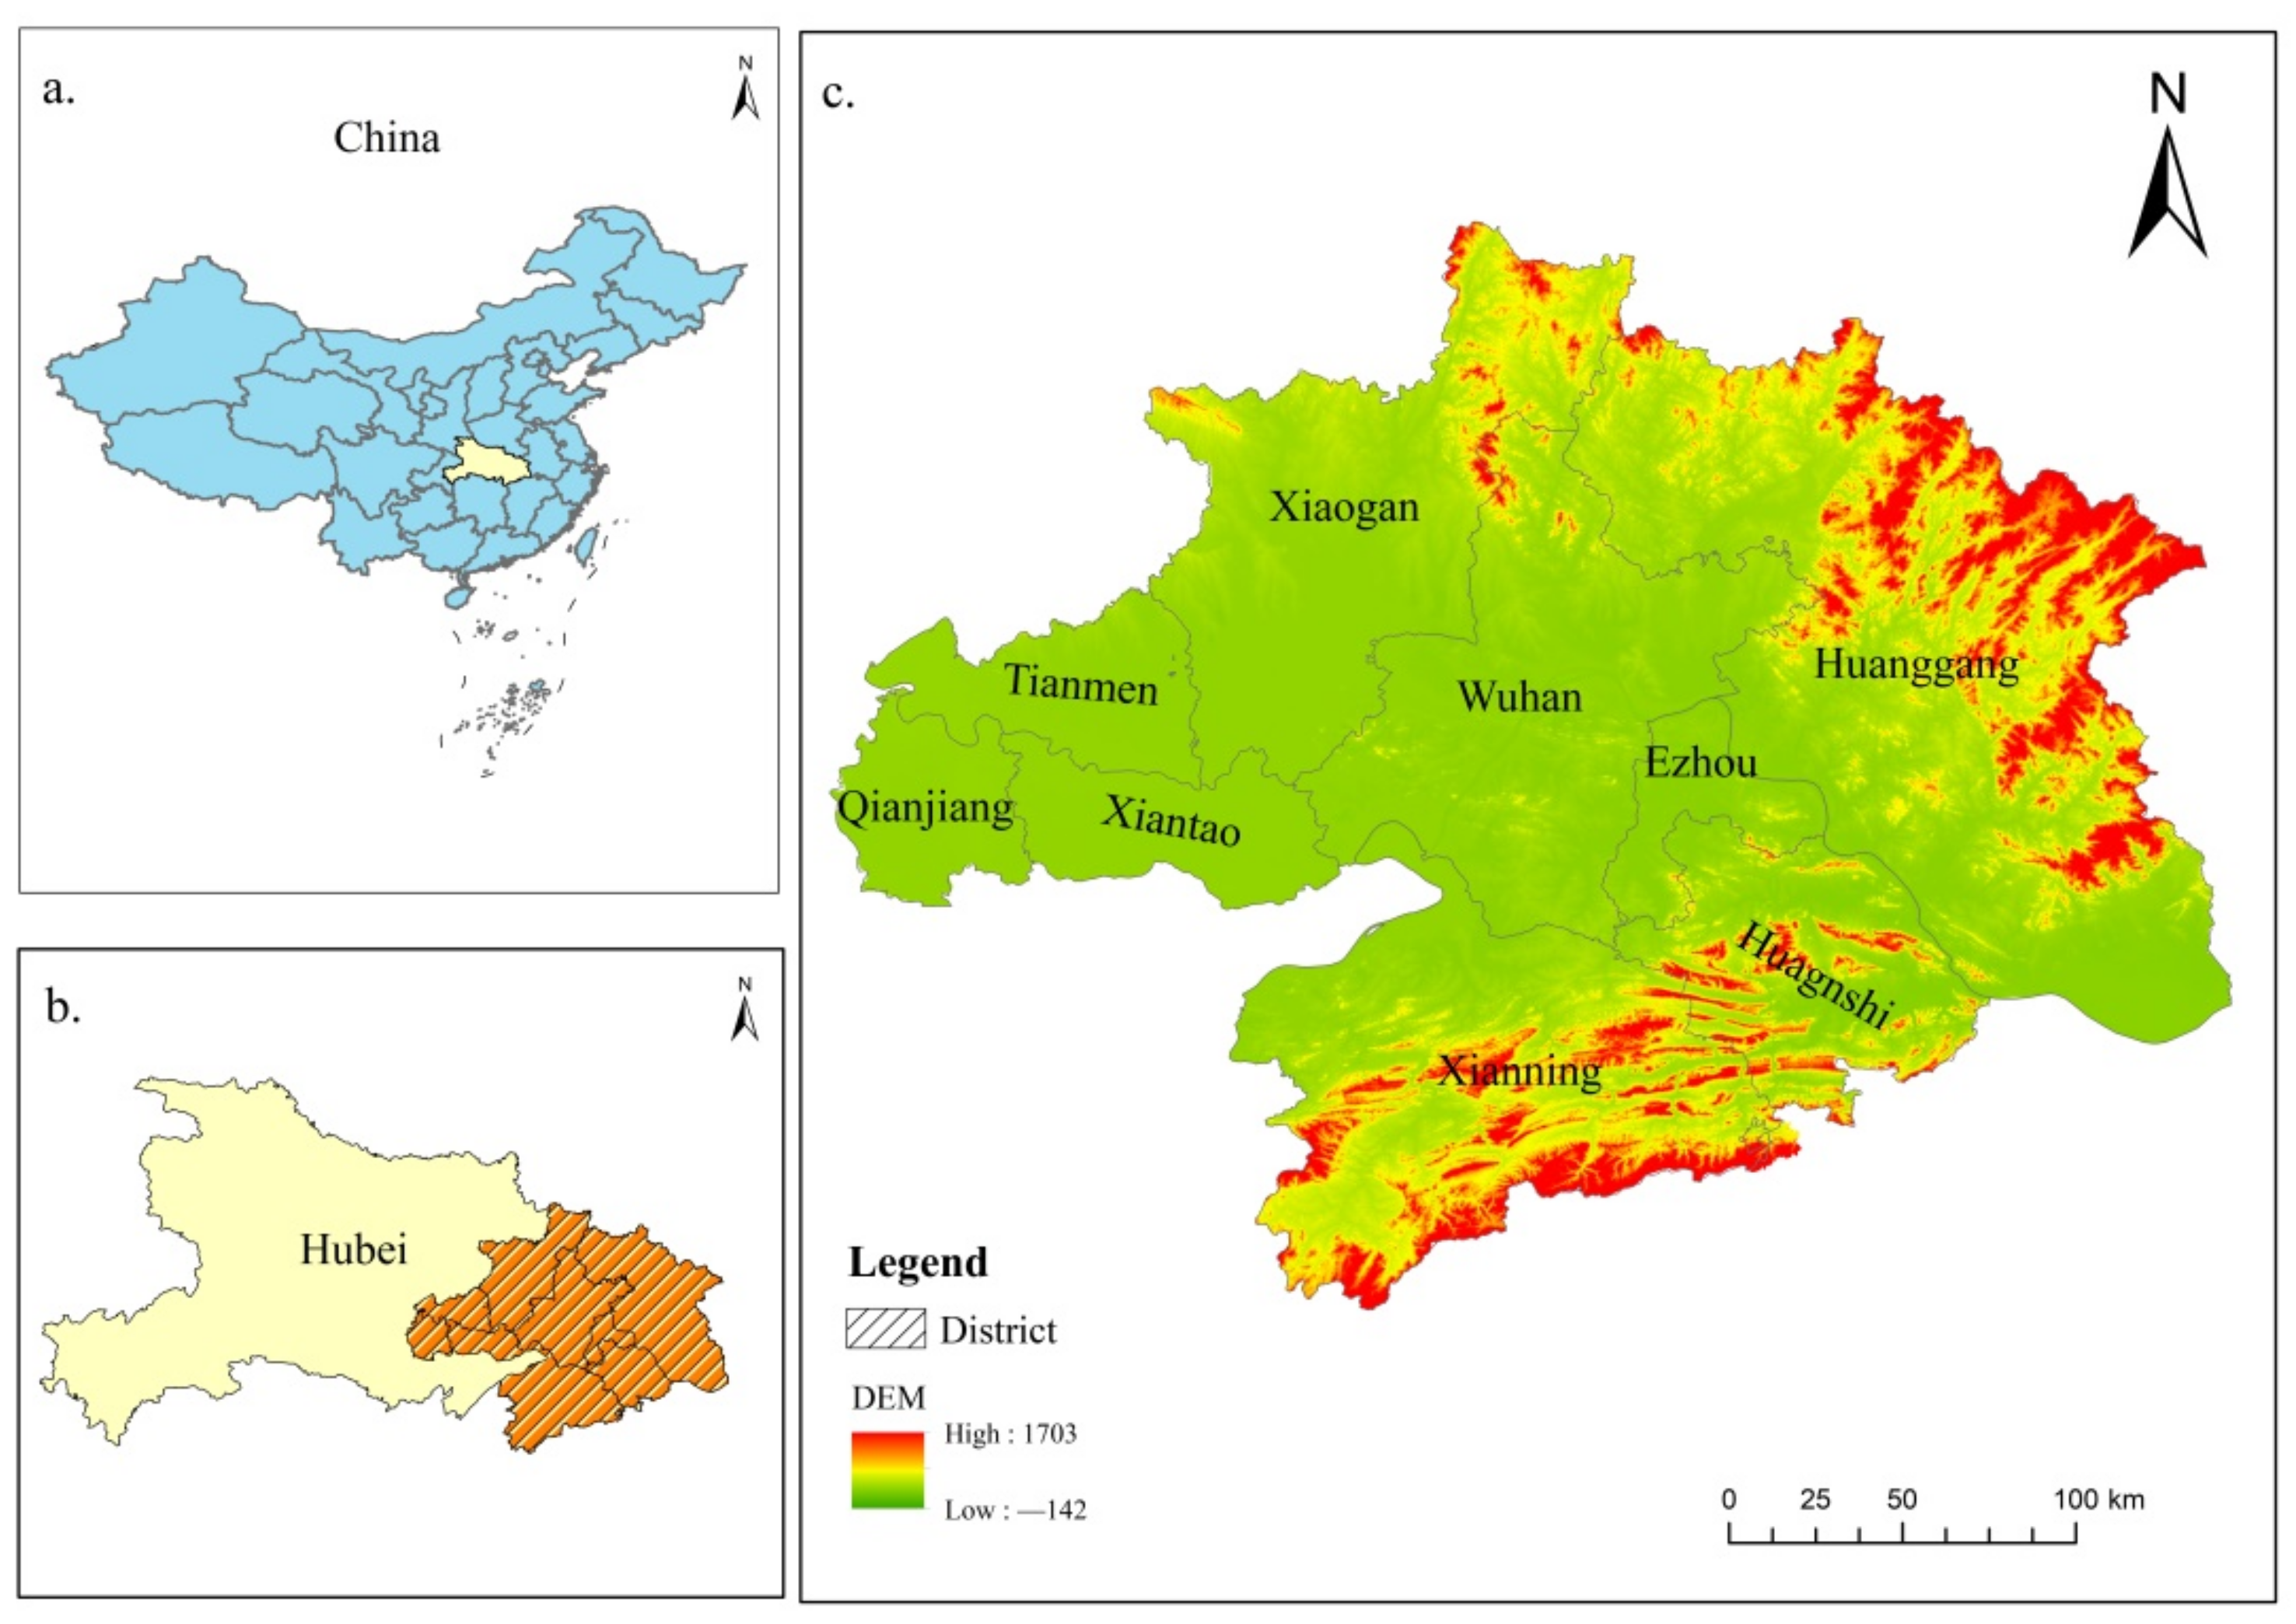
2.1. Study Area

The Wuhan metropolitan area is located at 112°30′–116°07′ E, 29°05′–31°51′ N in the middle reaches of the Yangtze River in the central and eastern parts of Hubei Province. It consists of Wuhan and its surrounding cities of Huangshi, Ezhou, Xiaogan, Huanggang, Xianning, Xiantao, Tianmen, Qianjiang (Figure 1). The total land area of the region is 5.79 × 10⁴ km2. The Wuhan metropolitan area is a national pilot zone for comprehensive support reform of resource saving and environmentally friendliness. It is a significant economic engine driving the rise of central China and is one of the key hub points for the coordinated development of eastern, central, and western China with the Yangtze River Basin Economic Belt as the axis. The Wuhan metropolitan area is rich in water resources and has prominent geographical advantages. It is an important agricultural production area and is one of the most developed regions in central China. By 2020, the permanent resident population of the Wuhan metropolitan area was 98 million, and the regional GDP was 963.576 billion Chinese Yuan, accounting for 52.83% and 60.35% of Hubei Province, respectively. The Wuhan metropolitan area only accounts for one-third of Hubei Province. However, it has more than half of the population and more than 60% of the total GDP of the province. It is the core area for economic development in Hubei Province.

2.2. Data Sources and Processing

Land Remote-Sensing Satellite Thematic Mapper image data from 1990, 1995, 2000, 2005, 2010, 2015, and 2020 in the Wuhan metropolitan area were selected. The spatial resolution of the data from data elevation model was 30 m. Earth Resources Data Analysis System 9.2 was used to carry out geometric accuracy correction, data fusion, and image registration for remote sensing image data. T, 2, 3, and 4, bands, which are more sensitive to green vegetation, were selected for RGB false color synthesis and equalization processing. Remote sensing images were clipped according to the administrative edge-vector graph. Supervised classification and human-computer interactive interpretation were used to comprehensively interpret remote sensing images. Then, artificial visual interpretation was used to correct the classification results with topographic maps, Google Earth images, land-use status, and other auxiliary data to obtain the land-use vector maps for corresponding years. It was found that the Kappa coefficients of each class were all over 0.82 after the classification accuracy test, indicating that the interpretation results met the research needs. According to the land use and cover classification system of the Chinese Academy of Sciences, the land use types were divided into six categories: cultivated land, forest land, grassland, construction land, water area, and unused land. In addition, the socioeconomic data for this study were from the Statistical Yearbook of Hubei Province and the Statistical Yearbooks of various cities from 1990 to 2020.

2.3. Research Methods

2.3.1. Dynamic Attitude of Single Land Use

The dynamic attitude of single land-use refers to the change in a certain land use type in a certain study period [22]. It is used to express the rate of change and range of different land use types over a certain period [23]. Its calculation formula is as follows:
K = U a U b U a × 1 T × 100 %
where K is the dynamic attitude of a certain land use type in the research period, T is the year, and Ua and Ub represent the amount of land use at the beginning and end of the study period, respectively.

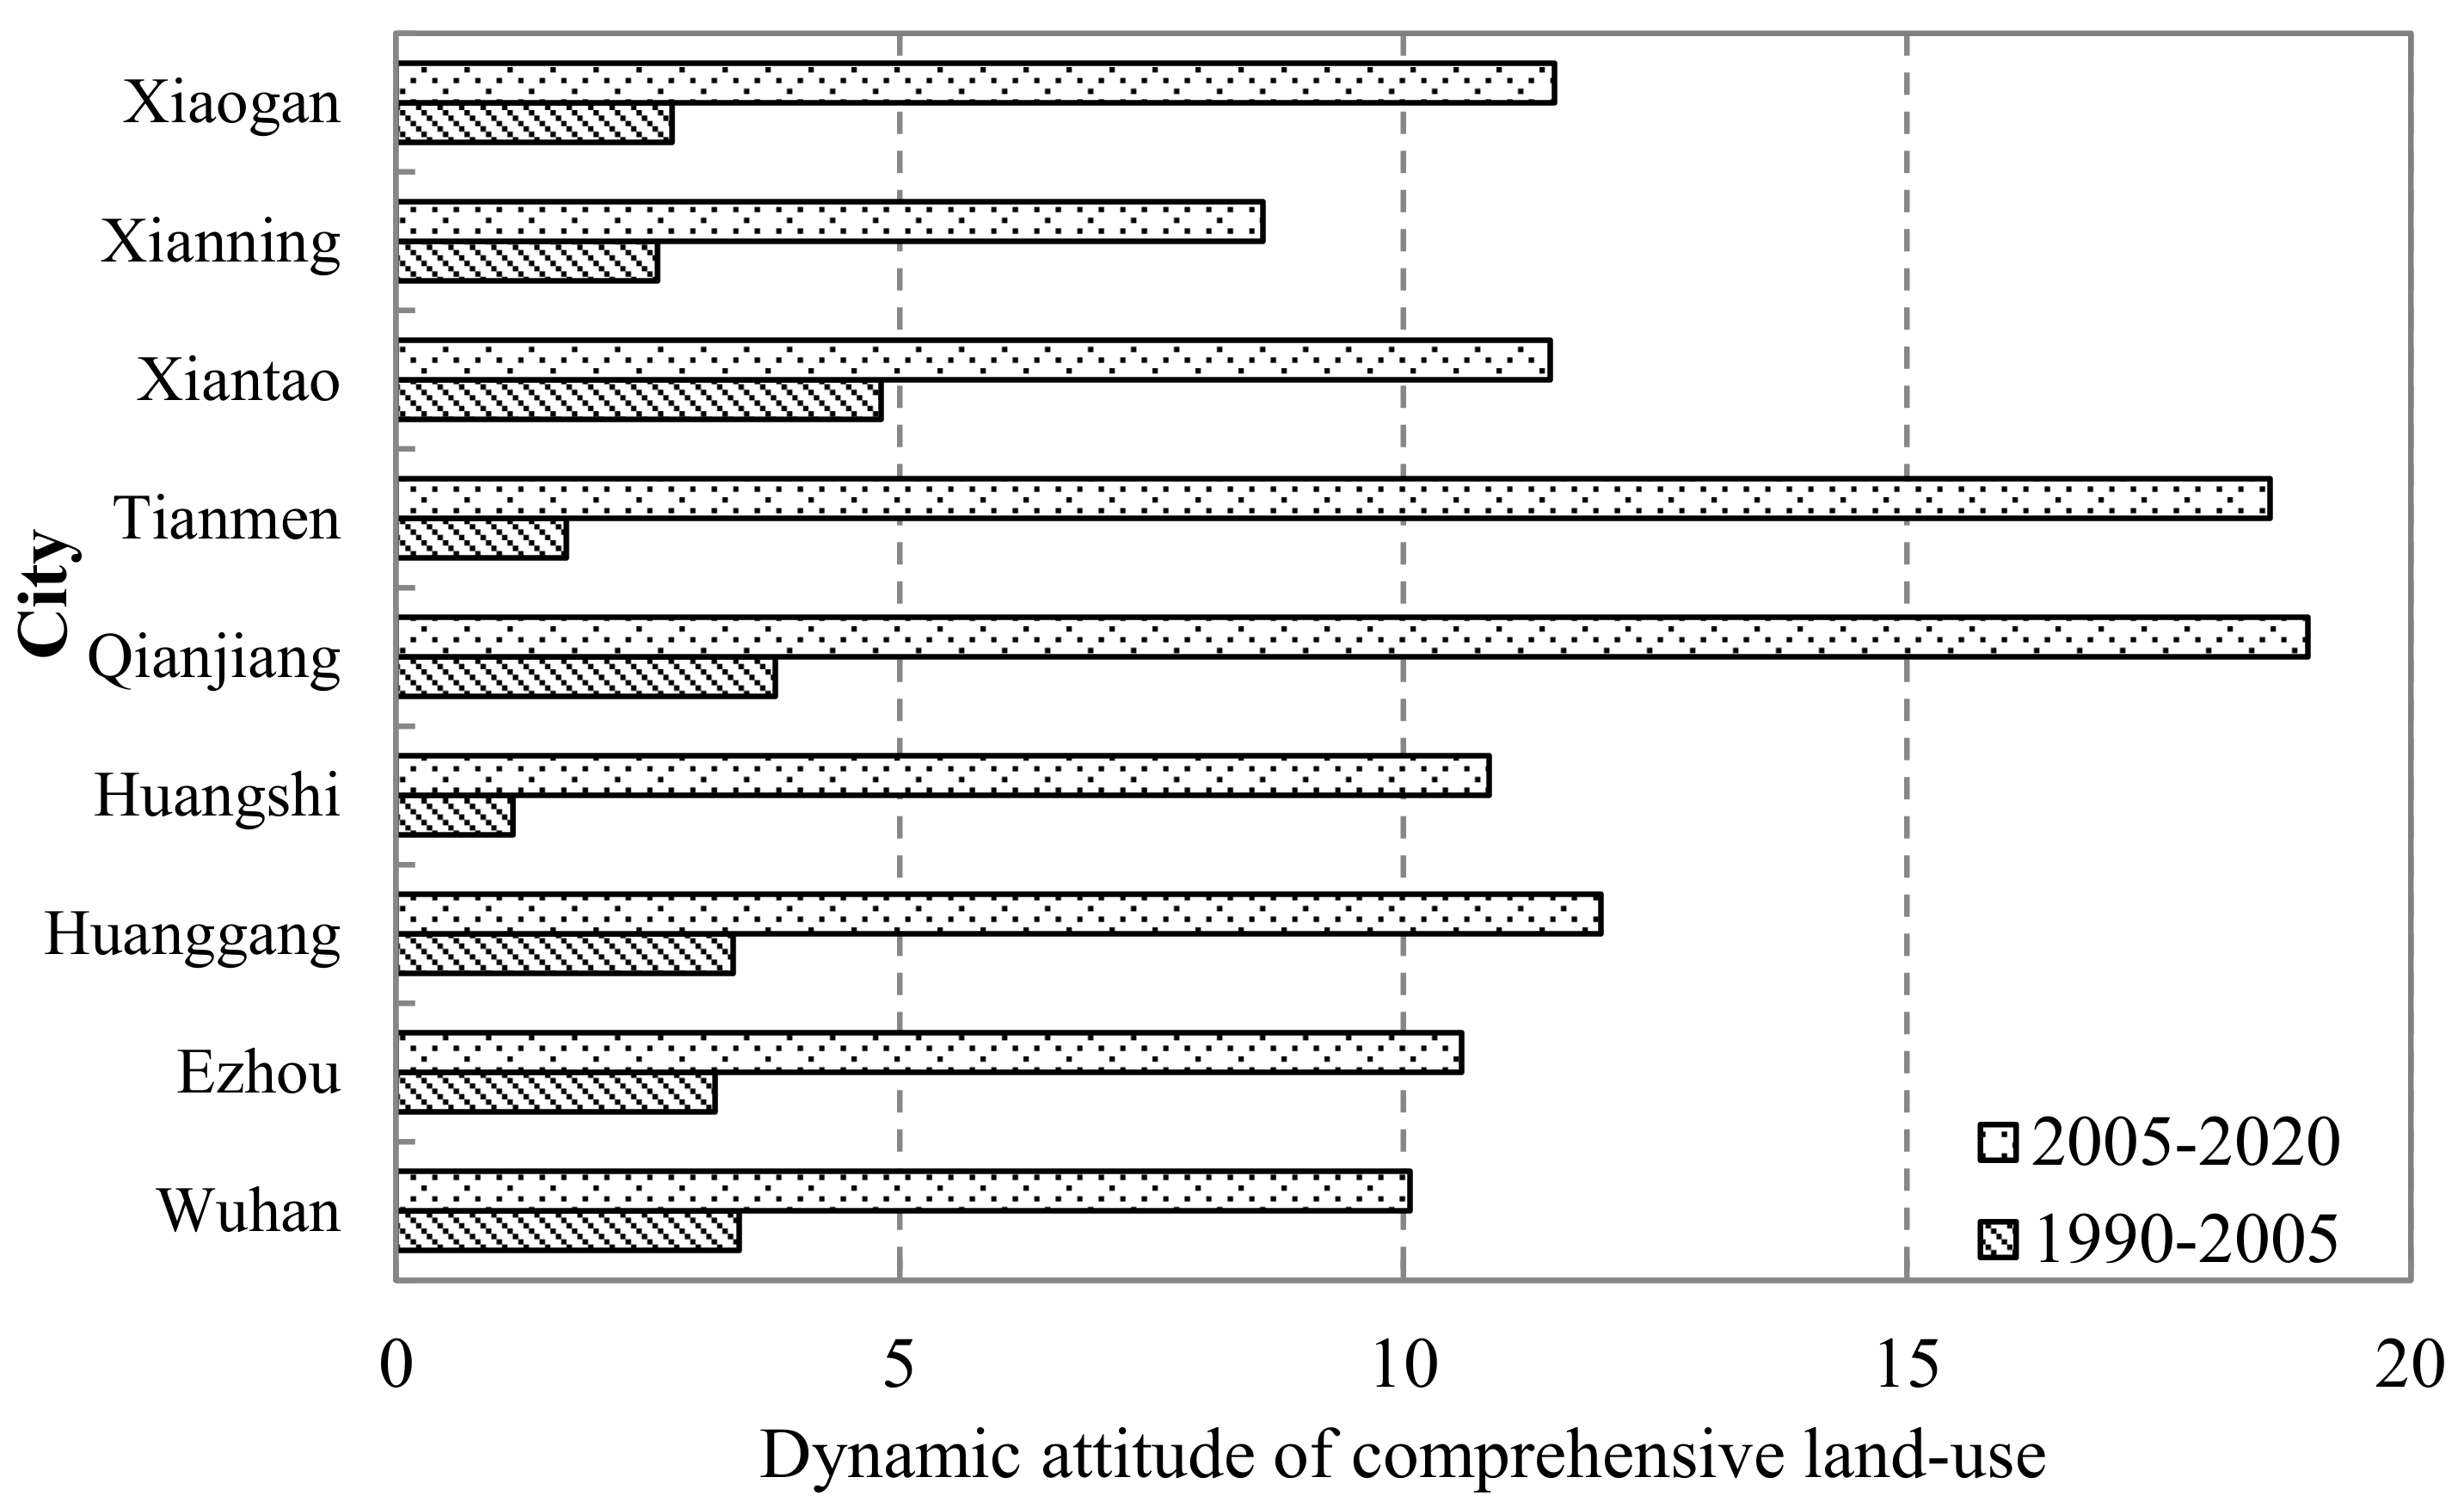
2.3.2. Dynamic Attitude of Comprehensive Land Use

The comprehensive land-use dynamic attitude refers to the rate of change of the entire land use type within a certain time range in the research area [24]. It is an indicator of regional differences in the rate of change of a land use type. It reflects the comprehensive impact of socioeconomic activities in the region on land use change [25]. Its formula is as follows:
S = n = 1 m ( Δ S i j / S i ) × 1 t × 100 %
where Si is the total area of category i land use type at the beginning of monitoring, ΔSi−j is the total area of category i land use type converted to other types of land use type in the monitoring period, and t is the monitoring period. The land use dynamic attitude S reflects the rate of change for a land use type in the study sample area corresponding to period t.

2.3.3. Land Use Transfer Matrix

The land use transfer matrix describes the conversion between different land use types. It not only reflects the land use type structure at the beginning and end of the period but also shows the transfer and change of various land use types during the research period. It is used to describe the direction of regional land use change and the source and composition of various land use types at the end of the study period [26]. The transition matrix generates the transition probability matrix of land use change to predict the changing trend of regional land use in a specific scenario [27]. Its mathematical form is as follows:
S i j = S 11 S 1 n S n 1 S n n
where S is the land area, n is the number of land use types, and i and j are land use types at the beginning and end of the study period, respectively.

2.3.4. Measure of Ecosystem Service Value

Referring to the calculation methods of Costanza et al. (1998) [28] and Xie et al. (2008) [29], a standard ecosystem value is defined as 1/7 of the annual natural grain economic value of farmland with 1 hm2 national average yield [30,31,32]. The economic value of one ecosystem service equivalent factor in China is 449.1 RMB/hm2 [29]. The formula is as follows:
E r = 1 7 i = 1 n m i p i q i M
where Er is the economic value of grain provided per unit area of farmland system, i is the type of food crop, mi is the total sown area of the i grain crop, pi is the average price of the ith grain crop, qi is the average yield per unit area of the i grain crop, and M is the total sown area of all food crops.
The food production function of cultivated land was taken as the standard (value is 1) to assign the equivalent land use value of its type. The average ESV per unit area of the ecosystem in the Wuhan metropolitan area was obtained based on the survey results of different experts (Table 1). Some scholars set the ESV of construction land as 0 [33]. However, it is considered that construction land has a certain value for cultural and entertainment functions, i.e., construction land is dependent on human land use/cover, forming a unique artificial landscape pattern type [34] that functions as a component of the ecosystem and affects human well-being [35]. Therefore, this research retained the equivalent value of cultural services in construction land. The calculation formula of ESV was as follows:
ESV = i = 1 n A i × V C i
ESV f = i = 1 n A i × V C f i
VC i = f = 1 k E C f × E a
where ESV is the ecosystem service value, Ai is the area (hm2) of i land-use type, VCi is the ESV coefficient of the ith land-use type, ESVf represents the ESV in item f, VCfi represents the ESV coefficient of item f of the i land-use type, ECf is the value equivalent of item f of ecosystem service of a certain land-use type, and Ea is a standard equivalent ESV [36].

2.3.5. Linear Regression Model

Referring to the research of Macdonald (1980) [37] and Ploberger (1989) [38], this study constructed a linear regression model of the impact of land use change on the visitor economy. To reduce the heteroscedasticity of the original data and ensure that its changing trend remained unchanged, the logarithmic method was adopted for the panel data of nine cities in the Wuhan metropolitan area from 1990 to 2020. The model was as follows:
L N T M i j = β 0 + β 1 L N E S V i k + β 2 L N C i j + μ i t + v i t + ε i t
where β is coefficients; TMij is the total tourism revenue of each city in the Wuhan metropolitan area; ESVi is the total ESV of each city; Cij represents other control variables, including population (POit), an education level (ELit), and the average wage of each city (AWit); μit and vit are the fixed effects of individual and year, respectively; and εit is the standard error.

3. Analysis of Land Use Change in Wuhan Metropolitan Area

3.1. Change of Land Use Scale

Table 2 shows that the land use scale of the Wuhan metropolitan area changed significantly from 1990 to 2020. First, from the perspective of various land use changes, in the past 30 years, the area of cultivated land, forest land, and grassland in the Wuhan metropolitan area decreased; however, the areas of water and construction land continued to increase. The cultivated land, forest land, and grassland areas decreased by 2668, 159, and 44 km2, respectively. The decrease in farmland area was 8.81%, followed by grassland at 3.09%, and woodland at 0.91%. Construction land and water area increased by 2075 (73.21%) and 770.84 (13.89%), respectively. The unutilized land only increased by 1.15 km2 (0.67%). The economies of various cities in the Wuhan metropolitan area developed rapidly with the acceleration of China’s urbanization. Urban land expansion is obvious, with large-scale occupation of cultivated land for built land, a large amount of cultivated land has been converted into lakes, wetlands, and land use has changed significantly.
Second, land use in the Wuhan metropolitan area is mainly cultivated land, forest land, and water area. The area proportions of the three types of land were 52.34%, 30.38%, and 9.59%, respectively, in 1990 and 50.84%, 30.25%, and 10.35%, respectively, up to 2005. It can be seen that the cultivated land area decreased rapidly, the woodland area changed steadily, and the water area increased to a certain extent. By 2020, the land use in the Wuhan metropolitan area is still dominated by woodland, arable land, and water bodies, accounting for 47.75%, 30.12%, and 10.93%, respectively. However, it is worth noting that the expansion of construction land is more obvious, with the proportion of construction land increasing from 4.9% in 1990 to 8.49% in 2020. Thus, the demand for land use in Wuhan metropolitan area has entered a more active and prosperous period.
Finally, from the perspective of the development stage of land use change, after 2005, the expansion rate of construction land in the Wuhan metropolitan area accelerated. The rapid increase in the urbanization rate had a severe impact on land use types. Specifically, during 1990–2005 and 2005–2020, construction land and water area increased by 460 and 439, respectively, and then increased by 1614 and 331 km2, respectively; however, cultivated land, forest land, and grassland decreased by 882, 84, and 22 km2, respectively, and then decreased by 1785, 75, and 21 km2, respectively. It can thus be concluded that the degree of land use change from 2005 to 2020 was greater than that from 1990 to 2005. The main reason is that since the beginning of the 21st century, China’s urbanization strategy has been adjusted to “actively yet prudently promote urbanization” and “coordinated development of large, medium and small cities, and small towns.” Rapid urbanization accelerated the expansion of urban construction land, sharply decreased the arable land area, and slowed down the expansion rate of water bodies.
Overall, with the advancement of urbanization and the continuous improvement of tourism development, the urban scale of the central city continued to expand (Figure 2). The scale of construction land and water bodies in the Wuhan metropolitan area increased. In contrast, the share of forest land, grassland, and cultivated land decreased, and the structure of urban area land constantly adjusted. However, the latter is still the most important form of land use in the Wuhan metropolitan area. This situation will not change greatly in a short time.

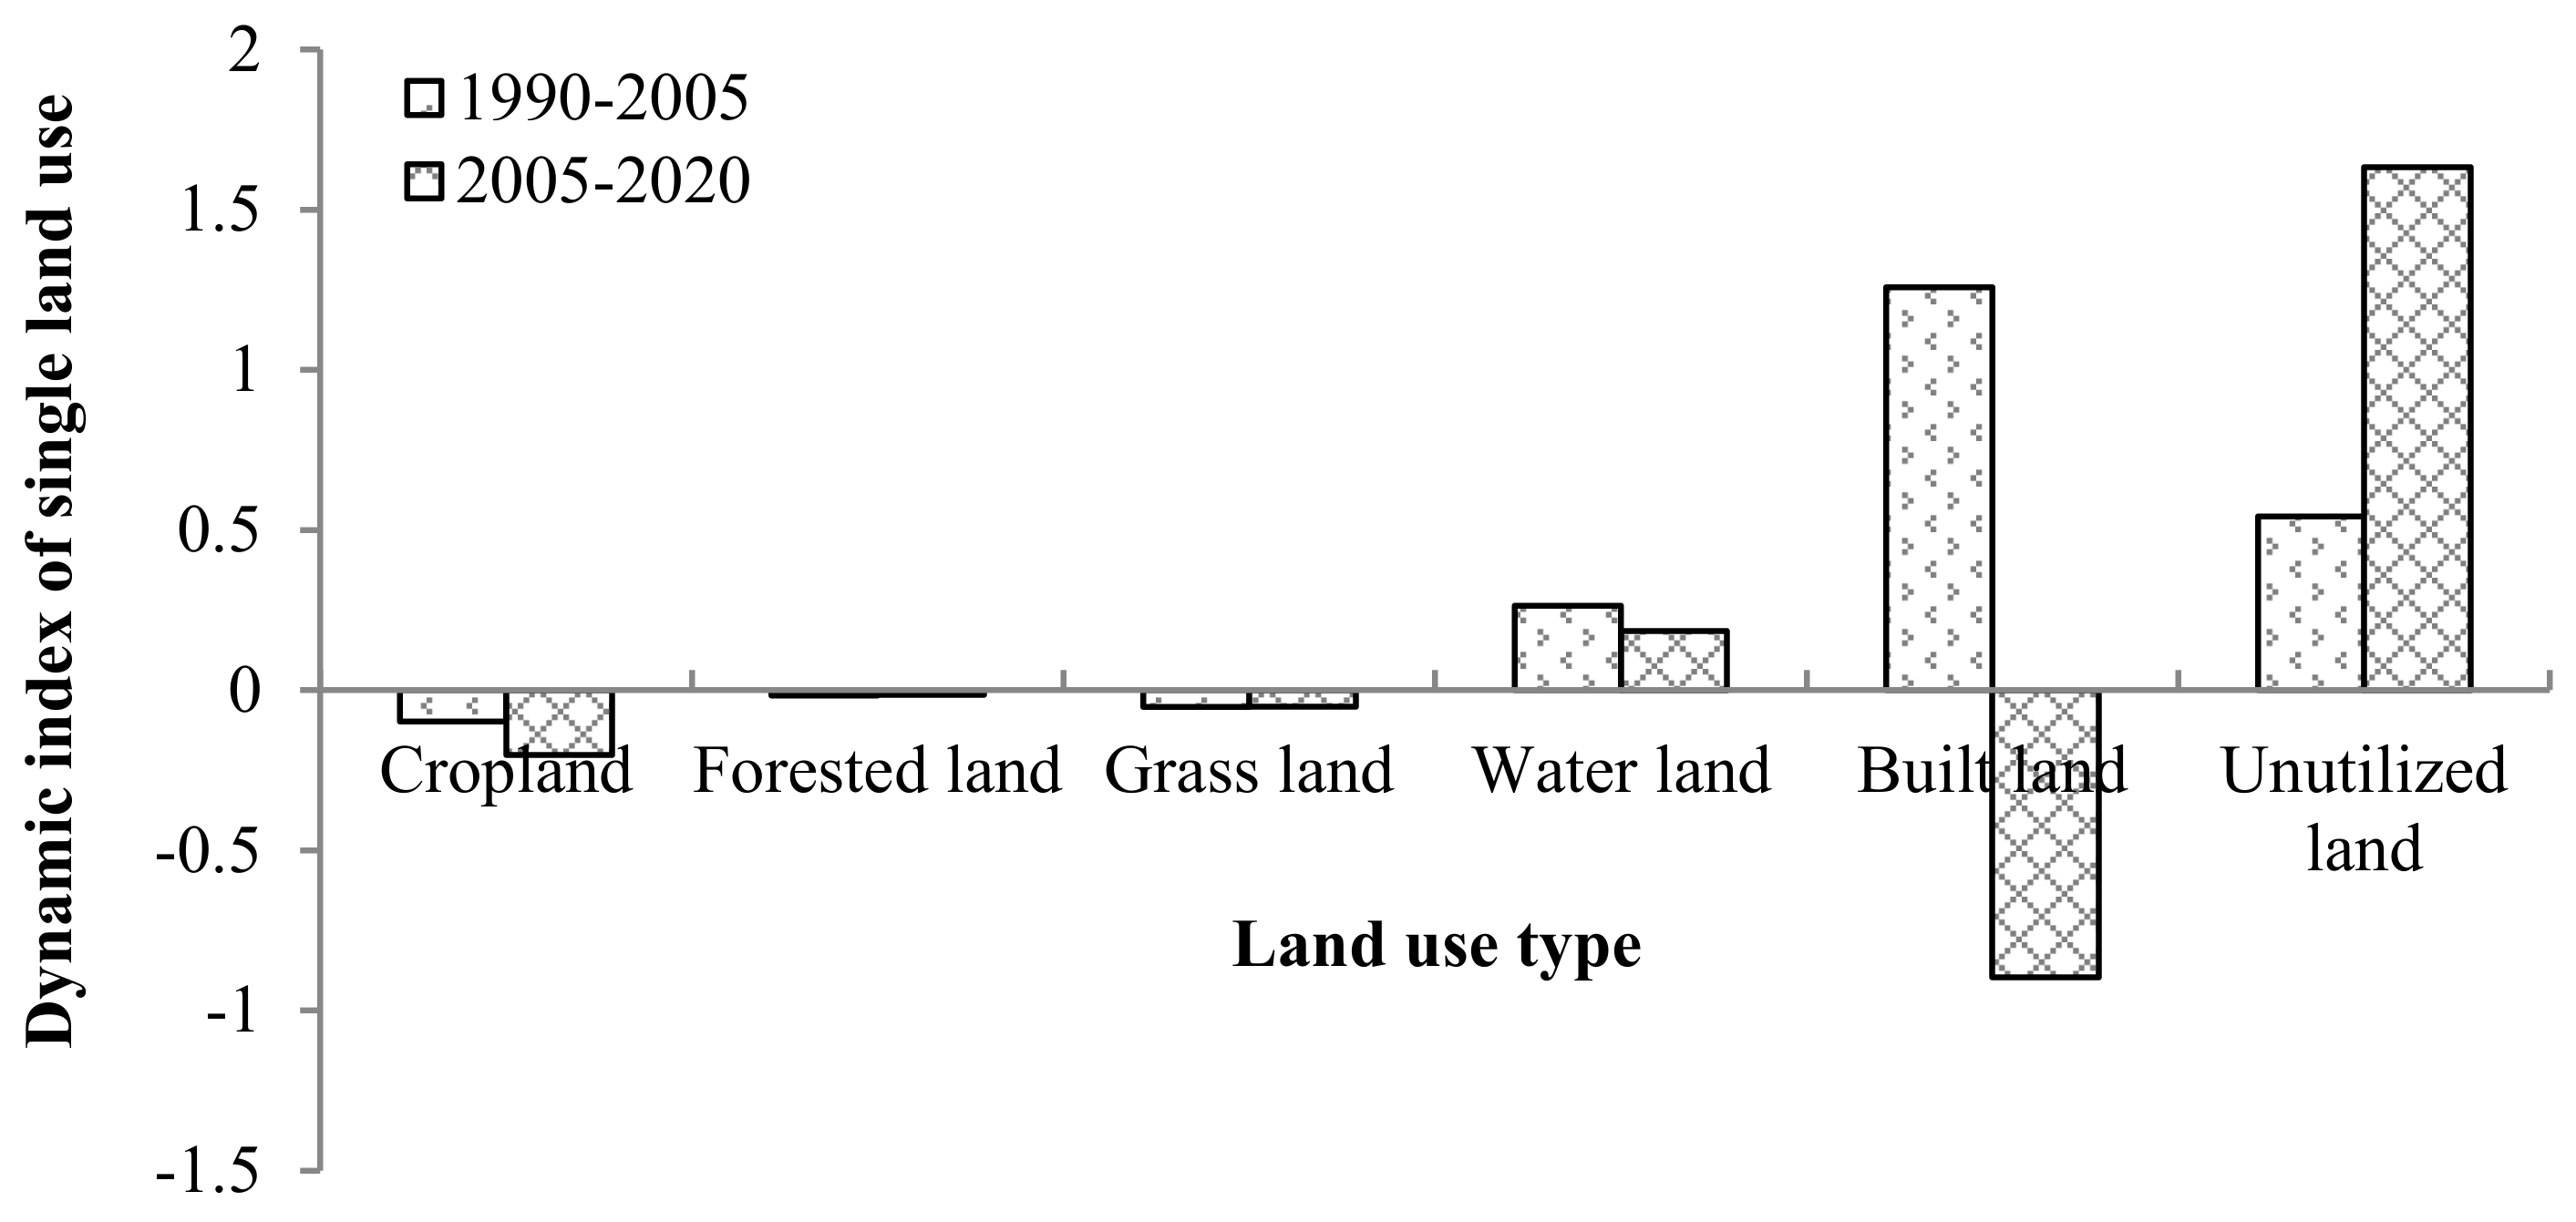
3.2. Rate of Change of Land Use Type

The dynamic attitude of land-use reflects the quantitative changes of land-use types in a certain time range and is divided into single and comprehensive dynamic attitudes [22]. The dynamic attitude of single and comprehensive land use was used to measure the rate of change of land use in the Wuhan metropolitan area. The results were as follows:
First, the dynamic attitude analysis of single land use, according to Formula (1), in different periods, the rates of change of land-use types in the Wuhan metropolitan area showed significant differences. Specifically, the area of forest land and grassland gradually decreased; from 1990 to 2005 and from 2005 to 2020, the average annual rates of change of forest land were −0.03% and −0.1%, respectively. The average annual rate of change of the cultivated land area was −0.19% from 1990 to 2005 and −0.4% from 2005 to 2020. However, water and construction land areas increased yearly. From 1990 to 2005, the annual growth rates of water and construction land were 1.08% and 0.53%, respectively. The annual growth rates from 2005 to 2020 were 3.27% and 0.37%, respectively. In conclusion, among the six types of land, the dynamic attitude of construction land use changed the most, while the degree of dynamic change of grassland was the least. In addition, the unused land area initially showed an increasing trend and then a decreasing trend. The unused land area increased annually from 1990 to 2005 with a dynamic variation of 2.52%, while it decreased annually from 2005 to 2020 with a dynamic variation of 1.79% (Figure 3).
Second, the dynamic attitude analysis of comprehensive land use reflects the overall change in all types of land in the research area during the research period [39]. According to Formula (2), the rate of land use change in the Wuhan metropolitan area increased, indicating that socioeconomic activities had a more severe impact on land patterns. Specifically, from 1990 to 2005, the comprehensive dynamic attitude of land use in the Wuhan metropolitan area was 2.50%, and the rate of land use change was relatively gentle. From 2005 to 2020, the comprehensive dynamic attitude of land use in the Wuhan metropolitan area was 9.78%, and compared with the previous period, the rate of change of land use type showed an accelerating trend, and the impact of human activities increased. In addition, from the perspective of regional differences, the dynamic attitudes of integrated land use varied greatly among different cities. From 1990 to 2005, the dynamic attitudes of soil use of Wuhan, Ezhou, and Huanggang were larger, while smaller for Huangshi, Xianning, and Xiaogan. From 2005 to 2020, the dynamic attitude of soil use of Tianmen, Huanggang, and Wuhan were larger, while smaller for Xianning, Xiantao, and Xiaogan (Figure 4). In recent years, the land use in Wuhan and Huanggang have fluctuated greatly.

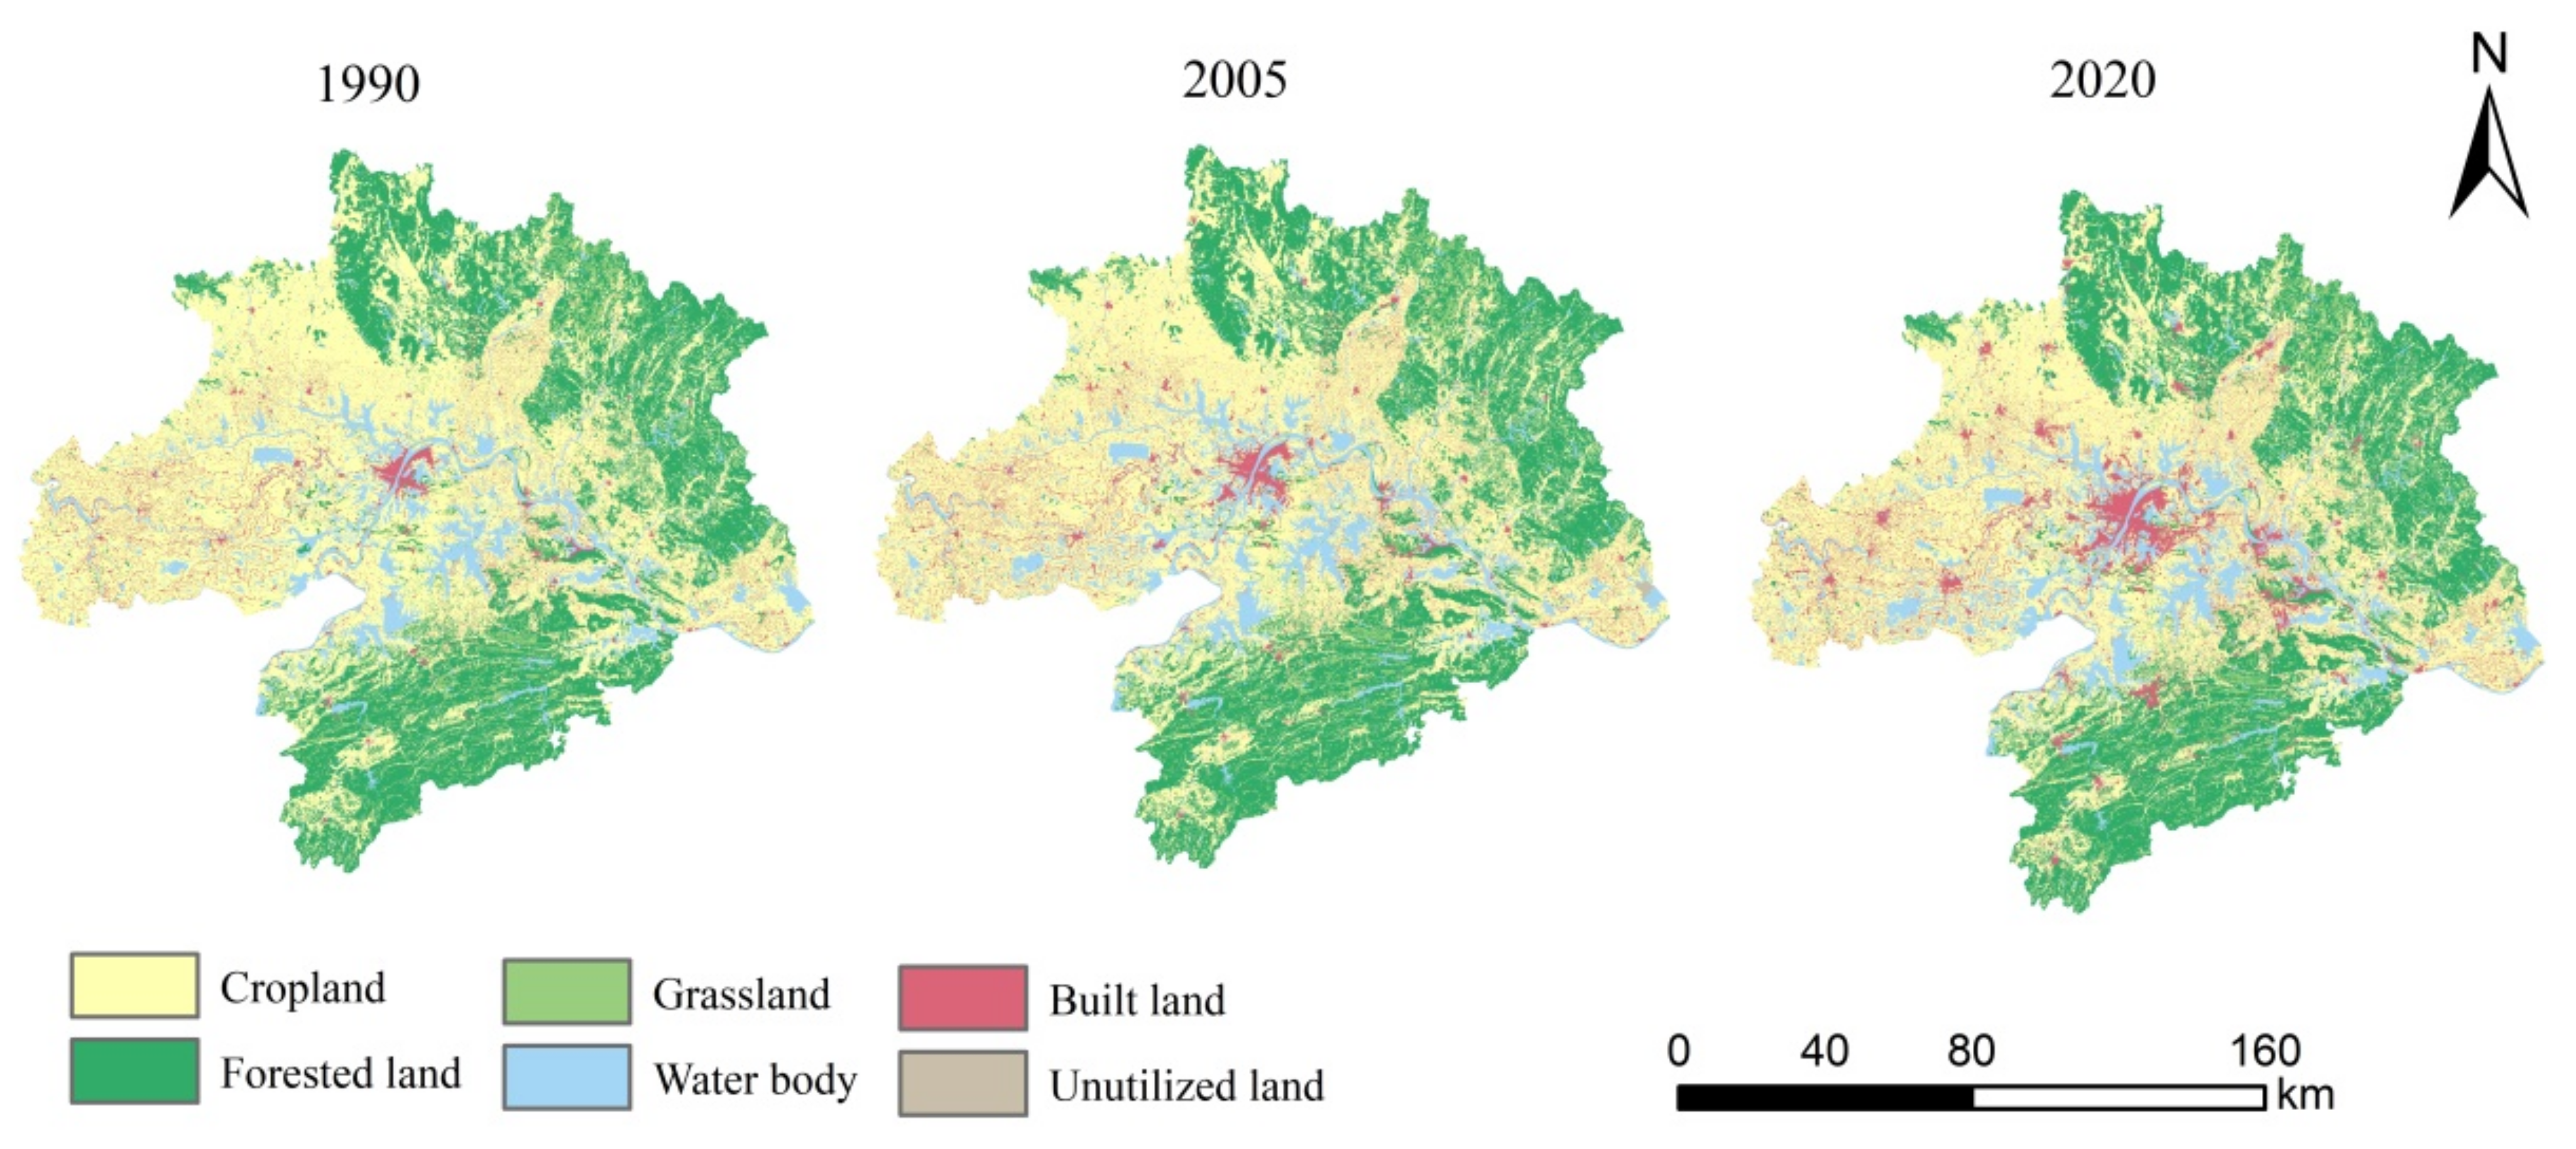
3.3. Changes in Land Use Types

ArcGIS was used to classify land use in the Wuhan metropolitan area from 1990 to 2005 and from 2006 to 2020, as well as to carry out spatial superposition analysis to obtain the land use transfer matrices during these years (Table 3). From 1990 to 2020, the land use types in the Wuhan metropolitan area underwent an evident transformation:
(1) From 1990 to 2005, based on maintaining an original water area of 5549 km2, an area of 636 km2 underwent transformation from cultivated land to water bodies, making it the largest input; however, only 4.86 km2 underwent transformation from construction land to water bodies, making it the smallest input. Based on maintaining an original construction land area of 2834.82 km2, an area of 410, 41 and 47 km2 underwent transformation from cultivated land, water bodies, and forest land, respectively, to construction land. The three types of land mentioned above were the main sources of construction land, and cultivated land was its largest source. A total of 1186 km2 of cultivated land was converted to another land use (such as water body, built land, grassland) of which 636 km2 was converted to water bodies, accounting for 53.85%; 410 km2 was converted to construction land, accounting for 34.6%, of which 122 km2 was converted to forest land, accounting for 10.35%. The total area of forest land decreased annually. A total of 143 km2 of forest land was reclaimed as cultivated land, 47 km2 was converted into construction land, and a small part was converted into water bodies and grassland. Cultivated land was the largest input source of forest land, covering 122 km2, and the scale of conversion of unused land and construction land to forest land was the smallest, 2 and 3.6 km2, respectively. A small portion of grassland was converted to woodland, 25 km2; arable land, 14 km2; water area, 11 km2; and construction land, 5.7 km2. The conversion of land in this period mainly occurred in the following areas: conversion of forest land and cultivated land to construction land, conversion of cultivated land to the water bodies, and conversion of forest grassland and cultivated land. This shows that woodland and arable land were the main sources of construction land.
(2) From 2006 to 2020, arable land was still the major contributor to the water bodies, with an input of 1038 km2. The input sources of construction land were scattered. The contributions of cultivated land, forest land, water bodies, and grassland to construction land were 2005, 281, 183, and 28 km2, respectively, indicating that construction land was an important land use type increase during this period. The increase in cultivated land mainly originated from forest land, water bodies, and construction land, with conversions of 1258, 678, and 746 km2, respectively. In addition, the improvement of grassland and unused land contributed 52 and 27 km2, respectively, to the expansion of agricultural land. The increase in forest and grassland area was mainly from cultivated land, with 1404 km2 of cultivated land being converted to forest land, which was equal to the amount of forest and grassland that converted to agricultural land (1258 km2).
The changes in land use types in the two periods of 1990–2005 and 2006–2020 were mainly characterized by the conversion of forest land, grassland, and cultivated land to construction land and water bodies. Moreover, the scale of transformation of various land use types in the later stage was larger than that in the previous stage, indicating that the demand for construction land in the later stage of urban development was larger. The degree of transformation among various types of land was more intense.

3.4. Analysis of Changes in Ecological Service Value

Formulas (5)–(7) were used to calculate ESV. The analysis of changes in the total value of ecosystem services in the Wuhan metropolitan area increased annually. The ESV increased from 525.320 billion RMB in 1990 to 530.529 billion RMB in 2020, with an increase rate of 0.93% (Table 4). Specifically, the ESV of forest land and grassland decreased by 1.21 billion RMB and 226 million RMB, respectively, accounting for 8.81% and 0.91%, respectively. The rate of increase of the ESV of water bodies was 13.89%. The ESV of unused land first increased and then decreased. From 1990 to 2005, the ESV of unused land increased by 37.75% and decreased by 26.92% from 2006 to 2020. The growth rate of the ESV of construction land ranked first among the six types, accounting for 73.21%. In particular, during 2005–2020, the growth rate reached 49%.
Second, the change in the ESV structure was analyzed. From the perspective of the evolution of ecological service function value, from 1990 to 2020, the value of hydrological regulation, waste treatment, aesthetic landscape provision, and cultural and entertainment ecosystem services showed an increasing trend yearly, with the rate of change of ESV being 5.48%, 4.51%, 5.2%, and 2.11%, respectively (Table 5). Other individual ecosystem services showed a declining trend. The value of food production and soil formation protection declined rapidly, with a changing rate of −6.24% and −3.73%. From 1990 to 2020, the ESV of raw material production, gas exchange, gas regulation, biodiversity conservation, natural heritage and diversity showed little change. The rates of change were −1.93%, −2.27%, −1.52%, −0.67%, and −1.96%, respectively. Regarding ecosystem services of food production, the ESV decreased by 1.69% from 1990 to 2005 and by 4.26% from 2006 to 2020. The main reason for the decrease in the ESV of food production was that a large number of rural laborers migrated to cities with the acceleration of urbanization. A large amount of cultivated land was abandoned. Meanwhile, the cultivated land in the suburbs was gradually transformed into construction land, which decreased the food production value year on year.
From the perspective of ESV composition, the main functions in the Wuhan metropolitan area are water conservation, waste treatment, soil formation and protection, and biodiversity protection. The sum of these four functions account for more than 50% of the ecosystem services. Wuhan is a typical water town, south of the Yangtze River, with a dense water network, reservoirs, lakes, and abundant water. Therefore, the hydrological regulation is the highest ecological function, accounting for nearly 20% of the total ecological value.
Finally, from the perspective of the value scale of ecological services, the values of various ecological services during 1990–2020 are regulation, cultural, expenditure, and supply services. The value of a single ecological service function is hydrological regulation, waste treatment, biodiversity protection, soil formation and protection, climate regulation, gas exchange, landscape aesthetics, raw material production, food production, natural heritage and diversity, and cultural entertainment. It is worth noting that there are many rivers and lakes in the Wuhan metropolitan area, such as the Yangtze River, Han River, and East Lake [40], which significantly impact microclimate improvement and ecosystem regulation services and also make hydrological regulation services occupy the first place in various ecological service functions.

4. Discussion

4.1. Effect of Land Use Change on the Visitor Economy

The development of the visitor economy in the Wuhan City circle is closely related to land-use change [41]. The number of visitors and total tourism income was significantly positively correlated with construction land [42]. Different types of land have dissimilar ESVs. For example, forest land provides tourists with beautiful natural environments, clean air, diverse flora and fauna, and plays a significant role in gas exchange, climate regulation, and biodiversity; grasslands are of great significance for animal and plant protection and biodiversity in scenic areas. In particular, the development of agricultural tourism converts cultivated land into a tourism function, and this plays an important role in the visitor economy. Although the contribution of building land in gas exchange, climate regulation, and food production is small, it has the service functions of landscape aesthetics, culture and entertainment, and natural heritage [43]. Land use mainly promotes tourism economic growth through the ESVs in three aspects: regulation, support, and cultural services (Figure 5).

4.2. Impact of Land Use Change on the Visitor Economy

Different types of land are dissimilar in the value of supply, regulation, support, and cultural services. In addition, among the above four types of service values, supply services provide food production for residents, which is less related to the development of the visitor economy. In contrast, regulation, support, and cultural services are closely related to the development of the visitor economy. Therefore, this research used regulation service, supporting service, and cultural service values as independent variables, and the tourism income of each city as the dependent variables and constructed a linear regression model to explore the impact of land use change on the visitor economy in the Wuhan metropolitan area.
According to the model setting form of Formula (8), the parameters of each variable were estimated. As shown in Table 6: (1) Overall, the value of various ecological services had a significant promoting effect on visitor economy growth. The influence coefficients of overall value, regulation, support, and cultural service values were positive and pass the significance test i.e., these variables have a significant promoting effect on tourism revenues; (2) the value of various ecological services had significant heterogeneity in visitor economy growth. The regression results showed that the value of cultural services had the largest influence coefficient on tourism revenue (60.97), followed by the value of support services (21.72), the value of regulation services (11.94), and the total value (6.84). The land supply service is mainly reflected in the waste disposal, soil formation and conservation, biodiversity conservation, and landscape aesthetic provision functions. Land support services are the core function of land, which have a crucial impact on people’s everyday lives and economic development. Cultural service is reflected in the cultural and entertainment functions of land. For example, heritage architecture and sites can be regarded as cultural tourism resources with cultural dissemination and educational value. Thus, different land types have dissimilar impacts on the visitor economy.
Thus, different types of land have different ecological service values and have significant differences in tourism development; and (3) other control variables, such as population, education levels, and average salary of employees, all passed the significance test and were consistent with the actual situation.

5. Conclusions

As the core area of economic development in Hubei Province, the Wuhan metropolitan area is also an important strategic fulcrum for the rise of central China. Its land use transformation is of great significance for social and economic development. Based on the spatial evolution of land use, the dynamic attitude of land use, transfer matrix, and a linear regression model were used to study the evolution characteristics of land use and the impact on tourism development in the Wuhan metropolitan area. The main conclusions are as follows:
First, the land use scale in the Wuhan metropolitan area changed significantly from 1990 to 2018. From the perspective of various land use ratios, the land use in the study area is mainly cultivated land, forest land, and water bodies. From the perspective of various land use changes, the area of cultivated land, forest land, and grassland in the study area has been decreasing, while the area of water bodies and construction land has been increasing in the past 30 years. From the perspective of the development stage of land use change, after 2005, the expansion rate of construction land significantly accelerated, and the urbanization rate increased rapidly, which had a severe impact on land use types. With the acceleration of urbanization in the world, the characteristics of land use evolution in the Wuhan metropolitan area provide a useful reference for urban land planning in other countries.
Second, there are great differences in the dynamic attitudes of land use at various stages. On the one hand, in terms of the dynamic attitude of single land use, the area of forest land, grassland, and cultivated land is decreasing annually, and the rate of decrease is increasing. However, the water bodies and construction land area increased annually, the rate of increase was smaller. The unused land area showed an increasing trend initially and then a decreasing trend. Among the six types of land, the dynamic change in construction land use was the largest, while the degree of dynamic change of grassland was the smallest. On the other hand, in terms of the dynamic attitude of integrated land use, from 1990 to 2005, the comprehensive dynamic attitude of land use in the Wuhan metropolitan area was 2.50%, and the rate of land use change was relatively gentle. From 2005 to 2020, the comprehensive dynamic attitude of land-use in the Wuhan metropolitan area was 9.78%, and when compared with the previous period, the rate of change of land use type showed an accelerating trend, and the impact of human activities increased.
Third, based on the perspective of EVS, this study focused on the impact of land use change on the development of the visitor economy by constructing a regression equation model. The results showed that although regulating, supporting, and cultural service values had significant promoting effects on visitor economy growth, their effects varied; cultural service value, support service value, and regulation service value had different influence coefficients of 60.97, 21.72, and 11.94, respectively. In addition, this study introduces the three dimensions of regulatory, support, and cultural services that can promote land ecological service value enhancement and tourism economic growth. This may be new ideas for other countries or regions in formulating tourism economic development policies.
Based on the above findings, the following policy implications were derived. (1) All planning of land use should be carried out to achieve sustainable development of land use. Land use change is the most direct reason for the change of the total value of regional ecosystem services, and whether the change direction is reasonable or not directly determines the total value of regional ecosystem services. Land use planning must give full consideration to the value of land supply services, adjustment services, support services and cultural services [44]. The government should arrange the quantity and spatial layout of all types of land according to local conditions, so as to make the land use in more scientifically rational, and achieve the optimal allocation of land use resources and sustainable use. (2) The comprehensive utilization efficiency of land should be used to solve the contradictions between land supply and demand. With continuous popluation growth and the acceleration of urbanization, the amount of cultivated land decreases rapidly, which leads to increasingly sharp contradictions between man and land [45]. Therefore, the government and land resource management departments should take measures to solve the contradictions between land supply and demand to ensure economic development and food security. On the one hand, efforts in land development and consolidation should be intensified, the construction of basic farmland protection areas stengthened, and the economical and intensive use of land resources promoted. On the other hand, wasteland should be developed and transformed such as sandy land, tidal flats and fields, as well as medium and low producing areas, and the intensity of land pollution control must be strengthened. (3) The value of land ecological services should be improved to lay a foundation for the development of the visitor economy. The value of ecosystem services in the Wuhan metropolitan area shows an increasing trend year on year, which indicates that the ecosystem structure is constantly optimizing and has achieved good ecological effects, which lays a foundation for the development of the visitor economy [46]. However, it is worth noting that at present, the increase of ecosystem service value in the Wuhan metropolitan area mainly comes from the reclamation and utilization of unused land, which is converted into the increment of the value of forest land and water land. In fact, the land use mode and technology are still at a low level. Therefore, the Wuhan metropolitan area should attach importance to the value of land ecological services, improve the ecological environmental benefits per unit of area, and realize the sustainable development of ecosystems and visitor economy.
This study had some limitations, (1) Lack of discussion of the spatial dimension. The impact of land use change on tourism economic development involves time and space dimensions. However, this study only discussed the impact of land use change on tourism from a time dimension, and lacked research on spatial autocorrelation and adjacency. The essence of the evolution of land use patterns is a comprehensive process of its spatial form, spatial functional structure, and spatial element distribution. Therefore, the influences on the visitor economy can be further analyzed in the future from these three aspects. (2) The calculation of land ecological service value needs further study. At present, there is no unified understanding of ecological service value coefficients of various types of land. This paper refers to the methods provided by IPCC and relevant scholars. However, the land ecological service value coefficient, which is more accurate and consistent with the provincial scale in China, still needs further study.

Author Contributions

Conceptualization, Q.C. and A.M.M.; methodology, Q.C. and A.M.M.; software, Q.C., Y.M. and A.M.M.; formal analysis, Q.C., A.M.M. and Y.M.; writing—original draft preparation, Q.C.; writing—review and editing, A.M.M. and Q.C.; visualization, A.M.M. and Q.C.; funding acquisition, Q.C. and Y.M. All authors have read and agreed to the published version of the manuscript.

Funding

This study was supported by the National Natural Science Foundation of China (grant nos. 41867071 and 41871137); the Scientific Research Cultivation Project 2020 of the Hubei University of Economics (grant no. PYYB202009); the Scientific research Project of Hubei Education Department (grant no. B2021171); and the Major Project of High-Resolution Earth Observation System (grant no. GFZX0404130302).

Institutional Review Board Statement

Not applicable.

Informed Consent Statement

Not applicable.

Data Availability Statement

All data required to support this research is already presented in this manuscript.

Acknowledgments

We sincerely thank the editor and anonymous referees, whose remarks have been very constructive and inspiring in preparing the final version of the paper.

Conflicts of Interest

The authors declare no conflict of interest.

References

  1. Deng, J.S.; Wang, K.; Hong, Y.; Qi, J.G. Spatio-temporal dynamics and evolution of land use change and landscape pattern in response to rapid urbanization. Landsc. Urban Plan. 2009, 92, 187–198. [Google Scholar] [CrossRef]
  2. Mcmurry, K.C. The Use of Land for recreation. Ann. Assoc. Am. Geogr. 1930, 20, 7–20. [Google Scholar] [CrossRef]
  3. Hammes, D.L. Resort development impact on labor and land markets. Ann. Tour. Res. 1994, 21, 729–744. [Google Scholar] [CrossRef]
  4. Hu, Q.; Lu, L. Research progress and Enlightenment of tourism land. Econ. Geogr. 2009, 29, 313–319. [Google Scholar]
  5. Weaver, D.B. Model of urban tourism for small Caribbean islands. Geogr. Rev. 1993, 83, 134–140. [Google Scholar] [CrossRef]
  6. Williams, A.M.; Shaw, G. Future play: Tourism, recreation and land use. Land Use Policy 2009, 26, 326–335. [Google Scholar] [CrossRef] [Green Version]
  7. Tyrvainen, L.; Uusitalo, M.; Silvennoinen, H.; Hasu, E. Towards sustainable growth in nature-based tourism destinations: Clients’ views of land use options in Finnish Lapland. Landsc. Urban Plan. 2014, 13, 23–43. [Google Scholar] [CrossRef]
  8. Saha, J.; Paul, S. An insight on land use and land cover change due to tourism growth in coastal area and its environmental consequences from West Bengal, India. Spat. Inf. Res. 2020, 29, 577–592. [Google Scholar] [CrossRef]
  9. Hjalager, A.M. Land-use conflicts in coastal tourism and the quest for governance innovations. Land Use Policy 2020, 94, 104566. [Google Scholar] [CrossRef]
  10. Wang, J.; Liu, Y. Tourism-Led Land-Use Changes and their Environmental Effects in the Southern Coastal Region of Hainan Island, China. J. Coastal Res. 2013, 23, 119–123. [Google Scholar] [CrossRef]
  11. Du, L.; Wang, N.; Wu, C. Characteristics and Driving Mechanism of Land Use Change in Hillside Tourism Town: A Case Study of Jinggangshan City. J. Chin. Urban For. 2019, 17, 22–26. [Google Scholar]
  12. Wu, B. A Study on Recreational Belt around Metropolis (ReBAM): Shanghai Case. Entia Geogr. Sin. 2001, 21, 354–359. [Google Scholar]
  13. Xiao, P.; Zhao, C.; Zhou, Y.; Feng, H.; Li, X.; Jiang, J. Study on Land Consolidation Zoning in Hubei Province Based on the Coupling of Neural Network and Cluster Analysis. Land 2021, 10, 756. [Google Scholar] [CrossRef]
  14. Bunruamkaew, K.; Murayama, Y. Land use and natural resources planning for sustainable ecotourism using GIS in Surat Thani, Thailand. Sustainability 2012, 4, 412–429. [Google Scholar] [CrossRef] [Green Version]
  15. Yang, B.; He, P.; Zhao, T. Land use pattern change of Zhangjiajie National Forest Park. J. Ecol. 2006, 25, 2027–2034. [Google Scholar]
  16. Chai, Y.; Qiao, W.; Hu, Y.; He, T.; Jia, K.; Feng, T.; Wang, Y. Land-Use Transition of Tourist Villages in the Metropolitan Suburbs and Its Driving Forces: A Case Study of She Village in Nanjing City, China. Land 2021, 10, 168. [Google Scholar] [CrossRef]
  17. Campbell, D.J.; Lusch, D.P.; Smucker, T.A.; Wangui, E.E. Multiple Methods in the Study of Driving Forces of Land Use and Land Cover Change: A Case Study of SE Kajiado District, Kenya. Hum. Ecol. 2005, 33, 763–794. [Google Scholar] [CrossRef]
  18. Su, C.; Fu, B.; Lu, Y.; Lu, N.; Zeng, Y.; He, A.; Lamparski, H. Land use change and anthropogenic driving forces: A case study in Yanhe River Basin. Chin. Geogr. Sci. 2011, 21, 587. [Google Scholar] [CrossRef]
  19. Cao, J.; Zhang, Z.D.; Cui, F. Response of ecosystem services to landscape pattern change in New York Bay area from 1996 to 2015. Res. World Geogr. 2021, 30, 826–838. [Google Scholar]
  20. Chen, Z. Study on the dynamic change of land use in scenic cities and its interaction mechanism with tourism development—A case study of Yangshuo County, Guangxi Zhuang Autonomous Region. Resour. Sci. 2010, 32, 1980–1986. [Google Scholar]
  21. Zuo, B. Study on tourism driving force of land use change. J. Yunnan Univ. Financ. Trade 2005, 5, 106–110. [Google Scholar]
  22. Ma, X.; Jin, Y. Study on the mechanism of urban land use change and tourism development. Tour. Trib. 2014, 29, 87–96. [Google Scholar]
  23. van Vliet, J.; de Groot, H.L.F.; Rietveld, P.; Verburg, P.H. Manifestations and underlying drivers of agricultural land use change in Europe. Landsc. Urban Plan. 2015, 133, 24–36. [Google Scholar] [CrossRef] [Green Version]
  24. Long, H.; Qu, Y. Land use transitions and land management: A mutual feedback perspective. Land Use Policy 2018, 74, 111–120. [Google Scholar] [CrossRef]
  25. Shen, G.; Yang, X.; Jin, Y.; Luo, S.; Xu, B.; Zhou, Q. Land Use Changes in the Zoige Plateau Based on the Object-Oriented Method and Their Effects on Landscape Patterns. Remote Sens. 2020, 12, 14. [Google Scholar] [CrossRef] [Green Version]
  26. Khwarahm, N.R.; Qader, S.; Ararat, K.; Fadhil Al-Quraishi, A.M. Predicting and mapping land cover/land use changes in Erbil /Iraq using CA-Markov synergy model. Earth Sci. Inform. 2021, 14, 393–406. [Google Scholar] [CrossRef]
  27. Jiang, Y.; Gu, P.; Chen, Y.; He, D.; Mao, Q. Influence of land use and street characteristics on car ownership and use: Evidence from Jinan, China. Transp. Res. Part D Transp. Environ. 2017, 52, 518–534. [Google Scholar] [CrossRef]
  28. Costanza, R.; Arge, A.R.; Groot, R.D.; Farberk, S.; Belt, M.V. The value of the world’s ecosystem services and natural capital. Ecol. Econ. 1997, 25, 3–15. [Google Scholar] [CrossRef]
  29. Xie, G.; Zhen, L.; Lu, C.; Xiao, Y.; Chen, C. A method of valuing ecosystem services based on expert knowledge. J. Nat. Resour. 2008, 23, 911–919. [Google Scholar]
  30. Xu, W.; Guo, L.; Xue, D.; Sun, S. Temporal and spatial evolution of land use pattern and ecosystem service value in southern Jiangxi. J. Ecol. 2019, 39, 1969–1978. [Google Scholar]
  31. Lei, J.; Chen, Z.; Ting, T.W.; Li, Y.; Yang, Q.; Chen, X. Spatial autocorrelation pattern of land use and ecosystem service value in the northeast of Hainan Island. J. Ecol. 2019, 39, 2366–2377. [Google Scholar]
  32. Lei, J.; Wang, S.; Wang, J.; Wu, S.; You, X.; Wu, J.; Cui, P.; Ding, H. Impact of land use change on ecosystem service value in Xunwu County. J. Ecol. 2019, 39, 3089–3099. [Google Scholar]
  33. Yao, X.; Zeng, J.; Li, W. Spatial correlation between urbanization and land ecosystem service value in Wuhan metropolitan area. Trans. Chin. Soc. Agric. Eng. 2015, 31, 249–256. [Google Scholar]
  34. Xie, G.; Zhang, C.; Zhang, L.; Chen, W.; Li, S. Improvement of ecosystem service valuation method based on unit area value equivalent factor. J. Nat. Resour. 2015, 30, 1243–1254. [Google Scholar]
  35. Hou, L.; Wu, F.; Xie, X. The spatial characteristics and relationships between landscape pattern and ecosystem service value along an urban-rural gradient in Xi’an city, China. Ecol. Indic. 2020, 108, 105720. [Google Scholar] [CrossRef]
  36. Lei, J.; Chen, Z.; Chen, X.; Li, Y.; Wu, T.T. Temporal and spatial changes of land use and ecosystem service value in Hainan Island from 1980 to 2018. J. Ecol. 2020, 40, 4760–4773. [Google Scholar]
  37. Macdonald, W.G.M. Some Large Sample Tests for Nonnormality in The Linear Regression Model. Publ. Am. Stat. Assoc. 1980, 75, 16–28. [Google Scholar]
  38. Ploberger, W.; Krämer, W.; Kontrus, K. A new test for structural stability in the linear regression model. J. Econom. 1989, 40, 307–318. [Google Scholar] [CrossRef]
  39. Wang, X.L.; Bao, Y. Discussion on research methods of land use dynamic change. Prog. Geogr. Sci. 1999, 18, 83–89. [Google Scholar]
  40. Zhao, Y.; Zeng, C. Temporal and spatial evolution analysis and influencing factors of ecological service value in Wuhan Urban Circle. J. Ecol. 2019, 39, 1426–1440. [Google Scholar]
  41. Petrov, L.O.; Lavalle, C.; Kasanko, M. Urban land use scenarios for a tourist region in Europe: Applying the MOLAND model to Algarve, Portugal. Landsc. Urban Plan. 2009, 92, 10–23. [Google Scholar] [CrossRef]
  42. Luo, N.; Teng, Y.; Hu, J.; Wang, Y.; Li, L. Study on land use change and its relationship with tourism development in Lijiang River Basin. J. Northwest. For. Univ. 2021, 36, 262–268. [Google Scholar]
  43. Xi, J.; Zhao, M.; Ge, Q.; Kong, Q. Changes in land use of a village driven by over 25 years of tourism: The case of Gougezhuang village, China. Land Use Policy 2014, 40, 119–130. [Google Scholar] [CrossRef]
  44. Cao, S.; Zhang, J.; Su, W. Difference in the net value of ecological services between natural and artificial forests in China. Conserv. Biol. 2019, 33, 1076–1083. [Google Scholar] [CrossRef] [PubMed] [Green Version]
  45. Zhang, Z.; Liu, L.; He, X.; Li, Z.; Wang, P. Evaluation on glaciers ecological services value in the Tianshan Mountains, Northwest China. J. Geogr. Sci. 2019, 29, 101–114. [Google Scholar] [CrossRef] [Green Version]
  46. Zhao, J.H.; Zhao, L.Y.; He, C.; Du, W.M.; Huang, C. Ecological risks resulting from changes in land use in Wuhan in the past 15 years. In Proceedings of the 2015 International Conference on Sustainable Development 2016, Wuhan, China, 1 April 2016; Sustainable Development: Nanjing, China, 2016; pp. 113–133. [Google Scholar]
Figure 1. Wuhan metropolitan area.
Land 11 00001 g001
Figure 2. Evolution of land-use in the Wuhan metropolitan area from 1990 to 2020.
Land 11 00001 g002
Figure 3. Dynamic attitude of single land-use in the Wuhan metropolitan area.
Land 11 00001 g003
Figure 4. Dynamic attitude of comprehensive land-use in the Wuhan metropolitan area.
Land 11 00001 g004
Figure 5. Mechanism of land use promoting tourism economic development.
Land 11 00001 g005
Table 1. ESV equivalent per unit area of ecosystem in Wuhan metropolitan area.
Classification IClassification IIForested LandGrasslandCultivatedWaterBuiltUnutilized
Supply
service
Food production0.330.431.000.530.000.26
Raw material production2.980.360.390.350.000.04
Regulating servicesGas exchange4.321.500.720.510.000.39
Climate regulation4.071.560.972.060.000.40
Hydrological adjusting4.091.520.7718.770.000.49
Waste disposal1.721.321.3914.850.000.26
Support
services
Soil formation and conservation4.022.241.470.410.000.49
Biodiversity conservation4.511.871.023.430.000.40
Cultural
services
Provide landscape aesthetics2.080.870.174.440.580.36
Cultural entertainment0.260.550.600.740.840.24
Natural heritage and diversity0.460.850.740.760.380.053
Table 2. Change of land use types in Wuhan metropolitan area from 1980 to 2020.
Land TypeForestGrassCultivatedWaterBuiltUnutilized
1990Area17,579.541441.3130,285.195549.422834.82171.19
Rate30.38%2.49%52.34%9.59%4.90%0.30%
2005Area17,494.821418.6829,402.605988.833295.57235.82
Rate30.25%2.45%50.84%10.35%5.70%0.41%
Variation−84.72−22.63−882.60439.40460.7564.63
Range of change−0.13%−0.04%−1.50%0.76%0.8%0.11%
2005Area17,494.821418.6829,402.605988.833295.57235.82
Rate30.25%2.45%50.84%10.35%5.70%0.41%
2020Area17,419.561396.8127,617.046320.264910.30172.34
Rate30.12%2.42%47.75%10.93%8.49%0.30%
Variation−75.26−21.87−1785.56331.431614.73−63.48
Range of change−0.13%−0.03%−3.09%0.58%2.79%−0.11%
1990Area17,579.541441.3130,285.195549.422834.82171.19
Rate30.38%2.49%52.34%9.59%4.90%0.30%
2020Area17,419.561396.8127,617.046320.264910.30172.34
Rate30.12%2.42%47.75%10.93%8.49%0.30%
Variation−159.98−44.50−2668.15770.842075.481.15
Range of change−0.26%−0.07%−4.59%1.34%5.59%0.00%
Note: The unit of area is square kilometers, and the range of change is annual average.
Table 3. Land use type transfer matrix of Wuhan metropolitan area from 1990 to 2020.
YearLand TypeForestGrassCropWaterBuiltUnutilizedTotal
1990–2005Forest17,345.7220.40143.8821.1647.860.5217,579.54
Grass25.941384.1714.1211.145.730.201441.31
Crop122.818.4629,098.95636.80410.387.7930,285.19
Water10.436.42109.815288.6941.8592.235549.42
Built3.600.2636.614.862787.871.632834.82
Unutilized2.031.354.7027.512.06133.54171.19
Total17,510.541421.0629,408.085990.163295.75235.9057,861.48
2006–2020Forest15,641.49177.101258.71133.15281.962.4217,494.82
Grass192.801124.8452.9518.7728.181.131418.68
Crop1404.2171.0524,852.511038.952005.3030.5829,402.60
Water111.8215.65678.694966.97183.4632.245988.83
Built65.126.94746.6375.392399.971.523295.57
Unutilized4.111.2327.5587.0311.44104.45235.82
Forest17,419.561396.8127,617.046320.264910.30172.3457,836.32
Table 4. Changes of total value of ecosystem services in Wuhan metropolitan area.
Land TypeESV1990–20052006–20201990–2020
199020052020Δ ESVRate of Change %Δ ESVRate of Change %Δ ESVRate of Change %
Forest1372.931332.921251.97−40.01−2.91−80.95−6.07−120.96−8.81
Grass2487.412475.432464.78−11.99−0.48−10.65−0.43−22.64−0.91
Crop92.4290.9789.57−1.45−1.57−1.40−1.54−2.85−3.09
Water1275.561376.571452.75101.007.9276.185.53177.1813.89
Built25.0329.1043.364.0716.2514.2649.0018.3373.21
Unutilized2.843.912.861.0737.75−1.05−26.920.020.67
Total5256.205308.905305.2952.691.00−3.61−0.0749.080.93
Note: The unit of Ecosystem Service Value is 10 million.
Table 5. Changes of ecosystem service value structure in Wuhan metropolitan area.
CategoryEcological Service FunctionIndividual ESVΔ ESVRate of Change %
19902005202090–0506–2090–2090–0506–2090–20
Supply serviceFood production194.74191.45183.30−3.29−8.15−11.44−1.69−4.26−6.24
Raw material production327.08324.88320.88−2.20−4.00−6.20−0.67−1.23−1.93
Regulating servicesGas exchange504.40500.54493.18−3.86−7.36−11.21−0.76−1.47−2.27
Climate regulation562.61561.12554.17−1.50−6.94−8.44−0.27−1.24−1.52
Hydrological adjusting989.31024.791046.7435.4221.9557.373.582.145.48
Waste disposal768.75793.96805.0825.2211.1136.333.281.404.51
Support servicesSoil formation protection592.55585.31571.22−7.25−14.09−21.33−1.22−2.41−3.73
Biodiversity conservation647.49648.51643.161.02−5.35−4.330.16−0.82−0.67
Cultural servicesProvide landscape aesthetics340.06349.36358.729.309.3518.652.732.685.20
Cultural entertainment147.50148.30150.670.802.373.180.541.602.11
Natural heritage and diversity181.66180.68178.17−0.98−2.51−3.49−0.54−1.39−1.96
Note: The unit of Ecosystem Service Value is 10 million.
Table 6. The impact of land ecological value on the visitor economy.
VariableTMij
(1)(2)(3)
ESVi111.94 *
(1.81)
ESVi2 21.72 *
(1.90)
ESVi3 60.97 *
(1.75)
PO−98.80 **−98.77 **−101.57 **
(−31.91)(−37.62)(−34.46)
ST3.64 ***3.64 ***3.64 ***
(572.56)(662.15)(674.32)
AW−34.79 ***−34.82 ***−34.71 ***
(−82.95)(−97.60)(−97.40)
C213.58 ***398.33 ***403.73 ***
(85.40)(100.86)(100.33)
N666
R20.860.870.80
Note: * represents the significance level of 10%, ** represents the significance level of 5% and *** represents the significance level of 1%.
Publisher’s Note: MDPI stays neutral with regard to jurisdictional claims in published maps and institutional affiliations.

