1. Introduction
Coal is an important source of energy in the world [
1] and the economy of some regions is highly dependent on coal production, which will likely last for a long time [
2]. Coal mining will inevitably cause large-scale disturbance to the land [
3] and severe damage to the vegetation, soil, and landscape of the original landform–a serious threat to the ecological security of the region [
4,
5]. Therefore, it is the consensus of major countries to implement vegetation restoration projects for dumps and mines formed by coal mining [
3,
6,
7,
8]. For arid and semi-arid grassland areas with low precipitation and ecological fragility, in particular, vegetation restoration projects are very necessary [
9]. After the restoration of vegetation in the ecologically fragile area, if it is not effectively monitored and managed, there is a high probability that the vegetation coverage there will degrade [
10]. Vegetation monitoring in mines will help us understand the vegetation status and provide a basis for scientific decision-making on vegetation restoration in the mining area and maintenance of the restoration area.
There are two main methods for monitoring reclaimed vegetation in mining areas: field survey and remote sensing monitoring. Due to the huge area and inconvenient transportation of the mining area, the use of remote sensing data and methods to monitor the restoration of vegetation in the mining area is very promising [
11]. The most common way of vegetation monitoring is to calculate various vegetation indices that reflect the vegetation coverage on the ground-based on the reflectivity of each waveband. The most widely used vegetation index is the normalized difference vegetation index (NDVI) [
12,
13]. NDVI is highly linearly related to the vegetation distribution density, a very effective indicator of vegetation spatial distribution density [
14]. However, NDVI is very sensitive to the soil background and is therefore unsuitable for areas with low vegetation coverage [
15]. In order to reduce the influence of soil background on NDVI, Huete et al. introduced soil adjustment factors on the basis of NDVI and proposed the soil adjustment vegetation index SAVI [
16]. In order to continue to improve the deficiencies of NDVI, new vegetation indices have been proposed, such as TSAVI [
17], MSAVI [
18], GRNDVI [
19], and OSAVI [
15], etc. Purevdorj compared the ability of NDVI and several soil-improved vegetation indices to identify grassland vegetation, and the results show that NDVI and TSAVI have the best results [
13]. Unlike NDVI, some vegetation indices lack a standardization process when designing. For example, the environmental vegetation index (EVI) [
20] and the ratio vegetation index (RVI) [
21], are suitable for low vegetation coverage and high vegetation coverage areas, respectively [
22]. In addition, EVI is also used to refer to the enhanced vegetation index proposed by Huete [
23], which is characterized by introducing other visible light bands other than the red band into calculations to enhance the effect of vegetation recognition. EVI in this paper represents the environmental vegetation index proposed by Clevers in 1986 [
20]. There is a relatively special visible atmospheric resistance vegetation index VARI [
24]. Only three visible bands are added to the calculation instead of the near-infrared band and the red band, which are used to deal with atmospheric interference with good results [
24].
Researchers often use a combination of one or several vegetation indexes to invert surface vegetation conditions. Arzu Erener et al. used the RVI index, NDVI index and tasseled cap transform greenness index to monitor the vegetation restoration status of the Seyitömer open cast coal mine and compared their ability to identify vegetation monitoring in the mining area [
3]. Karan et al. compared the performance of four vegetation indices such as NDVI and RVI and the support vector machine method for vegetation restoration in mining areas [
25]. Dong et al. used the crop leaf area index (LAI) to evaluate the performance of the eight-planted quilt index [
26]. As Sentinel data has the advantages of a short revisit period and high spatial resolution, surface vegetation monitoring based on Sentinel data has become a hot research topic. Tian et al. proposed a vegetation index NSSI suitable for Sentinel data [
27]. Evangelides et al. proposed the red-side vegetation index NDVI
705 based on the red-side band of Sentinel data and used it to study the vegetation restoration after the Cypriot fire. Ramos et al. used Sentinel data to calculate a variety of vegetation indices and used them to invert surface salinity [
28].
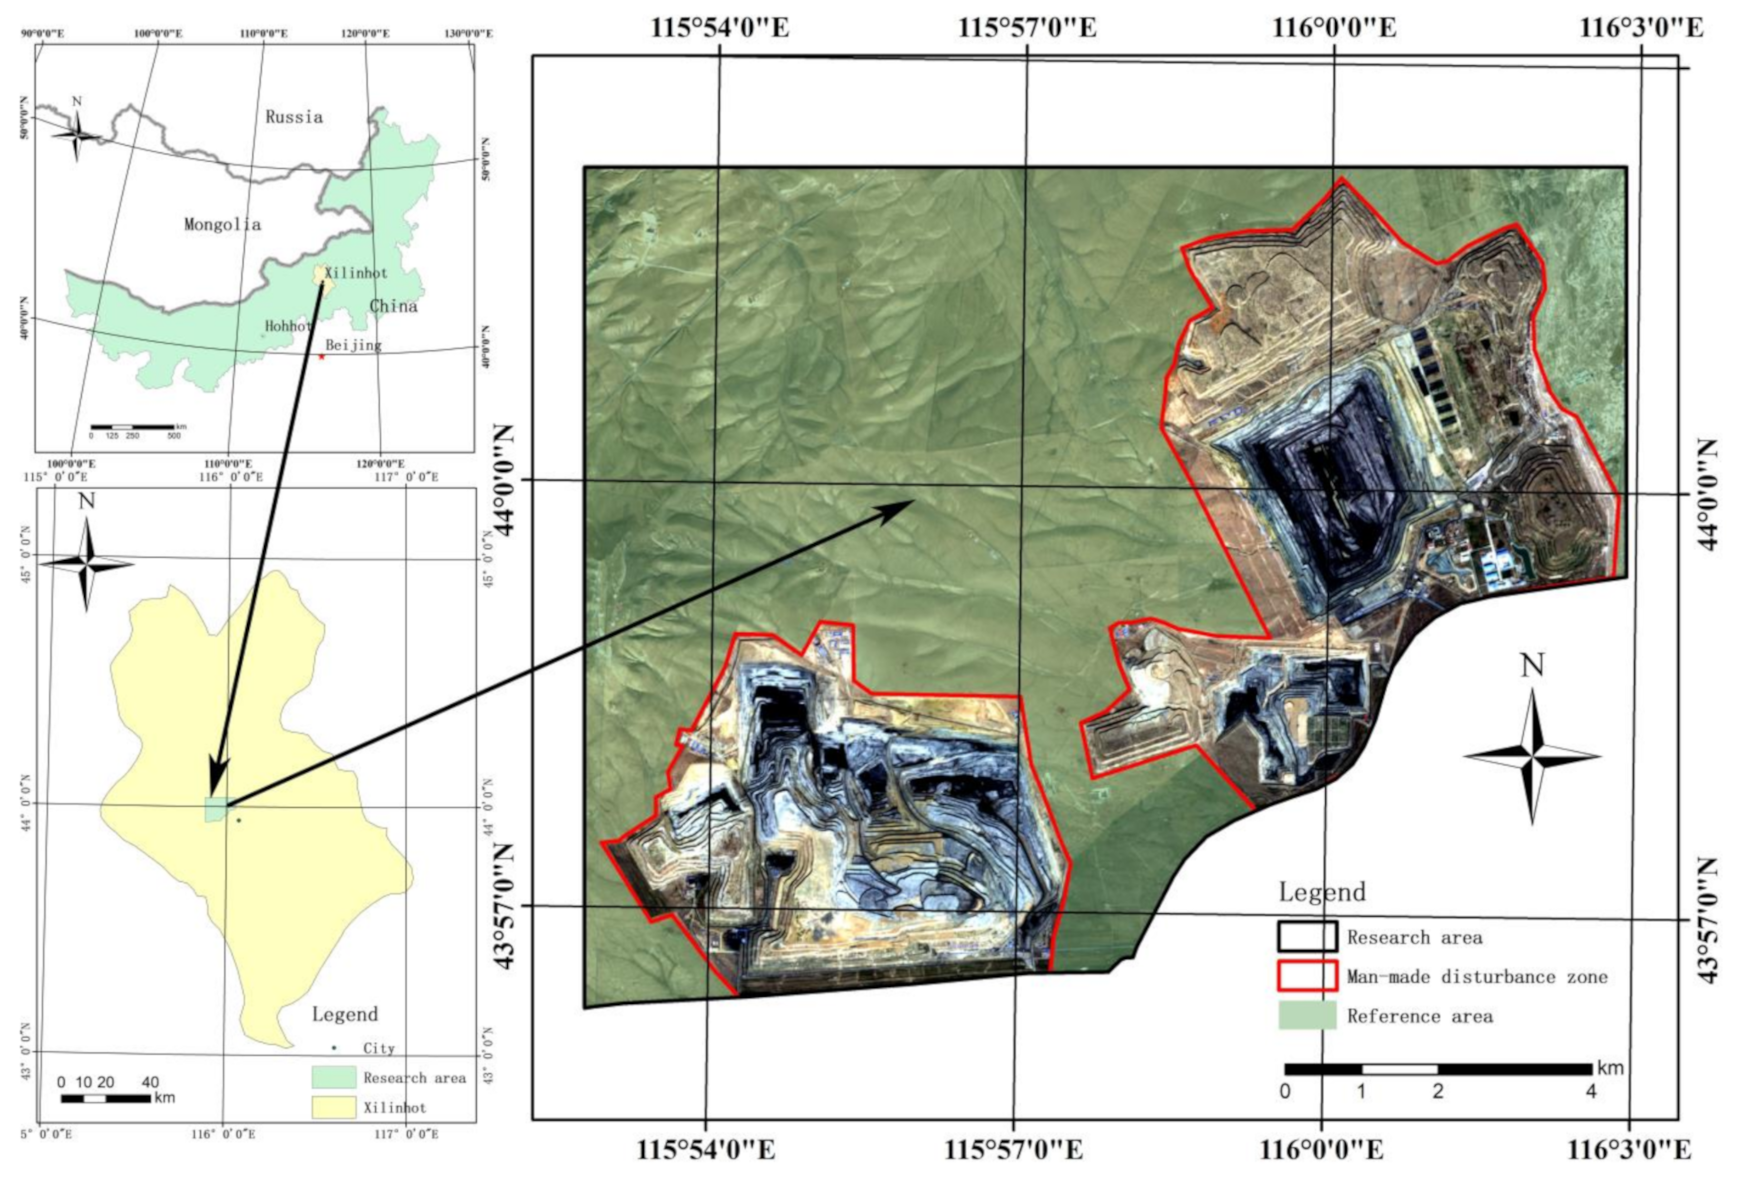
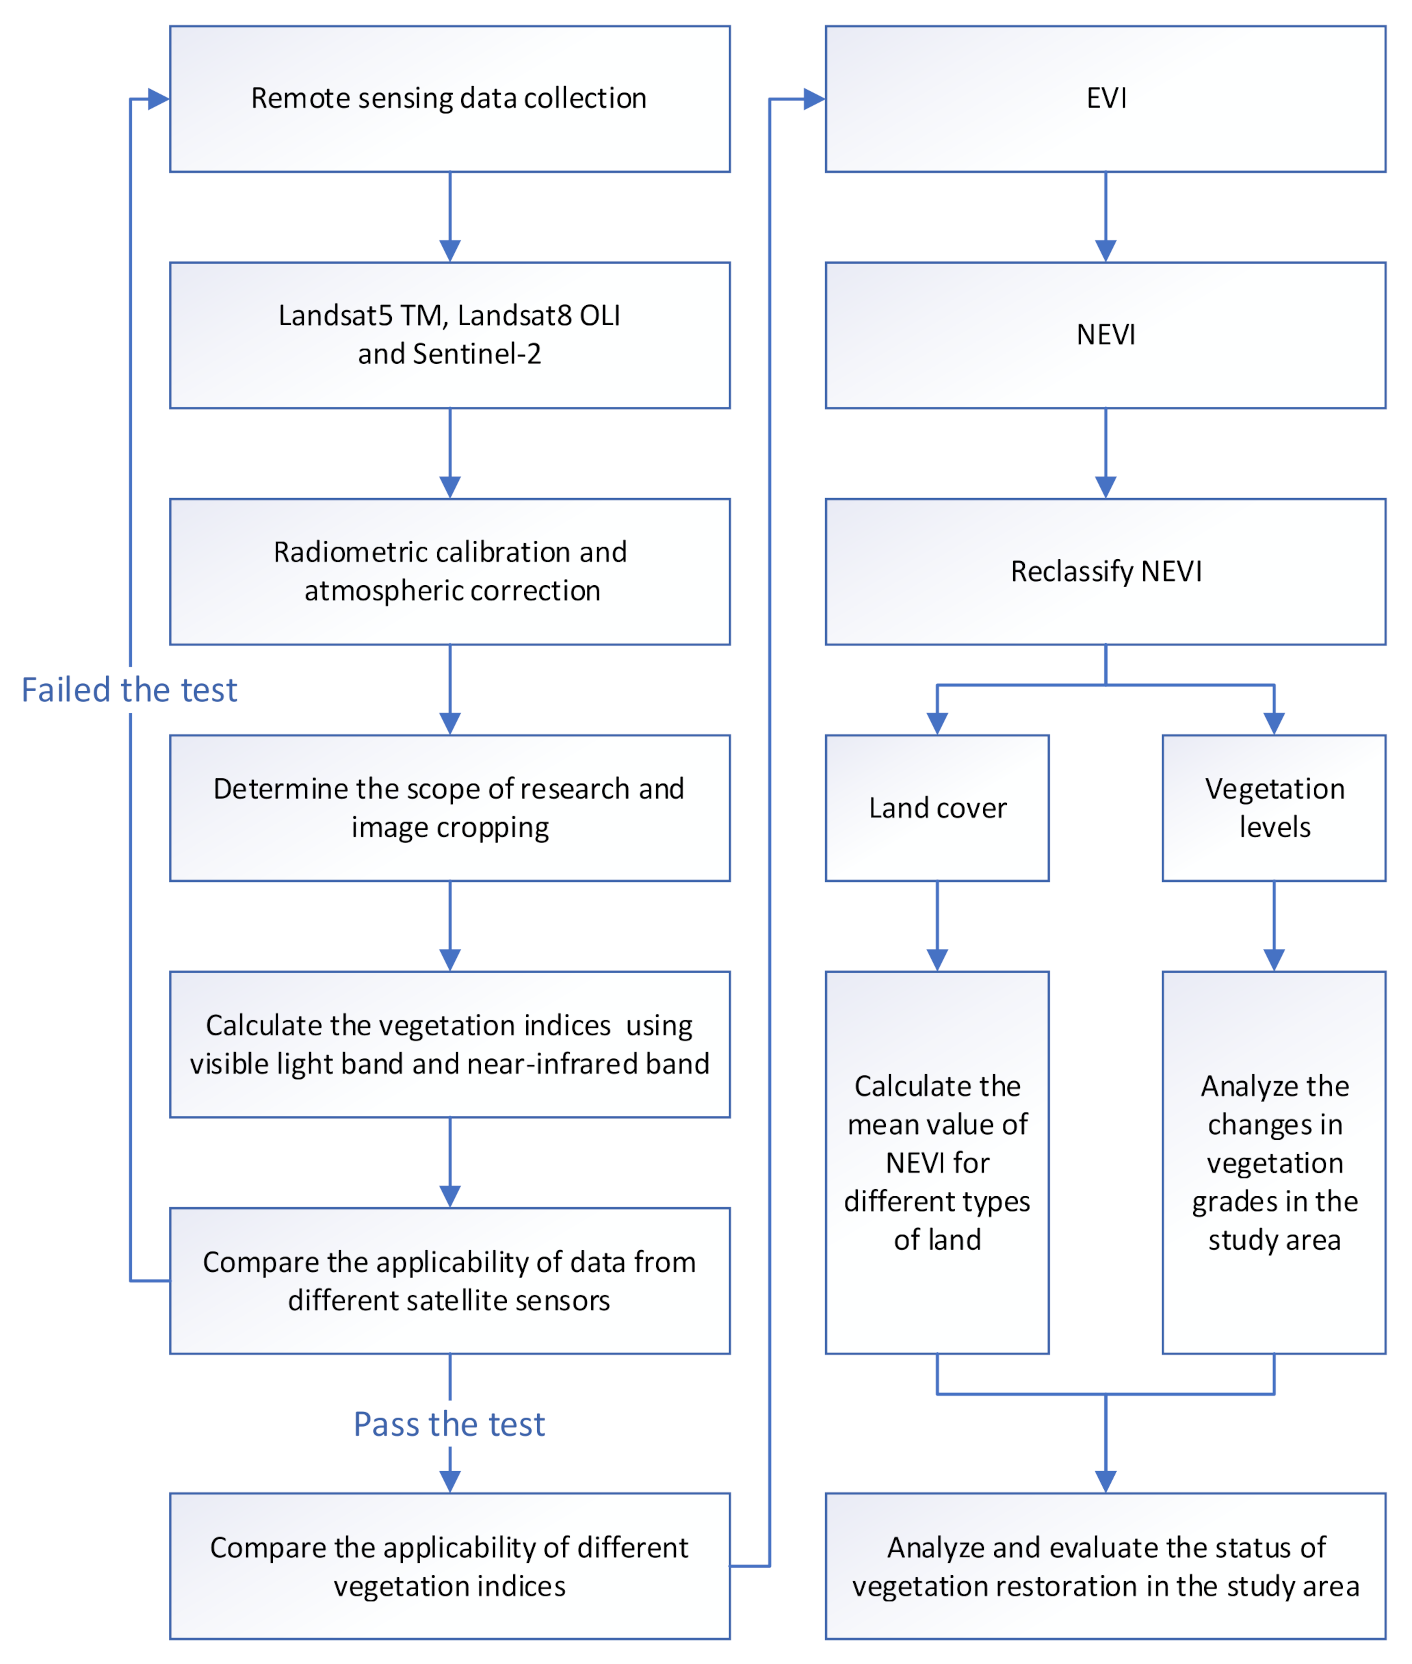
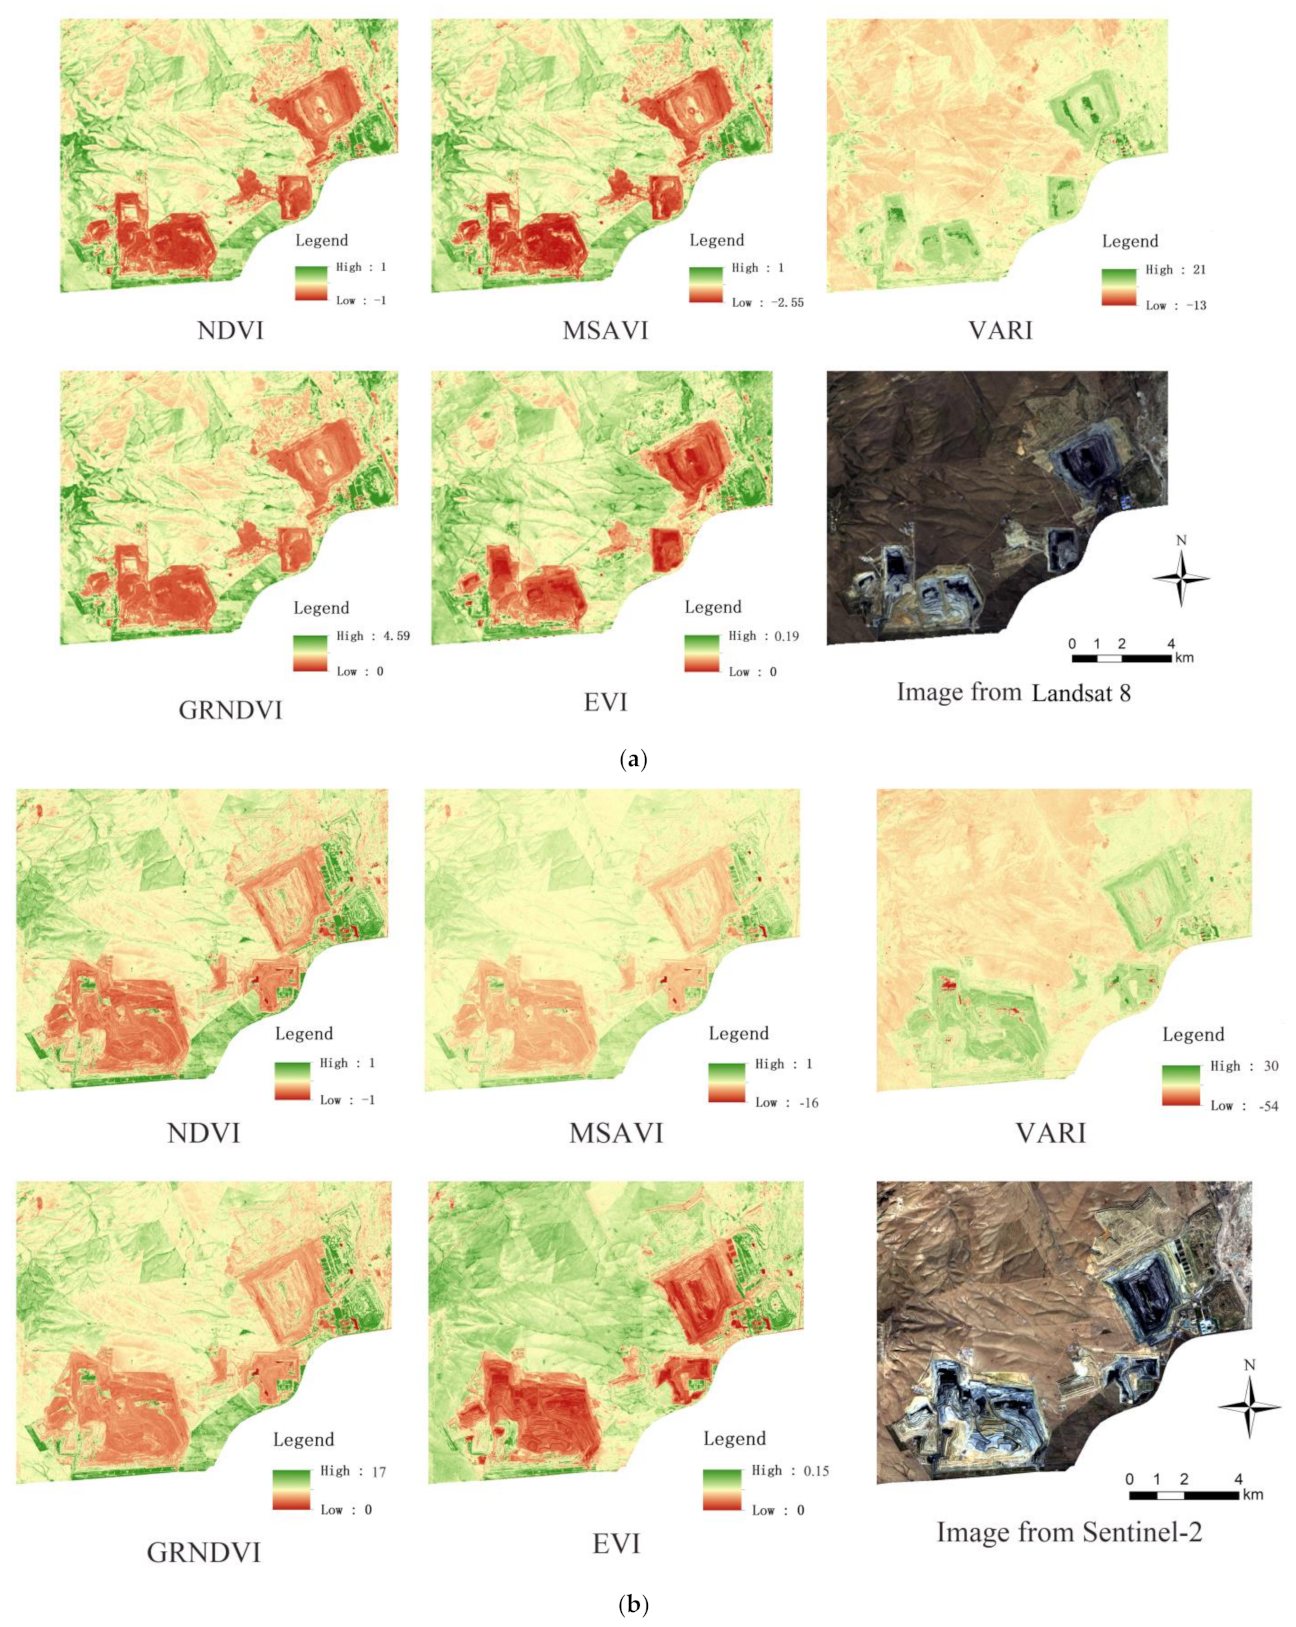
This study calculated a variety of vegetation indices in the Shengli mining area in Inner Mongolia, compared their performance in arid grassland mining areas, and selected the Environmental Vegetation Index (EVI). In response to the issue of the comparability of EVI, a normalized environmental vegetation index (NEVI) with a threshold range of [0, 1] suitable for vegetation monitoring in grassland mining areas was proposed. Then, based on Sentinel data and Landsat data, NEVI was used to monitor vegetation disturbances and vegetation restoration projects caused by mining in the Shengli mining area from 2005 to 2019. The vegetation restoration status of each vegetation restoration monitoring area was evaluated and graded to provide a reference for future vegetation restoration work in Shengli Mining Area.
3. Results
3.1. Multi-Source Remote Sensing Data Comparison
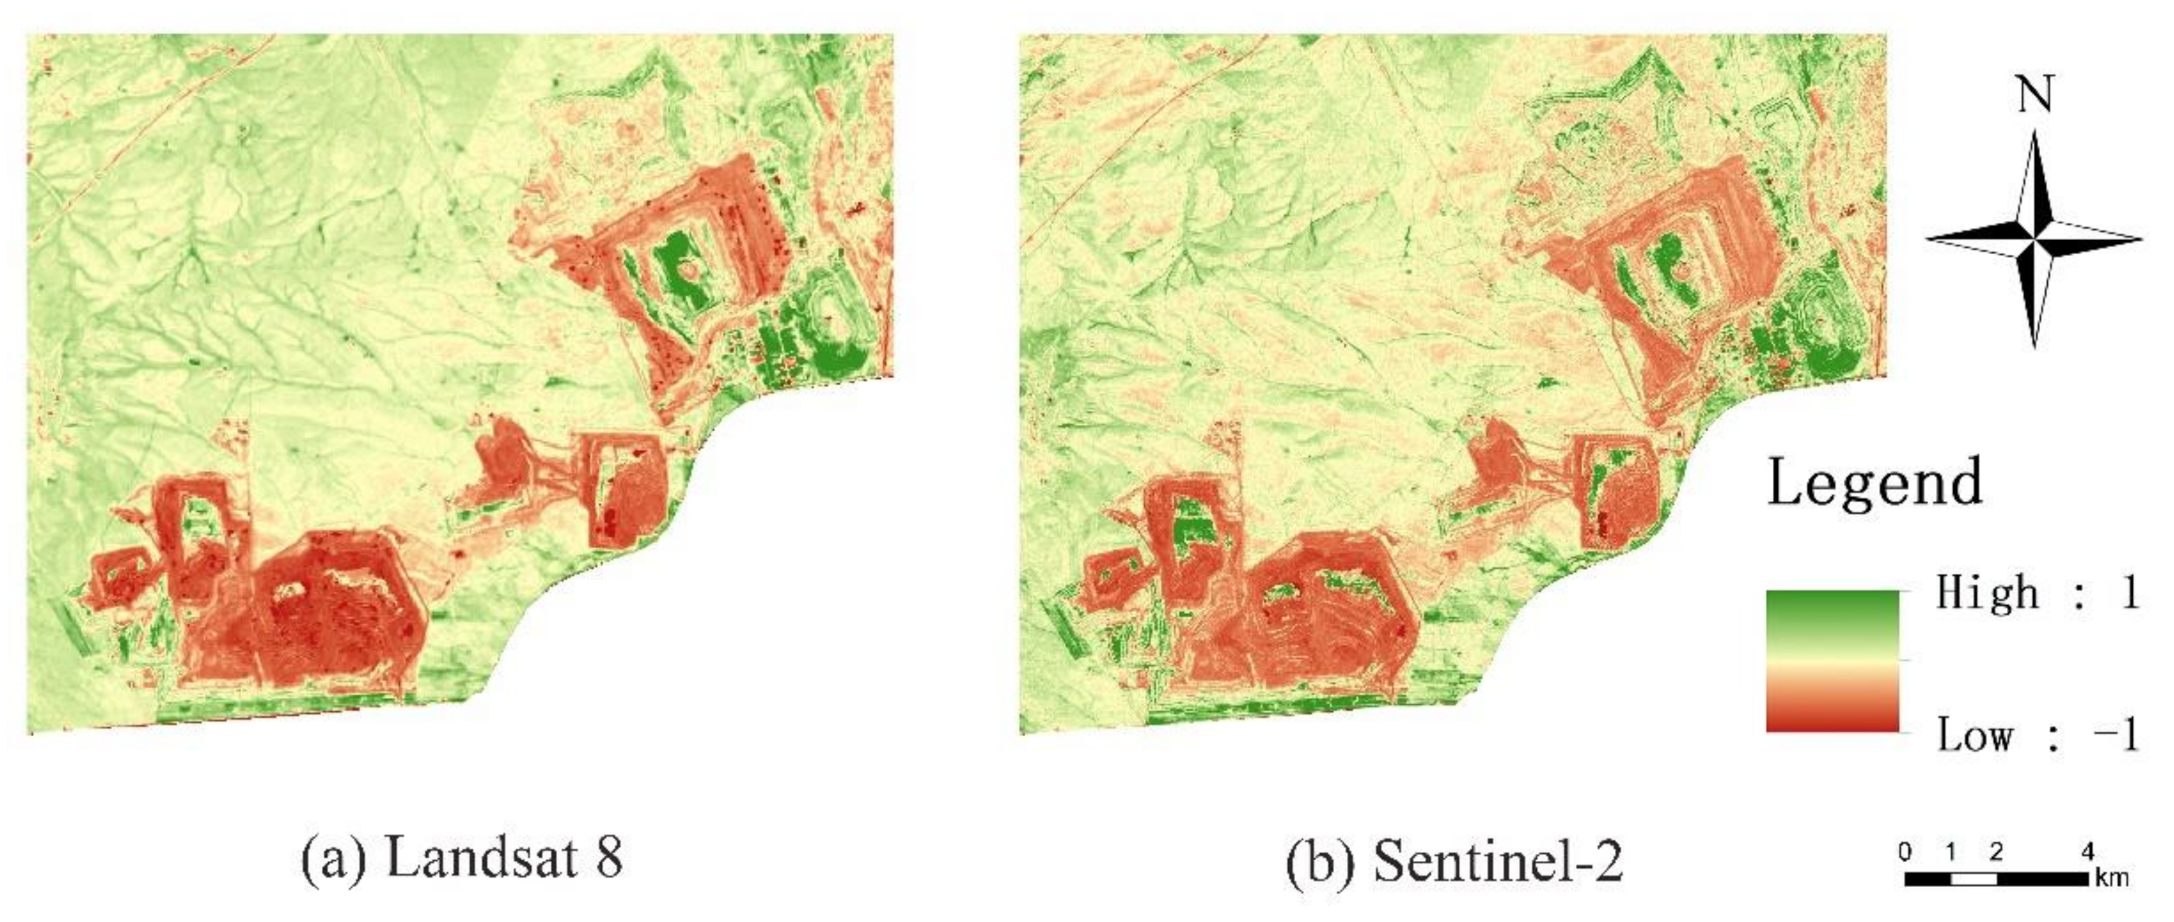
NDVI is calculated by using satellite data of similar time, and the results are referred to as NDVI
S and NDVI
L respectively. The results are shown in
Table 3 and
Figure 4. It can be seen from
Figure 4 that the high and low-value distributions of NDVI
S and NDVI
L have roughly the same range and similar areas. It can be seen from
Table 3 that the maximum, minimum, mean, and variance values of NDVI
S and NDVI
L are close. The average value of NDVI
L is slightly smaller than that of NDVI
S. Considering the time gap between the two periods of data is close to 20 days because the grassland in the study area has gradually entered the withering period, a slight decrease in the average value is normal. The correlation between the two is 0.634, indicating that the two have a strong positive correlation and reflect similar vegetation distribution.
For sampling inspection, defining D = |NDVIL − NDVIS|. There are 710 sample points where D is less than 0.2, accounting for 96.336%, and there are 630 sample points where D is less than 0.1, accounting for 85.482%, and there are 461 sample points where D is less than 0.05, accounting for 62.551%. Considering that the imaging time difference between the two is 18 days, this gap is considered acceptable. According to the above test results, Sentinel-2A and Landsat 8 OLI can be used in this study.
3.2. Temporal and Spatial Changes of Vegetation in the Study Area
3.2.1. Changes in Vegetation Coverage
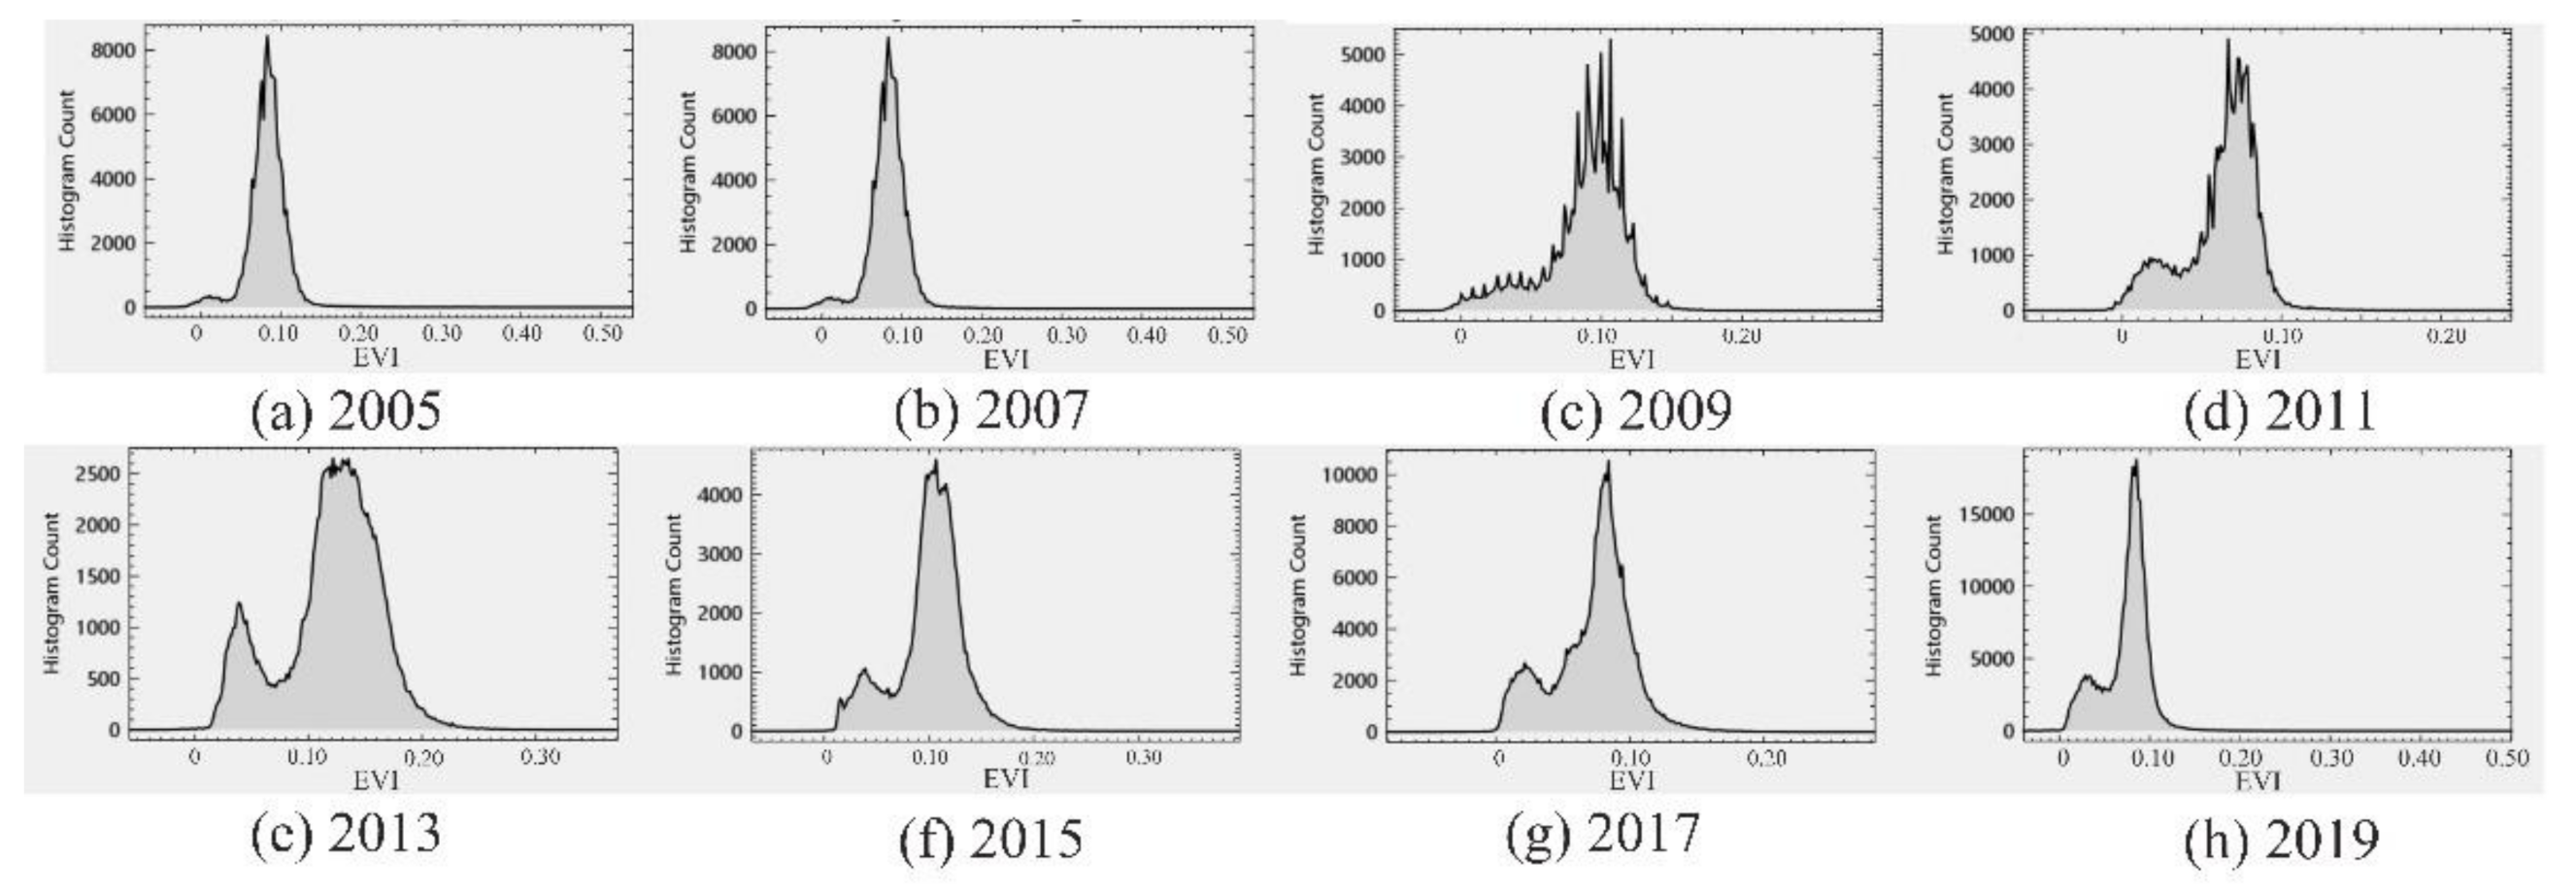
Equation (1) is used to calculate the NEVI distribution in the study area. Before calculating NEVI, it is necessary to determine the α and β values according to the distribution of EVI values in each period, as shown in
Table 4. The histogram of EVI distribution is shown in attached
Figure A1 (
Appendix A).
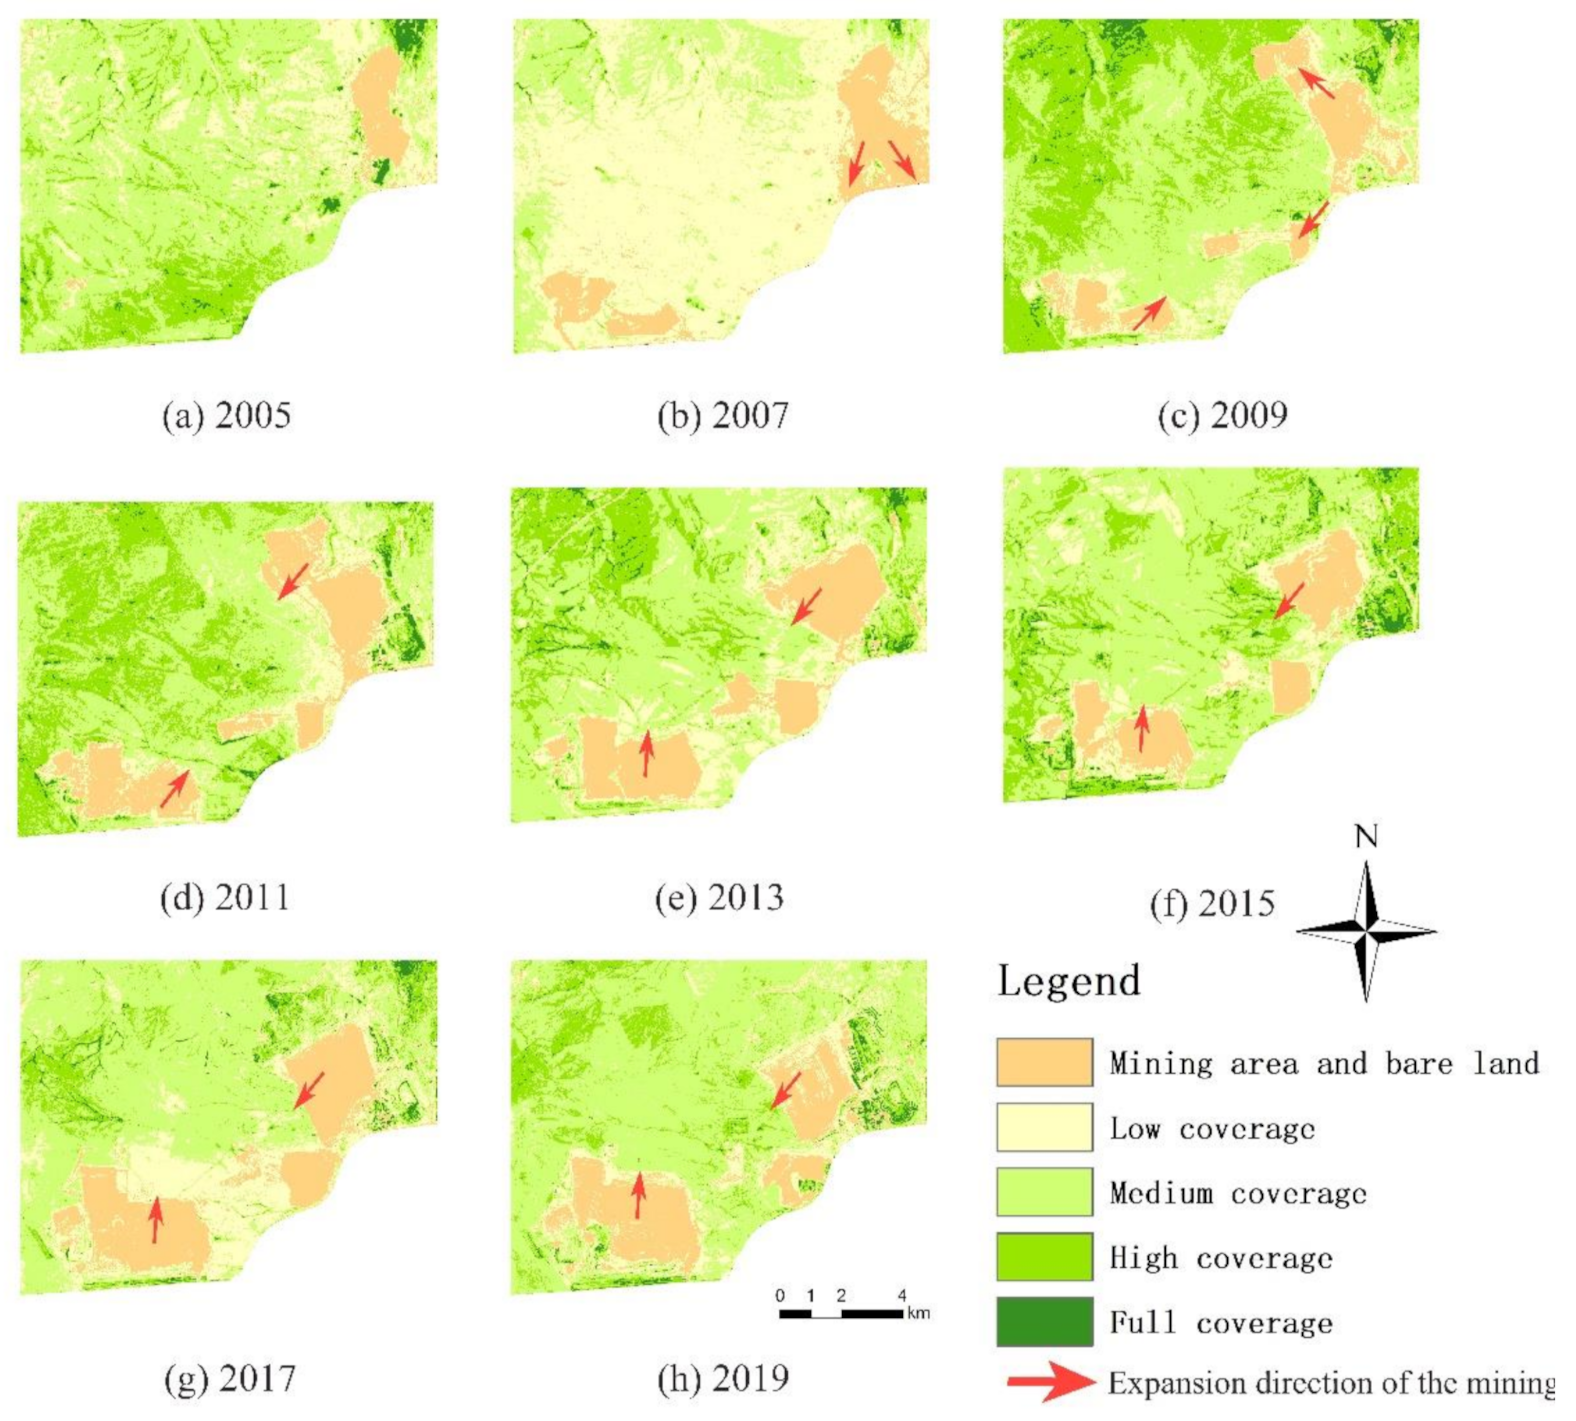
Figure 5 shows the surface coverage of the study area obtained by reclassifying the calculated NEVI maps over the years. After comparing with remote sensing images, the classification standard is determined to be [0, 0.28] as mining area and bare land area, and the remaining areas are equally divided into 4 points, namely low cover grassland ([0.28, 0.46]) and medium-cover grassland ([0.46, 0.64]), highly covered grassland ([0.64, 0.82]), completely covered grassland ([0.82, 1]).
According to
Figure 5, the mining land and bare land in the eastern mining area of the study area are showing an expansion trend. From 2005 to 2011, the expansion direction was mainly in the east and north, and from 2011 to 2019, the expansion was mainly in the east. In the process of expansion of mining land and bare land, large areas of vegetation restoration have appeared on the mining land and bare land in the northwest, northeast, and southeast of the eastern mining area.
The same features can be found in the mining area in the eastern part of the study area. The large-scale mining land and bare land in the eastern mining area of the study area appeared in 2007. From 2007 to 2019, it has been continuously expanding to the true north. At the same time as the expansion, the mining land and bare land beside the road in the south of the mining area have also been expanded. There are traces of vegetation restoration, but the area is relatively small. The above research shows that the destruction of vegetation by mining activities in the study area and the artificially driven vegetation restoration are carried out at the same time. The spatial sequence of mining and vegetation restoration can be confirmed in other documents [
30].
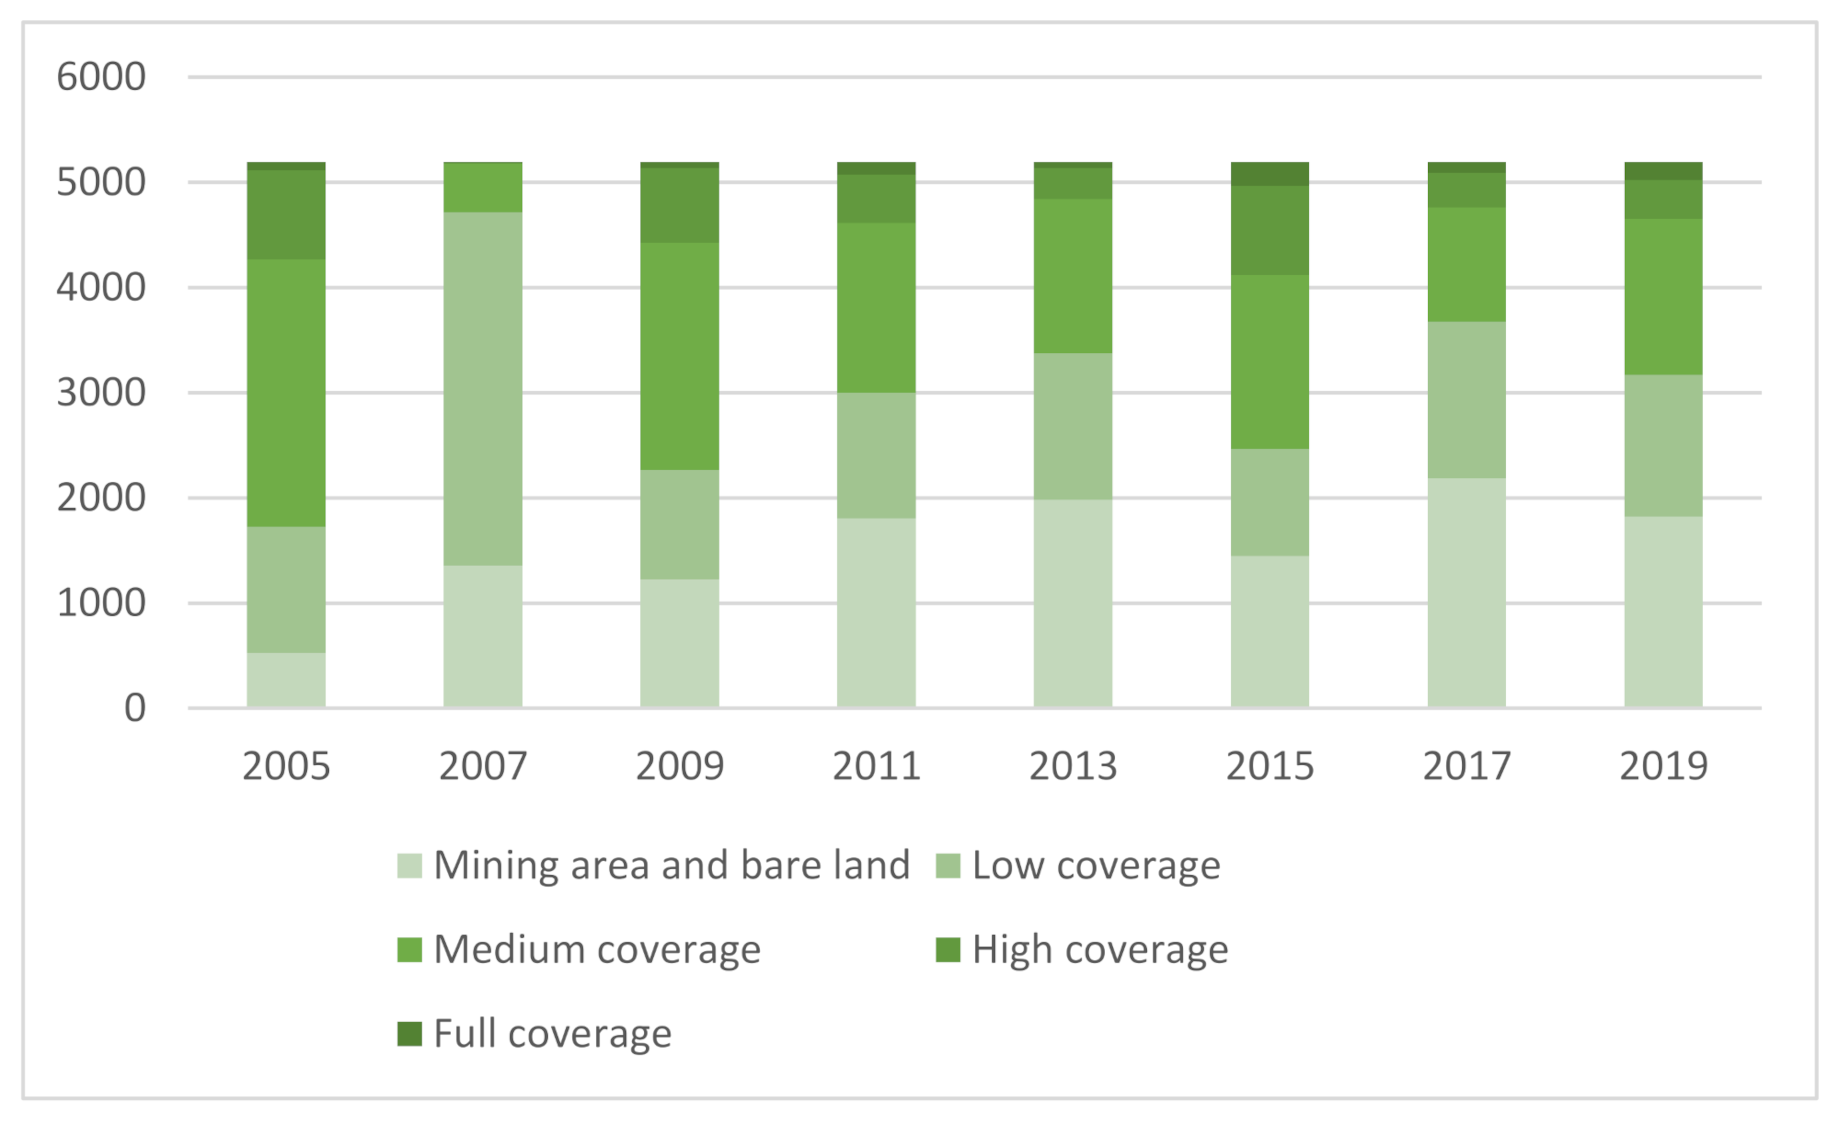
In order to highlight the characteristics of land change in mining areas dominated by artificial influences, we have made statistics on the area of mining land and bare land within the mining area and the area of various levels of vegetation (the inner range of the mining area is the union of mining land and bare land over the years). The statistical range is shown in
Figure 1, and the statistical result is shown in
Figure 6.
We can see in
Figure 5 that the area of mining land and bare land is showing an overall upward trend. However, due to the existence of reclamation activities, the area of mining land and bare land decreased significantly from 2007 to 2009, from 2013 to 2015, and from 2017 to 2019, corresponding to the southeast, central, and southeast of the study area, respectively. From 2011 to 2013, there were significant reclamation activities on the bare land in the northwest of the eastern mining area. However, due to the expansion of mining activities, the area of mining land and bare land still increased significantly from 2011 to 2013.
3.2.2. Inter-Annual Change of Land Cover Type
Compared with the construction records of enterprises, remote sensing monitoring has the advantages of regularity, easy access, and rich information. The most important reason is that under the Chinese government’s “destroyer and beneficiary responsible for reclamation” regulations, land reclamation in mining areas is an economic burden for enterprises. The vegetation restoration effect achieved in the work records of the land reclamation work in the mining area under the responsibility of the enterprise always tends to be exaggerated and is not completely credible. Therefore, we used remote sensing to monitor the effect of vegetation restoration.
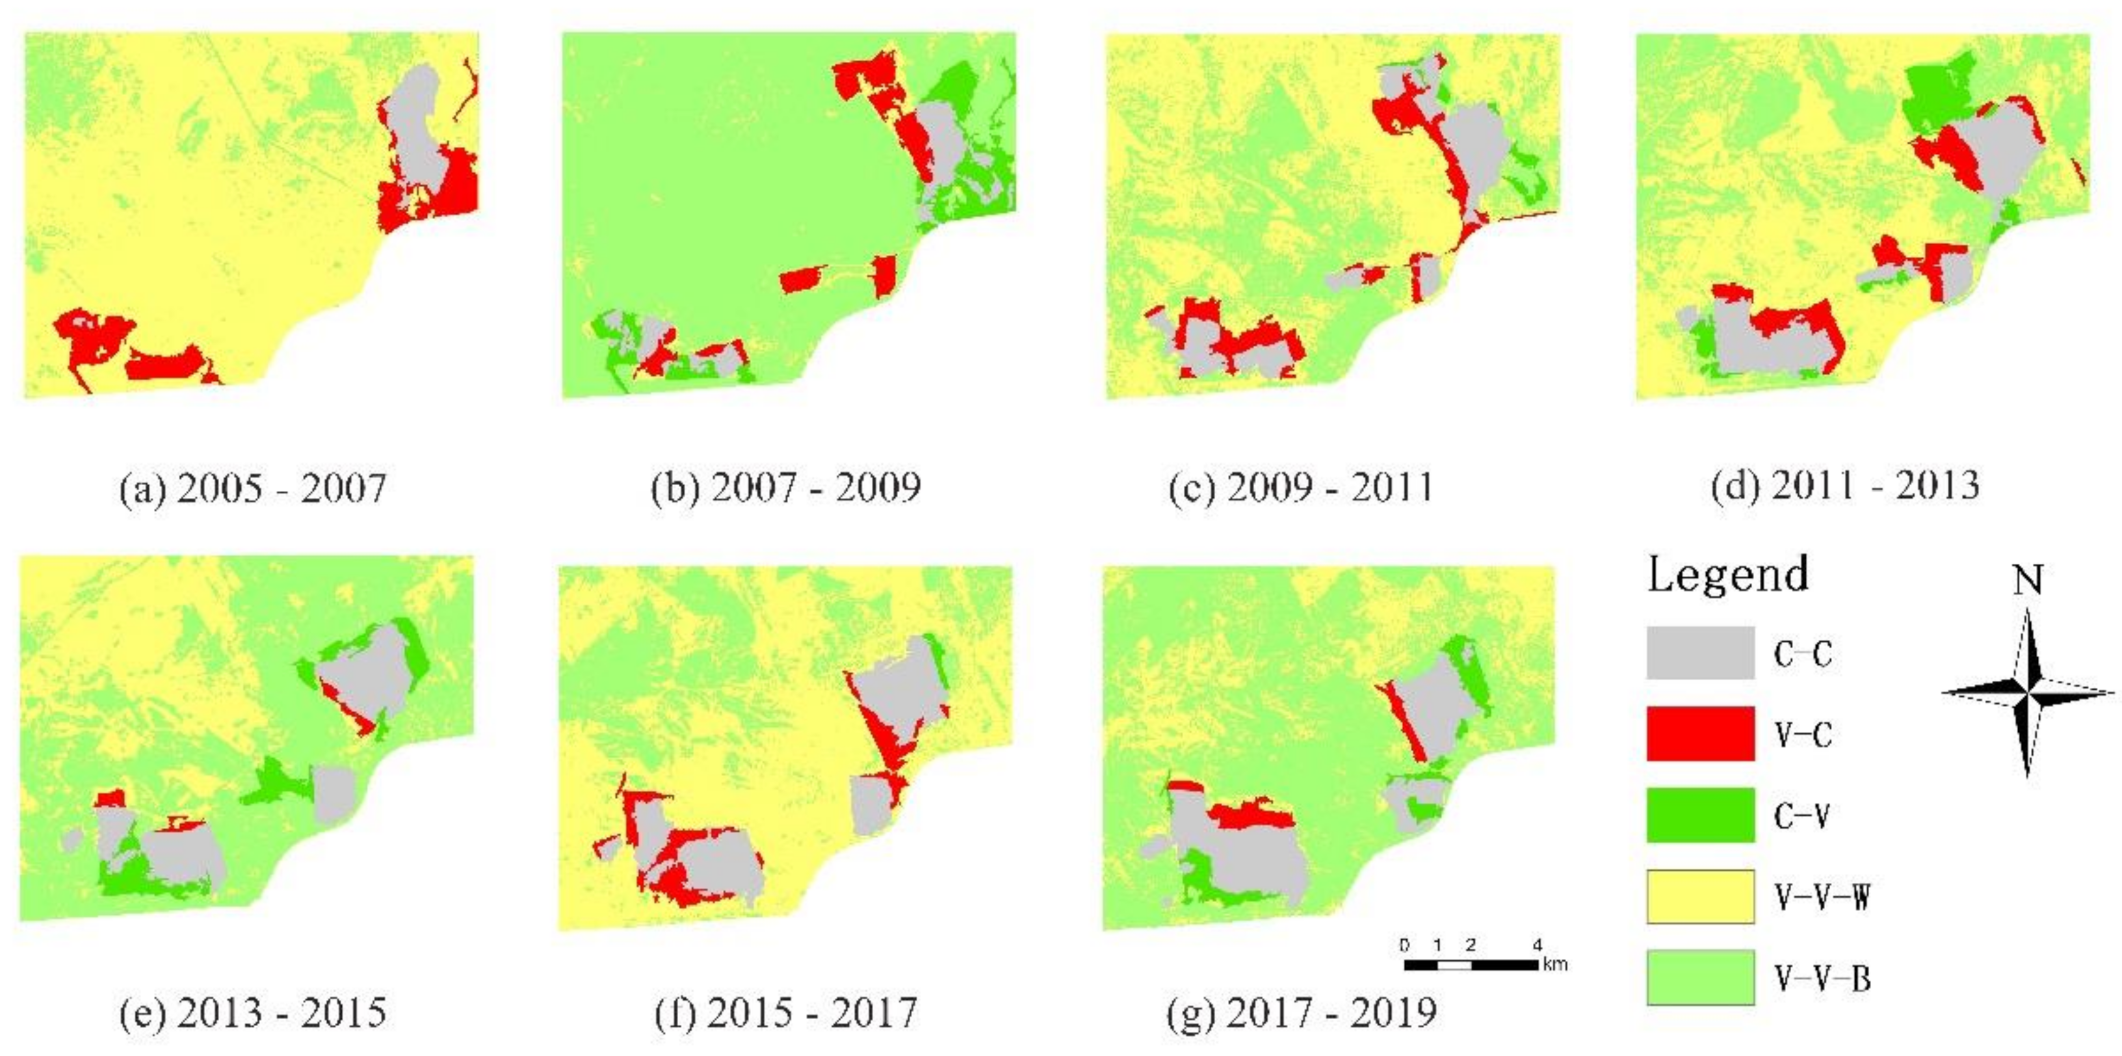
Taking 0.28 as the boundary, the land types in the study area are divided into two categories: coal and bare land (C), and vegetation (V). The annual land type boundaries are converted to vector boundaries. Then the data of two adjacent periods are superimposed and analyzed to obtain the expanded range of bare land (V-C) and the range of vegetation restoration (C-V) between the two adjacent periods of data. At the same time, for the area where the data in the two periods are both vegetations (V-V), the NEVI of the two adjacent periods is used as the difference to reflect the change in vegetation quality in the area. With 0 as the limit, the V-V area can be divided into two areas: better (V-V-B) and worse (V-V-W). For the areas where both the data of the two phases are mining areas and bare land (C-C), the vegetation coverage is too low, so detailed analysis will not be done. The result is shown in
Figure 7.
It can be seen from
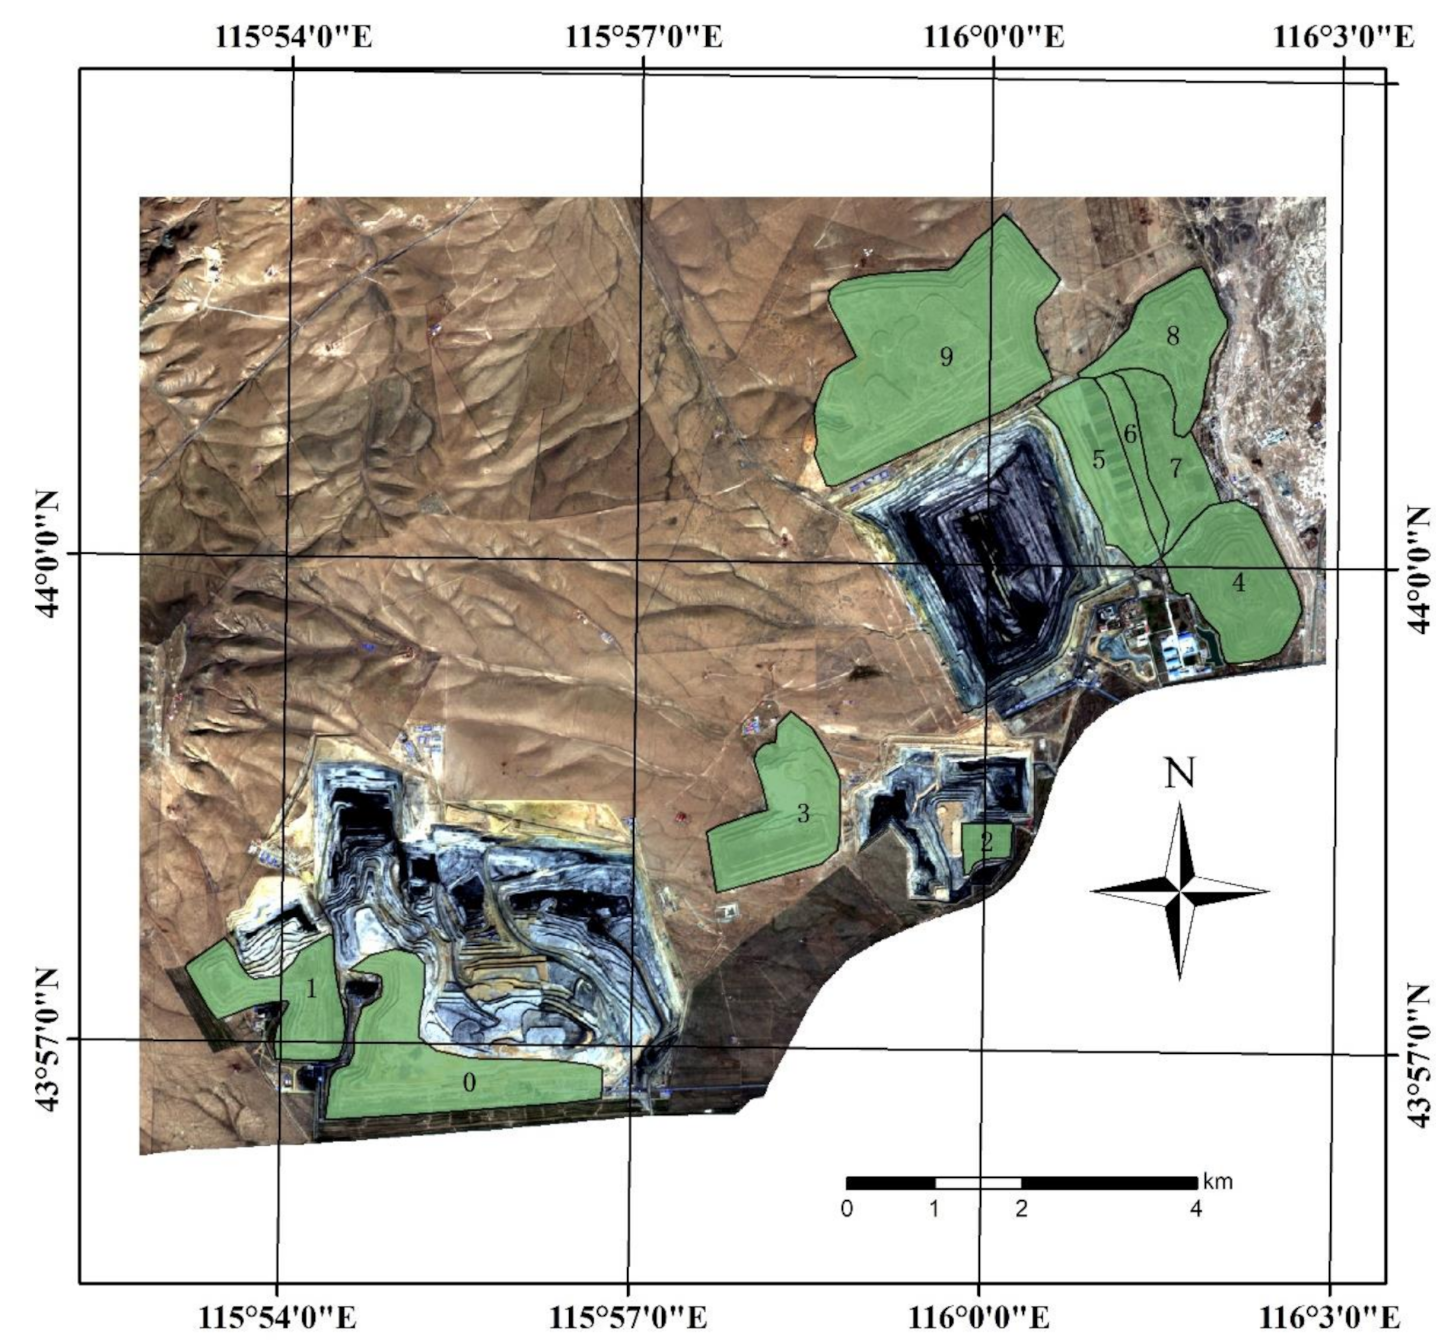
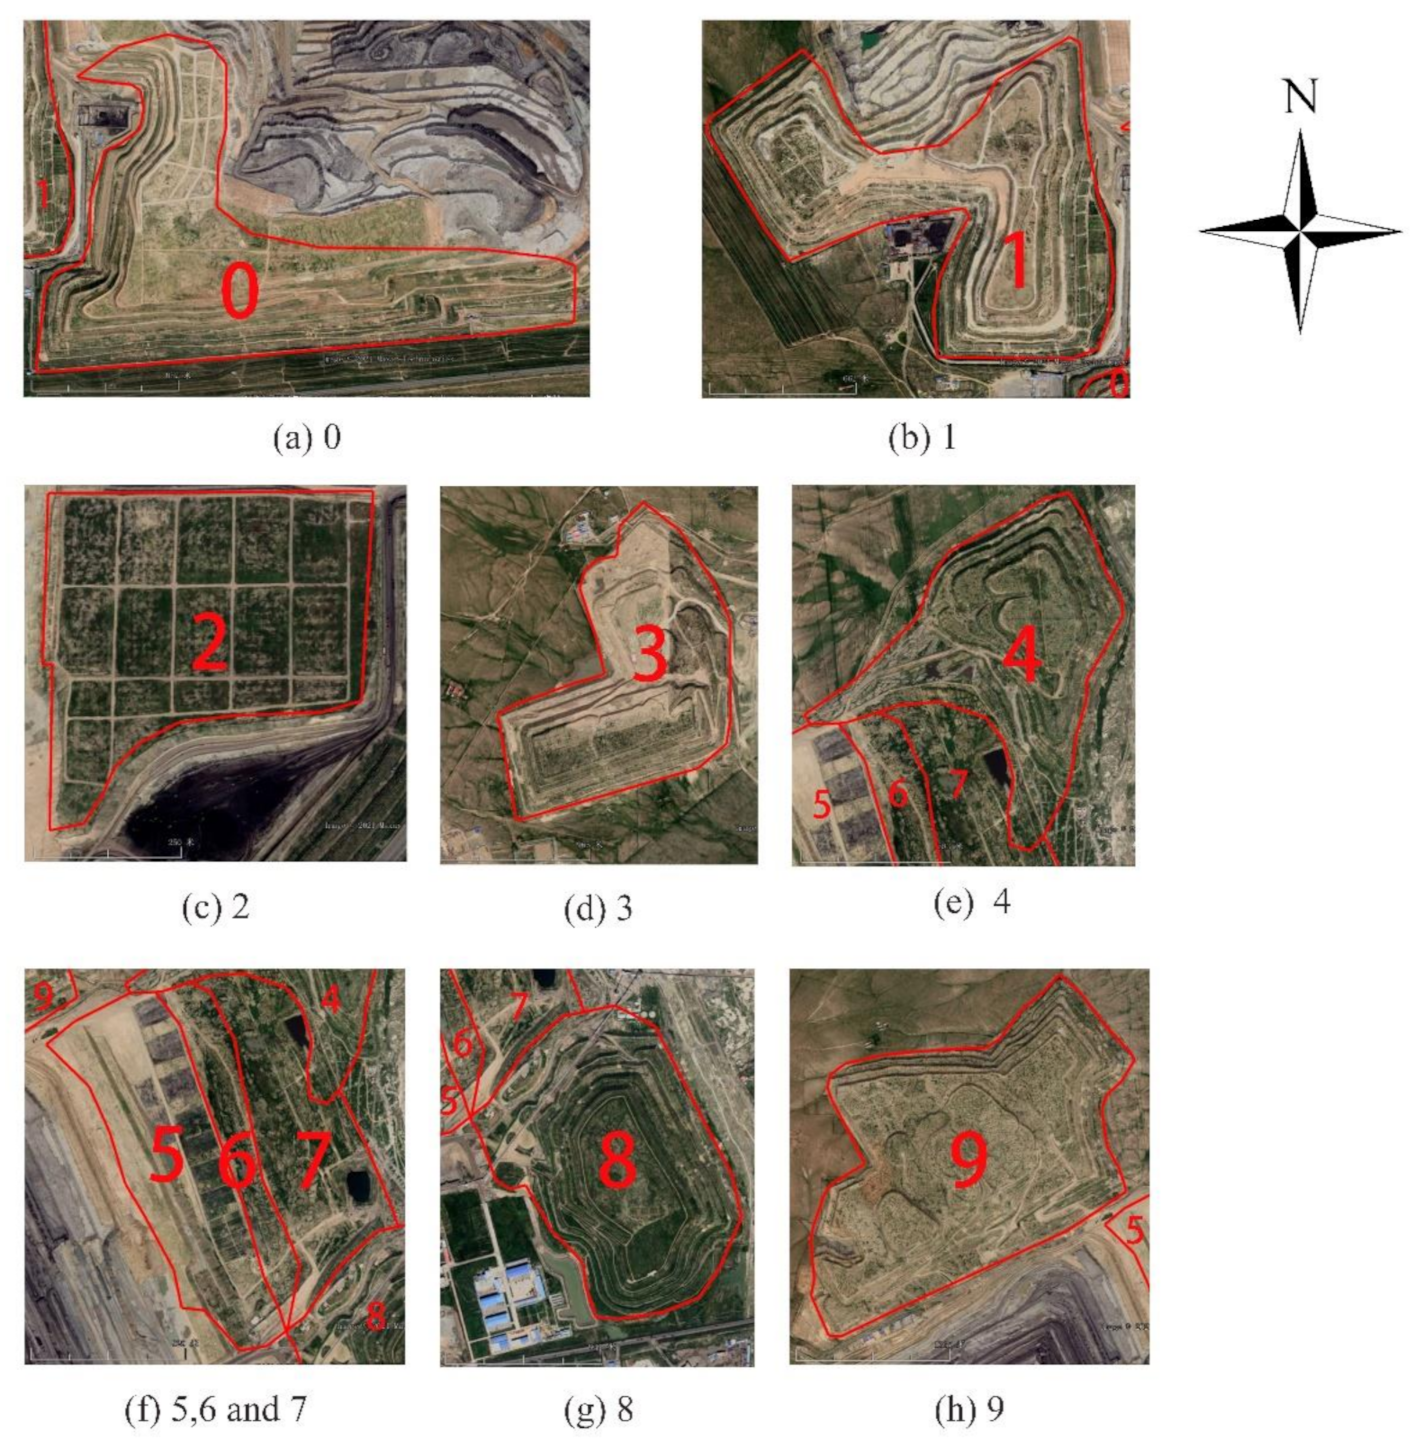
Figure 7 that the vegetation status in the vegetation restoration area in the study area is not stable. For example, in the southern dump of Mine I (area 0 in
Figure 8), the vegetation restoration work began in 2007. The vegetation status has been repeatedly optimized and severely degraded, so the vegetation restoration scale and the completion time are difficult to accurately determine. Therefore, the artificial correction method is used to delineate and number the main vegetation restoration areas in the study area and combine the changes of NEVI to further study the vegetation conditions in different areas. The number and scope of vegetation restoration areas are shown in
Figure 8.
3.3. Changes in Vegetation Cover in the Vegetation Restoration Area (C-V)
When the NEVI value of an area is less than 0.28, we believe that the vegetation in the area has been artificially disturbed. When the NEVI value of the damaged area shows a significant increase in unnatural influence, we believe that the area has begun vegetation restoration. When the NEVI value of a damaged area is close to the natural vegetation at the same time, we believe that the area has completed the vegetation restoration work. According to the above three rules, the vegetation restoration schedule of each area can be obtained as shown in
Table 5. It can be seen from
Table 5 that 2007 is the intensive year for the start of vegetation restoration in the study area. Areas 0, 1, 4, and 8 with earlier vegetation destruction all started vegetation restoration in 2007.
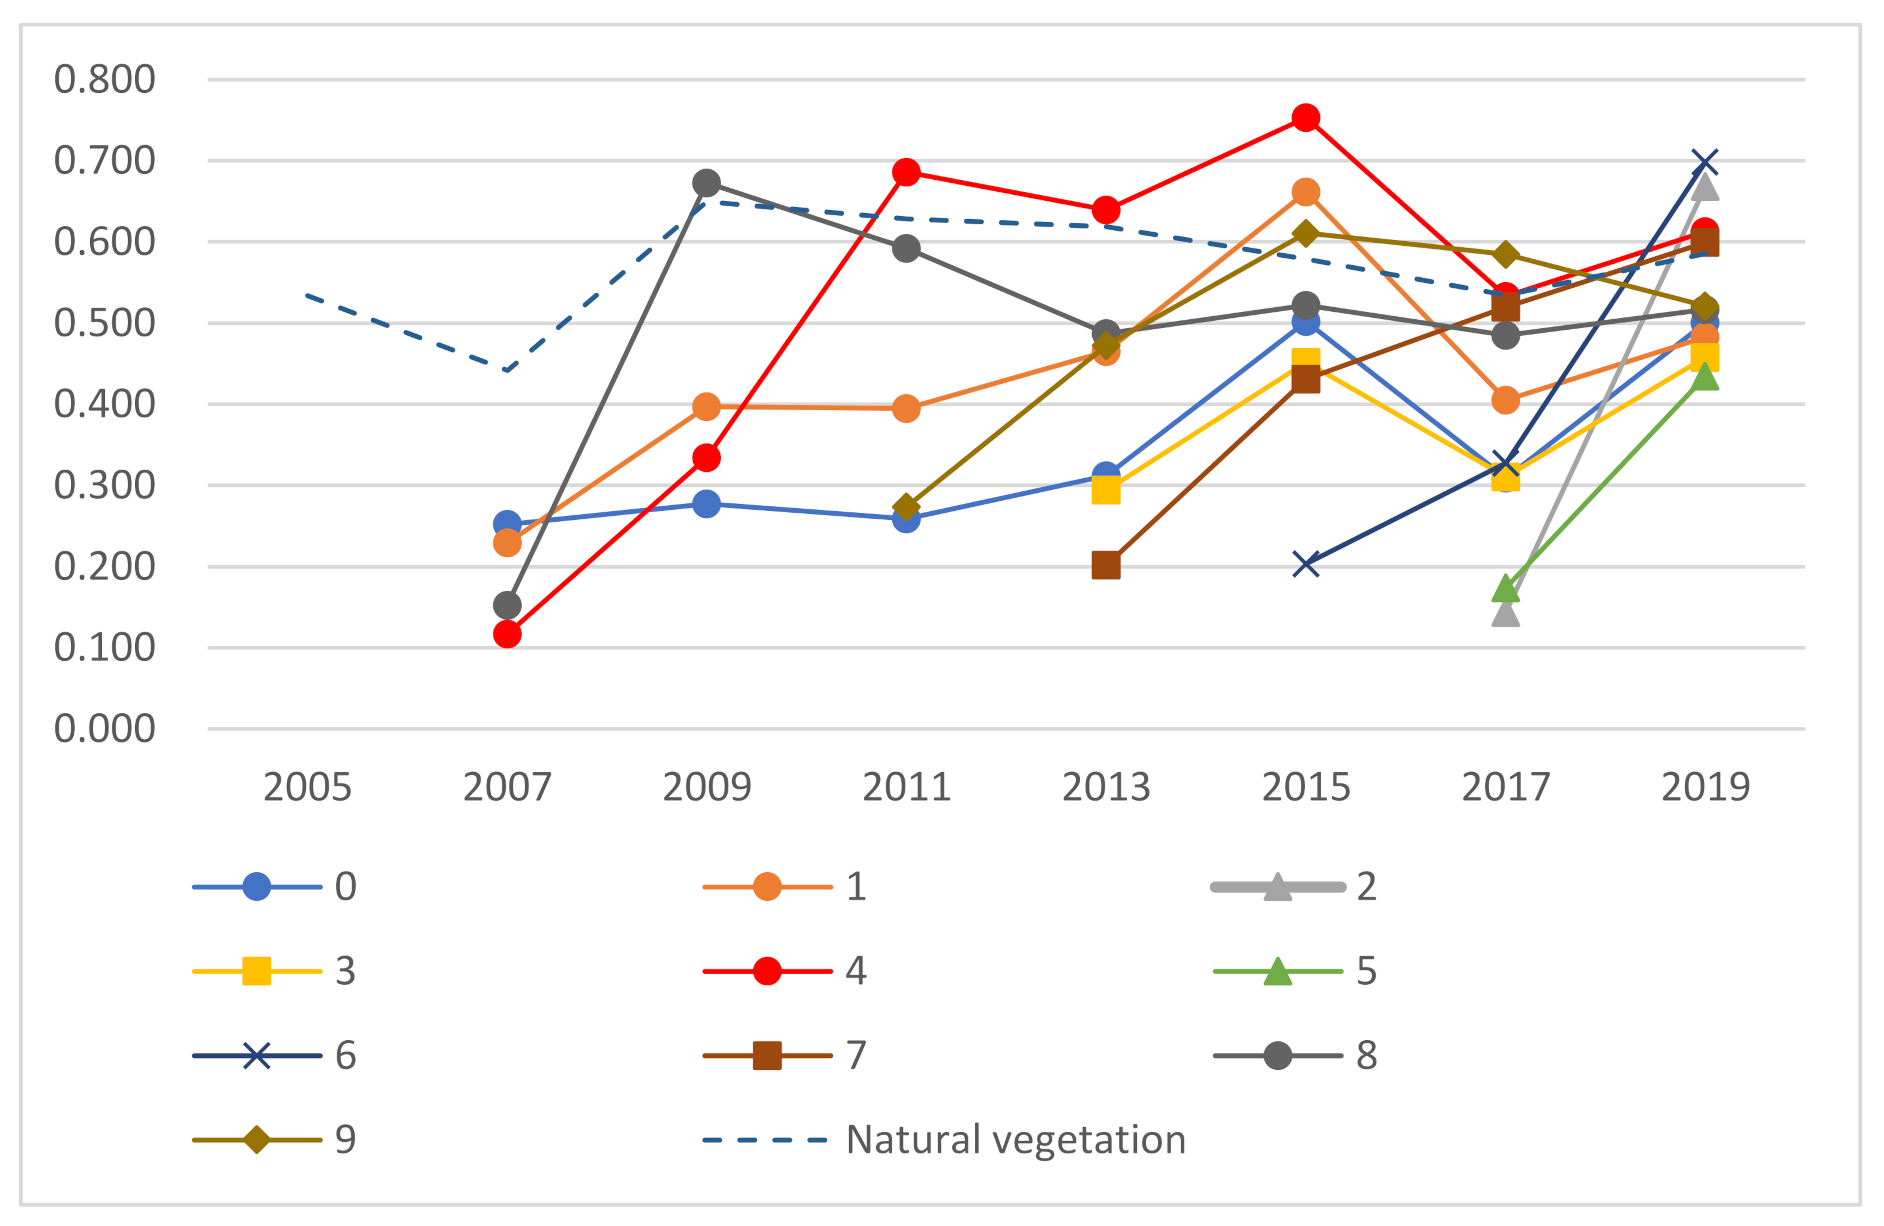
The time required to complete the vegetation restoration in each area is different, and the effect of vegetation restoration is also different, so it is necessary to calculate the average change of their NEVI. The time required to complete vegetation restoration in each area is different, and the effect of vegetation restoration is also different, so it is necessary to calculate their annual NEVI average value. The changes before the destruction of vegetation are not what we are concerned about, so the start year of the measurement is the start year of the vegetation restoration work in each area in
Table 5. The statistical results are shown in
Figure 9.
It can be seen from
Figure 9 that not all areas can achieve good results after the implementation of vegetation restoration work. The NEVI values of areas 0 and 1 have grown very slowly, and they did not increase significantly until 2015. In combination with
Figure 6, the vegetation restoration work in areas 0 and 1 is being carried out gradually, and severe degradation has occurred. Due to the mutual influence of the gradual vegetation restoration work and vegetation degradation, it is very difficult to accurately delineate the vegetation restoration range of areas 0 and 1. We can only determine that these two areas are vegetation starting in 2007. The restoration work was completed in 2015 and 2019. It is worth noting that the judgment of the start time of vegetation restoration in areas 0 and 1 is not accurate. Due to the aforementioned reasons, the start of vegetation restoration work in areas 0 and 1 is not all in 2007. Its internal vegetation change is a complex process of vegetation restoration and restoration of vegetation degradation. The changes in vegetation conditions in areas 0 and 1 began in 2013. From this perspective, the start time of vegetation restoration activities in areas 0 and 1 can also be considered as 2013. The vegetation restoration work in areas 4 and 8 is fruitful. Their NEVI reached a better level than natural vegetation after 4 and 2 years and can maintain the same level of natural vegetation every year thereafter. The vegetation restoration work in the above four areas all started in 2007. The start of vegetation restoration work in areas 9, 7, 6, 2, and 5 are 2011, 2013, 2015, and 2017, respectively. The vegetation in these areas, similar to areas 4 and 8, reached a level similar to that of natural vegetation in a short time.
Comparing the NEVI changes of the natural vegetation in the northwest of the study area (“Natural vegetation” in
Figure 8), we can find that the NEVI value of most vegetation restoration areas in the year when the restoration is completed will be slightly higher than that of the natural vegetation in the same period. But it will show a downward trend, and will eventually be lower than the surrounding natural vegetation. When the NEVI of natural vegetation drops suddenly, the decline of vegetation restoration areas is often greater than that of natural vegetation, indicating that vegetation restoration areas are more sensitive to changes in the natural environment than natural areas.
The study area is located in an arid grassland area, where the main driving factors for changes in natural vegetation are precipitation, temperature, and human activities [
31]. Among them, precipitation and vegetation coverage show a very high positive correlation [
32], so water is the most important factor influencing the growth of local vegetation [
31]. According to our on-site investigation and related records, after the completion of dumping site shaping and vegetation planting, companies generally use manual irrigation to manage and maintain the reclaimed area for a period of time, but the maintenance time has not been determined. The Huolin River in the western part of the study area is one of the most important sources of water supply for irrigation. However, artificial irrigation in arid areas cannot achieve the effect of stabilizing vegetation coverage. Once the amount of irrigation water is insufficient or in a dry year, the vegetation will be severely degraded [
33]. Compared with natural vegetation, the elevation of the vegetation restoration area is higher and the slope is greater. Some studies have pointed out that the current elevation and slope of the local vegetation restoration area will aggravate the loss of water resources, resulting in a decrease in vegetation coverage [
33]. This is consistent with our on-site investigation found that the dumping site generally has the problem of excessively large slopes. The above reasons are reflected in the vegetation coverage, that is, the decline in vegetation coverage is higher than that of natural land, and it is more sensitive than natural vegetation changes.
3.4. Evaluation of the Effect of Vegetation Restoration in Different Areas
The vegetation restoration situation and characteristics of each area are analyzed in order to compare the effects of their vegetation restoration projects. The situation in areas 0 and 1 is similar. Their natural vegetation was disturbed between 2005 and 2007. Since 2007, vegetation restoration projects have been implemented in these two areas. Although their NEVI is increasing year by year and the vegetation is gradually recovering, except for area 1 in 2015, the NEVI of areas 0 and 1 are both lower than the natural vegetation, and the effect of vegetation restoration is very poor. The vegetation in area 2 has been continuously destroyed from 2005 to 2009, and it was not until 2017 that vegetation restoration work began. The vegetation restoration project there has excellent results, and it has already surpassed the natural vegetation in 2019. The situation in area 3 is as bad as areas 0 and 1, except that its destruction and vegetation restoration are relatively late. The artificial disturbance time and the start of vegetation restoration projects in areas 4 and 8 are both early, and their vegetation restoration effects are excellent. The NEVI of area 4 has been higher than that of natural vegetation since 2009, and the NEVI of area 8 has been very close to that of natural vegetation since 2011. Areas 7, 6, and 5 are located close to each other, and their vegetation restoration projects have obvious characteristics of being carried out in sequence. They were artificially disturbed earlier, and the vegetation restoration work started in 2013, 2015, and 2017, respectively. In terms of the effect of vegetation restoration, it is clear that the closer it is to the mining area, the worse the effect will be. The main reasons for this phenomenon are as follows: 1. The sequence of vegetation restoration work in the study area is 7, 6, 5 in the order of distance from the pit to the nearest. The earlier the vegetation restoration work starts, the more time the vegetation has to grow and develop, and the better the state of the vegetation. 2. After the vegetation restoration work is completed, the closer the area to the mine is affected by human activities, the greater the probability of degradation. Area 9 has the characteristics of large area and separation, and the time points of artificial disturbance and vegetation restoration are distinct. Its vegetation restoration effect is very good, and NEVI is very close to surrounding vegetation since 2015.
Based on the above situation, the vegetation restoration effect of each vegetation restoration area in the study area can be classified. (1) Areas 4, 6, 7, 8, and 9, which are characterized by excellent vegetation restoration effects, basically reaching the natural state before vegetation destruction, and are all located on the easternmost side of the study area, and the start time of destruction and restoration is relatively early. (2) In areas 0, 1, 3, and 5, their vegetation restoration work started earlier, but the effect of vegetation restoration is generally poor. (3) Area 2 is a special vegetation restoration area, its area is small, the shape is regular, and the texture is clear. Although the vegetation restoration work started late, the effect of vegetation restoration is excellent. Area 2 reflects the trend of gradual high standardization and refinement of vegetation restoration work in recent years.
4. Discussion
The study puts forward the NEVI vegetation index for the first time, so it is necessary to verify our research results. The usual verification method is an on-site survey or high-resolution remote sensing image comparison. Our on-site survey of the study area was in April. At that time, the vegetation coverage of the study area was generally poor, so our survey results were not representative. Therefore, Google Earth historical images are used for research results verification (Google, Mountain View, CA, USA). The high-resolution remote sensing images of each area were obtained on Google Earth, and the imaging was on 22 August 2020, as shown in
Figure 10. In order to clearly show the complete appearance of each area, we did not use the same scale but intercepted each area separately. The scale provided by Google Earth is shown in the lower-left corner of each picture. The red border in
Figure 10 is the border of each vegetation restoration area obtained from the study. We can see that the boundary of the vegetation restoration area that we delineated based on the changes in NEVI is roughly similar to the on-site ground texture, which shows that our judgment on the preparation and restoration sequence is credible.
By visually observing the high-resolution remote sensing images of each area, we find that the vegetation condition of area 8 is the best, and its vegetation condition is much better than that of the nearby natural vegetation. The second level is areas 4, 6, and 7. The vegetation conditions of these three are similar, slightly inferior to area 8 but better than area 9. The vegetation density of area 9 is relatively poor compared to the vegetation status of the above four areas. However, the vegetation coverage in the whole area of area 9 is very uniform, so the effect of vegetation restoration can be considered as good. Part of the vegetation density in areas 0, 1, and 3 is similar to that in area 9. However, the distribution of vegetation in these areas is not uniform, and there are obvious manifestations of vegetation degradation or insufficient vegetation restoration measures in these areas. Although there are traces of vegetation restoration in the whole area of area 5, the vegetation density is very low. The vegetation texture of area 2 is very clear, the vegetation density is high, but the area is small. According to the verification of high-scoring remote sensing images, our judgment on the characteristics of vegetation rehabilitation in each area in 3.4 is correct.
According to the experimental results and our investigation, the main reasons for the different restoration effects of vegetation in different regions are as follows: 1. The vegetation restoration time is different, and the vegetation in the region that starts the vegetation restoration earlier has more growth time. 2. Natural resource factors. Water is the most important factor influencing the growth of vegetation in the study area. Both natural precipitation and artificial irrigation can greatly affect the effect of vegetation restoration. 3. Human factors. For areas with different management and protection measures, their vegetation restoration effects are completely different. The more obvious examples are areas 2 and 3. The vegetation restoration and management and protection measures in area 2 are relatively sophisticated, while the management and protection measures in area 3 give priority to ensuring the eastern part, which leads to uneven vegetation status in area 3 and poor overall quality. In summary, we believe that the vegetation conditions in areas 0, 1, and 3 are not good, and it is necessary to strengthen management and protection.
5. Conclusions
As commonly used vegetation indices such as NDVI have obvious errors in identifying the vegetation conditions inside the mining area, we propose a new, normalized environmental vegetation index (NEVI) based on the environmental vegetation index (EVI). We obtained remote sensing images of Landsat and Sentinel-2 of Xilinhot City every two years from 2005 to 2019. The NEVI of each period is calculated to determine the vegetation changes in the Shengli mining area, to obtain the scope of the vegetation restoration area of the mining area and the vegetation restoration time of each area. The results obtained are as follows: (1) Vegetation destruction in this mining area had already begun before 2005, and the vegetation restoration work started in 2007. There were no obvious signs of vegetation restoration in the study area during 2005–2007. (2) In most vegetation restoration areas, the vegetation coverage in the year when the vegetation restoration project is completed will be close to or better than the nearby natural vegetation, but then there will be a significant decline. This decline is obvious in area 9. (3) The effect of vegetation restoration in the study area presents characteristics of high in the east and low in the west. The vegetation in the eastern dumping site is significantly better than in other locations. This may be due to the earlier implementation of the vegetation restoration projects in these areas, and the area is relatively close to the Xilin River in the west of the study area, with relatively sufficient water sources.
Experiments have shown that NDVI is not an ideal vegetation index for the inside of mining areas with very low reflectivity in the visible and near-infrared bands. Our improved Normalized Environmental Vegetation Index (NEVI) has a better recognition effect for areas with low vegetation coverage, such as grasslands, and can accurately reflect the vegetation coverage inside the mining area, which is suitable for use in grassland mining areas. However, the normalization process needs to be manually determined upper and lower limits when calculated in NEVI. Compared with other vegetation indices, the calculation of NDEI is more inconvenient and has a certain error, and there is still much room for improvement.


