Article

Landscape Ecological Risk Assessment under Multiple Indicators

1
School of Geography and Tourism, Shaanxi Normal University, Xi’an 710119, China
2
Centre for Global Food and Resources, The University of Adelaide, Adelaide 5005, Australia
*
Author to whom correspondence should be addressed.
Land 2021, 10(7), 739; https://doi.org/10.3390/land10070739
Submission received: 18 May 2021 / Revised: 2 July 2021 / Accepted: 11 July 2021 / Published: 14 July 2021
(This article belongs to the Section Landscape Ecology)

Abstract

:
Rapid urbanization and intensification of human activities increases the risk of disturbance of ecological systems via multiple sources, with consequences for regional ecological security and health. Landscape ecological risk assessment (LERA) is an effective way to identify and allocate risk to resources. We used the north and south Qinling Mountain area as a case study to analyze the spatial heterogeneity of landscape ecological risk using a potential- connectedness-resilience three-dimensional (PCR 3D) framework based on an integrated and dynamic risk assessment concept from adaptive cycle theory. We explored factors driving the risks with a spatial model GeoDetector. The results show that the comprehensive landscape ecological risk was north–south polarized and dominated by low and moderate risk levels (90.13% of total risk) across the whole study area. The high-risk area was centered on the Weihe plain north of the Qinling Mountains (NQL), while low-risk areas accounted for 86.87% of the total area and were prevalent across the south of the study area. The areas with high potential and connectedness risks were centered in the Xi’an–Xianyang urban agglomeration and those with high-resilience risk were in the upper reaches of the Hanjiang River. The vast majority of the area to the south of the Qinling Mountains (SQL) is at low risk. In terms of driving forces, population density and vegetation coverage (NDVI) are the primary factors affecting landscape ecological risk. Our findings suggest that anthropogenic activity is the primary cause of landscape ecological risks in the study area and regional socioeconomic exploitation and environmental conservation need to be rebalanced to achieve sustainability for the social ecosystem. The PCR 3D LERA framework employed in this study can be used to inform landscape ecological health and security and to optimize socioeconomic progress at regional scales.

1. Introduction

Landscape ecological risk is a negative consequence of the interaction between landscape characteristics and external threats when a landscape is exposed to one or more risk sources [1,2]. With rapid urbanization, the expansion of artificial (developed) land comes at the expense of ecological land and can intensify landscape fragmentation and vulnerability [3,4]. Extreme weather events such as heat waves, droughts and floods have altered hydrological cycles and the carbon sequestration of ecosystems in modified landscapes [5,6,7]. Landscape ecological risk can increase in complexity and risk receptors can diversify from the ecosystem to the coupling of human and natural systems. Consequently, increasing effort has been recently devoted to improving landscape ecological risk assessment [8,9]
Landscape ecological risk assessment (LERA) has been employed to capture risk effects and inform decision-making for environmental maintenance [10,11]. LERA emphasizes the coupled landscape spatial pattern and landscape ecological processes [12,13] with the intrinsic attributes of the landscape and external disturbances from multiple risk sources [8]. Recently, a landscape ecological pattern index algorithm based on landscape disturbance and vulnerability [14,15], a source-sink theory created from landscape impacts on ecological processes [16,17,18], and an ecosystem service value-based method [4,19] have allowed the spatial characteristics of landscape ecological risk to be examined in a static view. However, this ignores the impact-response dynamics and changes in landscapes, and the risk adaptation under external drivers which can follow highly complex evolutionary processes depending on the social-ecological system examined [12,20].
In this setting, adaptive dynamic cycle theory was introduced to meet the needs of research to parse the spatiotemporal dynamic relationship between landscapes and the risks that may arise in them [21,22]. The adaptive cycle has been developed within a four stage framework of social-ecological system development: (1) exploitation, (2) release, (3) conservation, and (4) reorganization, with three dimensions of potential, connectedness, and resilience (PCR 3D) [22,23]. Potential and connectedness demonstrate the overlay properties of the landscape and the interaction between the adjacent components of the ecosystem; representing the landscape’s pattern of static attributes and the degree of connectivity, respectively. Resilience refers to the adaptive and recovery abilities of the ecosystem under risk uncertainty, reflecting the dynamic trends in the landscape and the external risks from multiple sources [21,24]. Resilience describes the complex development process of ecosystems to resist and absorb disturbances and their dynamic rebounding to a stable state; which is a crucial element of LERA research [25,26]. Given this, the PCR 3D LERA framework is an effective way of assessing comprehensive landscape ecological risk and revealing the complex and dynamic evolution of the socio-ecosystem [8].
As the north–south geographical demarcation line for China’s subtropical and warm temperate climatic regimes, the Qinling Mountains are an ecologically and climatically [27] sensitive zone [28]. This area is critical for maintenance of ecological security and function in China [29]. Climatic drivers have changed greatly and climate warming has altered the phenological cycle of the vegetation in this region [27]. Local anthropogenic interference has generated large changes in landscape patterns and ecological structure, aggravating the contradiction between economic and ecological development. This has led to a diversification and increase in uncertainty from landscape ecological risks [30]. We have therefore chosen the area north and south of the Qinling Mountains as a study area to apply the PCR 3D framework based on adaptive cycle theory to: (1) assess the landscape ecological risk in an integrated and dynamic approach based on adaptive cycle theory, (2) explore the spatio-temporal heterogeneity of the landscape ecological risk and identify the high-risk units; and (3) investigate the dominant factors driving landscape ecological risk. This study aims to demonstrate the use of LERA in a situation where landscape pattern and process are coupled to examine dynamic responses and to inform the regulation and mitigation of risks.

2. Materials and Methods

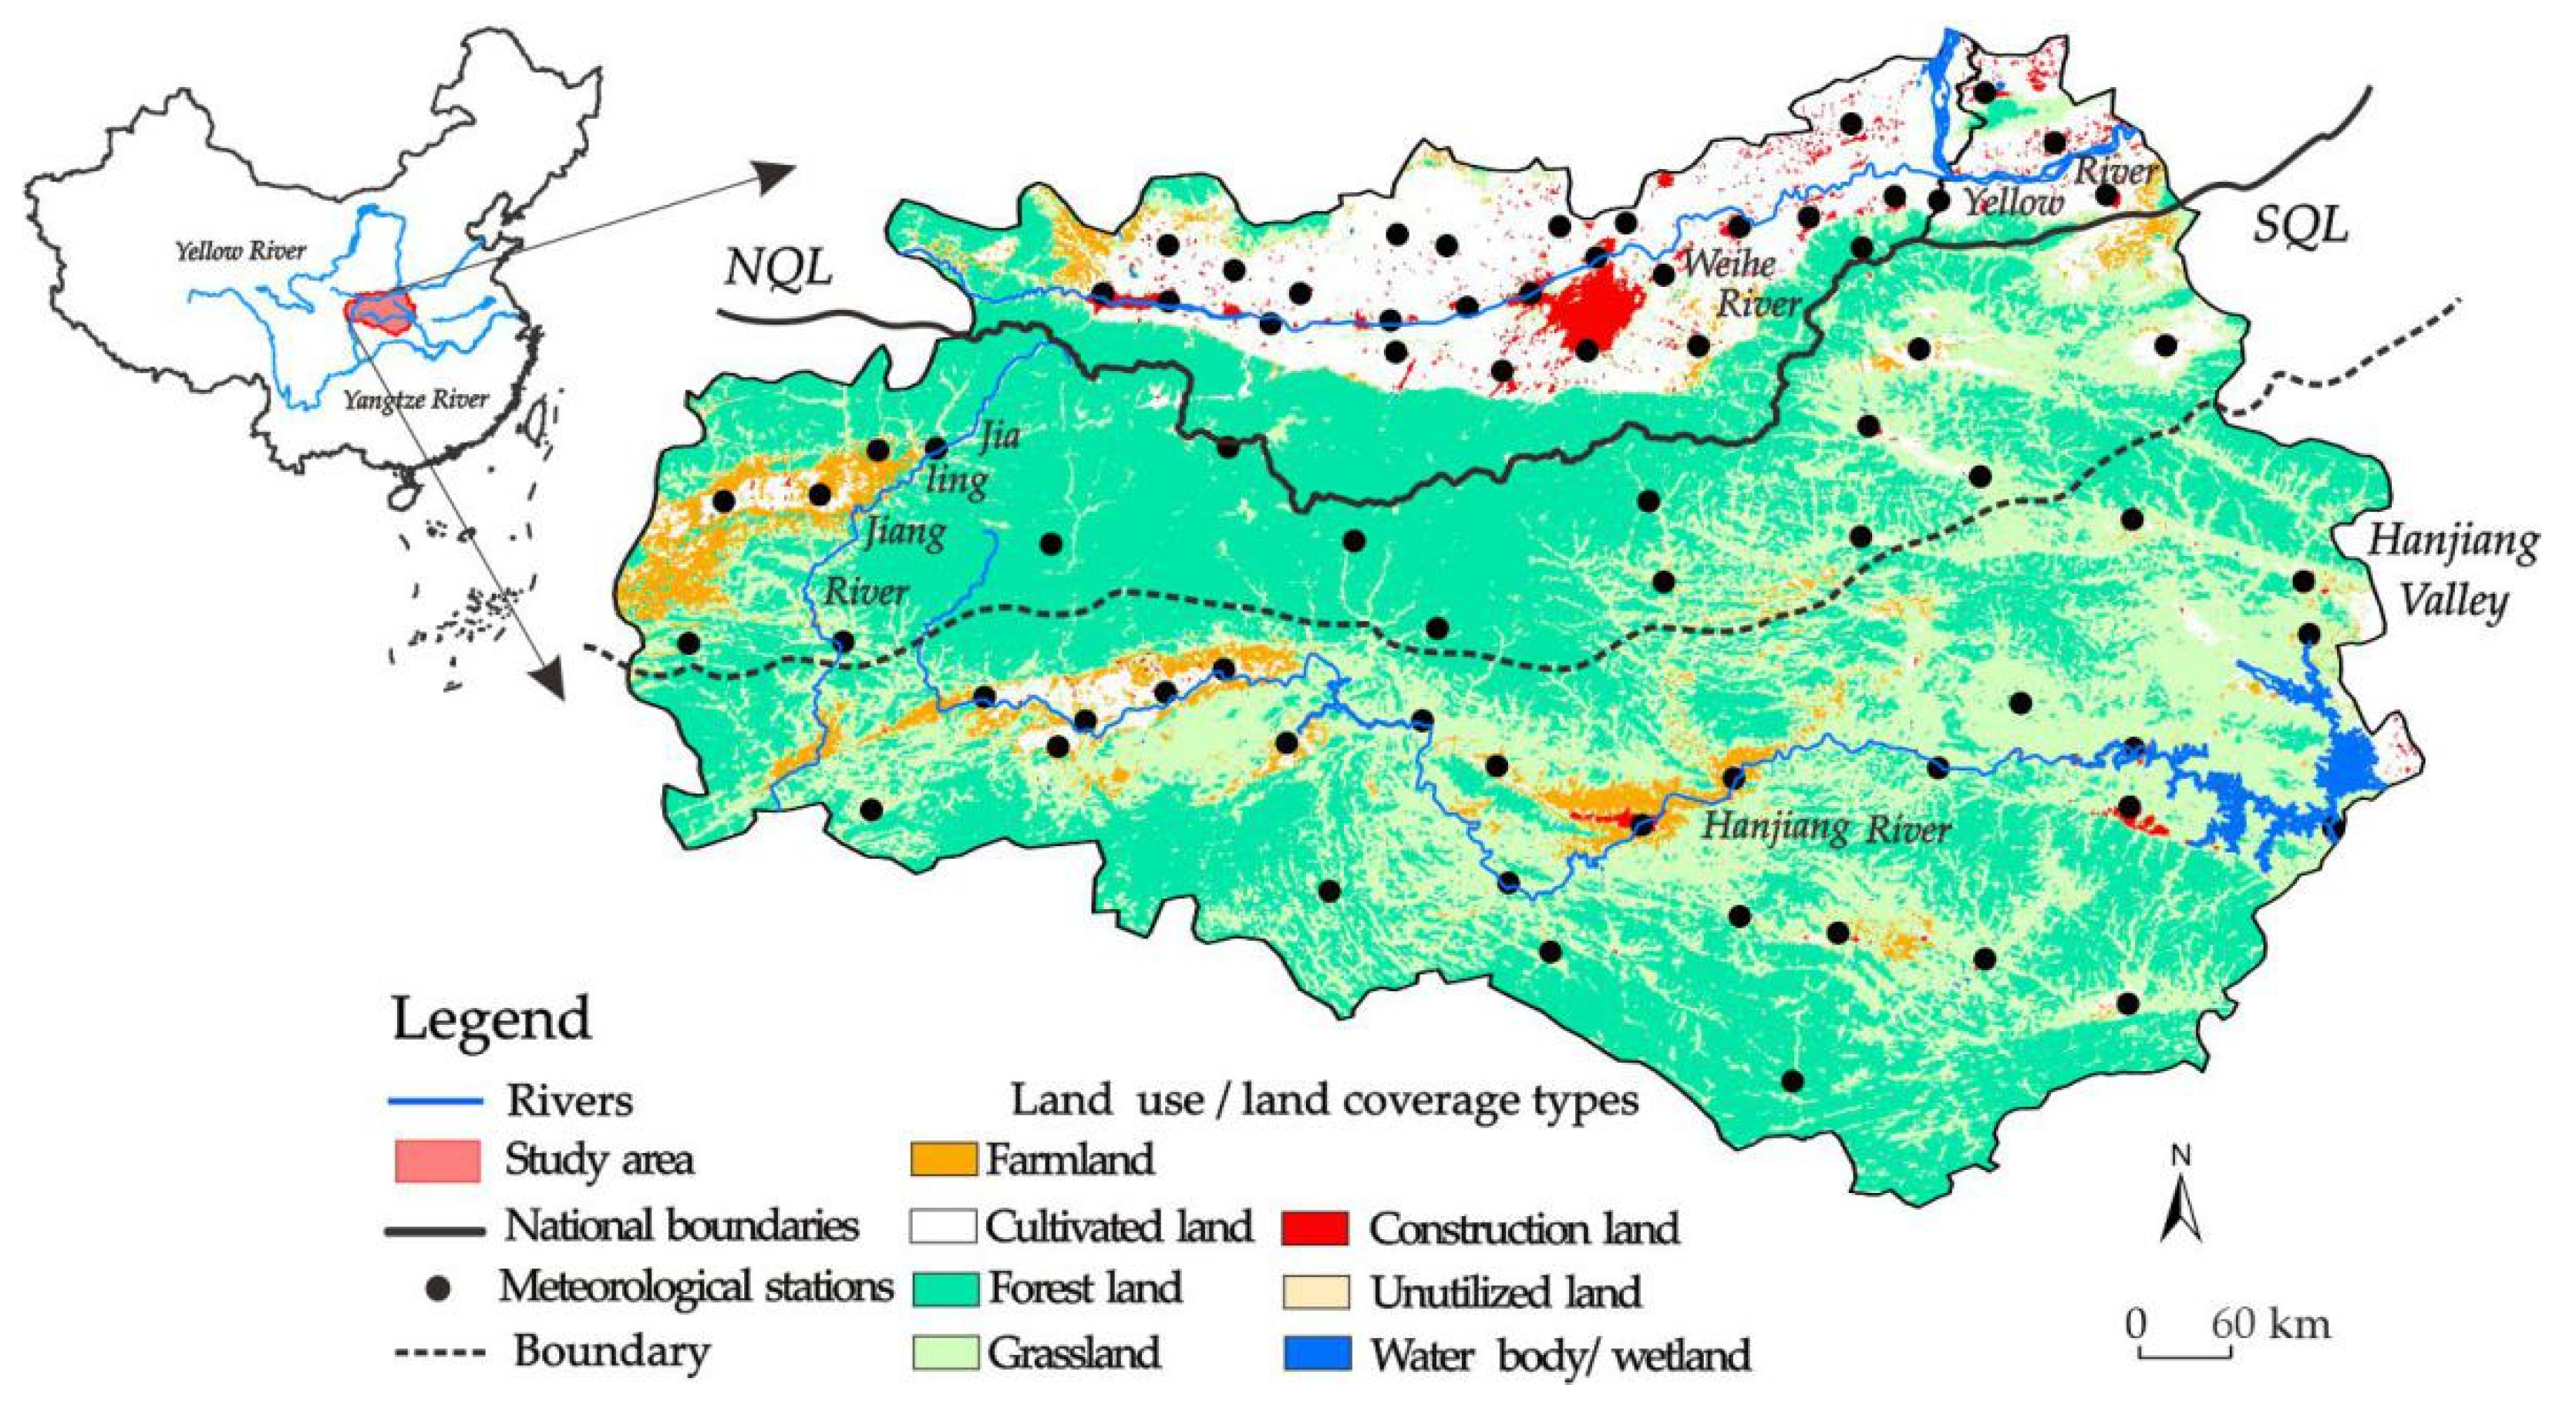
2.1. Study Area and Data Sources

The areas north and south of the Qinling Mountains are located in north-central China (31° N–36° N, 105° E–112° E) (Figure 1), and are divided into the three physical geographical units of the Guanzhong Plain, the Qinling Mountains and the Hanjiang Valley. The Qinling Mountains form the boundary between the subtropical humid and warm temperate humid climate zones in China, being crossed by the 0-degree isotherm and the 800-mm-year isohyet [28].
The Qinling Mountains feature hills and mountains [31] and are predominantly covered by woodland and grassland landscape types [32]. The altitude difference between the north and south is about 195–3771.2 m a.s.l. and the hydro-geomorphological features present a significant north–south gradient due to the orographic variation [33]. The average annual temperature is about 10 °C and 14 °C, while the annual precipitation is 570 mm and 850 mm in the north and south, respectively. The study area is a climate-sensitive and biologically diverse region [29,34] and has been disturbed by various extreme climate events and geological hazards such as drought, floods and landslides [35]. Urban expansion and the influx of people from talent-acquisition programs have further altered the pattern and the function of the ecological landscape, curbing the benign maintenance of the ecological environment and increasing the diversity and uncertainty of landscape ecological risks [8].
The data used to assess landscape ecological risk in this study includes slope-terrain, land use/land coverage, vegetation coverage, precipitation, temperature, surface temperature and nighttime light data. The data sources are listed in Table 1. All the grid data were interpolated into 1 km × 1 km cells by spatial resampling.

2.2. PCR 3D LERA Framework

2.2.1. PCR 3D Model

The two stages of exploitation and conservation comprise traditional ecosystem succession and have evolved into a three-dimensional dynamic cycle with the addition of temporal processes of reorganization and release [23]. The dynamic development concept forms an adaptive cycle for the socio-ecosystem [8,21]. The adaptive dynamic cycle is driven by the interaction of the three attributes of potential, connectedness and resilience (PCR 3D) (Figure 2).
Specifically, potential criteria represent the multiple static attributes of the landscape, reflecting the inherent characteristics of landscape units. Connectedness criteria refers to the interaction between the adjacent patches within the landscape structure. As a crucial part of the adaptive cycle, resilience indicates the resistance and maintenance ability of the socio-ecological system’s functions when disturbed [8], and the capacity to tolerate and mitigate the disturbance and recover stability. These can be used to predict the possible landscape risk in the future [25]. Landscape ecological risk in potential and connectedness criteria characterize the risk effects of the landscape in a spatial dimension related to landscape structure and pattern, while resilience risk acts in a temporal dimension, trending with the dynamic response of the landscape [26].
Human environment development promotes the evolution of social ecological systems in four different stages, in which risk exists at all stages due to the system complexity and diversity of risk sources [8]. The 3D model framework depicts the interaction of the integrated human and natural ecosystems’ landscape pattern, ecological processes and external disturbance, focusing on the reciprocal feedbacks inside this comprehensive system [12]. Integrating adaptive cycle theory into LERA captures the dynamic process of the socio-ecosystem adaptation to deal with the risk within an integrated view [26].
The PCR 3D model was applied via a LERA index system, building in terms for the exposure and disturbance risk (Figure 2). Exposure risk means the possible risk the landscape may face when exposed to external interference, while disturbance risk refers to the risk the landscape faces when affected by interference.

2.2.2. LERA Index System

The index system of the PCR 3D model in this study consists of 14 factors, which are divided into 3 categories covering the two aspects of exposure and disturbance (Table 2). In detail, three indices of drought, drought trend, and a landscape contagion index (CONTAG) are introduced to characterize the special geographical features of the study area in the assessment index system.
Drought and drought trend are increasing in the north and SQL in a time of climate warming [36]. The Standardized Precipitation Evapotranspiration Index (SPEI) is an international meteorological statistical method to investigate drought conditions [37,38], with the ANUSPLIN (the Australian National University, Canberra, Australia) [39,40] algorithm employed on specialized meteorological factors from 2008 to 2017. Drought trend, depicted by the MK test, represents the degree of disturbance of extreme climate events in the landscape ecosystems. The lower the MK value, the stronger the drought trend, and in turn the greater the increase in landscape ecological risk, and vice versa.
Index CONTAG refers to the agglomeration and contagion of different landscape types. The lower the degree of contagion, the more dispersed the landscape mosaic. The greater the spatial heterogeneity of the landscape ecosystems, the higher the likelihood that the central landscape risk is disturbed by the surrounding landscape types [12,41,42]. In the calculation, the CONTAG simulation was performed using the moving window technique in Fragstats 4.2 software (the University of Massachusetts, Amherst, MA, USA) [41] with a 500 m window radius, the value of which is normalized before spatialization. The details of other indicators can be found in [8].
The weight of the indicators in the assessment index system of this research were scored by expert grading methods and an analytic hierarchy process (AHP) based on mathematical weights, which enhances humans’ perception of ecological function in an empirical way [42]. The AHP reflects the importance level difference in indices in the assessment indicator system in terms of preference effect, with the reliability established through use [43,44,45].

2.3. GeoDetector

The risk sources that trigger the landscape ecological risk have diversified due to drastic anthropogenic exploitation and worldwide environment change [46]. In order to reveal the driving factors of landscape ecological risk, the spatial model GeoDetector was employed to determine the degree of effect of influencing factors on the risk. The GeoDetector model is a group of spatial statistical methods proposed to detect spatial variability and interrelations between variables [47], and is comprised of a factor detector, a risk detector, an interaction detector, and an ecological detector [47,48].
We use the factor detector and interaction detector of this model in this study to reveal the spatial consistency of landscape ecological risk and the dominant factors driving the spatial heterogeneity of the risk. In the evaluation, landscape ecological risk is taken as a dependent variable, and a total of 15 normalized indices are taken as independent variables.
In the factor detector, the factors of the assessment index system are independent. The spatial heterogeneity of attribute Y in the hierarchy of factor X was explored, and the q -statistic value, reflecting the explanatory degree of factor X to the spatial heterogeneity of Y, was measured in the detector. The mathematical formulation is as follows:
q = 1 h = 1 l N h σ h 2 N σ 2
where q refers to the explanatory power of each evaluation factor on the landscape ecological risk Y, the value of which suggests the significance level of the contribution of factor X to Y [49]. h is the number of classes of dependent variable Y or factor X; Nh and N are the unit number of stratum h and the total categories, respectively; σh2 and σ2 means the variance of Y in class h and all the categories of the study region, respectively. The q -statistic ranges from 0 to 1, which indicates that the larger the q value is, the stronger the explanatory power of factor X on the dependent variable Y, and vice versa.
The interaction detector is used to detect whether the explanatory power of two factors working together is strengthened, weakened, or still independent compared to a single factor. It aims to reflect the interaction type and effect between two factors, X1 and X2, on the spatial heterogeneity of the landscape ecological risk by comparing the q (X1∩X2) value of the interaction and q (X1) and q (X2) where the interaction q (X1∩X2) is a new layer generated by the tangent of the overlay of two variables, variable X1 and variable X2, the comparison of which with q (X1) and q (X2) indicates the interaction type between two variables. The types of interaction between two variables are shown in Table 3.

2.4. Risk Factors Selection

Landscape ecological risk is affected by a variety of factors due to the diversity of risk sources. Based on existing efforts, population carrying capacity, economic intensity, natural condition, ecological background, and ecological response were selected as the driving factors of landscape ecological risk in the NQL and SQL.
Specifically, population carrying capacity consists of population density, natural population growth rate, and urbanization level. Economic intensity is formed by GDP growth rate, GDP, and proportion of tertiary industry. Natural condition comprises annual mean temperature and altitude. Ecological background is made up of NDVI (Normalized Difference Vegetation Index), aggregation index (AI), splitting index (SPLIT), patch density (PD) and landscape division index (DIVISION) [50]. Ecological response involves the proportion of environmental protection and technological education in fiscal expenditure (PEPE and PTEE), respectively.

3. Results

3.1. Spatial Pattern of Indicators in LERA Index System

Fourteen indicators in the LERA index system were visualized spatially to depict the embodiment of the landscape ecological risk on the landscape pattern and ecological processes (Figure S1).
The high-risk area of the slope index was located in the high-altitude areas and the low-value area was centered on the Weihe River plain in the NQL and the Hanjiang River valley in the SQL, driven by topographic and climatic conditions. The high-risk areas of the indicators including land use, surface temperature, distance to construction land, and landscape affinity and nighttime light intensity were centered in the NQL, especially in the Xi’an–Xianyang urban agglomeration. The low-value areas were widely distributed in the SQL. The vegetation coverage risk in the whole region is at a low level, accounting for 84.28% of the total area.
The spatial pattern of the precipitation erosion indicator showed that the SQL was covered by moderate and high-risk values, especially in the upper reaches of the Hanjiang River, while the risk pattern of the drought indicator was contrary to that of precipitation-erosion. For the Shannon diversity index (SHDI) and CONTAG indicator, high-risk regions were centered on the Weihe plain in the NQL and a small fraction distributed in the east of the study area, where there was a mosaic of a single type of impervious land, cultivated land, and forest land. The low and moderate-risk areas for vegetation coverage change occupied almost the whole study area. The risk of drought index pattern had high spatial heterogeneity with high risk in the west and low risk in the southeast of the study area.

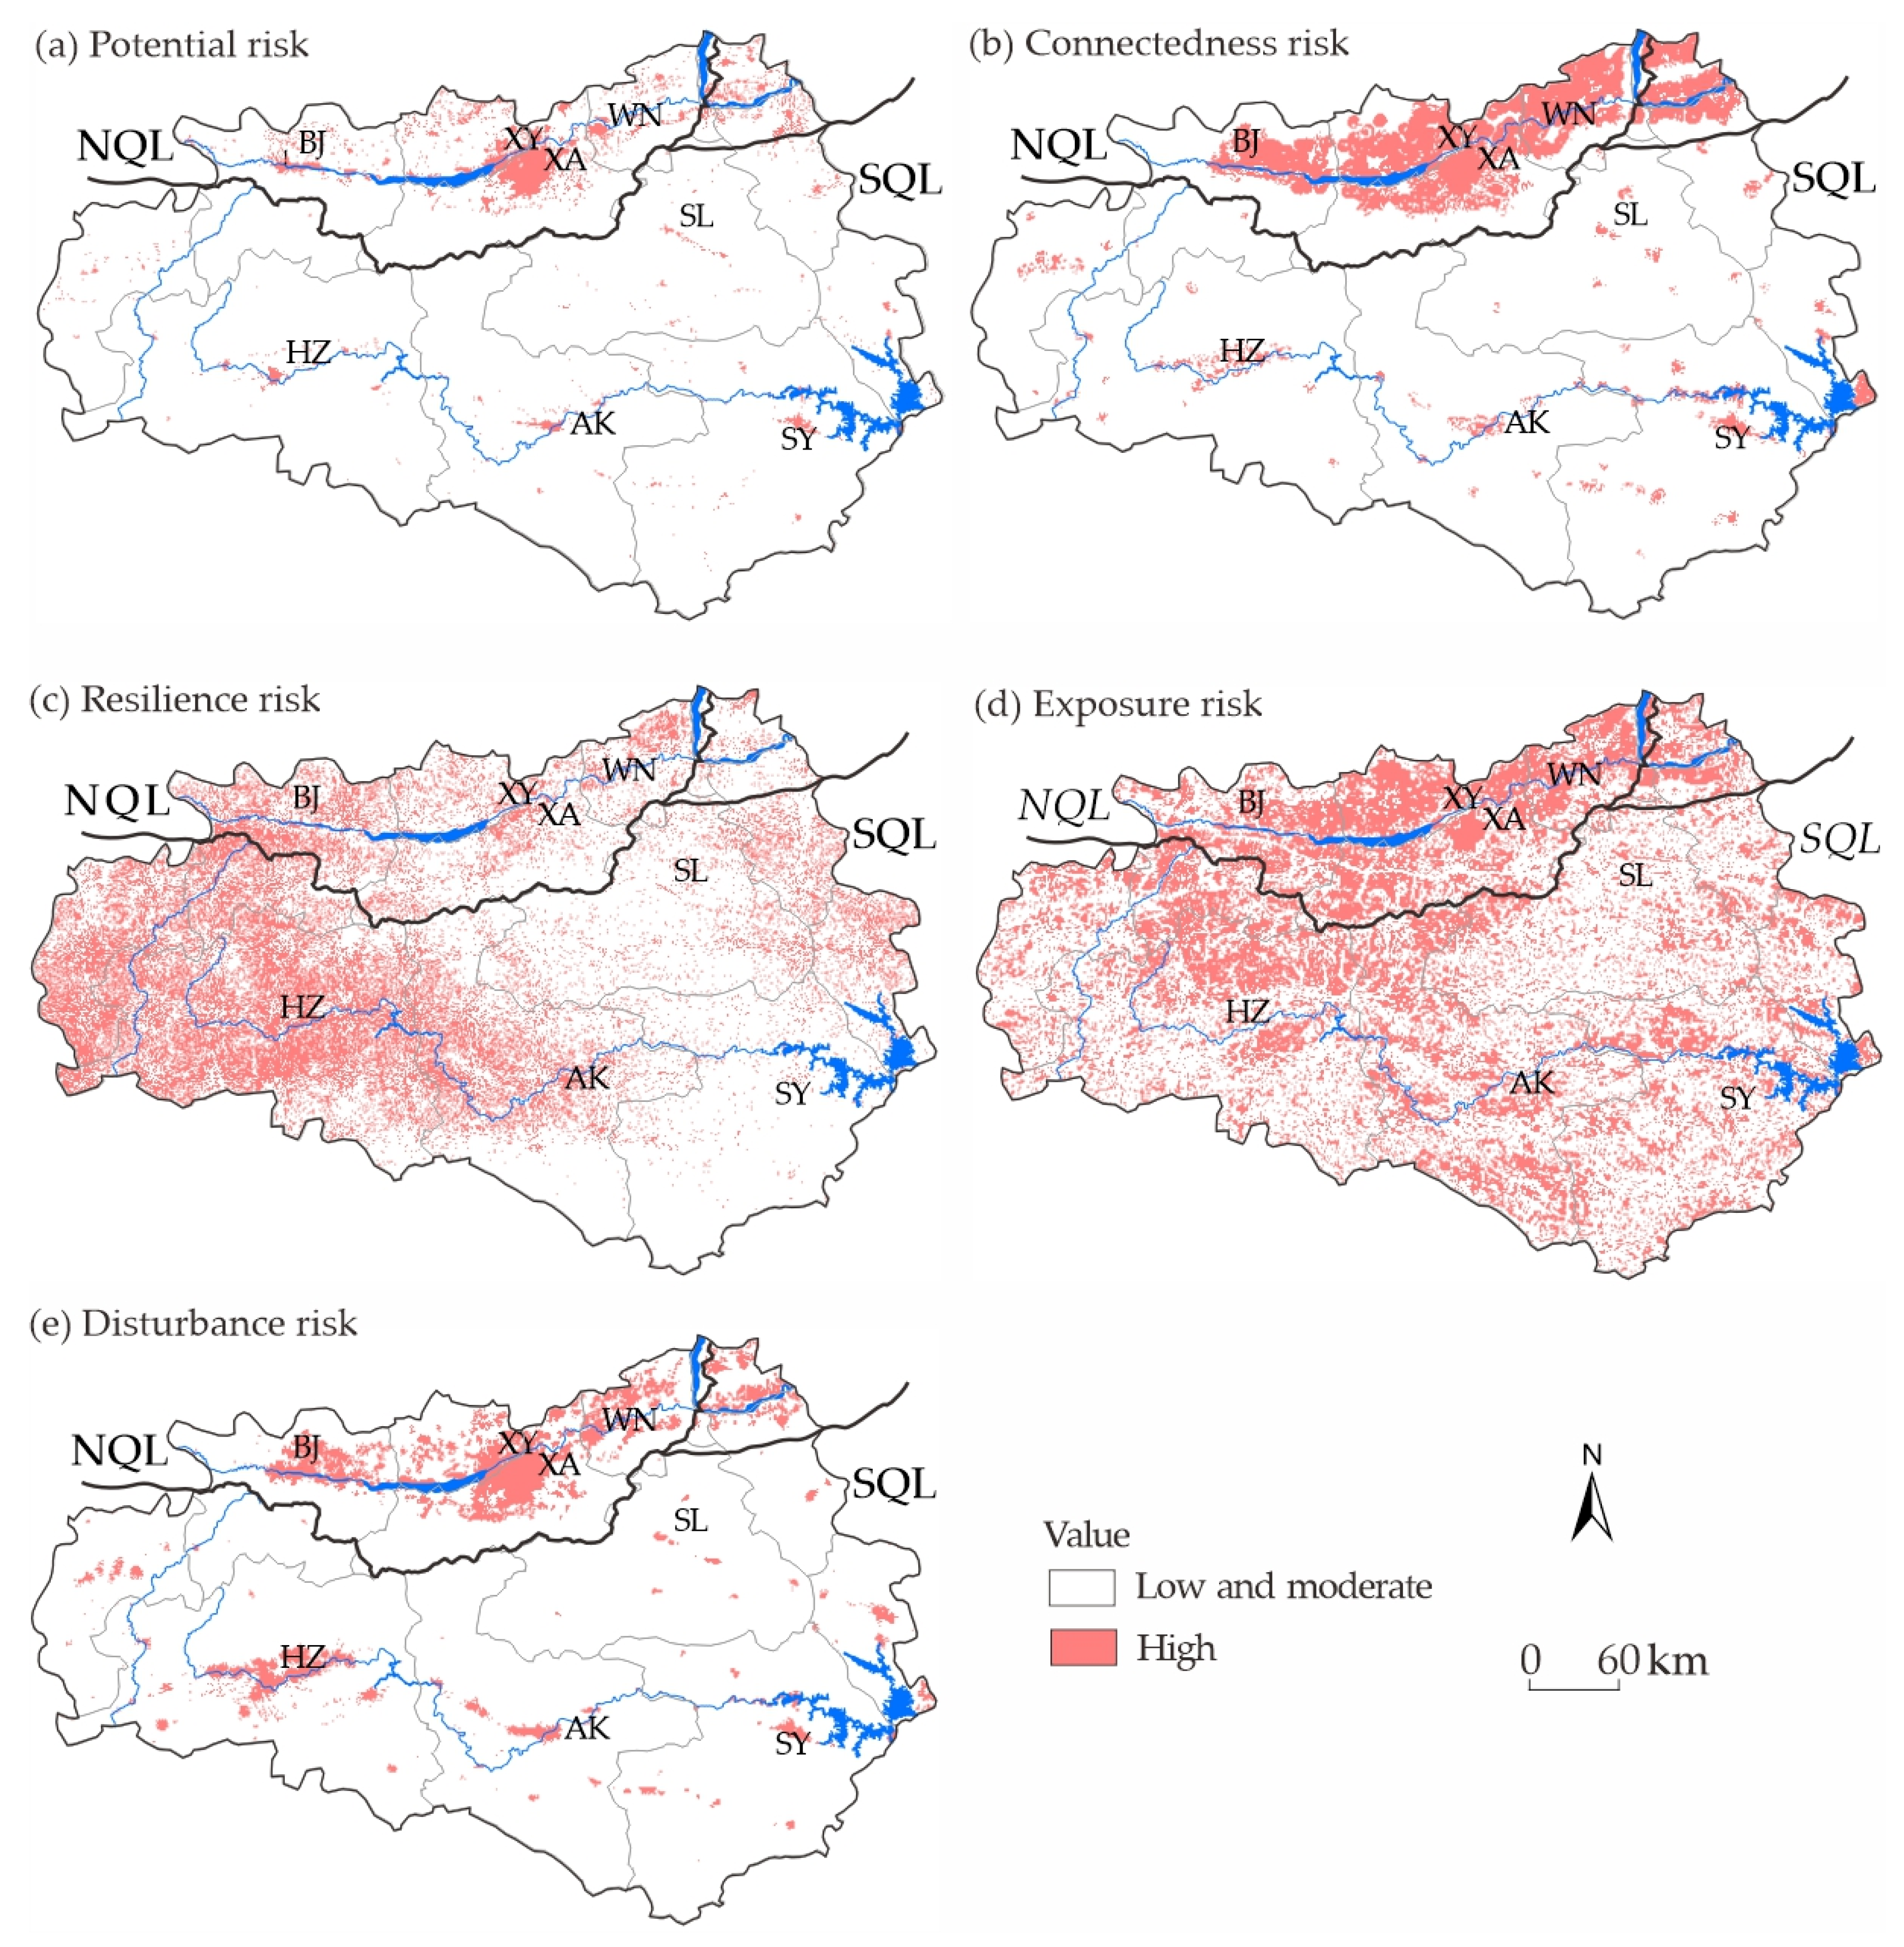
3.2. Spatial Pattern of Landscape Ecological Risk in Different Criteria

The landscape ecological potential, connectedness, and resilience risk assessment was simulated by weighting the corresponding risk indicators of the LERA index system. The spatial patterns of landscape ecological risk in different criteria were spatially visualized in this study (Figure 3).
The potential risk is at a low and moderate level across most of the study area (Figure 3a). High risk is centered on the Xi’an–Xianyang area in the NQL, while the low and moderate risk is widely distributed in the SQL. A similar spatial distribution can be found for the land use, surface temperature, and nighttime light intensity indicators of the potential index system (Figure S1). The connectedness risk enjoyed a consistent spatial pattern of potential risk (Figure 3b); the difference was the high-risk areas extending from Xi’an–Xianyang eastwards and westwards to the urban agglomeration in almost the whole NQL, which can also be found in the distance to construction land and land use affinity indicators of the connectedness index system (Figure S1). The area of high-risk connectedness in the Weihe plain is larger than that of the potential risk, due to the weakened landscape unit connectivity constrained by large areas of arable or construction land coverage. Contrary to the potential and connectedness risk, the resilience risk distribution was shown to have a pattern of high in the west and low in the south of the study area.
The spatial pattern of the ecological resilience risk shows that Xi’an–Xianyang was in a relatively low-risk area (Figure 3c), while the upper reach of the Hanjiang River basin, Hanzhong, and Ankang city were in high-risk areas, which was inconsistent with the potential and connectedness risk outcome. In terms of the exposure and disturbance risk (Figure 3d,e), the proportional area of the former is significantly larger than the latter at the high-risk level, especially in the upstream regions of the Hanjiang River.
Compared to the index assessment results (Figure S1), potential, connectedness, and resilience risk results are not determined by one or more risk indices. For instance, the potential risk pattern is generally correlated with the risk of the land use and vegetation coverage index, but inconsistent with the water erosion and drought index risk. Similarly, connectedness ecological risk has the same pattern as surface temperature and the Shannon index but a different pattern to landscape affinity. The resilience risk pattern was almost the same as the integration of the vegetation coverage and nighttime light intensity but inconsistent with the drought trends index risk results.

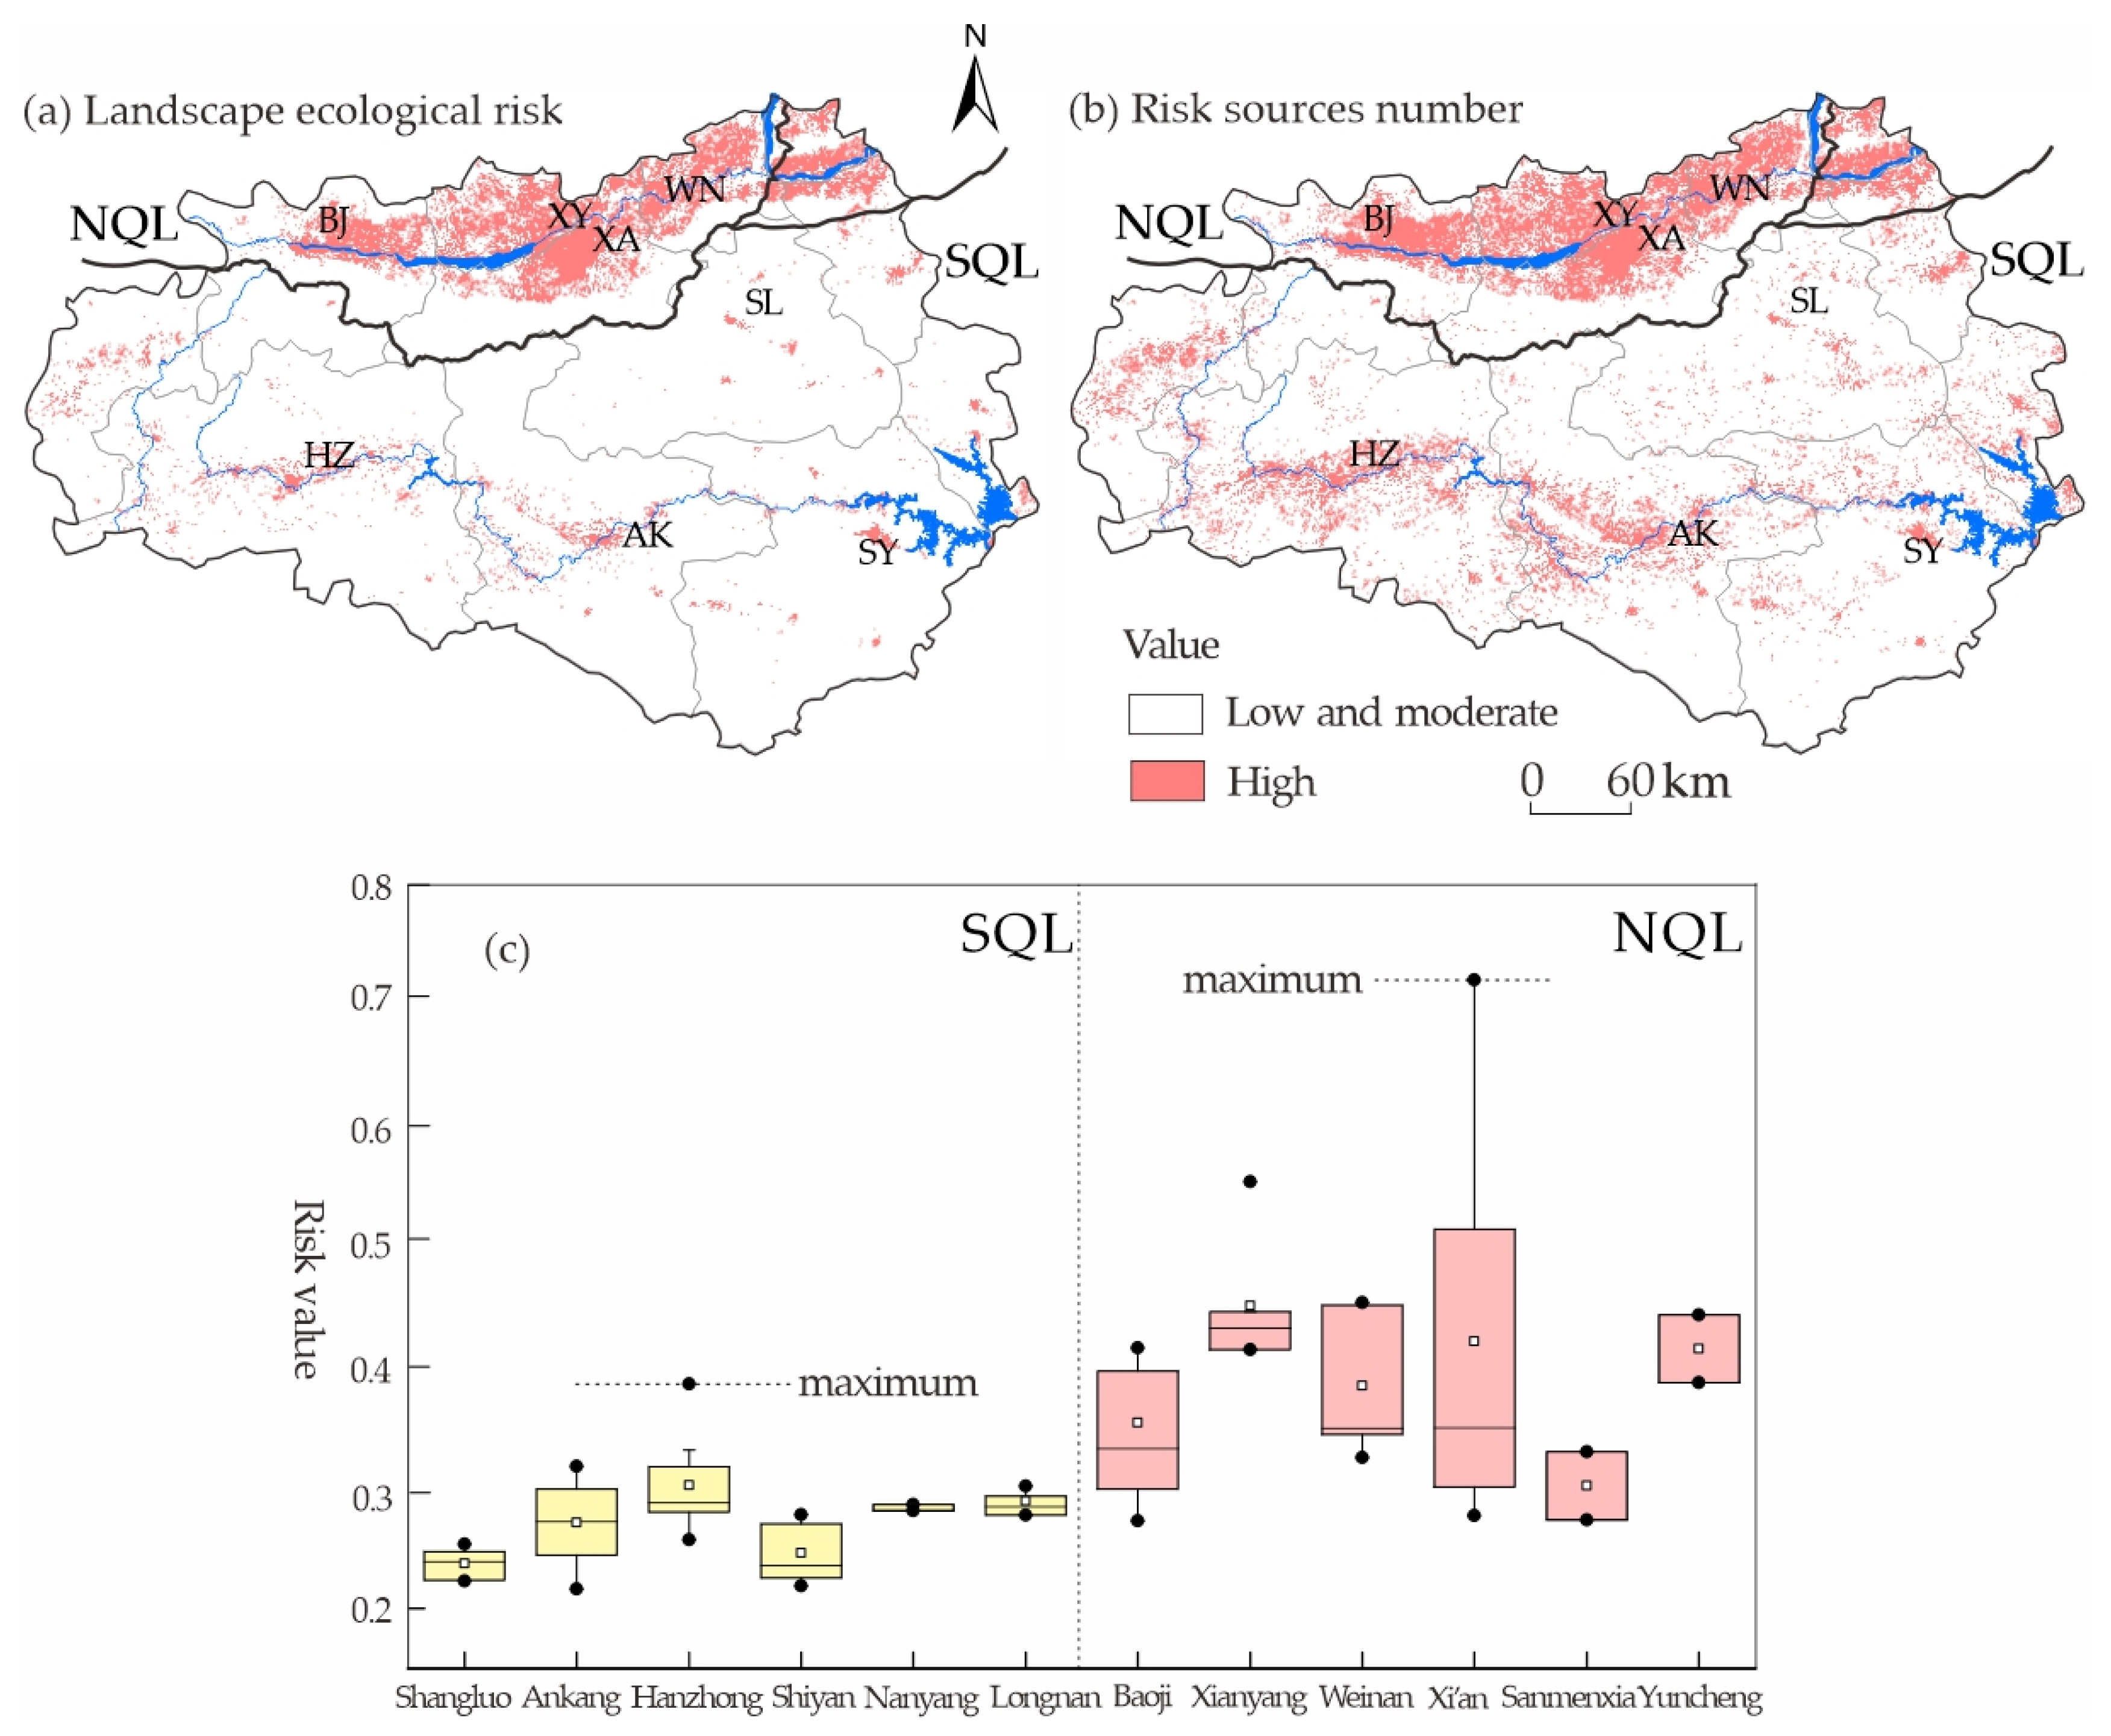
3.3. Spatial Pattern of Comprehensive Landscape Ecological Risk

Spatially explicit comprehensive LERA outcomes were obtained for the potential, connectedness, and resilience criteria weighting and superimposition (Figure 4). The risk values vary in different regions, reflecting the variety of risk characteristics and social development at different levels.
The overall comprehensive risk level in the north and south of the Qinling Mountains was low and moderate, accounting for 90.13% of the total area. The comprehensive landscape ecological risk distribution shows a pattern of local homogeneity and north–south polarization (Figure 4a). The high-risk area is mainly concentrated in the Weihe River plain in the NQL and a small fraction of high-risk area is on the Hanjiang River coast, while the low-risk areas are distributed in the SQL and add up to 86.87% of the total area. The expansion of impervious land uses driven by rapid urbanization intensifies the landscape connectivity decline and ecological vulnerability increase in areas of high ecological risk, while the hybrid distribution of forestland, grassland, water, and other ecological land types result in relatively fine ecological conditions in the low and moderate-risk areas.
The risk source number of each pixel was calculated in the study (Figure 4b). The high values are in the Weihe plain and Hanjiang River coast, characterized by large flat areas and high population density. The ecological systems there are mainly disturbed by anthropogenic activities and the risk sources are diverse. The result of landscape ecological risk assessment shows the risk value in the northern cities is significantly larger than in the southern ones (Figure 4c), and the maximum risk value 0.72 appears in Xi’an, which has almost twice the value of the area in the south.

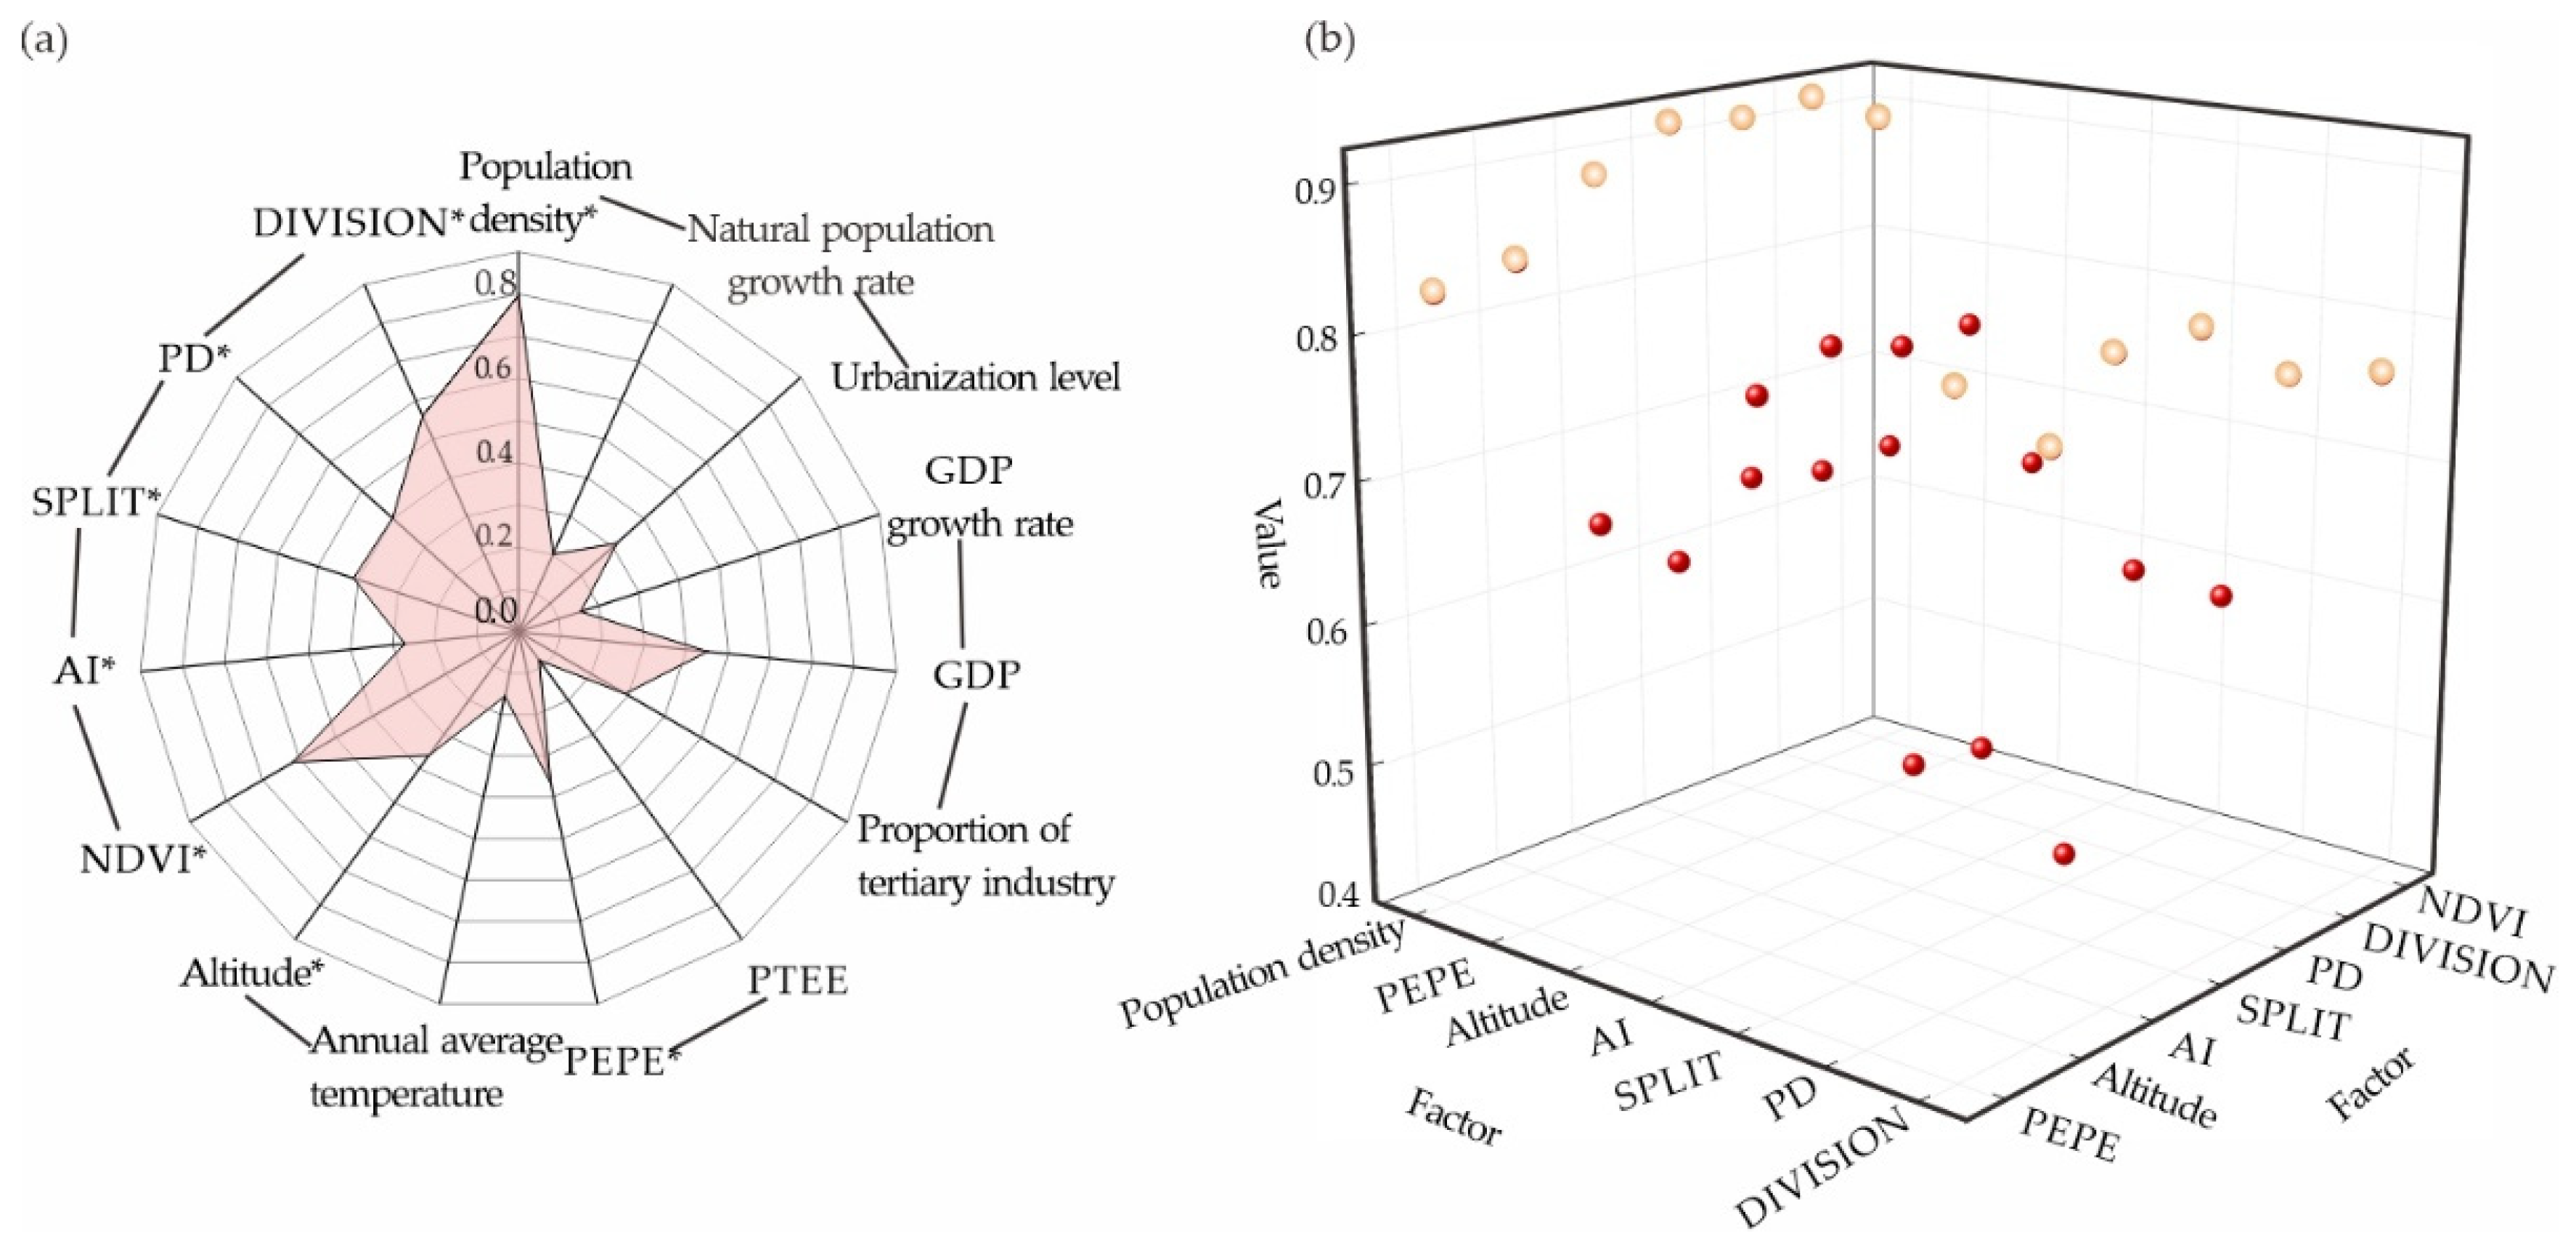
3.4. Driving Factors Affecting the Landscape Ecological Risk

The 15 driving indicators of the comprehensive landscape ecological risk were processed to identify influence factors in the study area by factor detection with GeoDetector (Figure 5a). The factors with a level of significance higher than 0.05 were kept as the driving forces of landscape ecological risk, including population density, PEPE, and all ecological background indicators (Table 4).
The capacity q value of the factors was quantified and sorted as population density (0.797) > NDVI (0.617) > DIVISION (0.559) > SPLIT (0.412) > PD (0.402) > PEPE (0.366) > altitude (0.362) > AI (0.271). Of all the above, the population density and vegetation coverage (NDVI) were the two dominant driving indicators for the landscape ecological risk in the study area.
To make the heterogeneity of the driving forces on landscape ecological risk spatially explicit, the influence of factors driving the index of ecological risk was divided into low, medium, and high levels according to the normalized value of the indicators, aiming to provide theoretical reference for regional risk management and landscape pattern optimization (Figure S2). The index of population intensity reflecting the external pressure of social development on the environment maintenance, SPLIT, PD, and DIVISION index, referring to the landscape fragmentation, were classified as positive forces driving the landscape ecological risk in the study area. While altitude, NDVI, AI, and PEPE index contribute to ecological development to a large degree, they are taken as negative forces driving the landscape ecological risk of the study area.
The explanatory power of the interaction of two factors is greater than that of a single one (Table 4). Apart from the interaction of altitude and AI, the interactive explanatory power of any two factors is characterized as a synchronous enhancement feature, reflecting the synergistic effect between various factors as influencing the spatial heterogeneity of risk. In terms of the explanatory power, approximately 53.57% of the interaction pairs exceeded 0.7. The interaction for population density and SPLIT, population density, and DIVISION reached 0.914. The contribution of population density and NDVI to landscape ecological risk is about 39.28%. The q-value of the interaction of population density and NDVI was distinctly high relative to other factors (Figure 5b), which further indicates that population density and vegetation coverage (NDVI) are the pivotal dynamic indicators of landscape ecological risk, consistent with the findings of the factor detector.

4. Discussion

4.1. PCR 3D Model Framework Feasibility

Existing efforts have effectively promoted the development of landscape ecological risk assessment. Recently, a landscape ecological risk index method has emerged as a representative assessment method for directly or indirectly expressing landscape ecological risk by quantifying landscape pattern [51], which is mainly based on a landscape disturbance index and a landscape vulnerability index. Due to the north–south polarization and local homogeneity of landscape types in the area of this study, the potential risk in woodland areas may be higher than that in artificial land areas under the same landscape ecological index. Consequently, this traditional method cannot be used to accurately simulate the landscape ecological risk of the study area.
LERA has been developed by combining the landscape pattern and ecological processes with the external threats, a concept derived from traditional landscape ecological risk assessment which emphasizes the comprehensive impact of multiple risk sources on the socio-ecological system, but with disregard for the dynamic change in coupled ecosystems and ecological risks.
The socio-ecological system has evolved through a succession of exploitation, conservation, release, and reorganization, with these four stages developing alternately, promoting the development of the ecosystem towards a dynamic and stable state. This development concept creates an adaptive dynamic cycle. [8,23]. With intensive human interference and a changing environment, the uncertainty and diversity of landscape ecological risk has been increasingly enhanced. The dynamic interactive relationship between the landscape and risk effects is still not well understood with respect to the complexity of development and the alternate pathways for system development. The PCR 3D framework based on an adaptive cycle integrating resilience theory has been put forward to make up for the deficiency [52]. The framework focuses on depicting the dynamic process by spatializing trends in the index, aiming to represent the change of landscape patterns and possible landscape ecological risks across a time series [22,53].
Our findings show that the Xi’an and Xianyang areas have high ecological potential, connectedness, and exposure risk but relatively low ecological resilience risk. This indicates that highly developed areas still have the ability to adapt to risk, allowing social ecosystems to develop in a balanced way even under great risk pressure. The upper reaches of the Hanjiang River basin were found to have relatively low potential and connectedness risk, but a high resilience risk, suggesting poor capacity of the system to absorb and resist external threats in this region. LERA research cannot be only undertaken with a spatial and static view, because the outcome would ignore the adaptability of the landscape under risk or underestimate the risk probability. Our findings show that the comprehensive risk assessment result not only depends on the criteria of potential, connectedness, and the resilience risk outcome, but also on the spatial distribution characteristics of ecological landscape risk for each criterion, and is not completely consistent with that of risk of the constituent index systems. This illustrates the complex nature of landscape ecological risk and the diversity of risk sources. The LERA cannot be formulated from limited criteria or indicators but only in an integrated and comprehensive way.
We have shown that the impact of human activities and a changing climate on landscape ecological risk varies with the change of climate elements and characteristics of the study area. The PCR 3D LERA framework adopted in this study reflects the spatial and temporal heterogeneity of landscape ecological risk and the trend in dynamic response of ecosystem risk pressures, contributing to the formulation of an ecological construction scheme. However, a variety of factors including different perspectives of the LERA, such as the main functional features of the region and different exploitation goals such as economy-oriented or environment-oriented development, affect the ultimate evaluation result of landscape ecological risk [12]. Therefore, the theoretical framework employed in this study can be applied to assess landscape ecological risk in other regions influenced by human behaviors and changing climates. The index system and approaches used in this study are also feasible for examination of ecological security, ecosystem health, and socio-ecosystem sustainability.

4.2. Landscape Ecological Risk Implication

The LERA was conducted from an integral and dynamic perspective based on thinking from landscape ecology, where the risk assessment outcome represents geographical and ecological, as well as social development implications.
The topography and high altitude of the Qinling Mountains impedes the movement of vapor over the southwest path to the Bengal Bay [54], significantly influencing the risk pattern of slope, precipitation, erosion, and drought indicators in the LERA index system. The results show that the high risk of water erosion is concentrated in the upper reaches of the Hanjiang River in the SQL, and is affected by abundant precipitation in this subtropical monsoon climate. In addition, a few areas in the west of the study area were found to be prone to high incidence of drought, indicating a potentially heterogeneous impact from global warming in the study area.
The Xi’an and Xianyang urban agglomeration plays a prominent role as a social and economic center. The acceleration of the urbanization process speeds up the transfer of ecological land to cultivated and construction land, increasing landscape fragmentation and weakening the degree of landscape connectivity. The Xi’an and Xianyang area has a high ecological potential and connectedness risk. However, resilience risk is relatively low in this area, suggesting that Xi’an and Xianyang still have the capacity to absorb and resist external disturbance and control high exposure and disturbance risk.
In contrast, the SQL follows an ecological-oriented development pathway where exploitation is restricted because the areas have a critical role as water resources reserves for the south–north water diversion project. In this location, the land use-land coverage type is dominant and the mixed natural land types of woodland and grassland help to decrease the external interference risk and the trend towards ecological loss. However, it is noted that the resilience and exposure risk was relatively high in the upper reach of the Hanjiang River basin owing to the conversion of ecological land for the facilities constructed for the water transfer project, increasing landscape fragmentation and resulting in greatly reduced ability for the ecosystem to self-regulate and resist external disturbance.
The comprehensive risk results show that the vast region of the study area is at low and moderate risk (90.13% of the total area), suggesting that generally, socio-ecosystem development is somewhat balanced in the north and south of the Qinling Mountains with high ability to resist external disturbance. The larger landscape ecological risk values and risk sources are found at the location of the most urbanized cities of the northern part of the study region. This is the result of large areas of cultivated land and artificial surface coverage, as a result of high population density and mass urbanization projects. These effects intensify the landscape fragmentation and vulnerability and urban heat island effect, leading to a succession of environmental problems.

4.3. Regional Risk Management Implementation

Our findings show that population density and vegetation coverage (NDVI) are the primary forces driving landscape ecological risk in the study area. This suggests that anthropogenic activity has a greater impact on the coupling of the human and natural system than other factors. Generally, Xi’an–Xianyang are the areas with highest landscape ecological risk. These regions enjoy a higher population density and AI, with lower NDVI and PEPE in terms of the forces driving the landscape ecological risk. Therefore, risk management in these places should focus on the positive impact of human regulation on landscape pattern and ecological investment, such as reducing artificial impervious construction areas and increasing green space to realize the effective reduction of ecological risks.
Altitude and slope are two crucial topographical threats affecting vegetation coverage (NDVI) and the landscape ecological risk pattern [31]. Vegetation coverage in low-altitude and gently sloped areas is highly likely to be disturbed by human beings. For instance, the low-altitude areas in the SQL are concentrated in the cities of Hanzhong, Ankang, and Shiyan, where there is presently a low level of economic development but a high growth rate. These areas have a high DIVISION, SPLIT, and PD and low NDVI, AI, and PEPE, reflecting the low vegetation coverage and high landscape fragmentation following land exploitation in the given period. The underlying cause is that ecological land has been continuously appropriated for conversion to arable land and constructed land due to the economic benefits derived. Given this, regional planning should be centered on controlling the disorderly expansion of urban buildup areas and increasing the construction of ecological land. In regions with low landscape ecological risk, especially where NDVI and woodland and grassland coverage is high, management planning for sources of landscape risk should avoid human disturbance and the ecological risks caused by natural disasters such as drought and landslides.
The coupled natural and social systems are continuously rebalanced through the rapid release and slow reorganization of ecosystems following socioeconomic exploitation and environmental conservation, achieving coordinated development of new natural and social ecosystem equilibria [8]. Landscapes in different regions respond to risk impacts differently due to differences in socio-ecological systems. Considering the slow change in ecosystem structure, function, and process through the adaptive cycle under external disturbance, a resilient management planning perspective should be implemented in regional and urban development strategies [25].

4.4. Limitations of the Study

The PCR 3D model framework adopted in this study reflects the spatial and temporal heterogeneity of landscape ecological risk and the ecosystem risk pressure and dynamic response trends; however, there are some shortcomings in this method. To spatially explicitly evaluate landscape ecological risks, the study area can be divided into risk sampling units, such as equidistant sampling grids (Mo et al., 2017) with basically the same environmental conditions and external interference sources. Then a risk assessment framework for targeted risk receptors and policy making can be formed combining the risk index system identified in this study. Besides, the weight set in the risk assessment index system is limited by subjective cognition and decision preferences, bringing a lot of uncertainty to the evaluation results. Therefore, reducing the effects of subjective decisions and the uncertainty of risk assessment should be the focus of further work.

5. Conclusions

The dynamic response and the likelihood risk trend of the landscape ecosystem to anthropogenic threats and a warming climate were assessed using a PCR 3D model adaptive cycle algorithm in this study between 2008 and 2017. The outcome shows that the overall landscape ecological risk is at a low and moderate level across the whole study area, indicating that ecosystems in this area enjoy a strong ability to resist external disturbance.
Local homogeneity and north–south polarization are the main patterns of integrated landscape ecological risk in the study area. The high-risk area was located on the Weihe River plain in the NQL, while the low-risk area was spread across the SQL. The research shows that the Xi’an–Xianyang area has a high potential and connectedness risk but a relatively low resilience risk, indicating that this area has regulation adaptability to reduce risks in the future. The findings show that the upper reaches of the Hanjiang River, the water source of the middle route of the South-to-North Water Transfer Project, has high resilience risk and exposure risk due to reduction in the area of ecological landscapes and increased impervious area as a result of the construction of water transfer facilities. The consequence will be the deterioration of the ecological environment of the water source in the future. The results indicate that population density and vegetation coverage NDVI were the dominant driving forces for landscape ecological risk, showing that anthropogenic activity is the primary cause of landscape ecological risks in the study area. The PCR 3D LERA conducted in this study can inform the healthy development of regional economies and ecology in an evidence-based way. Combining PCR 3D adaptive research with ecological optimization in further work could identify landscape ecological control zoning more accurately in the study area and beyond.

Supplementary Materials

The following are available online at https://www.mdpi.com/article/10.3390/land10070739/s1, Figure S1: Spatial pattern of different indicators in the LERA index system in the north and south of Qinling Mountains. Figure S2: Spatial pattern of the factors driving the landscape ecological risk in the north and south of Qinling Mountains.

Author Contributions

Conceptualization, X.L., L.Z. and J.Y.; methodology, X.L., S.L., Y.Z.; software, Y.Z.; formal analysis, X.L. and Y.Z.; resources, X.L. and Y.Z; writing—original draft preparation, X.L., Y.Z.; writing—review and editing, X.L., S.L., P.J.O. and L.Z.; visualization, X.L., Y.Z. and P.J.O.; supervision, S.L. and J.Y.; project administration, S.L. and L.Z.; funding acquisition, L.Z. All authors have read and agreed to the published version of the manuscript.

Funding

This research was funded by the National Key Research and Development Plan of China, grant number 2016YFC0501603, the National Natural Science Foundation of China, grant number 41871187 and the Natural Science Basic Research Plan in Shaanxi Province of China (2021JQ768, 2020JQ415, 2018JQ4025).

Data Availability Statement

Not applicable.

Acknowledgments

The authors gratefully acknowledge the two anonymous reviewers for their valuable comments and suggestions, which strengthened the quality of the paper substantially.

Conflicts of Interest

The authors declare no conflict of interest.

References

  1. US Environmental Protection Agency Risk Assessment Forum. Guidelines for Ecological Risk Assessment; US Environmental Protection Agency: Washington, DC, USA, 1998.
  2. Piet, G.J.; Knights, A.M.; Jongbloed, R.H.; Tamis, J.E.; de Vries, P.; Robinson, L.A. Ecological Risk Assessments to Guide Decision-Making: Methodology Matters. Environ. Sci. Policy 2017, 68, 1–9. [Google Scholar] [CrossRef] [Green Version]
  3. Su, S.; Xiao, R.; Jiang, Z.; Zhang, Y. Characterizing Landscape Pattern and Ecosystem Service Value Changes for Urbanization Impacts at an Eco-Regional Scale. Appl. Geogr. 2012, 34, 295–305. [Google Scholar] [CrossRef]
  4. Xu, X.; Yang, G.; Tan, Y.; Zhuang, Q.; Li, H.; Wan, R.; Su, W.; Zhang, J. Ecological Risk Assessment of Ecosystem Services in the Taihu Lake Basin of China from 1985 to 2020. Sci. Total Environ. 2016, 554–555, 7–16. [Google Scholar] [CrossRef]
  5. Wolf, J.; Adger, W.N.; Lorenzoni, I.; Abrahamson, V.; Raine, R. Social Capital, Individual Responses to Heat Waves and Climate Change Adaptation: An Empirical Study of Two UK Cities. Glob. Environ. Change 2010, 20, 44–52. [Google Scholar] [CrossRef]
  6. Miller, S.; Chua, K.; Coggins, J.; Mohtadi, H. Heat Waves, Climate Change, and Economic Output. J. Eur. Econ. Assoc. 2021. [Google Scholar] [CrossRef]
  7. Li, X.; Zhang, L.; O’Connor, P.J.; Yan, J.; Wang, B.; Liu, D.L.; Wang, P.; Wang, Z.; Wan, L.; Li, Y. Ecosystem Services under Climate Change Impact Water Infrastructure in a Highly Forested Basin. Water 2020, 12, 2825. [Google Scholar] [CrossRef]
  8. Liu, Y.; Wang, Y.; Peng, J.; Zhang, T.; Wei, H. Urban landscape ecological risk assessment based on the 3D framework of adaptive cycle. ACTA Geogr. Sin. 2015, 70, 1052–1067. (In Chinese) [Google Scholar] [CrossRef]
  9. Lin, Y.; Hu, X.; Zheng, X.; Hou, X.; Zhang, Z.; Zhou, X.; Qiu, R.; Lin, J. Spatial Variations in the Relationships between Road Network and Landscape Ecological Risks in the Highest Forest Coverage Region of China. Ecol. Indic. 2019, 96, 392–403. [Google Scholar] [CrossRef]
  10. Liu, Y.; Peng, J.; Wang, Y. Relationship between urban heat island and landscape patterns:From city size and landscape composition to spatial configuration. Acta Ecol. Sin. 2017, 37, 7769–7780. (In Chinese) [Google Scholar] [CrossRef]
  11. Zhang, W.; Chang, W.J.; Zhu, Z.C.; Hui, Z. Landscape Ecological Risk Assessment of Chinese Coastal Cities Based on Land Use Change. Appl. Geogr. 2020, 117, 102174. [Google Scholar] [CrossRef]
  12. Cao, Q.; Zhang, X.; Lei, D.; Guo, L.; Sun, X.; Kong, F.; Wu, J. Multi-Scenario Simulation of Landscape Ecological Risk Probability to Facilitate Different Decision-Making Preferences. J. Clean. Prod. 2019, 227, 325–335. [Google Scholar] [CrossRef]
  13. Peng, J.; Liu, Y.; Pan, Y.; Zhao, Z.; Song, Z.; Wang, Y. Study on the Correlation between Ecological Risk due to Natural Disaster and Landscape Pattern-Process: Review and Prospect. Adv. Earth Sci. 2014, 29, 1186–1196. (In Chinese) [Google Scholar] [CrossRef]
  14. Chen, A.; Zhao, X.; Yao, L.; Chen, L. Application of a New Integrated Landscape Index to Predict Potential Urban Heat Islands. Ecol. Indic. 2016, 69, 828–835. [Google Scholar] [CrossRef]
  15. McGarigal, K.; Compton, B.W.; Plunkett, E.B.; DeLuca, W.V.; Grand, J.; Ene, E.; Jackson, S.D. A Landscape Index of Ecological Integrity to Inform Landscape Conservation. Landsc. Ecol. 2018, 33, 1029–1048. [Google Scholar] [CrossRef] [Green Version]
  16. Chen, L.; Fu, B.; Zhao, W. Source-sink landscape theory and its ecological significance. Front. Biol. China 2008, 3, 131–136. [Google Scholar] [CrossRef]
  17. Cheng, X.; Chen, L.; Sun, R. Modeling the Non-Point Source Pollution Risks by Combing Pollutant Sources, Precipitation, and Landscape Structure. Environ. Sci. Pollut. Res. 2019, 26, 11856–11863. [Google Scholar] [CrossRef]
  18. Heinrichs, J.A.; Lawler, J.J.; Schumaker, N.H.; Walker, L.E.; Cimprich, D.A.; Bleisch, A. Assessing Source-Sink Stability in the Context of Management and Land-Use Change. Landsc. Ecol. 2019, 34, 259–274. [Google Scholar] [CrossRef]
  19. Zhang, L.; Peng, J.; Liu, Y.; Wu, J. Coupling Ecosystem Services Supply and Human Ecological Demand to Identify Landscape Ecological Security Pattern: A Case Study in Beijing–Tianjin–Hebei Region, China. Urban Ecosyst. 2017, 20, 701–714. [Google Scholar] [CrossRef]
  20. Danish; Ulucak, R.; Khan, S.U.-D. Determinants of the Ecological Footprint: Role of Renewable Energy, Natural Resources, and Urbanization. Sustain. Cities Soc. 2020, 54, 101996. [Google Scholar] [CrossRef]
  21. Gotts, N.M. Resilience, Panarchy, and World-Systems Analysis. Ecol. Soc. 2007, 12, 1–14. [Google Scholar] [CrossRef] [Green Version]
  22. Burkhard, B.; Fath, B.D.; Müller, F. Adapting the Adaptive Cycle: Hypotheses on the Development of Ecosystem Properties and Services. Ecol. Model. 2011, 222, 2878–2890. [Google Scholar] [CrossRef]
  23. Gunderson, L.H.; Holling, C.S. Understanding Transformations in Human and Natural Systems; Island Press: Washington, DC, USA, 2002. [Google Scholar]
  24. Hughes, T.P.; Rodrigues, M.J.; Bellwood, D.R.; Ceccarelli, D.; Hoegh-Guldberg, O.; McCook, L.; Moltschaniwskyj, N.; Pratchett, M.S.; Steneck, R.S.; Willis, B. Phase Shifts, Herbivory, and the Resilience of Coral Reefs to Climate Change. Curr. Biol. 2007, 17, 360–365. [Google Scholar] [CrossRef] [Green Version]
  25. Luo, F.; Liu, Y.; Peng, J.; Wu, J. Assessing Urban Landscape Ecological Risk through an Adaptive Cycle Framework. Landsc. Urban Plan. 2018, 180, 125–134. [Google Scholar] [CrossRef]
  26. Li, T.; Dong, Y.; Liu, Z. A Review of Social-Ecological System Resilience: Mechanism, Assessment and Management. Sci. Total Environ. 2020, 723, 138113. [Google Scholar] [CrossRef]
  27. Deng, C.; Bai, H.; Gao, S.; Huang, X.; Meng, Q.; Zhao, T.; Zhang, Y.; Su, K.; Guo, S. Comprehensive effect of climatic factors on plant phenology in Qinling Mountains region during 1964-2015. ACTA Geogr. Sin. 2018, 73, 917–931. (In Chinese) [Google Scholar] [CrossRef]
  28. Liu, Y.; Linderholm, H.W.; Song, H.; Cai, Q.; Tian, Q.; Sun, J.; Chen, D.; Simelton, E.; Seftigen, K.; Tian, H.; et al. Temperature Variations Recorded in Pinus Tabulaeformis Tree Rings from the Southern and Northern Slopes of the Central Qinling Mountains, Central China. Boreas 2009, 38, 285–291. [Google Scholar] [CrossRef]
  29. Li, S.; Lu, J.; Yan, J.; Liu, X.; Kong, F.; Wang, J. Spatiotemporal variability of temperature in northern and southern Qinling Mountains and its influence on climatic boundary. ACTA Geogr. Sin. 2018, 73, 13–24. (In Chinese) [Google Scholar] [CrossRef]
  30. Shi, H.; Zhou, Q.; Xie, F.; He, N.; He, R.; Zhang, K.; Zhang, Q.; Dang, H. Disparity in Elevational Shifts of Upper Species Limits in Response to Recent Climate Warming in the Qinling Mountains, North-Central China. Sci. Total Environ. 2020, 706, 135718. [Google Scholar] [CrossRef] [PubMed]
  31. Wang, B.; Xu, G.; Li, P.; Li, Z.; Zhang, Y.; Cheng, Y.; Jia, L.; Zhang, J. Vegetation Dynamics and Their Relationships with Climatic Factors in the Qinling Mountains of China. Ecol. Indic. 2020, 108, 105719. [Google Scholar] [CrossRef]
  32. Guo, S.; Bai, H.; Meng, Q.; Zhao, T.; Huang, X.; Qi, G. Landscape pattern changes of woodland and grassland and its driving forces in Qinling Mountains. Acta Ecol. Sin. 2020, 40, 130–140. (In Chinese) [Google Scholar] [CrossRef]
  33. Yan, J. Comparable Studies on Environmental Changes in Southern and Northern Qinling Moutains; China Science Press: Beijing, China, 2006; 219p. [Google Scholar]
  34. Liu, N.; Liu, Y.; Zhou, Q.; Bao, G. Droughts and Broad-Scale Climate Variability Reflected by Temperature-Sensitive Tree Growth in the Qinling Mountains, Central China. Int. J. Biometeorol. 2013, 57, 169–177. [Google Scholar] [CrossRef] [PubMed]
  35. He, H.; Zhou, J.; Peart, M.R.; Chen, J.; Zhang, Q. Sensitivity of Hydrogeomorphological Hazards in the Qinling Mountains, China. Quat. Int. 2012, 282, 37–47. [Google Scholar] [CrossRef]
  36. Li, S.; Yan, J.; Wan, J. The Characteristics of Temperature Change in Qinling Mountains. Sci. Geogr. Sin. 2012, 32, 853–858. (In Chinese) [Google Scholar] [CrossRef]
  37. Vicente-Serrano, S.M.; Beguería, S.; López-Moreno, J.I. A Multiscalar Drought Index Sensitive to Global Warming: The Standardized Precipitation Evapotranspiration Index. J. Clim. 2010, 23, 1696–1718. [Google Scholar] [CrossRef] [Green Version]
  38. Yao, N.; Li, L.; Feng, P.; Feng, H.; Li Liu, D.; Liu, Y.; Jiang, K.; Hu, X.; Li, Y. Projections of Drought Characteristics in China Based on a Standardized Precipitation and Evapotranspiration Index and Multiple GCMs. Sci. Total Environ. 2020, 704, 135245. [Google Scholar] [CrossRef]
  39. Mandal, S.; Srivastav, R.K.; Simonovic, S.P. Use of Beta Regression for Statistical Downscaling of Precipitation in the Campbell River Basin, British Columbia, Canada. J. Hydrol. 2016, 538, 49–62. [Google Scholar] [CrossRef]
  40. Hutchinson, M.F.; Xu, T. Anusplin V Ersion 4.4 User Guide; The Australian National University: Canberra, Australia, 2013. [Google Scholar]
  41. Mcgarigal, K.S.; Cushman, S.A.; Neel, M.C.; Ene, E. FRAGSTATS: Spatial Pattern Analysis Program for Categorical Maps; Computer Software Program; University of Massachusetts: Amherst, MA, USA, 2002. [Google Scholar]
  42. Morandi, D.T.; de Jesus França, L.C.; Menezes, E.S.; Machado, E.L.M.; da Silva, M.D.; Mucida, D.P. Delimitation of Ecological Corridors between Conservation Units in the Brazilian Cerrado Using a GIS and AHP Approach. Ecol. Indic. 2020, 115, 106440. [Google Scholar] [CrossRef]
  43. Bu, J.; Li, C.; Wang, X.; Zhang, Y.; Yang, Z. Assessment and Prediction of the Water Ecological Carrying Capacity in Changzhou City, China. J. Clean. Prod. 2020, 277, 123988. [Google Scholar] [CrossRef]
  44. Gao, P.P.; Li, Y.P.; Sun, J.; Li, H.W. Coupling Fuzzy Multiple Attribute Decision-Making with Analytic Hierarchy Process to Evaluate Urban Ecological Security: A Case Study of Guangzhou, China. Ecol. Complex. 2018, 34, 23–34. [Google Scholar] [CrossRef]
  45. Rodríguez Sousa, A.A.; Parra-López, C.; Sayadi-Gmada, S.; Barandica, J.M.; Rescia, A.J. A Multifunctional Assessment of Integrated and Ecological Farming in Olive Agroecosystems in Southwestern Spain Using the Analytic Hierarchy Process. Ecol. Econ. 2020, 173, 106658. [Google Scholar] [CrossRef]
  46. Galic, N.; Schmolke, A.; Forbes, V.; Baveco, H.; van den Brink, P.J. The Role of Ecological Models in Linking Ecological Risk Assessment to Ecosystem Services in Agroecosystems. Sci. Total Environ. 2012, 415, 93–100. [Google Scholar] [CrossRef] [Green Version]
  47. Wang, J.; Xu, C. Geodetector: Principle and prospective. ACTA Geogr. Sin. 2017, 72, 116–134. (In Chinese) [Google Scholar] [CrossRef]
  48. Wang, T.; Song, H.; Wang, F.; Zhai, S.; Han, Z.; Wang, D.; Li, X.; Zhao, H.; Ma, R.; Zhang, G. Hysteretic Effects of Meteorological Conditions and Their Interactions on Particulate Matter in Chinese Cities. J. Clean. Prod. 2020, 274, 122926. [Google Scholar] [CrossRef]
  49. Wang, J.-F.; Zhang, T.-L.; Fu, B.-J. A Measure of Spatial Stratified Heterogeneity. Ecol. Indic. 2016, 67, 250–256. [Google Scholar] [CrossRef]
  50. Jaeger, J.A.G. Landscape Division, Splitting Index, and Effective Mesh Size: New Measures of Landscape Fragmentation. Landsc. Ecol. 2000, 15, 115–130. [Google Scholar] [CrossRef]
  51. Jin, X.; Jin, Y.; Mao, X. Ecological Risk Assessment of Cities on the Tibetan Plateau Based on Land Use/Land Cover Changes—Case Study of Delingha City. Ecol. Indic. 2019, 101, 185–191. [Google Scholar] [CrossRef]
  52. Grundmann, P.; Ehlers, M.-H.; Uckert, G. Responses of Agricultural Bioenergy Sectors in Brandenburg (Germany) to Climate, Economic and Legal Changes: An Application of Holling’s Adaptive Cycle. Energy Policy 2012, 48, 118–129. [Google Scholar] [CrossRef]
  53. Singh, R.; van Werkhoven, K.; Wagener, T. Hydrological Impacts of Climate Change in Gauged and Ungauged Watersheds of the Olifants Basin: A Trading-Space-for-Time Approach. Hydrol. Sci. J. 2014, 59, 29–55. [Google Scholar] [CrossRef]
  54. Xin, R.; Duan, K. Numerical simulation and spatial distribution of summer precipitation in the Qinling Mountains. Acta Geogr Sin 2019, 74, 2329–2341. (In Chinese) [Google Scholar] [CrossRef]
Figure 1. Overview and land use/land coverage types of the north and south of Qinling Mountains. NQL is short for the north of Qinling Mountains, SQL is for the south of Qinling Mountains.
Land 10 00739 g001
Figure 2. Potential-connectedness-resilience (PCR) 3D landscape ecological risk assessment (LERA) framework of the study.
Land 10 00739 g002
Figure 3. Spatial pattern of landscape ecological risk for different criteria in the north and south of the Qinling Mountains. XA is abbreviation for Xi’an city, BJ is for Baoji city, XY is for Xianyang city, WN is for Weinan city, SL is for Shangluo city, HZ is for Hanzhong city, AK is for Ankang city, SY is for Shiyan city.
Land 10 00739 g003
Figure 4. (a) Spatial pattern of the comprehensive landscape ecological risk in the north and south of Qinling Mountains. The high risk is shown in pink and the low and moderate is shown in white; XA is abbreviation for Xi’an city, BJ is for Baoji city, XY is for Xianyang city, WN is for Weinan city, SL is for Shangluo city, HZ is for Hanzhong city, AK is for Ankang city, SY is for Shiyan city. (b) Risk sources number of landscape ecological risk in the study area. The area with a risk source number over 3 is identified as high risk, and the rest is identified as a low and moderate-risk source area. (c) The landscape ecological risk difference in different cities of the north and south of the Qinling Mountains.
Land 10 00739 g004
Figure 5. (a) Results of factor detection for the comprehensive landscape ecological risk. Factors with * mean the q-value passes the 0.05 significance level. (b) Result of interaction detector for the landscape ecological risk. The points in yellow are the q-values of the interaction detection with population density and NDVI indicators involved, respectively. The red points are the interaction for the other indicators and do not involve population density or NDVI factor.
Land 10 00739 g005
Table 1. Data and materials.
DatasetsDate SourceResolution
DEMGlobal Digital Elevation Model
http://www.gdem.aster.ersdac.or.jp/, accessed on 20 September 2019
30 m
Vegetation coverageVegetation Indices 16-days L3 Global 250 m product (MOD13Q1)
https://ladsweb.modaps.eosdis.nasa.gov, accessed on 15 December 2019
250 m
Surface temperatureLand Surface Temperature/Emissivity 8-days L3 Global 1 km product (MOD11A2)
https://ladsweb.modaps.eosdis.nasa.gov, accessed on 25 December 2019
1 km
Land use coverLand Cover Type Yearly L3 Global 500 m product (MCD12Q1)
https://ladsweb.modaps.eosdis.nasa.gov,
accessed on 10 September 2019
500 m
PrecipitationChina National Meteorological Center http://data.cma.cn,
accessed on 20 September 2019
Vector
TemperatureChina National Meteorological Center http://data.cma.cn,
accessed on 20 September 2019
Vector
NPP-VIIRS Nighttime lightNational Centers for Environmental Information
https://www.ngdc.noaa.gov, accessed on 25 December 2019
750 m
Table 2. LERA index system.
CriteriaRiskIndexWeightNormalization
Potential risk
(0.41)
ExposureSlope0.15+
Land use type0.21+
Vegetation coverage0.22
Disturbanceprecipitation erosion0.05+
Drought0.08+
Surface temperature0.14+
Nighttime light intensity0.15+
Connectedness risk
(0.33)
ExposureShannon diversity index0.12
Landscape contagion index0.32
DisturbanceDistance to construction land0.21
Landscape affinity0.35+
Resilience risk
(0.26)
ExposureVegetation coverage trends0.50
DisturbanceNighttime light intensity trends0.25+
Drought trends0.25+
Note: “+” means positive factor and “−” means negative factor.
Table 3. Types of interaction between two variables.
Graphic VisualizationDiscriminationInteraction Type
Land 10 00739 i001 q ( x 1 x 2 ) < min ( q ( x 1 ) , q ( x 2 ) ) Weaken, nonlinear
Land 10 00739 i002 min ( q ( x 1 ) , q ( x 2 ) ) < q ( x 1 x 2 ) < max ( q ( x 1 ) , q ( x 2 ) ) Weaken, uni-
Land 10 00739 i003 q ( x 1 x 2 ) > max ( q ( x 1 ) , q ( x 2 ) ) Enhance, bi-
Land 10 00739 i004 q ( x 1 x 2 ) = q ( x 1 ) + q ( x 2 ) Independent
Land 10 00739 i005 q ( x 1 x 2 ) > q ( x 1 ) + q ( x 2 ) Enhance, nonlinear
Note: ‘uni-’ refers to unifactorial nonlinear and ‘bi-’ means bifactorial nonlinear.
Table 4. Result of interaction detector for landscape ecological risk.
Population DensityPEPEAltitudeAISPLITPDDIVISION
PEPE0.829
Altitude0.8390.669
AI0.8870.6260.756
SPLIT0.9140.6710.7770.92
PD0.9080.6610.7640.4840.423
DIVISION0.9140.6650.7670.6880.6130.609
NDVI0.8900.6950.6500.7440.7730.7510.764
Note: Number with “_” presents nonlinear enhancement, and the others were bi-factor enhancement.
Publisher’s Note: MDPI stays neutral with regard to jurisdictional claims in published maps and institutional affiliations.

