1. Introduction
As long as biomass is produced sustainably and its conversion is efficient, bioenergy can significantly contribute to the mitigation of greenhouse gas (GHG) emissions [
1]. Bioenergy is still the main source of renewable energy and is the only one that can directly contribute to the supply of biofuels and electricity, potentially with negative GHG emissions as long as carbon capture, utilisation, and storage (CCUS) technologies are applied to bioenergy systems. In the IEA (International Energy Agency) scenario, which corresponds to maintaining the Earth’s temperature, so as not to exceed 1.5 °C in this century, the demand for primary bioenergy is expected to increase from the current 60 EJ to 125 EJ in 2070 [
2]. In 2011, when a special report of the IPCC (International Panel on Climate Change) was published, it was estimated based on a review of the scientific literature that the deployment levels of biomass for energy by 2050 could be in the range of 100 to 300 EJ.year
−1 [
1]. The same subject has been recently addressed by [
3], indicating that biomass could also provide between 70 and 360 EJ.year
−1 by 2050.
A crucial aspect of expected large-scale bioenergy production is related to land availability and the potential deleterious impacts related to land-use change [
4]. For more than a decade, much has been published concerning the possible negative impacts on food supply [
5,
6], induced land-use change [
7,
8], the relation to the direct impacts on biodiversity [
8,
9] and water resources [
10], the loss of soil nutrients [
11], the impacts on soil erosion [
12], and issues related to land rights and social conflicts [
13,
14], etc. A comprehensive report on how bioenergy can be deployed on a large scale, including a detailed analysis of different aspects of sustainability, is presented in [
15].
It is estimated that in 2018, aviation contributed 2.4% of global CO
2 emissions, while the overall GHG contribution is even higher due to induced aircraft contrails and other emissions [
16]. Prior to COVID-19, the ICAO [
17] (International Civil Aviation Organization) estimated that, by 2045, fuel consumption by the international civil aviation could be 2.2 to 3.1 times higher than that in 2015, depending on the scenarios. In this sense, the civil aviation sector has set ambitious targets for reducing its GHG emissions up to the middle of this century. Both the ICAO and IATA (International Air Transport Association) mention that GHG emissions must be reduced by 50% in 2050, considering the estimated emissions of 2005 [
17,
18].
One of the options for reducing GHG emissions is the use of fuels with a lower carbon footprint, partially displacing conventional petroleum-based JET A-1 fuel. These alternative fuels will be classified as Sustainable Aviation Fuels (SAF) if they meet the supply chain sustainability criteria, defined by the ICAO CORSIA (Carbon Offsetting and Reduction Scheme for International Aviation) [
19] (see also
Section 2.2).
This paper presents an assessment of the appropriate conditions for the sustainable production of biofuels (SAF) in Brazil. It is based on a geospatial database (SAFmaps) that was built in the context of a project, with the aim of providing information to stakeholders who would be interested in the production of SAF. Two good examples of public database on biomass are that provided by CIEMAT (Centro de Investigaciones Energéticas, Medioambientales y Tecnológicas) [
20], in the European context, and that of NREL (National Renewable Energy Laboratory) [
21,
22], with information for the USA. SAFmaps is a publicly available database (accessed at
www.safmaps.com, 25 June 2021) and provides information on eight feedstocks (six crop-based), four of which (eucalyptus, soy, sugar cane, and corn) are covered here.
The paper is organised in six sections, including this introduction. The following section provides background information about the database and what is required for the recognition of bio-jet fuels to become sustainable.
Section 3 describes the rationale of selecting areas for assessing the potential of biomass production, while
Section 4 describes the procedures for the assessment of the four feedstocks reported here. The fifth section describes the results and also presents the related discussion. Then, conclusions are presented in
Section 6.
3. Rationale for Identifying Target Regions
This section describes the general procedure for identifying the regions where the production of biomass would be adequate. At this point, specific conditions for producing feedstocks (e.g., required climatic parameters) were not taken into account; the procedure for classifying areas according to the suitability for specific crops is presented in the following section. This section also helps to justify the focus on the 12 previously mentioned Brazilian states.
Figure 2 illustrates the explored concept, aiming to define areas that would be focused to assess the viability of biomass production for the production of SAF. It is sub-divided in five figures, identified from A to E.
Figure 2A shows the distribution of land suitable for agriculture (and silviculture), according to the classification adopted for soil suitability. Only one soil suitability classification was used for all biomasses covered in SAFmaps, and it is based on the literature [
24,
25].
After imposing restrictions,
Figure 2B indicates the remaining areas available for cultivation. The imposed restrictions include (1) legally protected areas (e.g., conservation units, indigenous reserves, and areas that belong to Afro-Brazilian people), (2) sensitive biomes (here, both Pantanal and Amazon were fully excluded), and (3) areas that are not in line with principle 2 of CORSIA’s sustainability criteria. For the later point, this was carried out in a conservative way, also excluding areas covered by grasslands, besides those listed in principle 2; a map of land use and land cover by the end of 2007 was used for this purpose [
26]. It was also assumed that the production of self-dedicated biomass for SAF would only displace pastures (again, a land-use and land-cover map for 2018 was used [
26]).
The following
Figure 2C shows the results after the exclusion of areas with slopes higher than 13%, taking into account the aim of full mechanisation and, in addition, areas where land would be expensive for commercial agricultural production. The threshold of 13% was conservatively assumed as, for eucalyptus, for instance, it would be possible to harvest in areas with a higher slope; this aspect is specifically covered in the following section. As for land prices, the data set, available at SAFmaps, is for average prices on a municipal basis, by category of land use (e.g., for pastures) (see
Supplementary Material). This restriction means the exclusion of all pastures in municipalities where average prices are higher. In practice, this assumption, and the threshold, imply a larger impact in assessing the areas that are suitable in the South (mainly in the State of Paraná) and South–ast (mainly in the State of São Paulo) regions.
Considering the aim of producing SAF, it would be important to minimise the carbon footprint in transporting feedstocks and SAF, and, in this sense,
Figure 2D combines the areas available for biomass production with the existing and planned infrastructure (e.g., railroads, pipelines, some oil refineries, and main international airports). The last image (2E) shows, as an illustration, the location of possible new producing sites of eucalyptus, soybean, sugarcane, and corn considered in the case studies performed in this work.
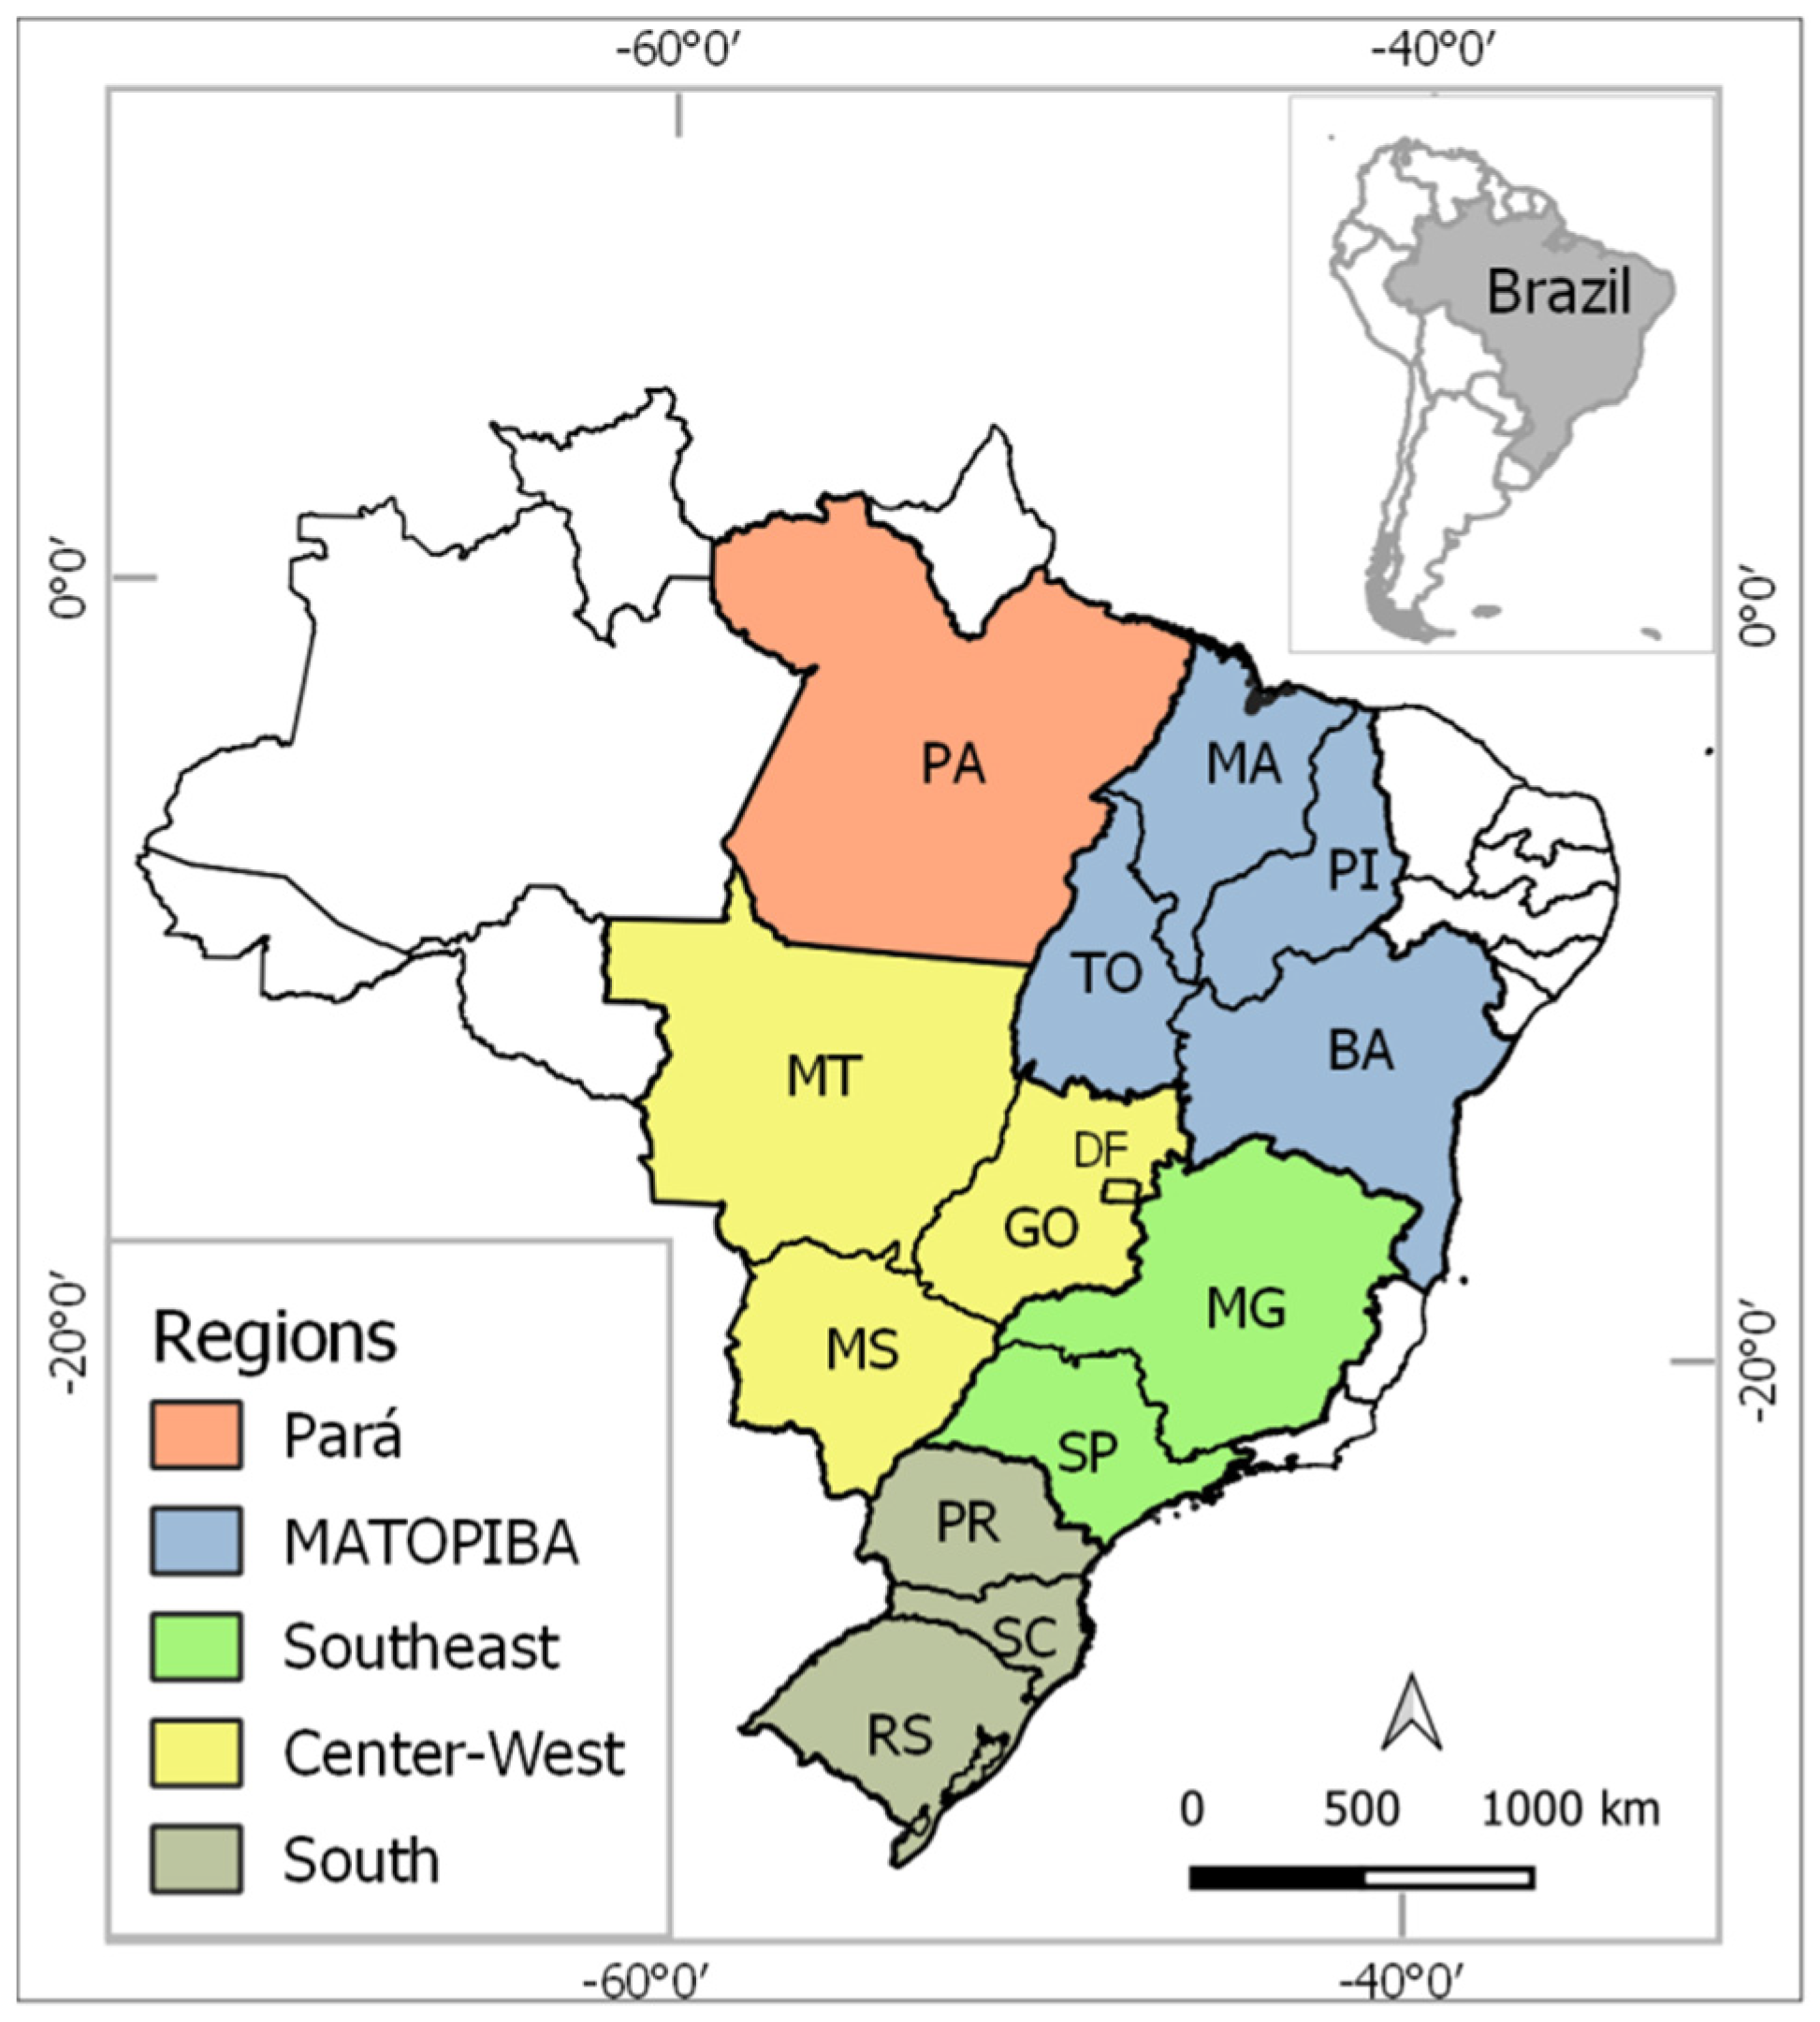
Based on these considerations, a numerical exercise was carried out for the 12 previously mentioned states (classified in four regions), and also for Pará.
Table 1 presents a synthesis of results of the geoprocessing procedure used. Considering the assumption that new crops could only displace pastures, less than 30% of the total area in the 12 states would be eligible for dedicated biomass production, and, in the case of Pará, this share is even lower (16.6%). This aspect, related with legally protected areas, would imply the exclusion of more than 55% of the total area of Pará, but this figure is less than 13% in the set of 12 states. The reason is that Pará has many areas defined as conservation units and indigenous reserves (see
Supplementary Material). As for the exclusion of non-anthropized areas by the end of 2007, in an attempt to comply with principle 2 of the CORSIA’s sustainability criteria, the area that would not be eligible for biomass production in Pará is very large (almost 79% of the total area) due to the large cover by forests. In the results presented in
Table 1, there is an overlap at a certain extent between legally protected areas and areas that must be excluded due to CORSIA’s restrictions. In the case of the set of 12 states, areas that should be excluded due to CORSIA’s restrictions include the whole Pantanal and the non-anthropized Cerrado (by the end of 2007). In summary, the consequence is that the remaining area that would be available for the dedicated production of biomass, for SAF, would be proportionally small in the case of Pará.
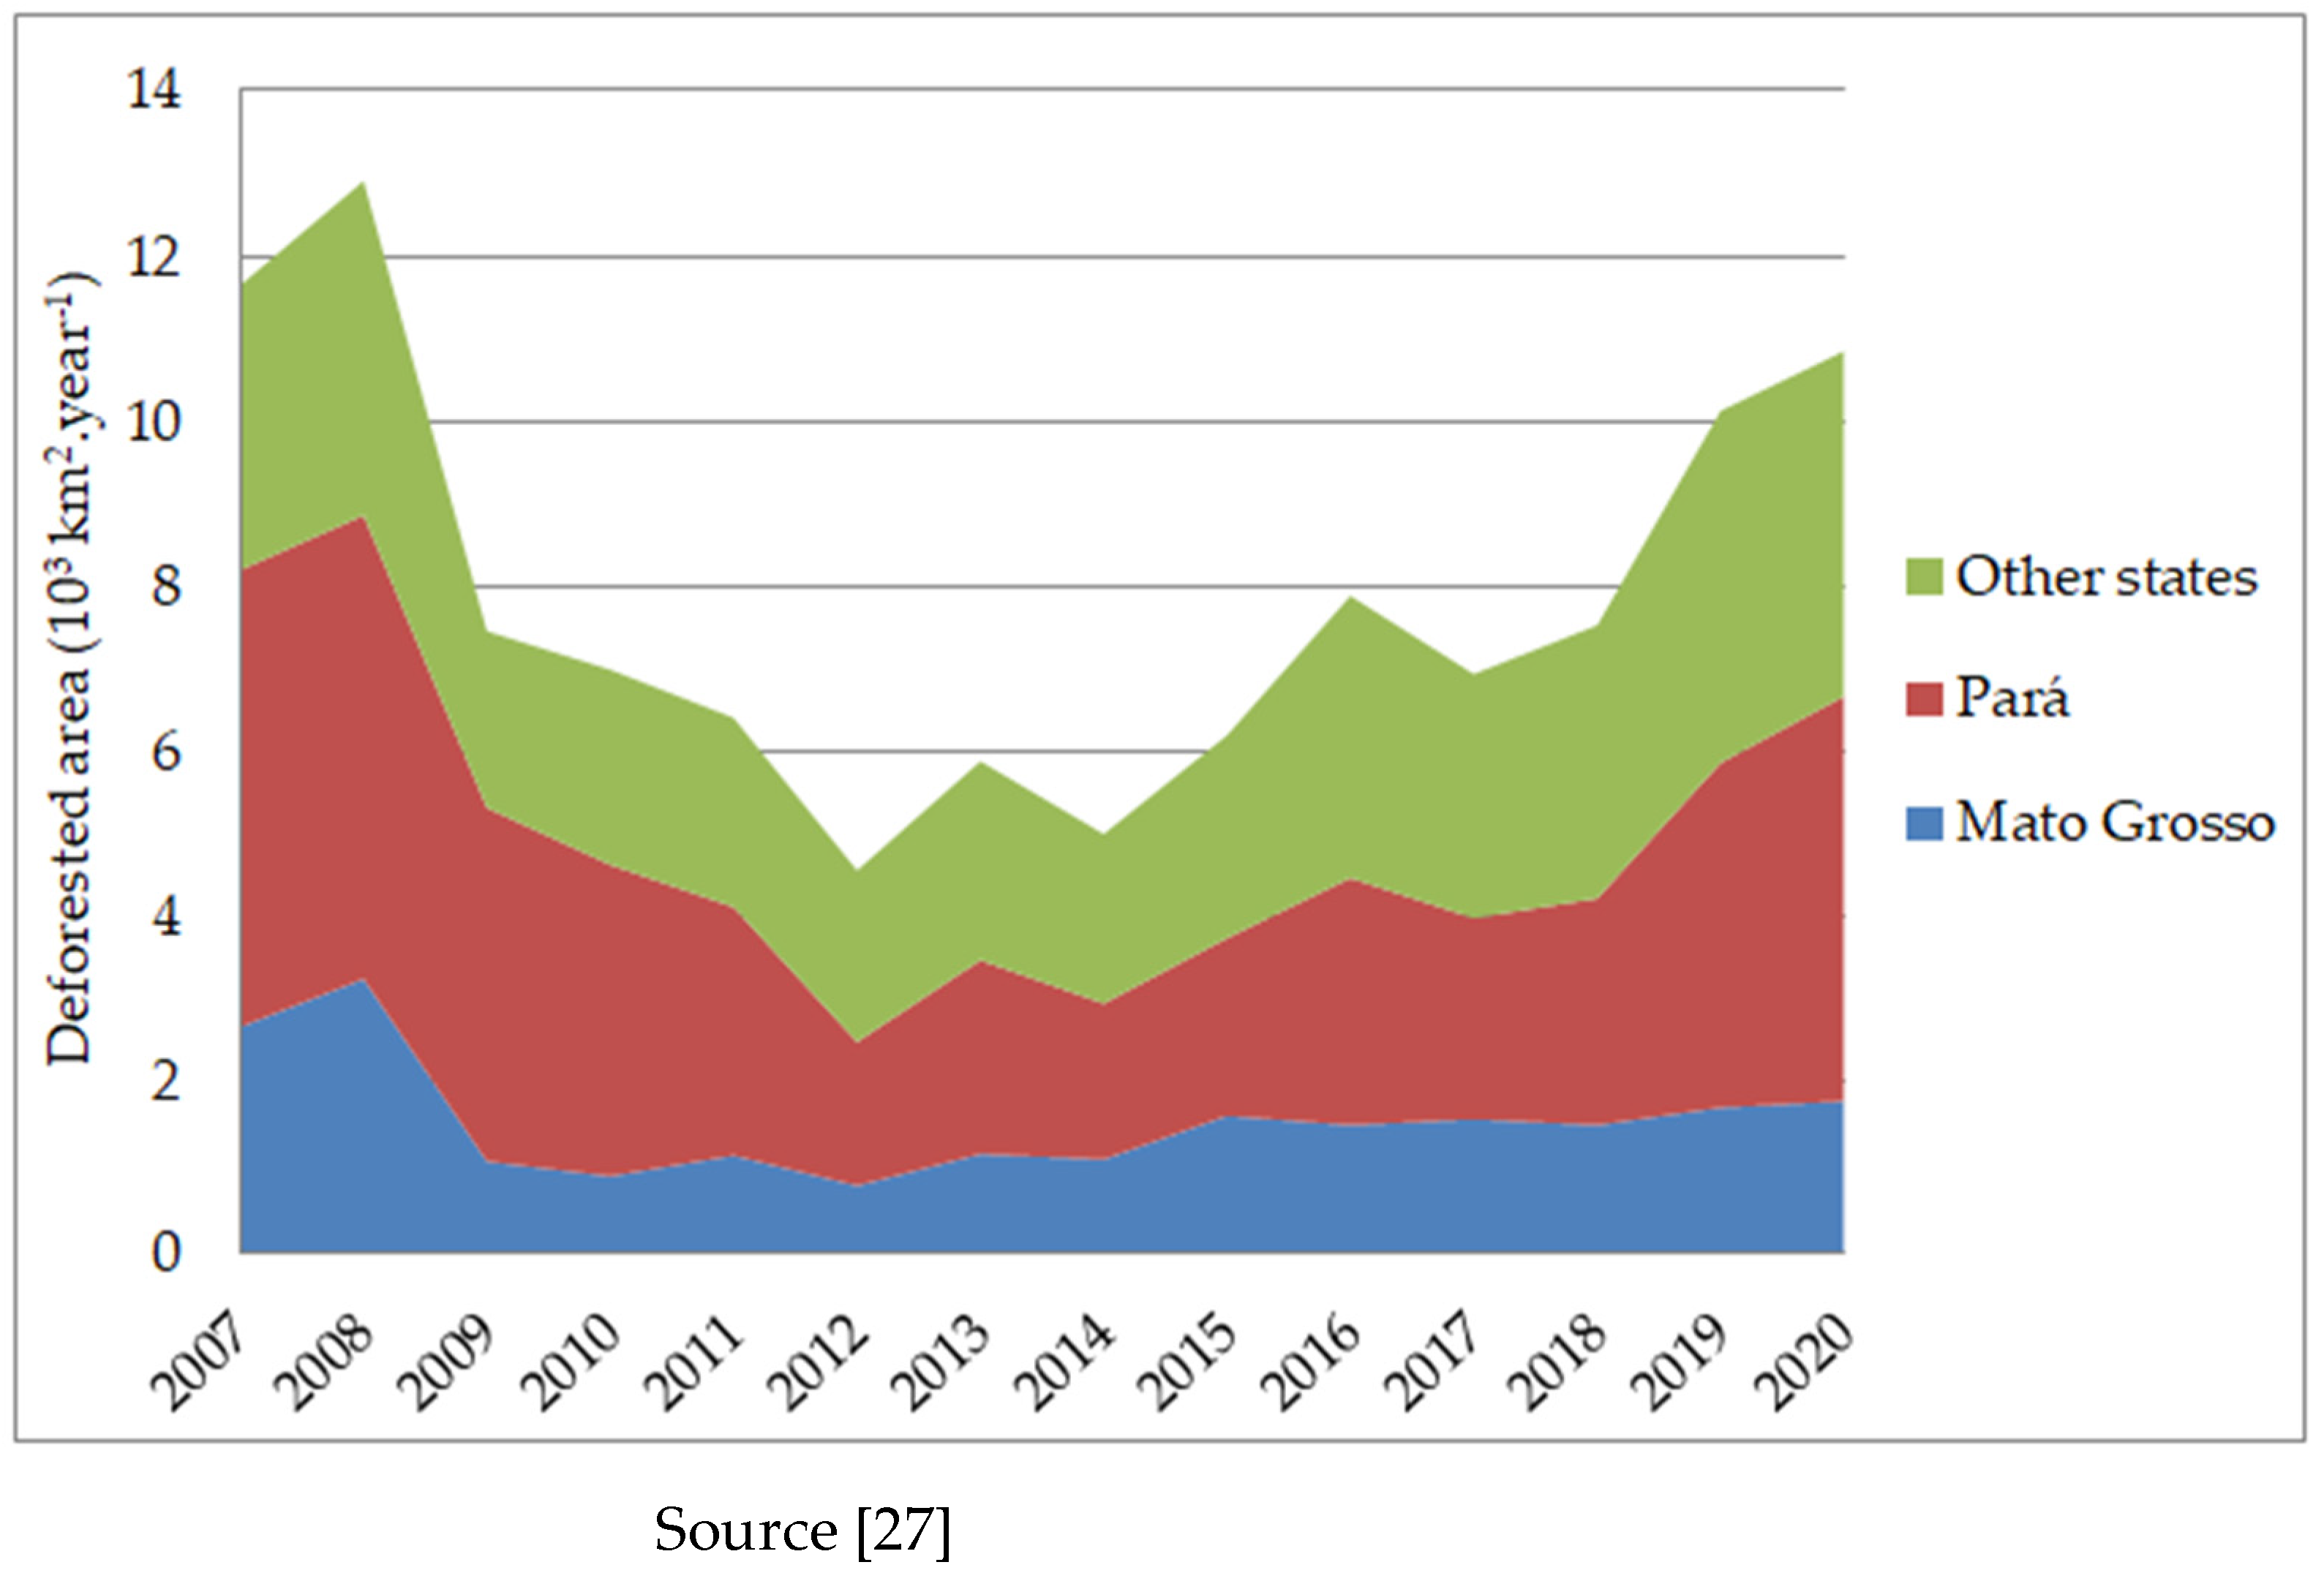
In addition to the points mentioned above, other aspects that justify the exclusion of Pará in the exercise for estimating biomass production for SAF are, first, the distance from the most important industrial centres, and the lack of adequate infrastructure for transport and, second, the historically high level of deforestation in Pará, as can be seen in
Figure 3.
Pará is completely within the Amazon biome. Based on satellite images, the monitoring of deforestation in the Amazon indicates that, since 2008, 43% of deforestation (42 out 99 × 10
3 km
2) was in Pará [
27]. As can be seen in
Figure 3, deforestation in Pará has grown in recent years, as in the entire Amazon region, and the results are even worse for 2019–2020. Moreover, in Pará there are, proportionally, a large number of reported violations of land use rights (see
Supplementary Material) and, historically, in Brazil, land tenure conflicts have been closely related with deforestation [
28,
29]. In total, as the aim of the assessment presented here is the production of SAF, consideration of the production of feedstocks in Pará seems to be unjustified, except in the case of palm oil (not addressed here).
For the four regions considered, which include the 12 previously mentioned states, the estimated areas available for self-dedicated biomass production, for SAF, are presented in
Table 2. It can be seen that the estimated suitable area is very small in the South region and is reasonably large in Southeast (more in Minas Gerais than in São Paulo) and Centre–West regions (mainly in states of Goiás and Mato Grosso do Sul). In the MATOPIBA region, the extension of suitable areas is not proportionally large, and they are mainly in the state of Bahia and, to a lesser extent, in Tocantins.
4. Assumptions of the Case Studies
4.1. Common and Specific Assumptions
The case studies presented in this paper are related to the production of eucalyptus, soybean, sugarcane, and corn, which could be feedstocks for SAF production in Brazil. Here, a feasibility assessment of SAF production was not carried out, as this aspect is covered in a forthcoming paper. The case studies presented in this paper were defined by the choice of representative locations for the production of feedstocks, with estimates of the amount that could be produced and their costs.
The boundary conditions of the case studies were defined either by some common or by other specific assumptions. First, SAF would take place at, or besides, oil refineries because the HEFA and ATJ routes require a regular supply of hydrogen. Moreover, in oil refineries, the infrastructure for storing fuels and to release jet fuel to international airports are available. Thus, it was assumed that SAF production could take place at Refinaria do Planalto (REPLAN), in Paulínia (SP), or at Refinaria Henrique Lage (REVAP), in São José dos Campos (SP), both in the State of São Paulo. Both oil refineries are close to international airports.
It is not feasible to transport eucalyptus by road over long distances, i.e., from the plantation to the SAF production site. In this sense, a premise is that the production sites would be close to the refinery, enabling road transport, or relatively distant, as long as the transport from the field to the refinery can be by railway.
In the case of soybean, SAF would be produced from its oil. The assumption is that soybean would be processed (i.e., the oil would be extracted) close to where cropping would occur, and oil would be transported by rail. Currently, not all oil extraction units are close to soybean fields, but it was assumed that transporting oil, eventually through long distances, would result in a lower carbon footprint than transporting the grain.
In another case, sugarcane and corn would be the feedstocks for producing ethanol in a new distillery, with corn being the complementary feedstock for enlarging the annual capacity factor in comparison to the case in which only sugarcane would be used. The production of sugarcane must be nearby the distillery, and it was assumed that corn would also be produced in the surroundings. Corn would be produced as a second crop, and in Brazil the complementary production of corn to soy is common. Once the ethanol is produced, it can be transported by rail or by a pipeline to the refineries.
4.2. Estimating Suitability, Yields, and Costs
Here, we describe the procedure to define appropriate areas for the production of the four feedstocks. The procedure takes into account estimates for the suitability for each crop, mainly based on local edaphoclimatic conditions, predicted yields, and expected production costs. Based on this procedure, potential production sites were defined. In all cases, rainfed cultivation was considered, and, as a consequence, the availability of water for irrigation is not a matter of concern. On the other hand, in all cases, rainfall is a crucial aspect for assessing suitability.
Table 3 summarises the assumptions and the main references for defining the suitability of each of the four crops, while
Table 4 presents similar information for yields, and
Table 5 is for production costs.
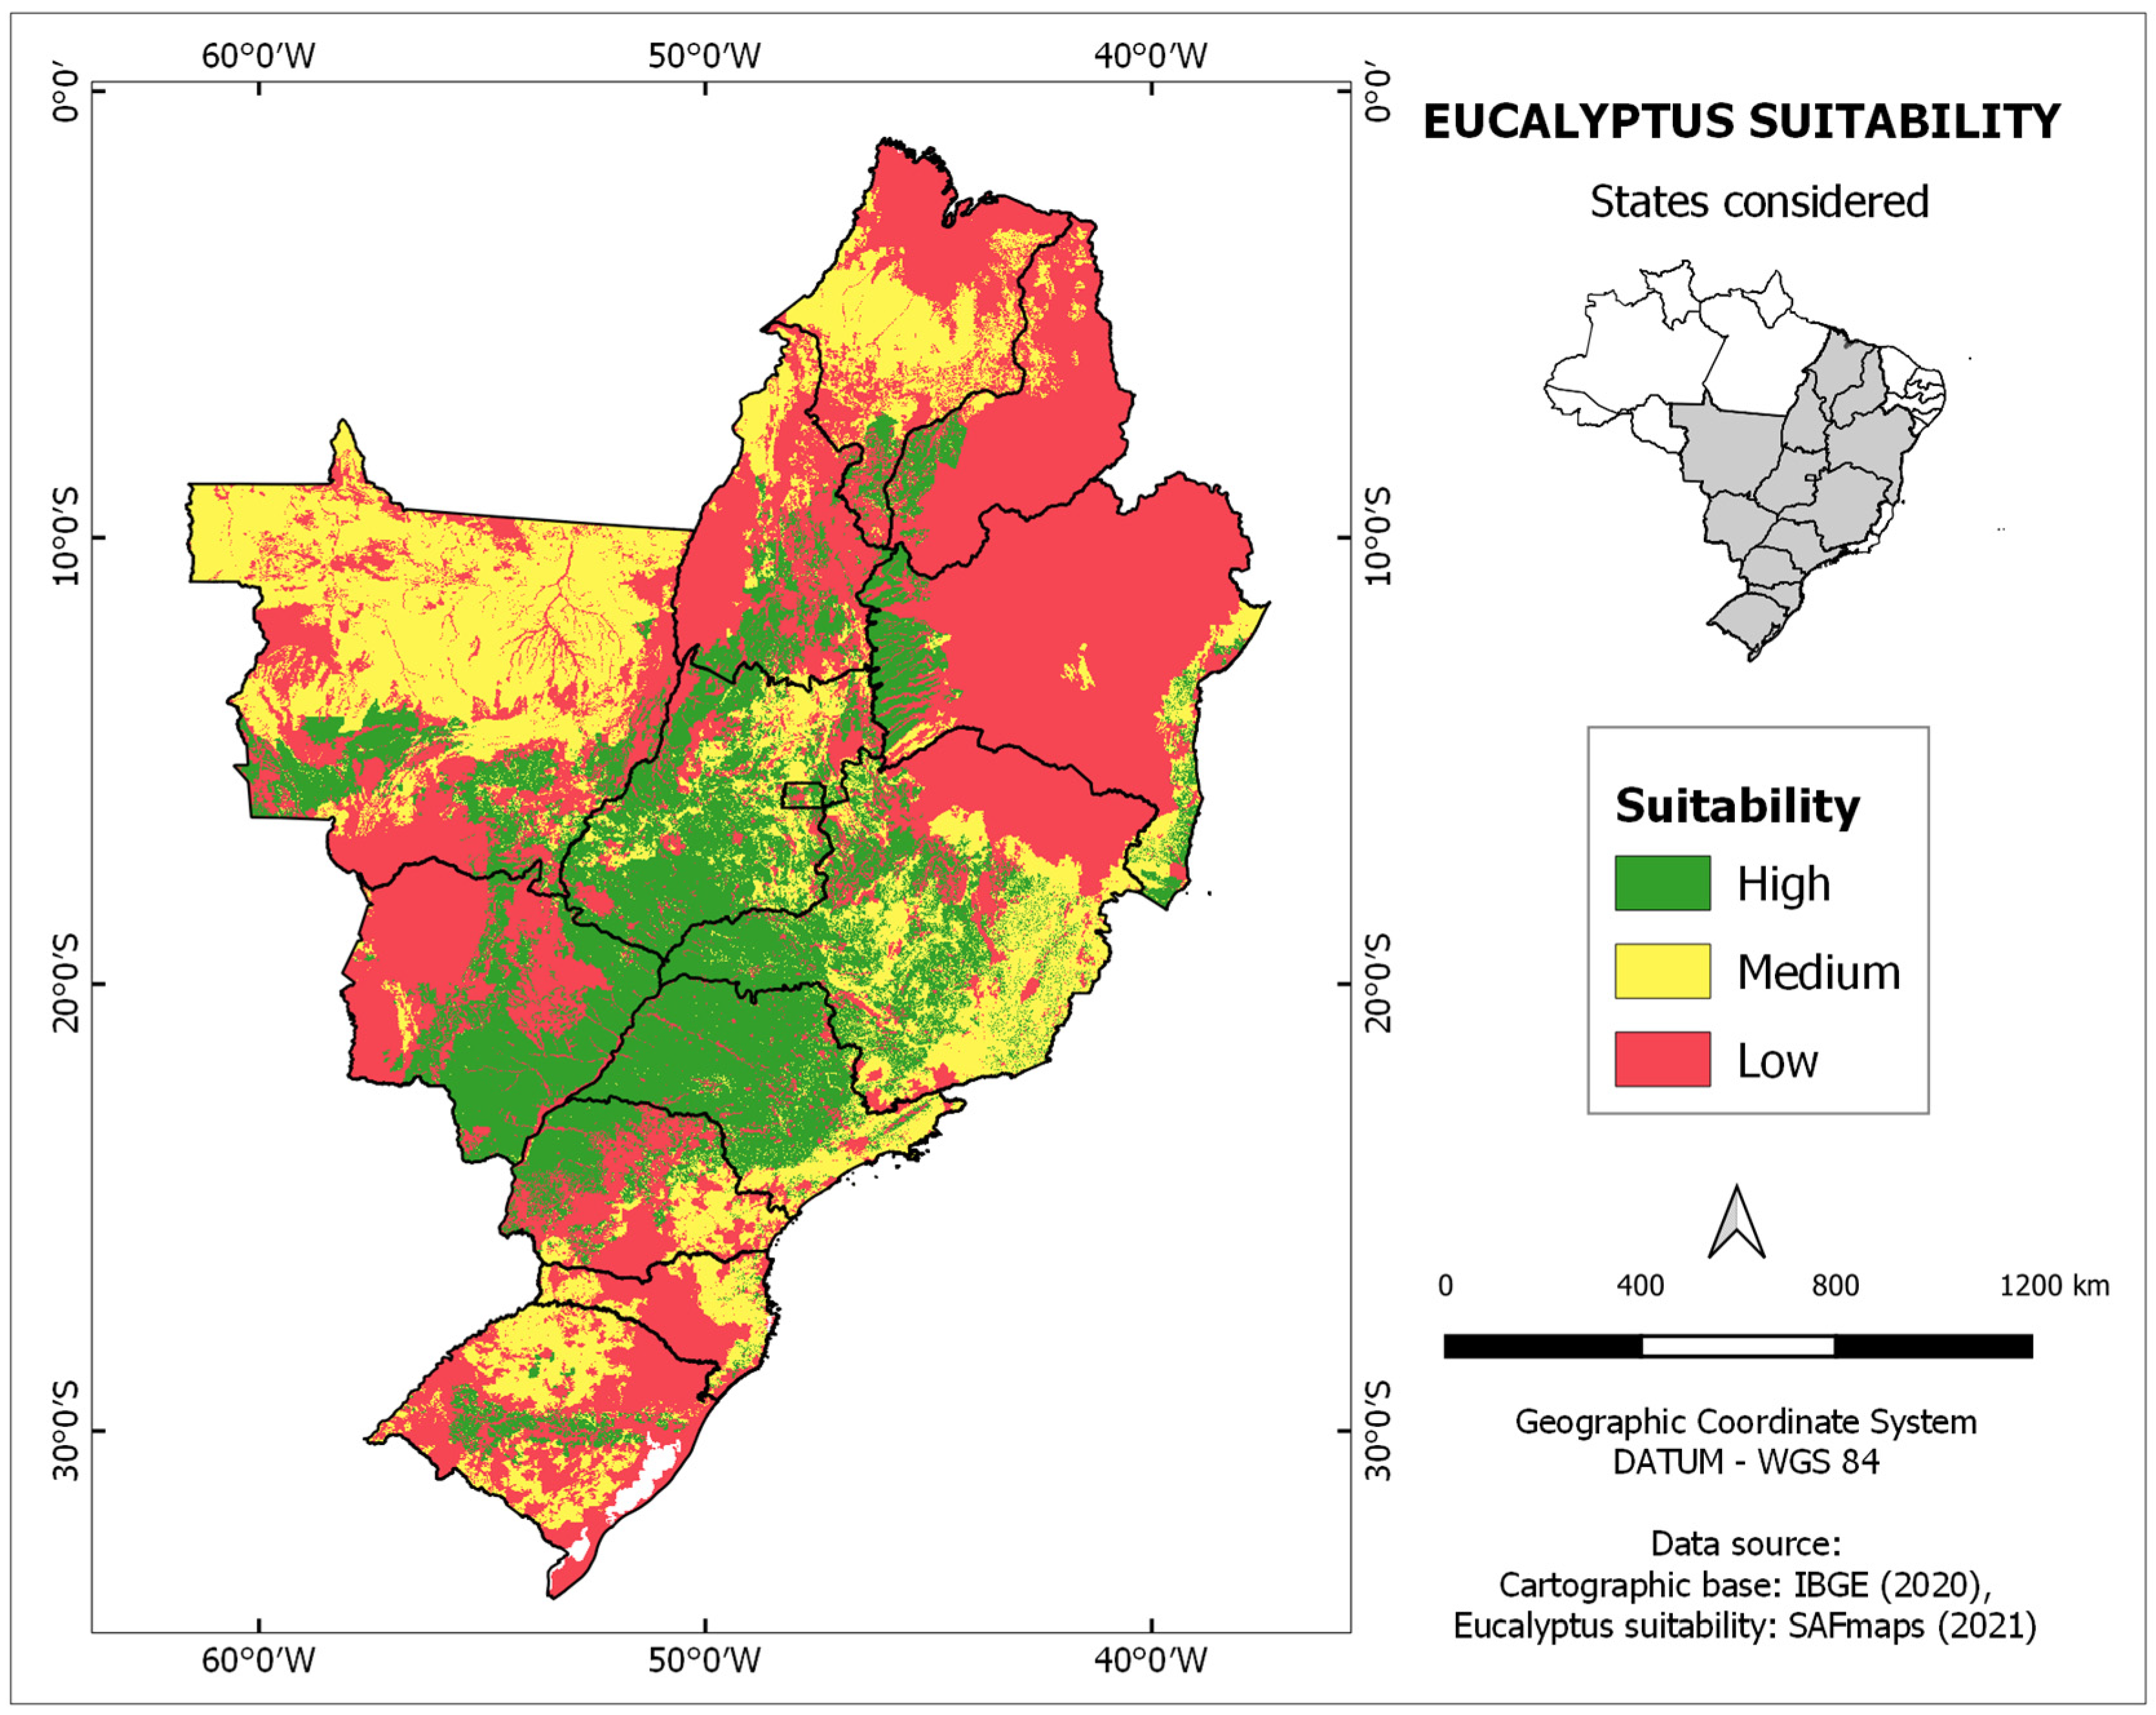
As an illustration,
Figure 4 shows the resulting suitability map for eucalyptus.
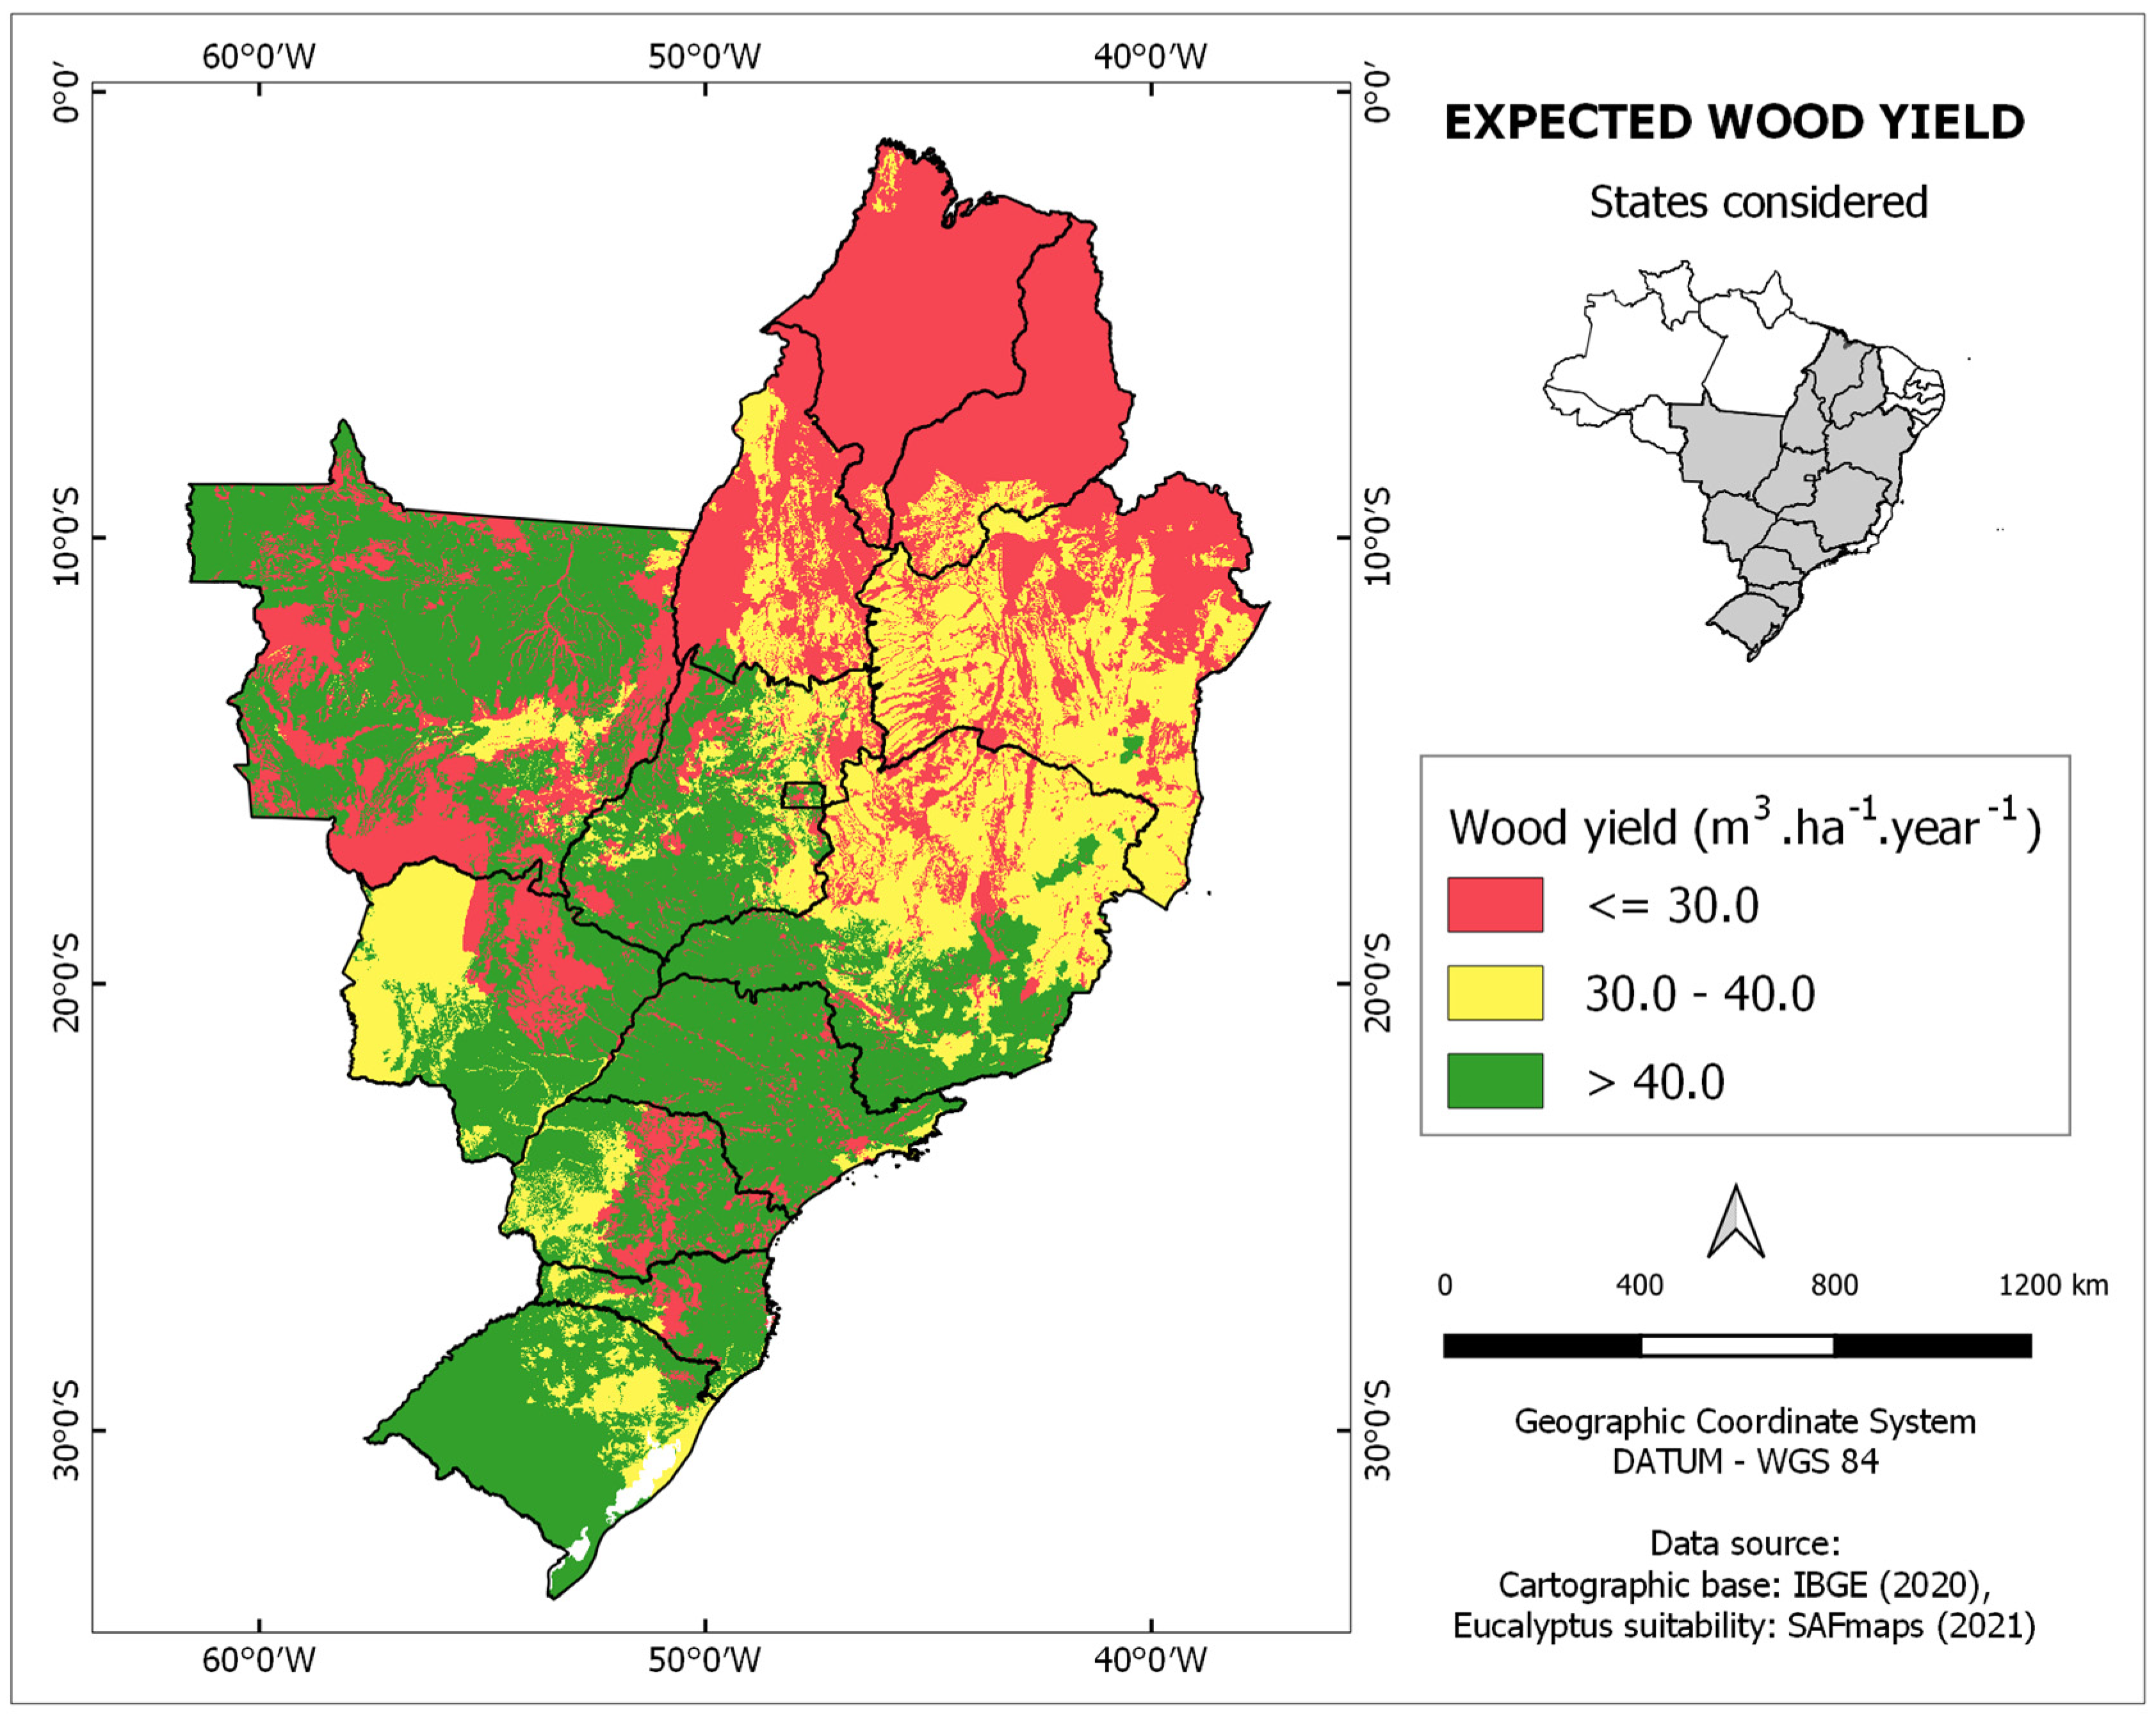
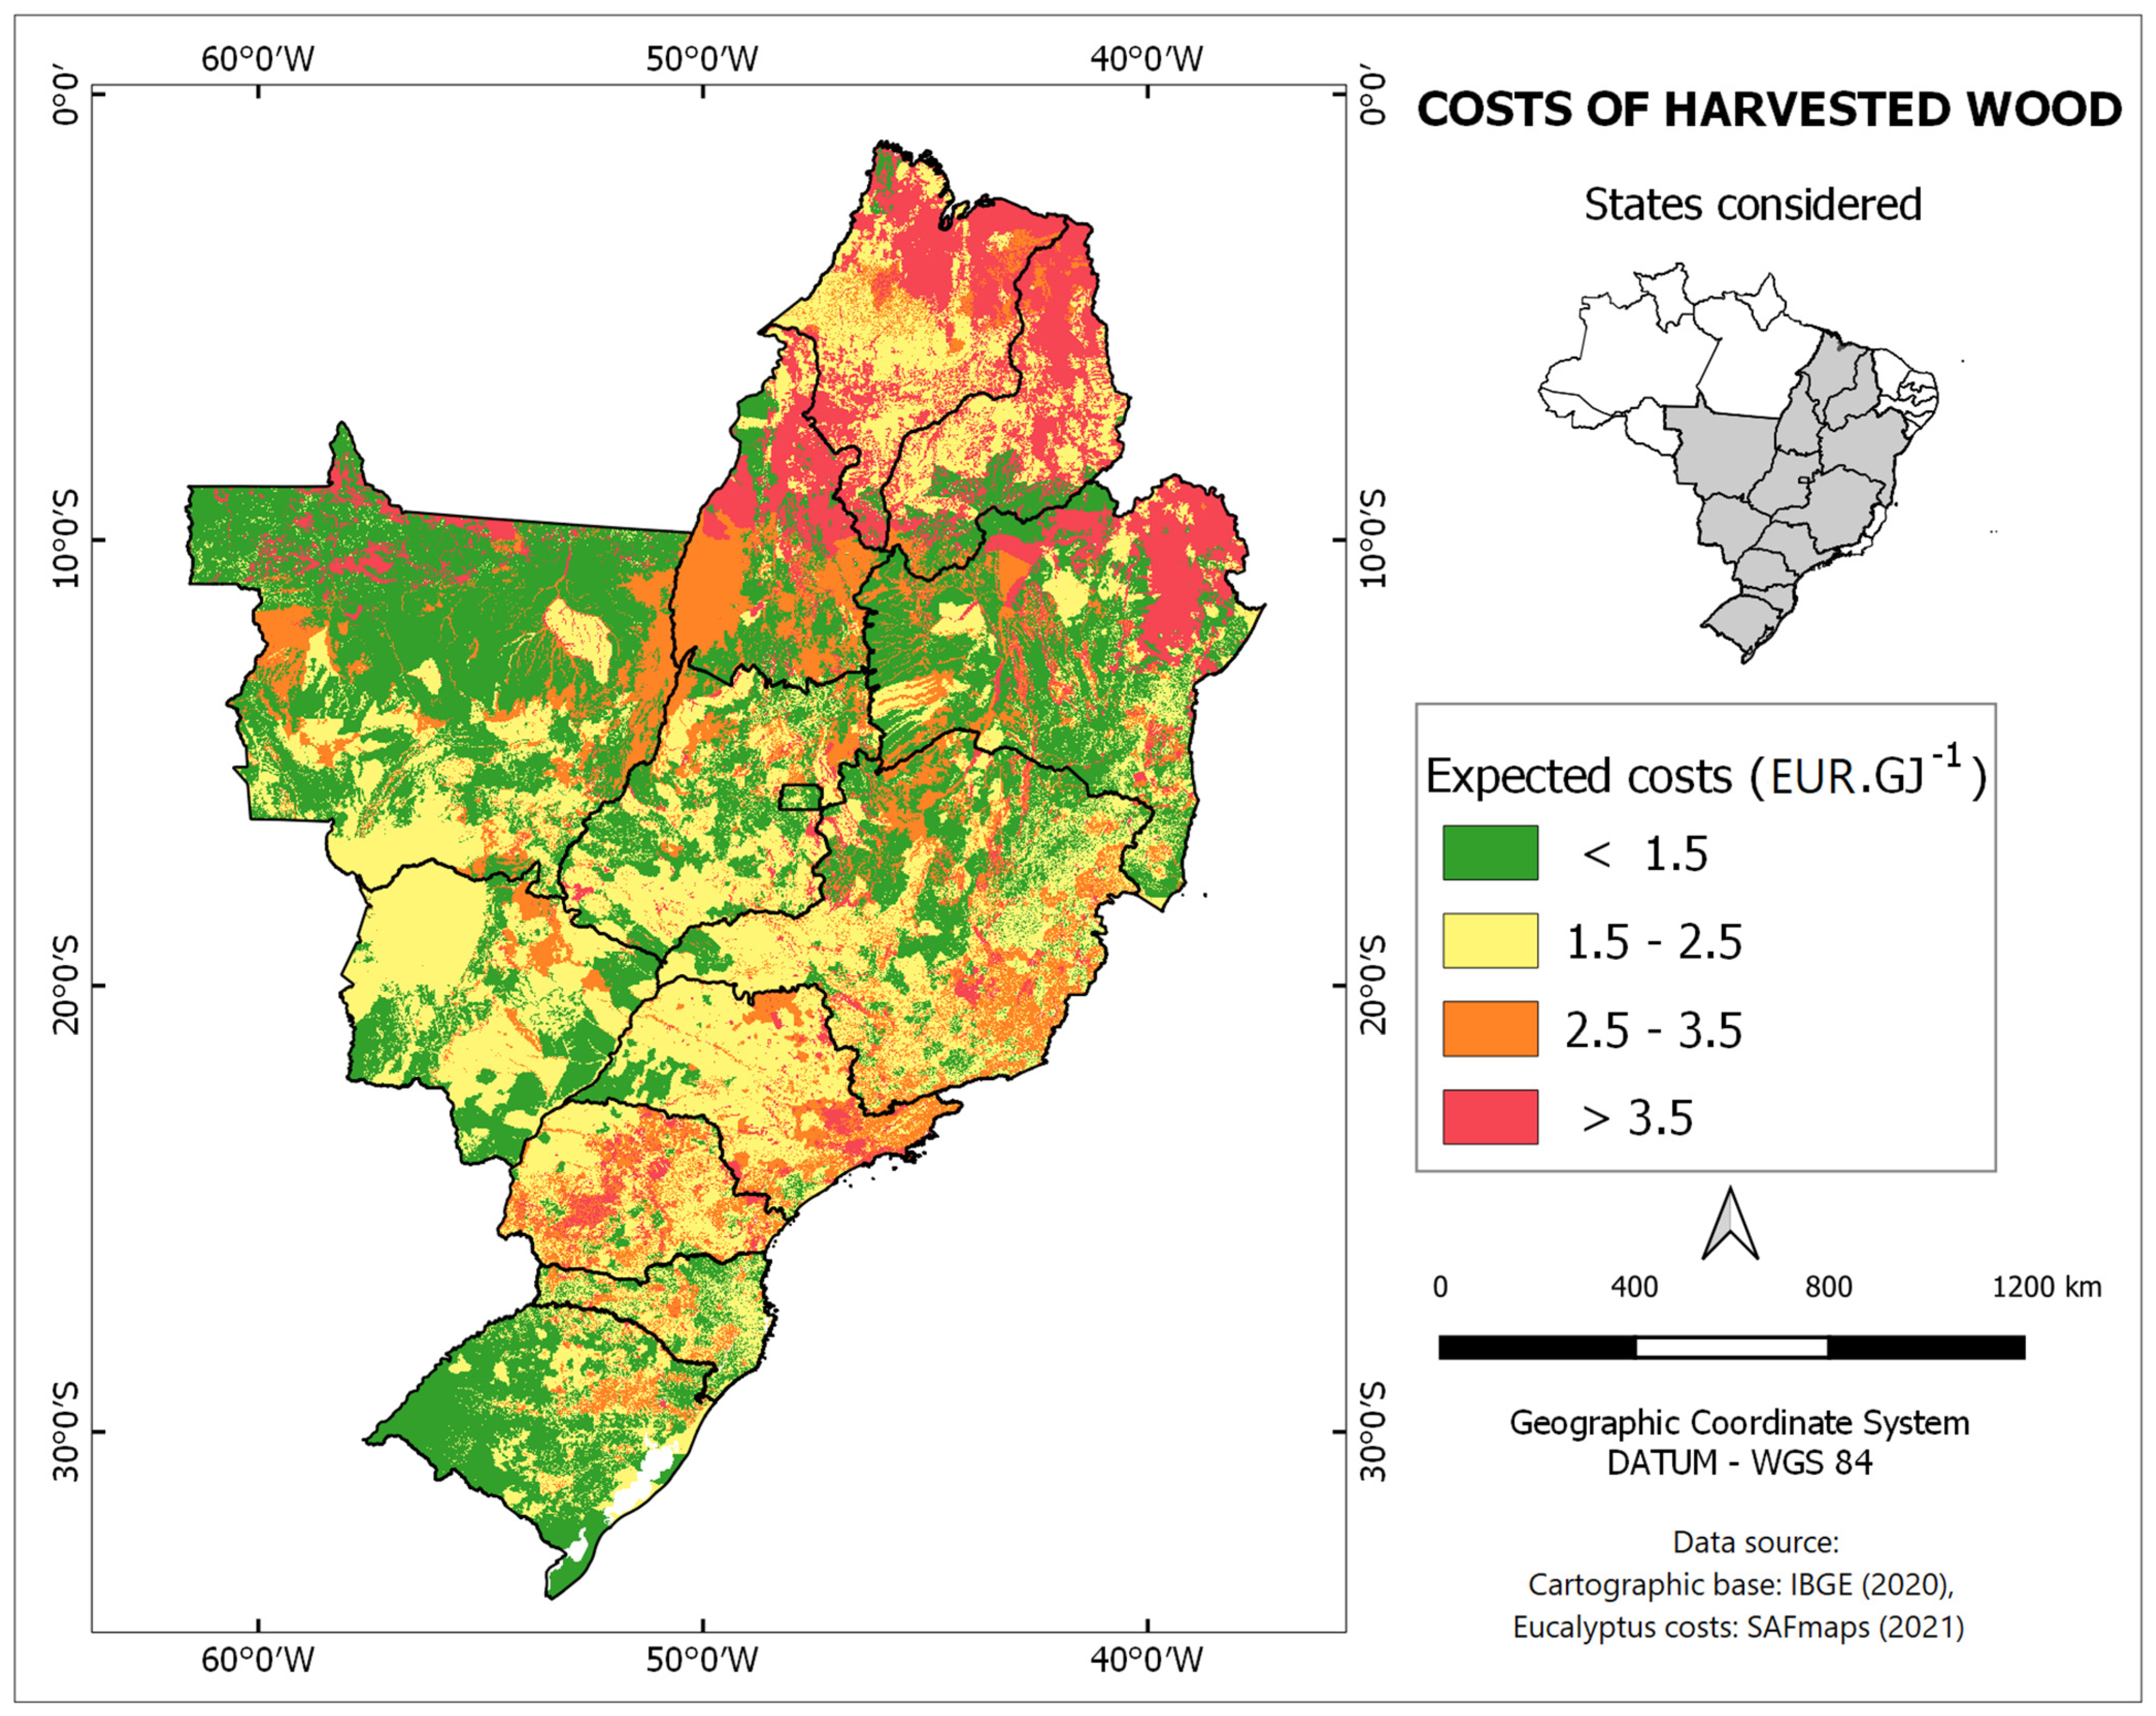
Figure 5 shows the map of expected yields of eucalyptus (estimated as average annual increments over a seven-year cycle), while
Figure 6 shows the map of expected wood costs in the field, after harvesting. Other maps are presented as
Supplementary Materials.
The costs were originally estimated in Reais (BRL) (2018) and converted to Euros, considering the average exchange rate that year (4.41 BRL/EUR).
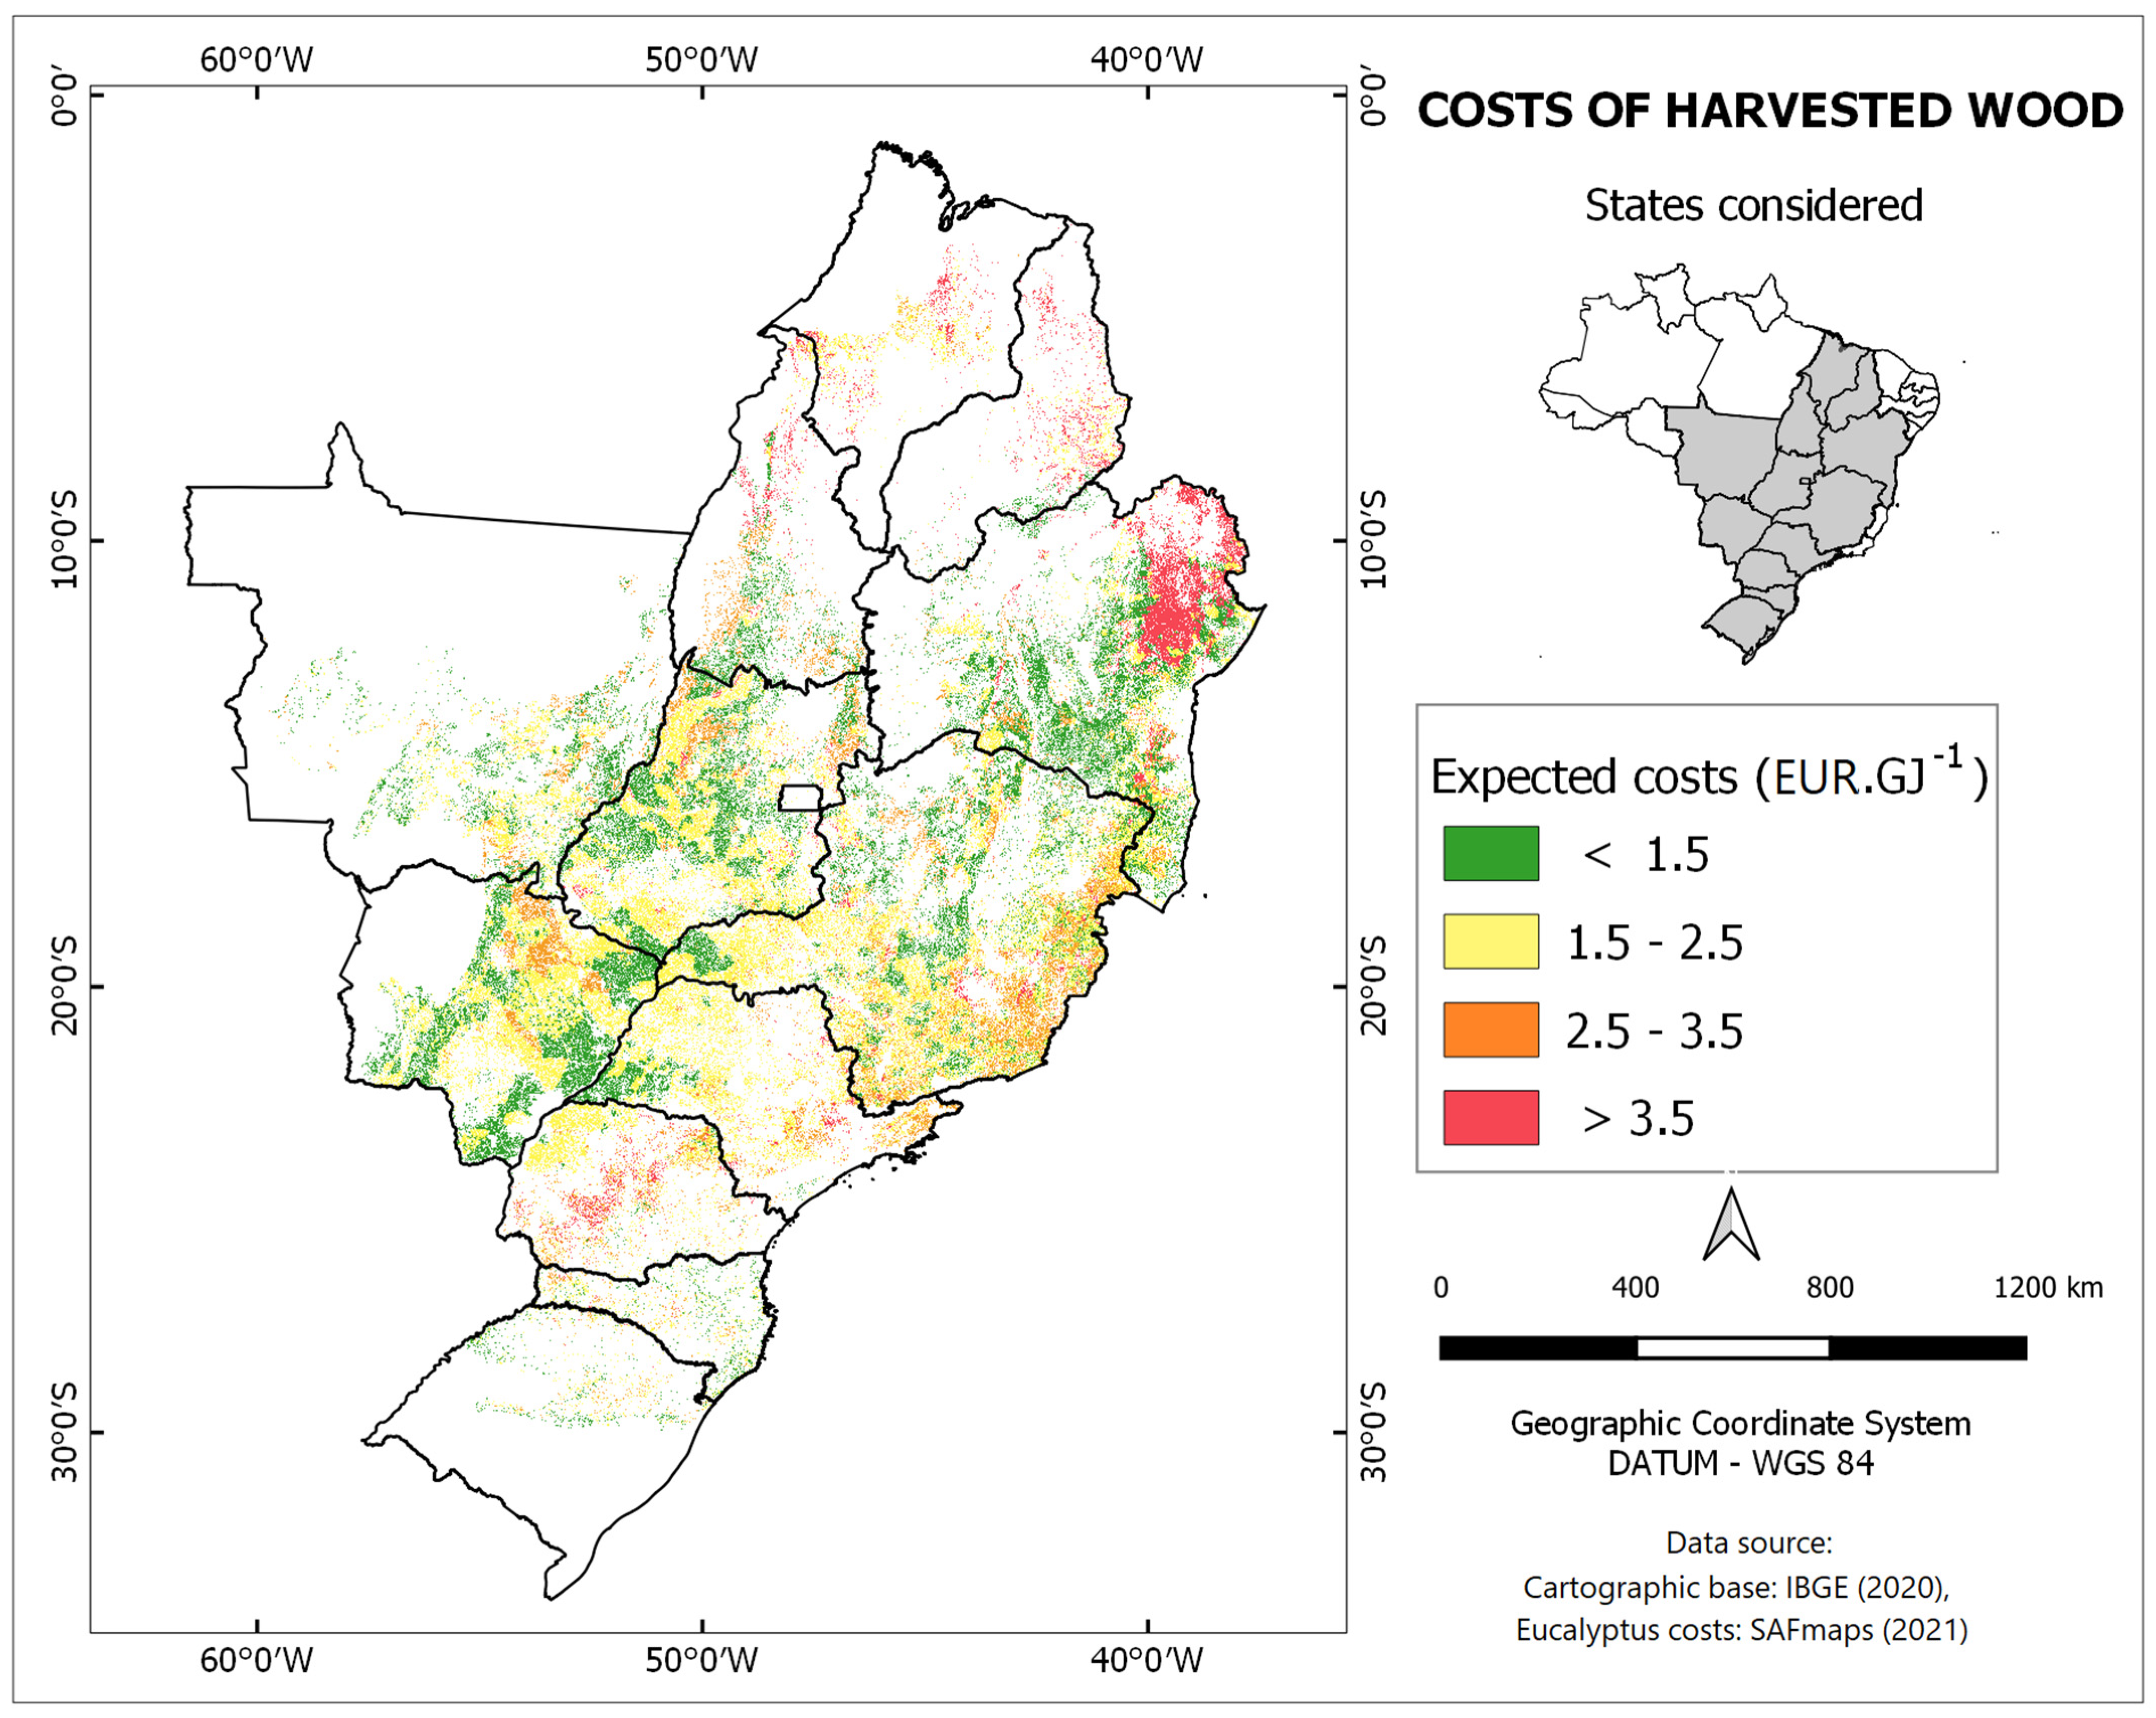
As mentioned in the previous section, mainly for environmental and legal reasons, some areas were excluded from the assessment. The exclusion of areas and the assumption that crops could only displace pastures leads to a simplification of the map of expected production costs. As an example,
Figure 7 shows the resulting map of the estimated cost for eucalyptus, after the exclusions, indicating only the areas where production would occur displacing pastures (as for 2018).
4.3. Chosen Production Sites
For all feedstocks, and for the sake of simplification, the production areas were defined as a circle around a reference point, which can be an important city in the region, or where the ethanol distillery would be located, or the site of an oil refinery. The radii of the circles were defined for each feedstock, and the information is presented below.
The obvious choice of production sites is the region where expected production costs would be relatively low, but it also makes sense to explore alternatives for which the production costs are moderate, but with proximity to, for example, railways and/or pipelines.
For eucalyptus, the two chosen production sites are the surroundings of REVAP, in São José dos Campos, in the east side of state of São Paulo (SP), and the surroundings of Espigão, in the west side of the same state. The rationale for the first site is that SAF production could be at REVAP and, in addition, because there is commercial eucalyptus production in that region; in this case, wood would be transported by trucks. The reason for the second site is that the region has a low expected eucalyptus production cost and because there is a nearby railway that allows for the transport of wood to one of the two oil refineries previously mentioned.
For soybean, the two chosen production sites are Paranaíba, in the southeast of Mato Grosso do Sul (MS), and Presidente Venceslau, in the west of São Paulo. Both regions have low estimated production costs and, in addition, it would be possible to transport soy oil by train to the two refineries. The choice of Paranaíba has an additional motivation since the region is also suitable for the production of other feedstocks, which raises the question of potential competition for land.
Finally, for sugarcane and corn, which are inputs for ethanol production, the options are Paranaíba (MS) and Caçu, in the south of Goiás (GO). The reasons for choosing Paranaíba are the same as presented above. In the case of Caçu, the motivation was to choose a location close to the pipeline that would allow for the transport of ethanol directly to oil refineries.
The radii of the influence circles were defined as 75 km for eucalyptus, 200 km for soybean, and 50 km for sugarcane and corn; aiming to simplify the analysis, it was assumed that sugarcane would be produced close to the centre of the circle and corn would be produced on its borders. In the case of eucalyptus production in SJ Campos, the oil refinery would be in the centre of the circle, and in the Espigão case, it is the shipping point to railway that would be in the centre. In the case of soybean, the grains would be transported to the extraction units, in the centre of the circle of influence, from where the oil would be transported. In the case of cane and corn, the ethanol distillery would be in the centre of the circle, and the distillery would be close to a terminal pipeline.
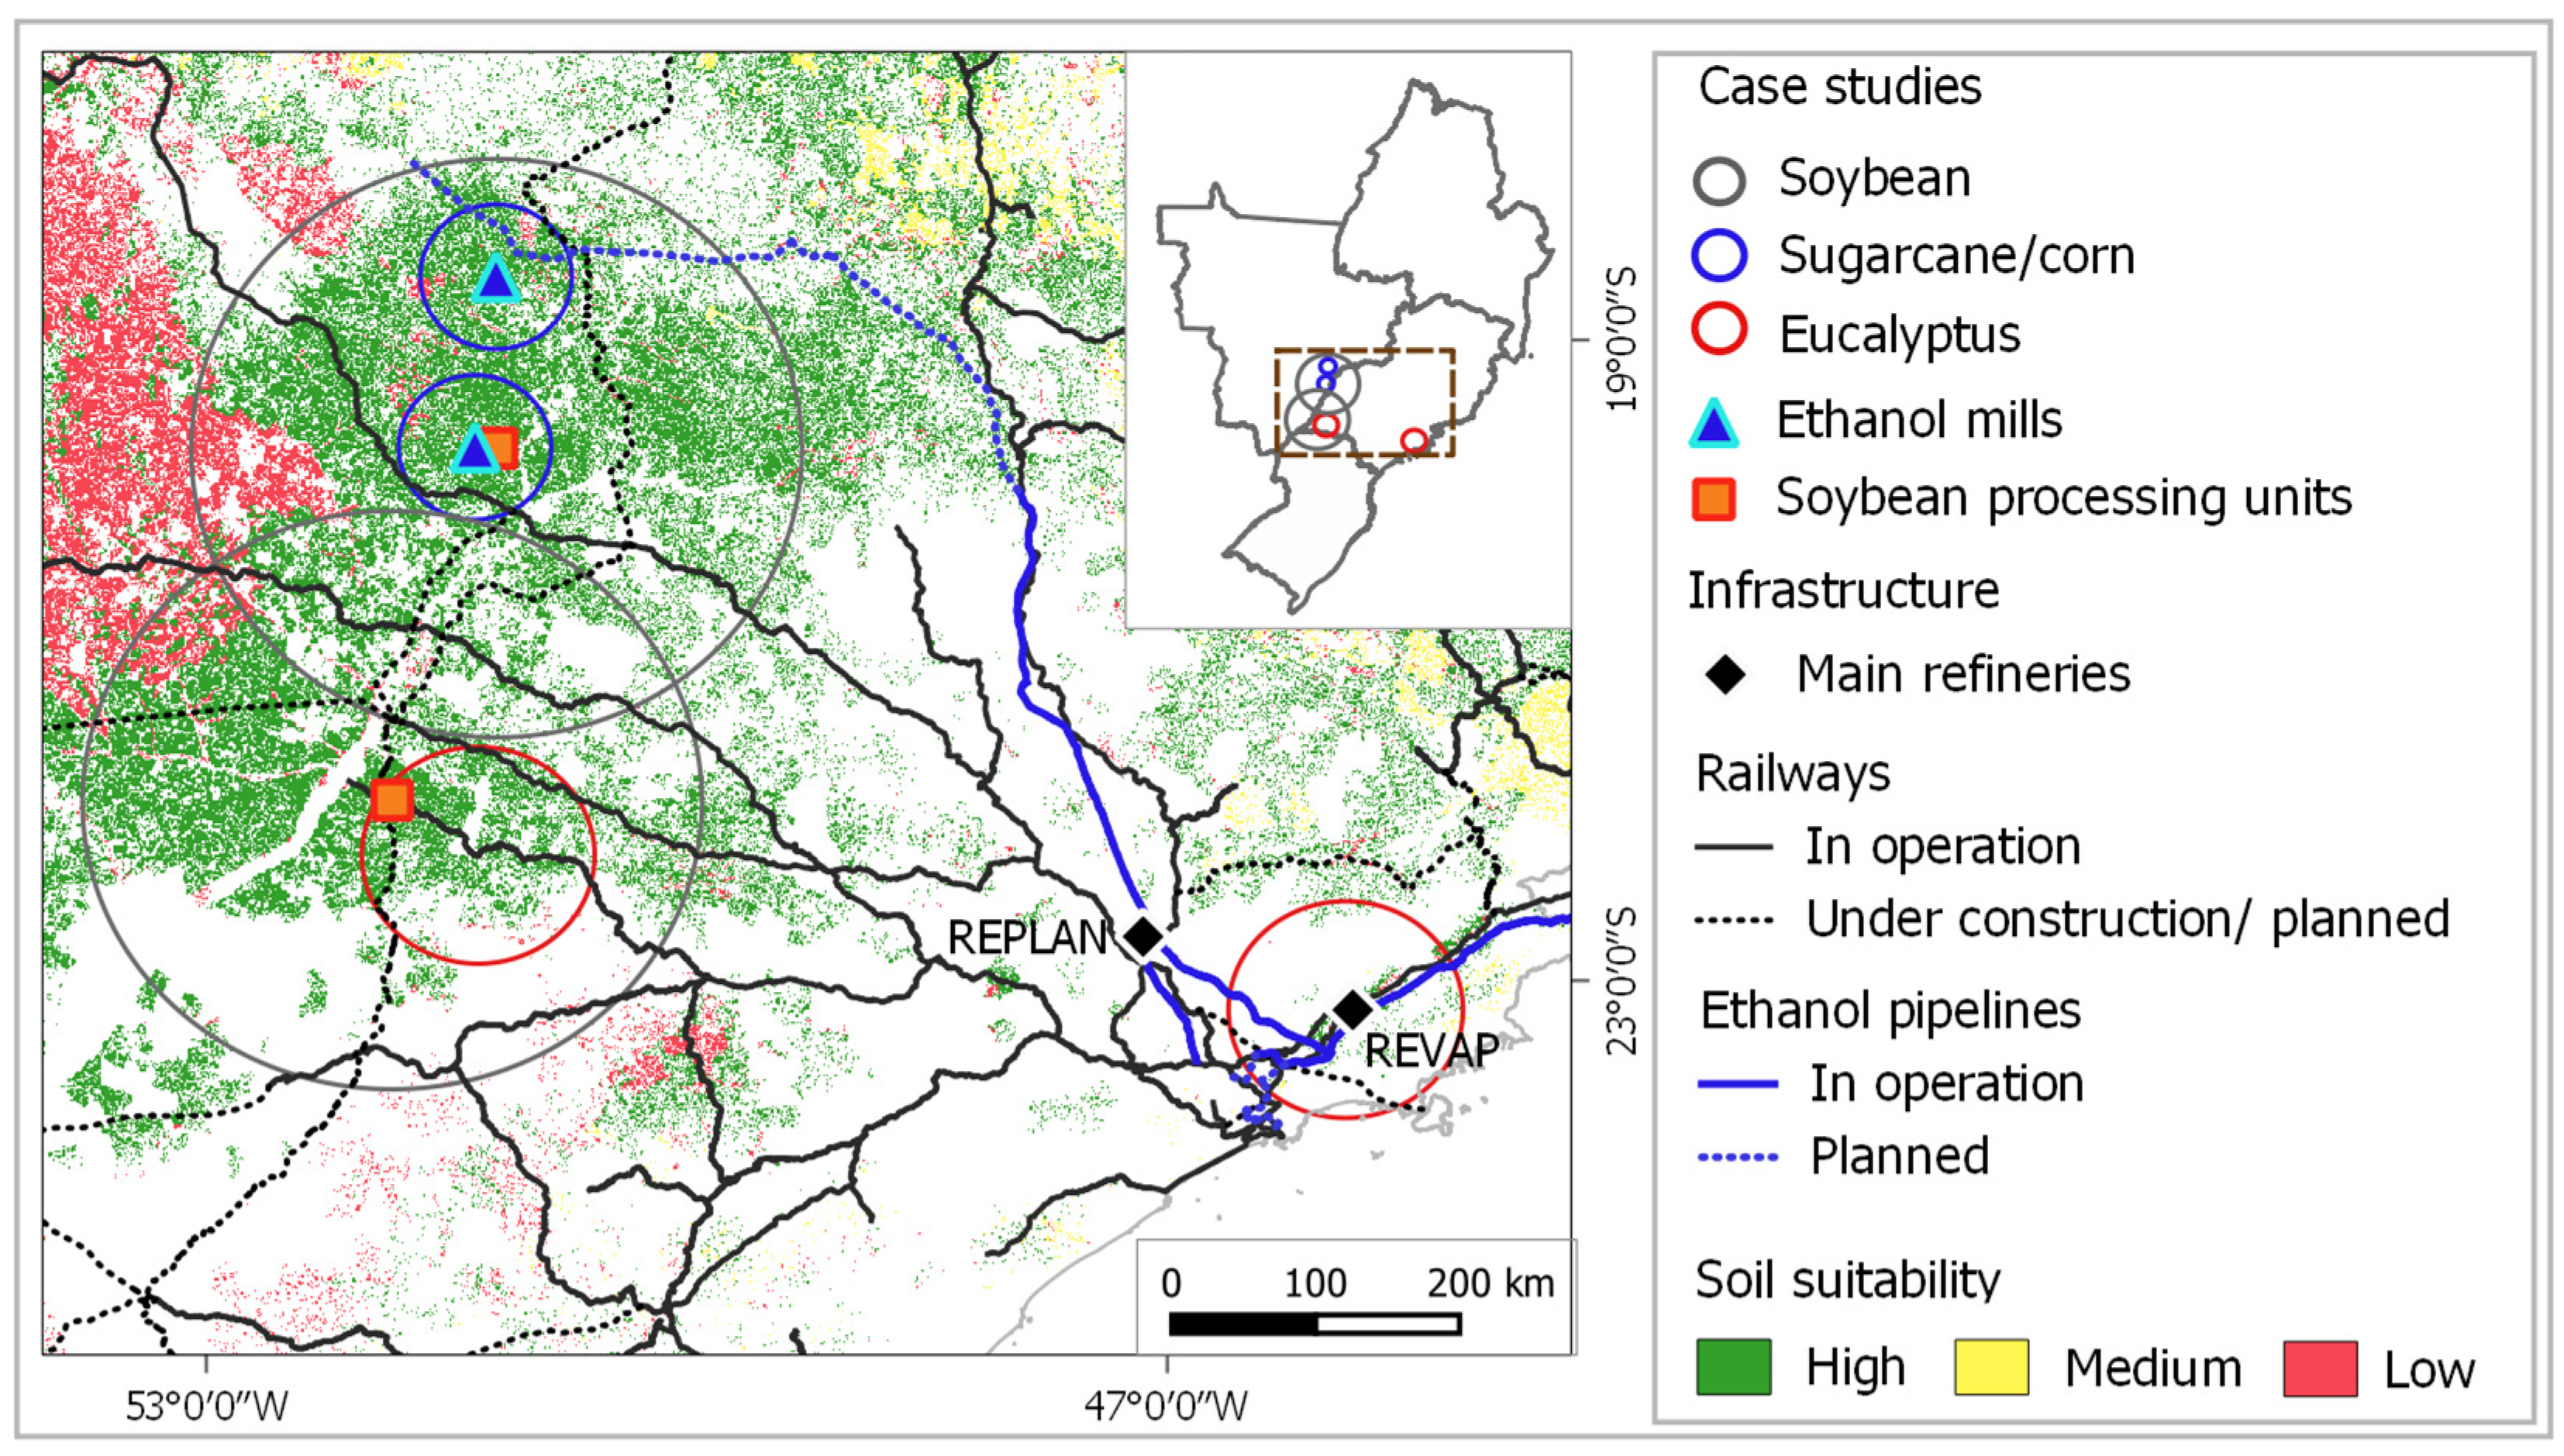
Figure 8 shows the location of the six considered case studies. The circles of influence were plotted over the map of soil suitability, and the figure also highlights the existing railways, the existing and planned branches of the ethanol pipeline, and the location of the two oil refineries where SAF production would take place.
4.4. Aggregating Pixels
In the procedure of estimating areas for biomass production, we imposed a filtering process of pixels. The rationale is that the mechanisation of planting and/or harvesting requires minimal contiguous areas. The imposed filtering was for the following minimum areas: 50 hectares for eucalyptus, 100 hectares for soybean and sugarcane, and 100 hectares for corn, as corn must be the second crop in a soybean area.
4.5. Producing on Degraded Pasturelands
One option for reducing the impacts of indirect Land Use Change (iLUC) due to bioenergy is to prioritise the production of biomass on degraded land [
47,
48]. This alternative was explored here considering an assessment of the level of pasture degradation in Brazil, based on satellite images, presented by [
49], which in turn is based on the definitions of [
50,
51] and on remote sense classification presented by [
52]. According to [
50,
51], the classification is due to agronomic and biological aspects. Agronomic degradation is related to pastures in which there is regeneration of native vegetation, while the biological aspect is due to the loss of soil fertility and the existence of exposed soil.
In [
49], pasturelands are classified in four groups: no degradation, slight, moderate, and severe degradation. The classification of pastures into degradation levels was obtained from the stratification of a vegetative vigour index based on images from 2018 [
52]. The results of the assessment for each crop and in each production site are presented in next section.
4.6. Industrial Parameters
The industrial parameters of the SAF production units considered were taken from [
53,
54], and a synthesis of what has been assumed in this paper is presented in
Table 6. The parameters correspond to the industrial yield, expressed as mass of hydrocarbons production per tonne of feedstock (in dry basis); the same regarding SAF yield; and the capacity of the assumed industrial units, both based on input (feedstock) capacity per day or SAF output.
5. Results and Discussion
5.1. Eucalyptus
Table 7 shows the estimates of the assessed area at the two production sites considered. The table also shows the impact of filtering the results in order to have at least 50 contiguous hectares, aiming at reflecting the impacts of mechanisation. This translates into a significant reduction in the potential production, mainly around São José dos Campos (SP).
The weighted average yield, expressed in tonnes of dry wood, corresponds to the average annual increase in wood per unit area. It is worth mentioning that the cycle considered here is seven years, which means that at the time of cutting the amount of wood harvested per hectare would be seven times greater. Considering the entire range of potential production, the higher yield in the case of Espigão (SP) translates into a lower weighted cost of wood in the centre of the production circle.
5.2. Soybean
In the two production sites considered in this paper, the results are quite similar since the weighted estimated average yields are high in both cases and close to highest average values in Brazil. The average CIF costs of grain in the centre of the circles of production are also quite similar, with a small advantage to Presidente Venceslau (SP). The production around Paranaíba (MS) could be larger, but once the filtering procedure is applied to take into account that the contiguous areas must total at least 100 hectares, the results become equivalent, as can be seen in
Table 8. The soy oil production was estimated based on [
55].
It is worth mentioning that there is an overlap to some extent between the two circles of influence, and, therefore, it is not correct to draw any conclusions from the sum of the production potential of these two locations.
5.3. Sugarcane and Corn
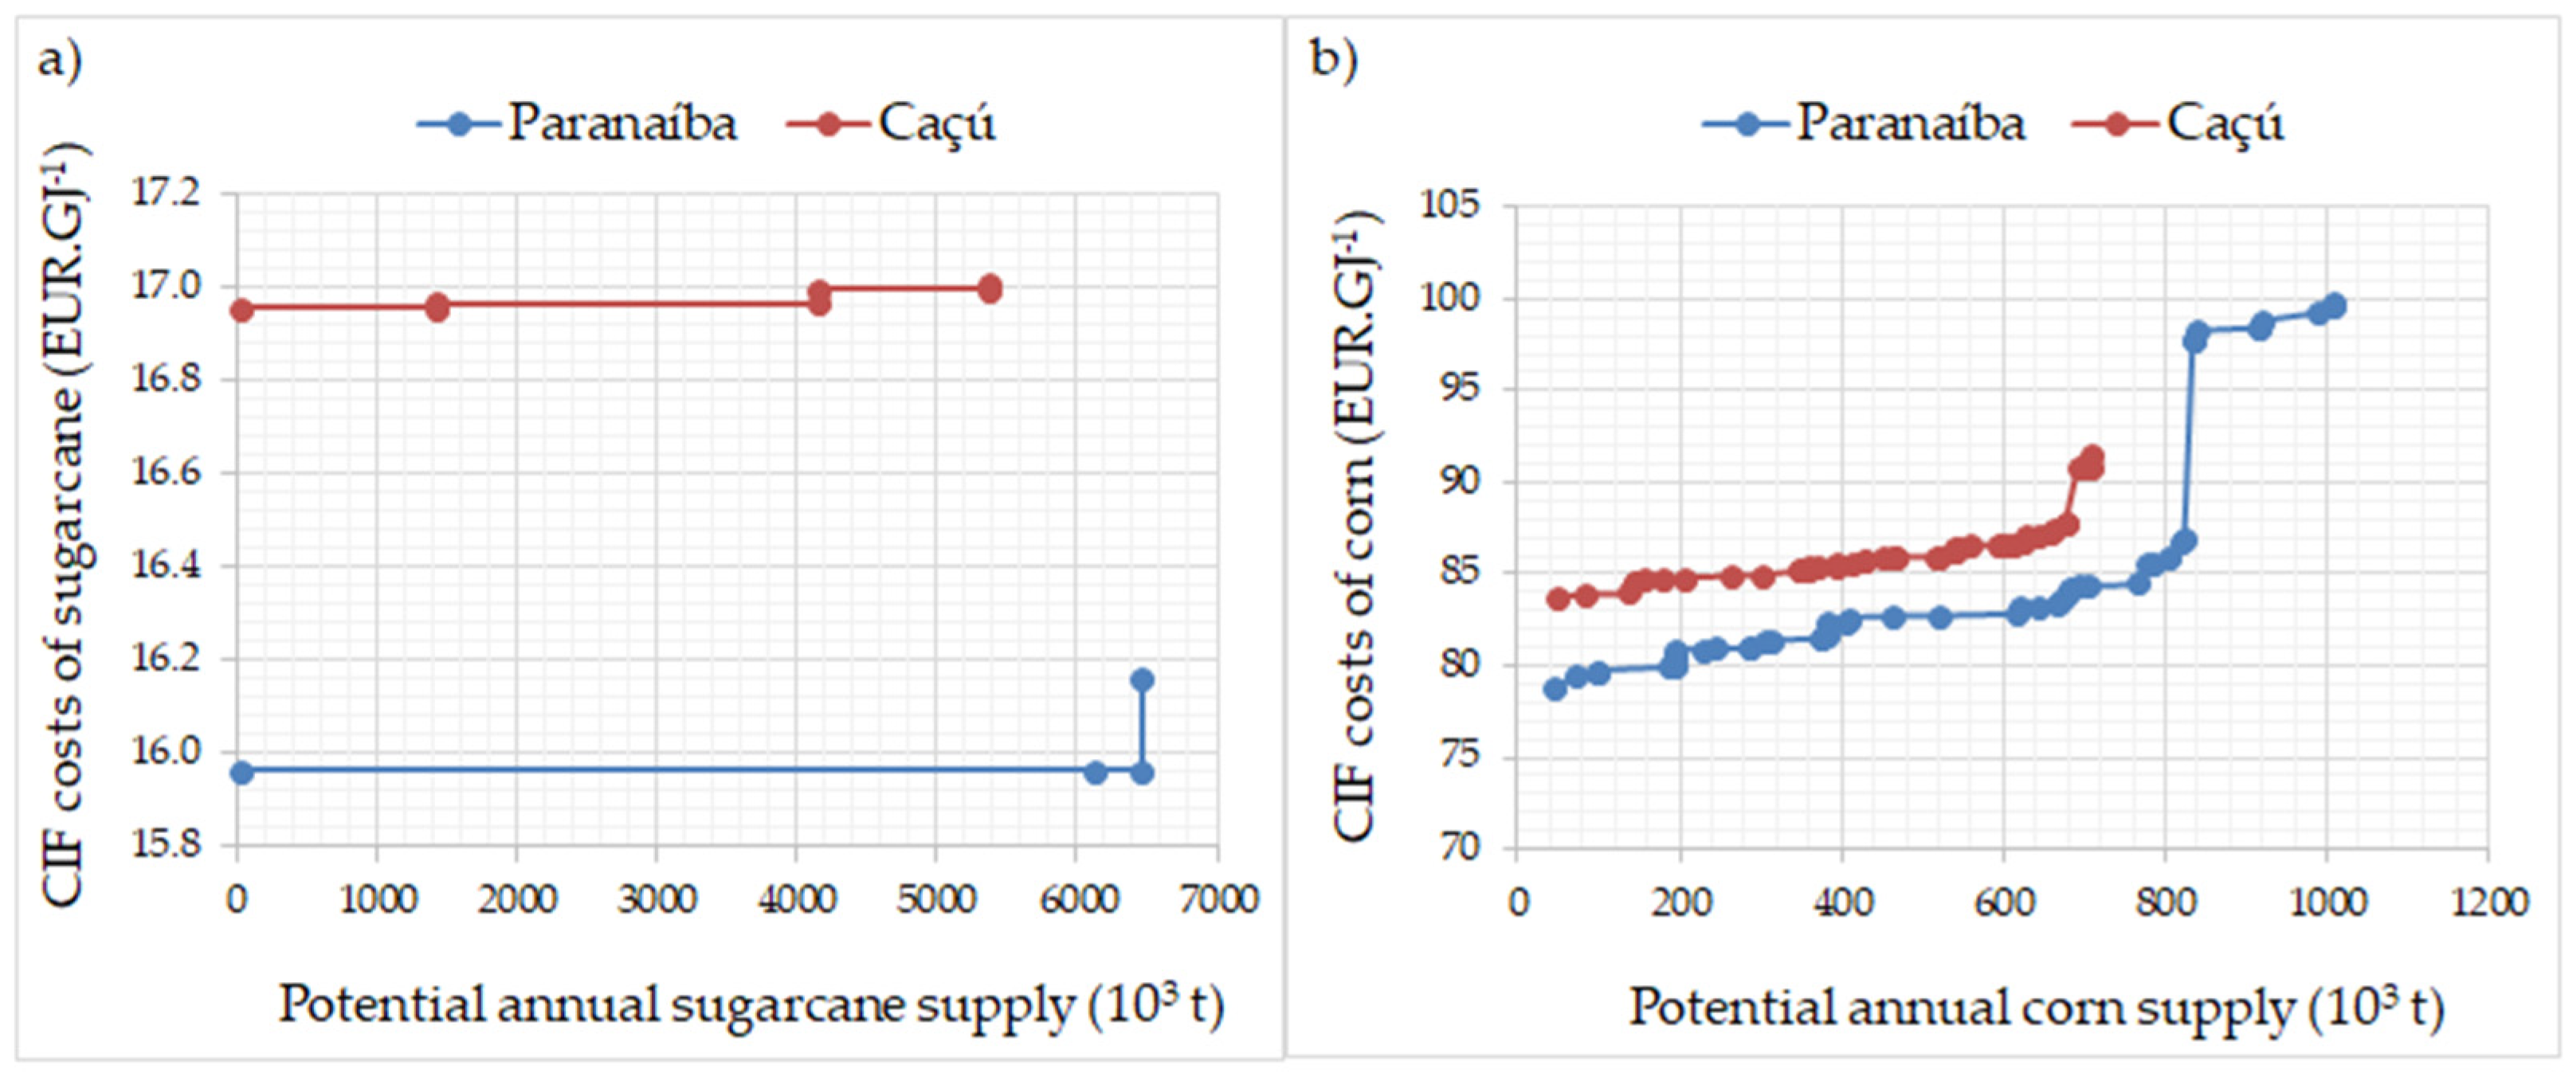
As can be seen in
Figure 9a,b, the production costs of sugarcane and corn are lower in Paranaíba (MS) than in Caçu (GO). On average, the predicted yields are quite similar in the two locations, both for sugarcane and corn, with little advantage for Paranaíba. The reference for anhydrous ethanol production is a distillery with a capacity of about 542 × 10
3 m
3.year
−1, being necessary to supply 4 × 10
6 t.year
−1 of sugarcane and about 526 × 10
3 t.year
−1 of corn. These estimates are based on [
56]. However, this assumed annual production of ethanol would be sufficient to guarantee the necessary input for the operation of three SAF industrial units, according to the assumptions presented in
Table 6. For such ethanol distillery, it can be seen in
Figure 9 that the production of feedstocks around the two sites would be enough to guarantee the operation with the predicted annual capacity factor, but not with a good margin in the case of Caçu.
Table 9 presents a synthesis of the results for sugarcane and corn for both production sites.
5.4. Degraded Pasturelands
As mentioned, biomass production on degraded land is recognised as a low iLUC strategy, and, in the context of assessing GHG emissions of SAF on a lifecycle basis, the iLUC share can be very significant. For instance, in the set of default lifecycle emissions values provided by CORSIA [
23], routes based on soybean and sugarcane produced in Brazil are addressed: in the case of the HEFA route based on soy oil produced in Brazil, the iLUC value corresponds to 27.0 gCO
2eq.MJ
−1 of SAF in an estimated life cycle emission factor totalling 67.4 gCO
2eq.MJ
−1, and 8.7 over 32.8 gCO
2eq.MJ
−1 of SAF in the case of the ATJ route based on sugarcane. The lifecycle emission factor is composed by the iLUC estimate plus the core LCA basis, which is related to the material flows in the production process, on a lifecycle basis. In both cases, the iLUC component is proportionally significant (40% and 26.5%, respectively, for soybean and sugarcane), and this would be crucial for the route based on soybean because it drastically reduces the margin for compliance with the principle related to the reduction in GHG emissions.
Table 10 presents the estimates of the degradation level in pasturelands by 2018, based on [
49], for the six sites assessed in this paper. The area assessed in each case varies with the radius of the circle of influence and the extent of pastures in each site. Assuming that the same fractions for each degradation level would be representative for the area effectively estimated for production, after the filtering process (see
Table 7,
Table 8 and
Table 9), it can be concluded that the impact would be very significant in SJ Campos (SP) and less significant in Paranaíba (MS), if non- and slightly degraded pastures were excluded from the production estimate.
The obvious impact is the reduction in the potential production, probably with an increase in the costs of biomass. In an assessment performed by the authors of this paper, considering the production of macaw palm oil in a specific location (in that case, one third of the potential area was excluded from the analysis), the estimated impact was a 36% reduction in biomass production, but with a small impact on its average weighted costs (an increase of only 2%) [
57]. Moving back to the case of soy production, as the potential is high in both locations, and production costs vary only slightly, in principle it seems logical to explore the alternative of producing only on degraded pastures (i.e., moderate and/or severe), even if the potential is significantly reduced.
5.5. Monocultures and Landscape Preservation
Two important aspects for the sustainable production of biomass are to avoid extensive monocultures and to preserve the landscapes as much as possible, actions that have positive impacts both from the point of view of biodiversity and socioeconomic [
58,
59].
Figure 10 shows the location of suitable sites for the production of sugarcane and corn around a new ethanol distillery to be installed near Paranaíba (MS).
Figure 10a (left side) shows the distribution of these sites, while in
Figure 10b we included the location of natural vegetation, as of 2019. Each dot (black or grey) corresponds to an area of 100 hectares. The areas not marked in
Figure 10a are those where the production of sugarcane and corn was not considered for different reasons.
This information allows the identification of the most suitable planting, not only to better take advantage of the existing potential, but also to preserve native vegetation, avoid fragmentation and create ecological corridors [
60,
61]. It is important to note that each pixel has associated information on yield and estimated production costs, which could assist in planning landscape interventions. In Brazil, the information would also be useful for the farmer to act in order to comply with the Forest Code Law [
62].
5.6. Trade-Off between Crops
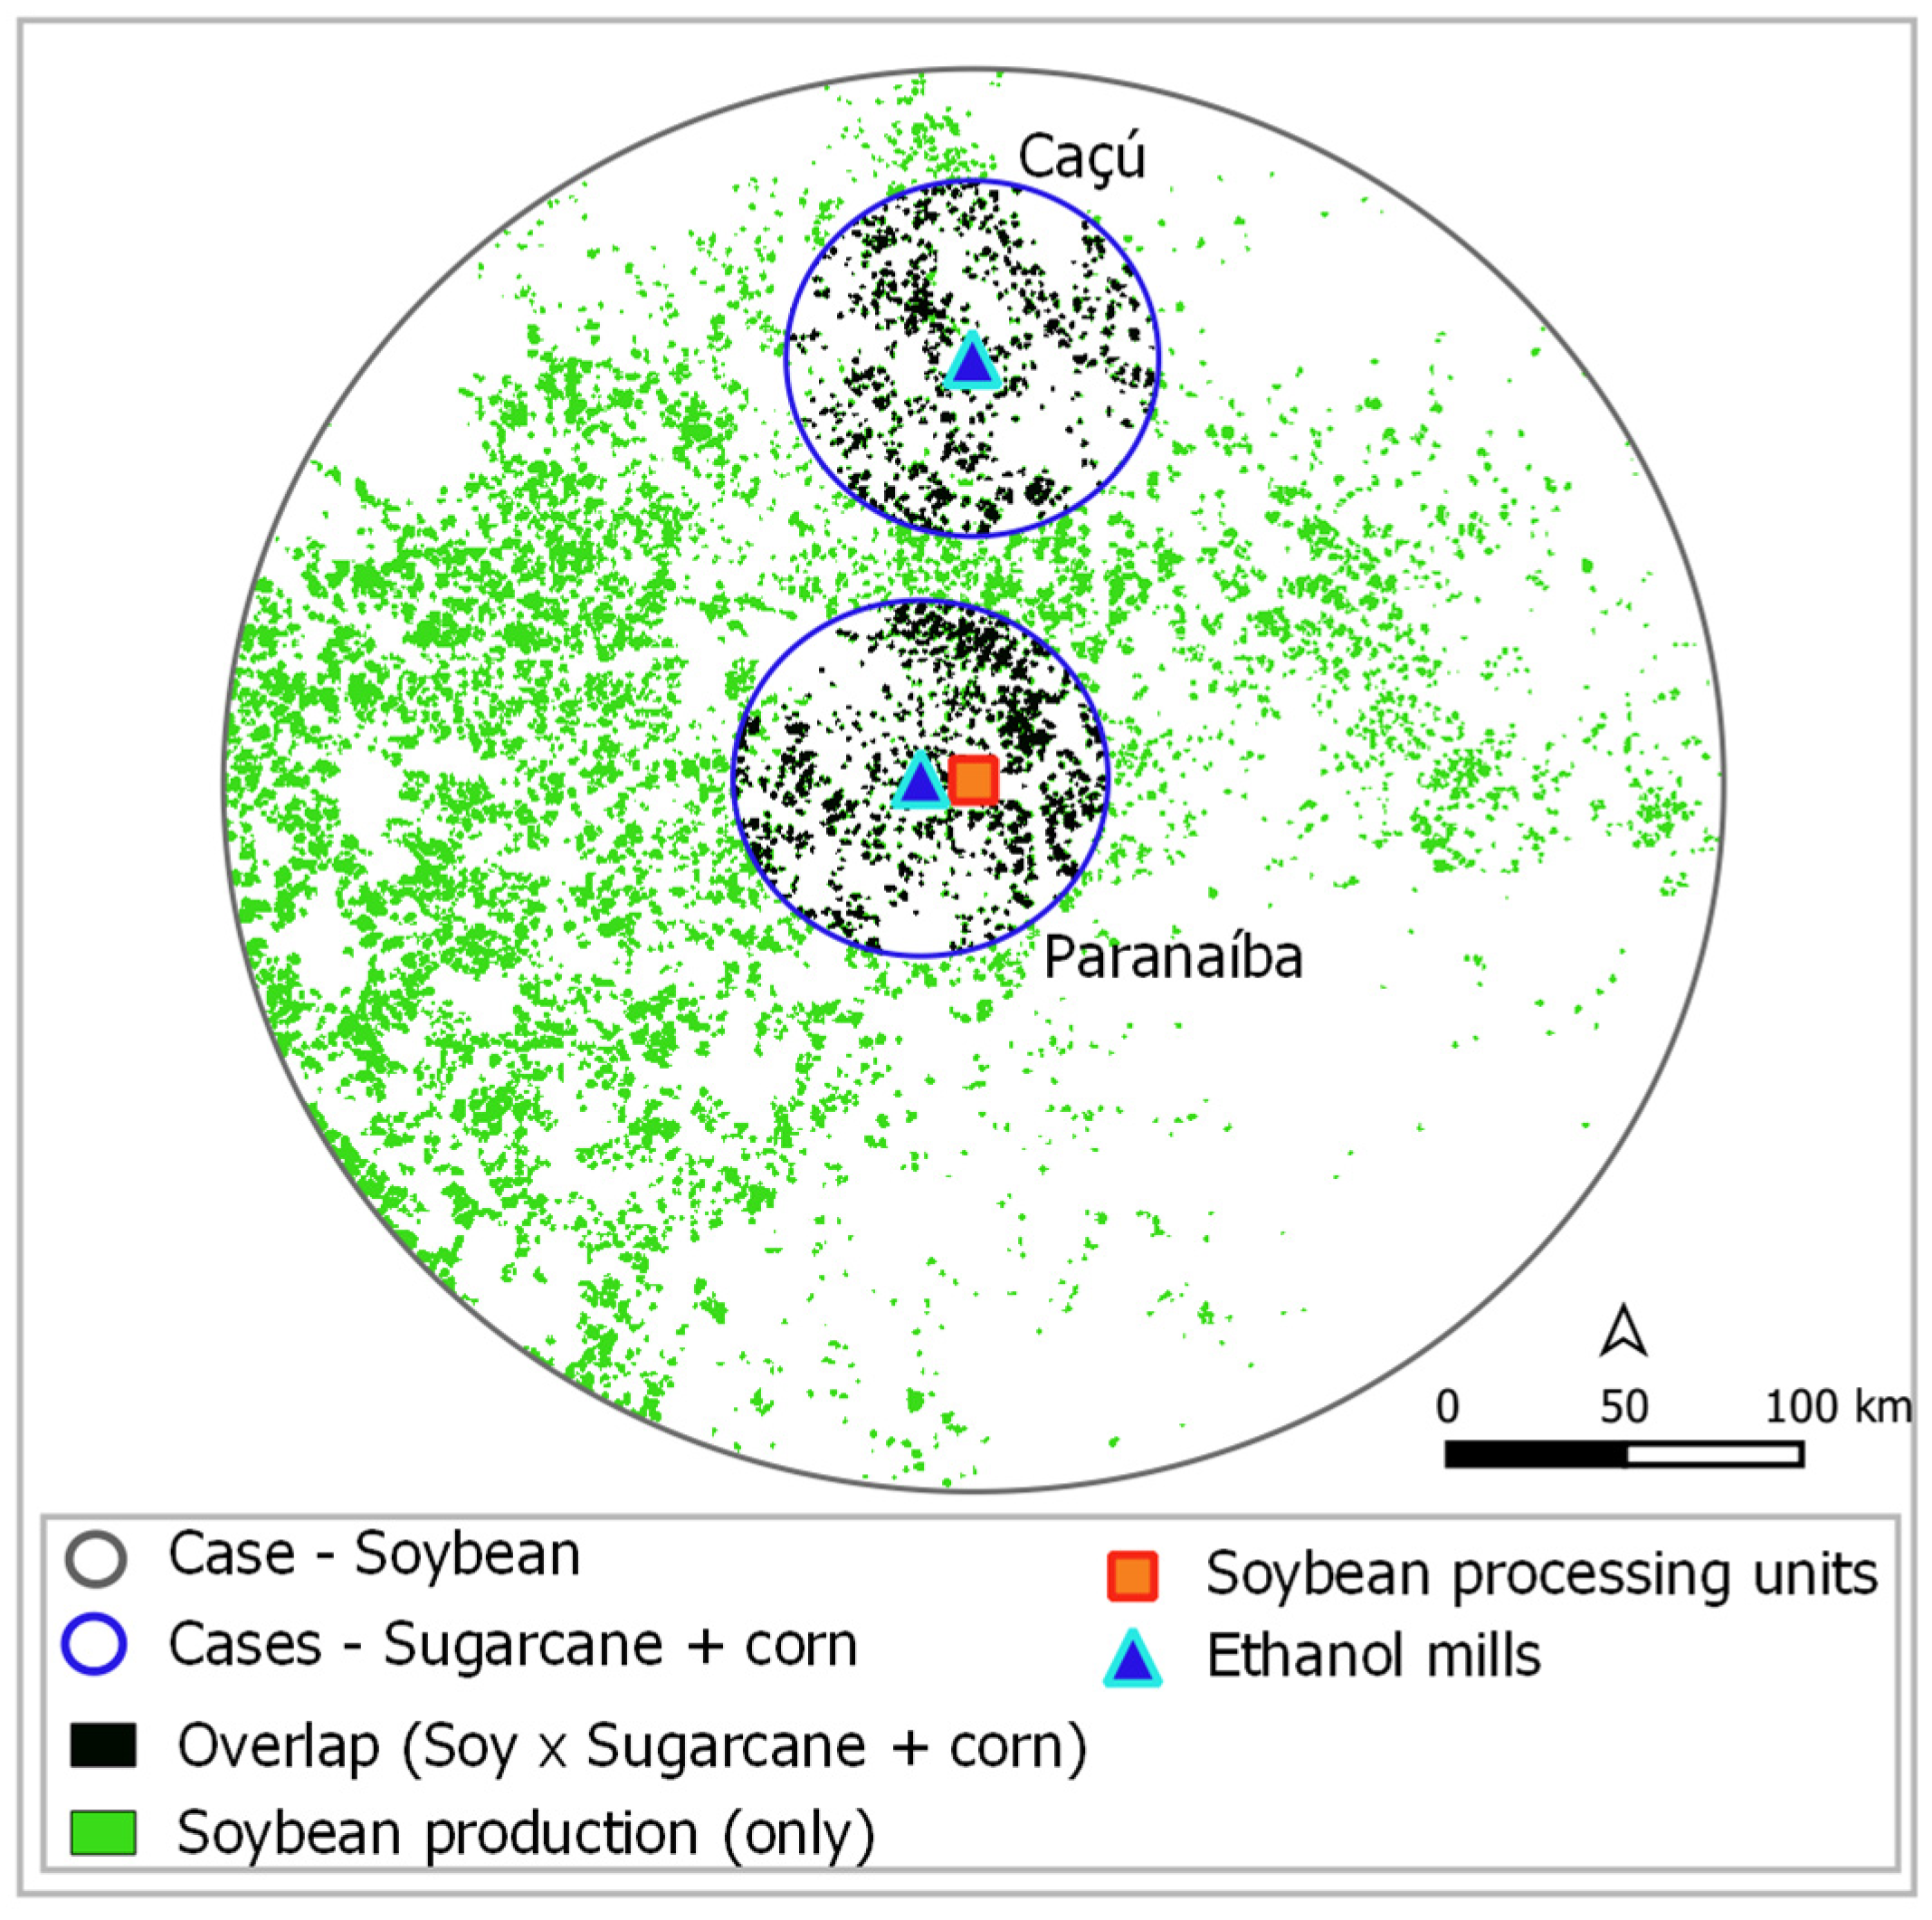
Some sites are suitable for different crops, and, in this sense, a trade-off would exist when assessing the potential for these feedstocks. In this work, this trade-off could be evaluated between sugarcane and soybean; it was assumed that corn, produced as a second crop, could be complementary to soybean.
Figure 11 shows the circle of influence around Paranaíba (MS) (200 km radius), and the circles in association with sugarcane production in Caçu (GO) and Paranaíba (MS) (30 km radius for sugarcane and 30-50 km for corn); both circles are inside the largest one. In the figure, the black dots indicate the spots that are available both the production of sugarcane and soybean (and corn, as a second crop).
It can be seen that almost all of the spots on which sugarcane production would be viable are coincident with those on which soy would also be viable. Thus, the evaluation of the potential of different feedstocks requires more care as there is a clear trade-off. In the case shown in the figure, if the production of sugarcane was made completely viable around Paranaíba (MS) and Caçu (GO), soy production in Paranaíba would be impacted by only 6%. On the other hand, the large-scale production of soy in this area can completely prevent the production of sugarcane in both studied areas.
5.7. Comparing the Results of the Production Sites
Table 11 allows for the comparison of the results of the SAF production estimate considering the exclusive supply of biomass in each of the six production sites evaluated. Only in the case of the ATJ route was the production of SAF assumed at REPLAN (in Paulínia—SP), since currently the existing pipeline enables the flow of ethanol there. The distances correspond to estimates from the biomass production point (for eucalyptus in SJ Campos), shipment (for eucalyptus in Espigão), or conversion (for soybean and sugarcane) to the place where SAF production would take place. The assumptions for estimating transportation costs are presented as
Supplementary Material.
The calculated number of SAF industrial production units corresponds to those whose technical parameters are presented in
Table 6, assuming production throughout the year with a capacity factor of 90%, maximum availability of raw materials (as shown in
Table 7,
Table 8 and
Table 9), and rounding down of the estimated results. The annual production of SAF corresponds to the product of the estimated number of units by the production of a single unit. The share of SAF production in relation to Brazilian consumption of jet fuel in 2018 (about 6 × 10
6 tonnes) is also shown, and it can be seen that, at best, it would be close to 4%. SAF production would be very small in the case of the FT-SPK route, using only eucalyptus produced around São José dos Campos (SP).
It is necessary to be careful when comparing the SAF production index per unit area, as shown in
Table 11. The result is impacted by the SAF yield per unit mass of feedstock (see
Table 6) (i.e., energy co-products were not considered in this estimate), but also by the energy production per unit area, an aspect that is intrinsic to biomass. Anyhow, the advantage of the ATJ-SPK route based on anhydrous ethanol produced from sugarcane and corn is clear.
Although the results of the economic analysis are not presented here, the combination of the high cost of biomass production (see
Table 7) and the small scale of production suggest that the FT-SPK route with SAF production at REVAP, exclusively using the wood produced in its surroundings, must be expensive.
Additionally, regarding the FT-SPK route, as there is no need for hydrogen supply; it is not necessary to transport the wood to an oil refinery. Thus, the viability of this route must be greater for short distances for transporting biomass, followed by the use of a low energy intensity mode for the transportation of hydrocarbons. In addition, assuming that scale effects would be important at the industrial site, SAF production capacity should be increased, if possible.
Assuming that the costs of extracting soybean oil are the same at the two production sites, it is reasonable to assume that the oil costs at the SAF production unit are quite similar. As previously mentioned, due to a certain overlap that exists between the two production areas, it is not possible to consider the combined supply just by adding the potential production in both.
For the production of SAF by the ATJ route, what can be decisive in the comparative analysis of the feasibility between the two supply locations are the scale effects in the production of ethanol, since the potential for biomass supply is larger in Paranaíba (MS).
The production of SAF by the ATJ-SPK route requires less land than the others analysed in this paper, and this can be a crucial aspect from a sustainability point of view. Considering the six locations evaluated in this paper, in principle the risks of extensive monoculture can be better minimised in the case of sugarcane and corn production in Caçu (GO) because the fraction of land that would not be used for cropping is greater; this would also allow for exploring different solutions for the preservation of the landscape (in practice, the production of eucalyptus in the surroundings of São José dos Campos (SP) is disregarded here). Biodiversity conservation was not analysed in this paper, but as all locations are relatively close, it can be initially assumed that the impacts would be equivalent in all sites.
As for the transport, the best possible solutions have been considered. Estimating the carbon footprint is outside the scope of this paper, but the assumptions made would contribute to reducing GHG emissions.
Finally, it is worth remembering that, in the assessment presented here, sensitive biomes, preserved areas, and conservation units were excluded. Despite not being explicitly mentioned, the non-proximity of the production sites to those where historically there were conflicts related to the violation of land and water use rights was also imposed as a criterion for selecting areas.
6. Conclusions
This paper reports the assessment of the conditions for sustainable production of four crop-based feedstocks (eucalyptus, soybean, sugarcane, and corn) that can be used in three certified routes of SAF production (FT-SPK, HEFA-SPK, and ATJ-SPK). The geographical coverage corresponds to 12 states in Brazil, with an area that is equivalent to about 50% of the total area of the country. Six case studies were carried out in association with potential biomass production sites, two for each route. Sugarcane and corn would be used for the production of anhydrous ethanol.
The procedure was based on assessing suitable areas for production, mainly considering edaphoclimatic conditions, followed by estimating yields and biomass costs. In the assessment, only rainfed cultivation was considered. The production sites were defined based on these results, but also on the proximity to the existing infrastructure, aiming to reduce costs and GHG emissions in the supply chain (e.g., in transporting biomass or the intermediate energy carrier). To minimise GHG emissions, transporting biomass over long distances was considered only by rail or pipeline (in the case of ethanol); a condition that, in practice, imposes on restrictions in the Brazilian case, as the transportation infrastructure is precarious in the North and northeast regions.
From an environmental perspective, in the assessment we imposed full exclusion of two sensitive biomes (Amazon and Pantanal), and excluded conservation units, indigenous reserves, and areas that shall not be used for biomass production according to CORSIA’s sustainability criteria.
The results show that the two locations considered for the production of eucalyptus are heterogeneous, but the locations for the production of soy, sugarcane, and corn are almost equivalent to each other. In general, the estimated yields would be close to the best current Brazilian values and the estimated costs are also representative of the current best cases. For the same final production of SAF, far less land would be required by the ATJ route, compared to the other two.
In order to reduce the risks of iLUC, in this paper the production of biomass only in degraded lands (degraded pastures, in this case) was addressed. In the context of CORSIA, this could be a relevant strategy for crops that have higher estimated iLUC factors, as is the case of soybean production in Brazil. The available information in the database also allows for objective consideration in the assessment strategies to minimise landscape impacts of bioenergy systems.
The results show that the area that can be used for the sustainable production of biomass is significantly smaller than one might suppose at first. This is not only because of the restrictions that need to be imposed to ensure sustainability, but also because the dispersion of suitable areas reduces the economic potential, and, in addition, because of the restrictions associated with the lack of adequate infrastructure, which is an important aspect for some regions in Brazil.
The main alternatives for the production of biomass in a sustainable way were considered in the carried out analyses, and this was possible due to the scope of the database available in SAFmaps.


