Article

Does Smart City Construction Improve the Green Utilization Efficiency of Urban Land?

1
Business School, Shandong Normal University, Jinan 250014, China
2
School of Geography, Nanjing Normal University, Nanjing 210023, China
3
School of Urban and Regional Sciences, Shanghai University of Finance and Economics, Shanghai 200433, China
4
School of Economics, East China Normal University, Shanghai 200241, China
5
School of Economics & Trade, Hunan University, Changsha 410006, China
*
Author to whom correspondence should be addressed.
Land 2021, 10(6), 657; https://doi.org/10.3390/land10060657
Submission received: 1 June 2021 / Revised: 13 June 2021 / Accepted: 15 June 2021 / Published: 21 June 2021
(This article belongs to the Special Issue Efficient Land Use and Sustainable Urban Development)

Abstract

:
Frontier research primarily focuses on the effect of urban development models on land use efficiency, while ignoring the effect of new-type urban development on the green land use efficiency. Accordingly, this paper employs a super efficiency slacks-based measure (super-SBM) model with undesirable outputs to measure the green land use efficiency based on panel data from 152 prefecture-level cities for the period 2004–2017. We construct a difference-in-differences (DID) model in this paper to test the impact of smart city construction on the green utilization efficiency of urban land and its transmission mechanism. The results showed that: (1) The smart city construction significantly improved the green utilization efficiency of urban land, increasing the general efficiency by 15%. (2) There is significant city-size heterogeneity in the effect of smart city construction on improving green utilization efficiency of urban land. The policy effect is more obvious in mega cities and above than in very-large-sized cities. (3) The city-feature heterogeneity results reveal that, in cities with a higher level of human capital, financial development, and information infrastructure, the effectiveness of smart city construction in improving the green utilization efficiency of urban land are more obvious, and in cities with a higher level of financial development, the effects of the urban policy were more optimal. (4) The smart city construction promotes the green utilization efficiency of urban land through by the information industry development and the regional innovation capabilities.

Graphical Abstract

1. Introduction

Green development is key to the transition of China’s economic development model, and it is also an important part of enhancing high-quality economic development to realize the “Beautiful China” strategy, which is to achieve good ecology, economy, improved health, and people’s happiness. The goal of green development is to combine economic, social, and ecological development to create a society that is “resource-conserving” and “environment friendly” [1]. The land is an important vehicle for human productivity, life, and social and economic activities. Regarding land utilization, the green development concept, featuring the harmonious coexistence of humans and nature with sustainable development, must be implemented throughout the process to unify the economic, social, and ecological benefits of land utilization.
Since the reform and opening-up, China’s urbanization level has increased significantly. In 2019, the rate of urbanization was greater than 60%. The improvement in urbanization is an important driving force for pulling economic growth, but serious issues have arisen in the process. For example, the excessive expansion of urban space has resulted in the conversion of a large amount of agricultural land into non-agricultural construction, urban development, and low land-use efficiency within cities [2,3]. This rapid development has begun to threaten both land protection and national food security while also impeding urban economic development [4,5]. In addition to that is the serious environmental pollution that accompanies such extensive expansion of urban scale, which has endangered the sustainable development of China’s economy and society [6,7]. Improving the urban land green utilization efficiency is one of the primary tasks of developing countries. In this context, the key to achieving the harmonious development of urban development, land use and environmental protection are to follow the concept of green development and promote urban land green use. The green use of urban land not only introduces the concept of green development into the land use process, but also maximizes the economic output and social wellbeing, while reducing environmental pollution as much as possible [8]. Reasonable measurement of urban land green utilization efficiency has important theoretical and practical significance for the realization of urban land green utilization and the formulation of related policies.
The 19th National People’s Congress of the Communist Party of China report emphasized that supporting and encouraging green development and adjusting the urban development model is the key to reshaping the momentum of urban growth and enhancing the core competitiveness of cities. The announcement of the smart city pilot policy in December 2012 provided a new-type model for urban development that integrates innovation and green development. In China, a smart city is officially defined as an urban development model that integrates technological innovation, product innovation, market innovation, resource allocation innovation, and organizational innovation [9,10]. Innovation drives the green urban development model, optimizing economic development through innovative advantages and an eco-conscious foundation. So, can smart city construction advance the green utilization efficiency of urban land in China? Under the constraints of heterogeneous city sizes and urban characteristics, will the impact of smart city construction on the green utilization efficiency of urban land differ? What transmission mechanism does smart city construction employ to influence the green utilization efficiency of urban land? The answers to these issues have important theoretical and practical significance for the realization of sustainable economic development.
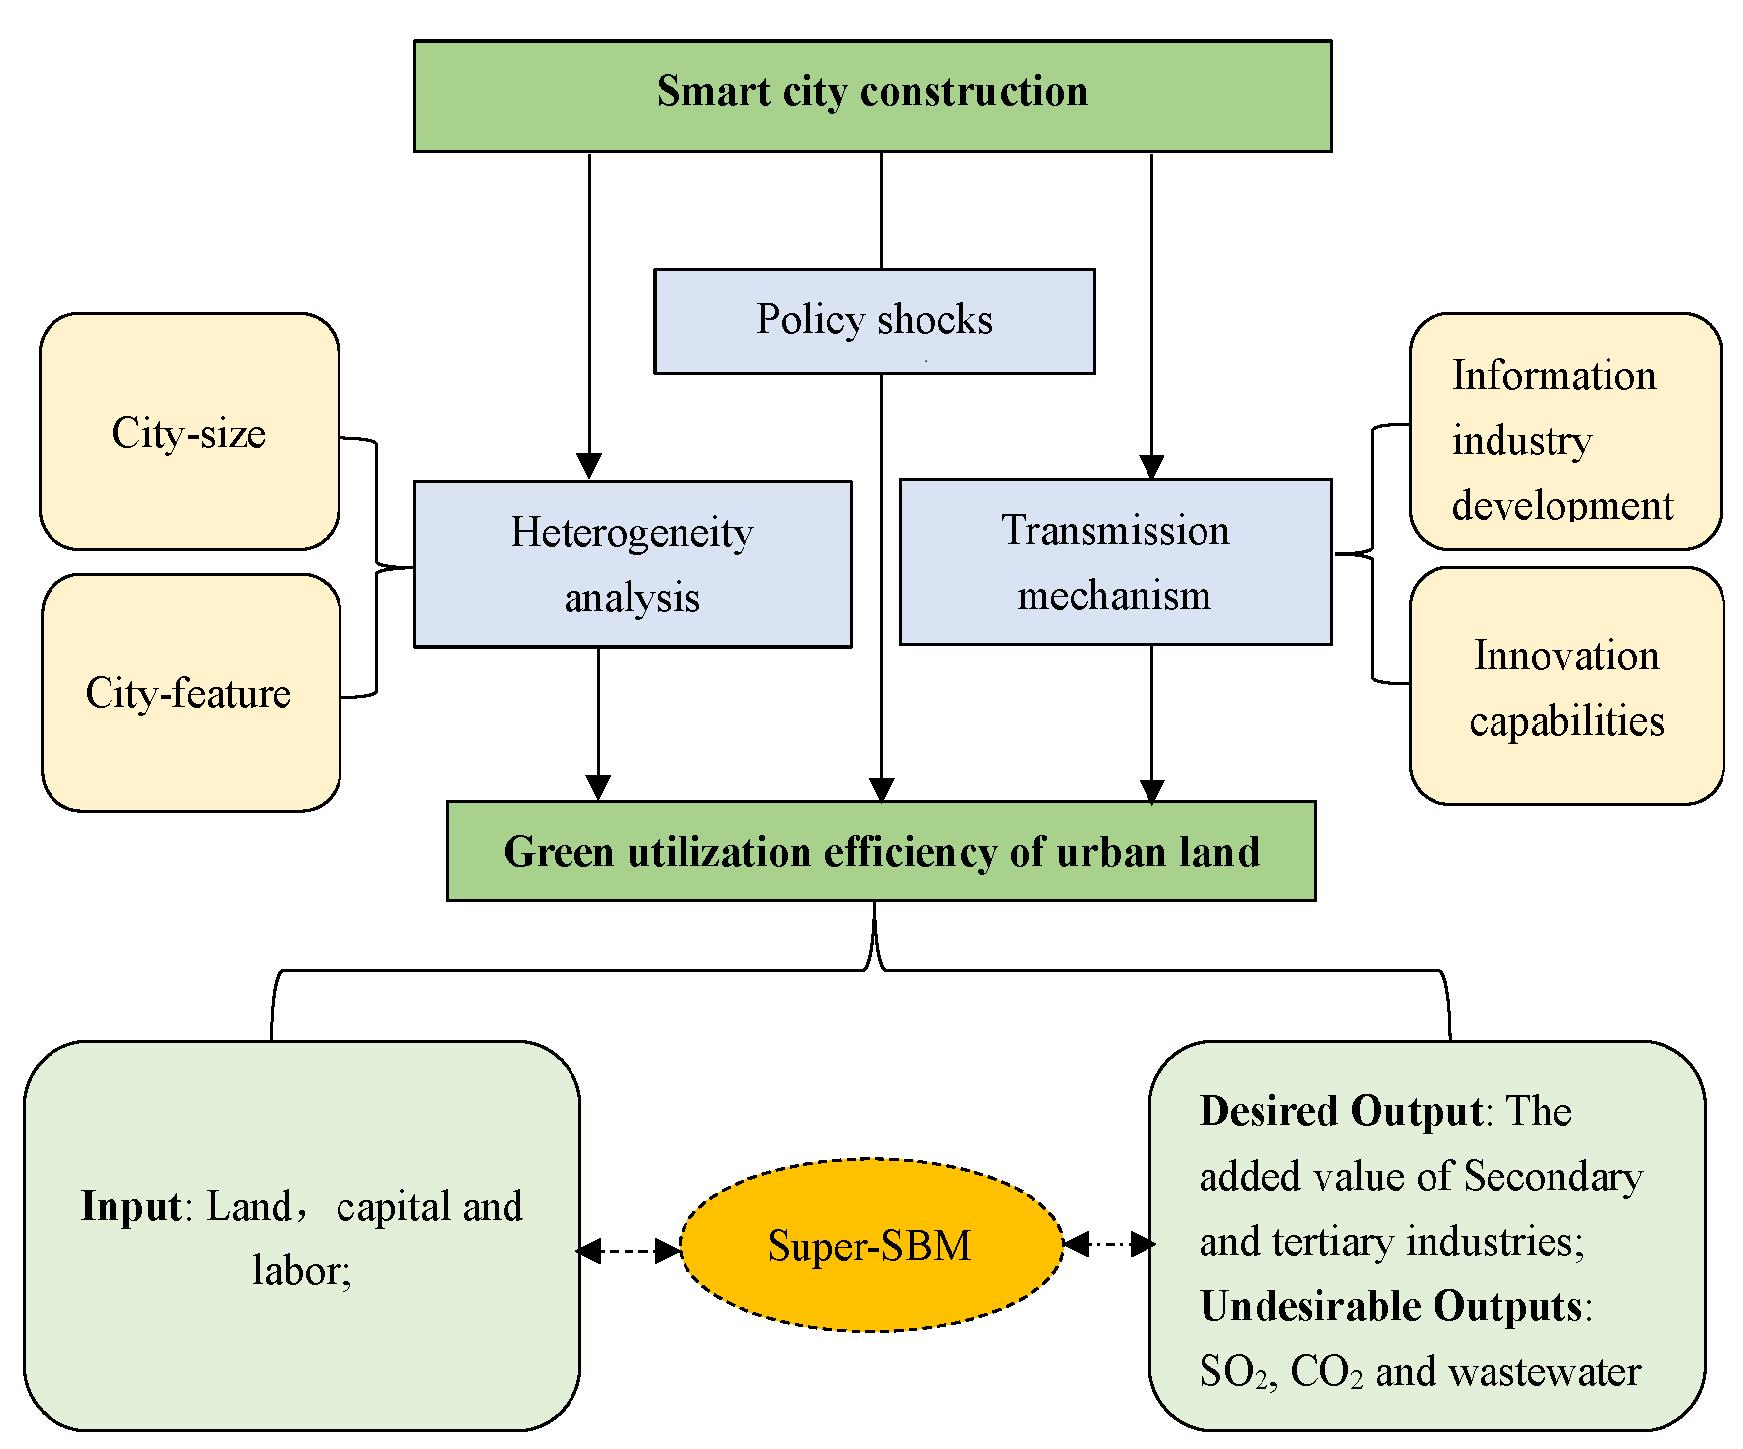
As the medium of a wide variety of economic activities, urban land presents a concentrated distribution space for both secondary and tertiary industries, which can bring both “desirable” economic and “undesirable” outputs [11]. Incorporating undesirable outputs into the measurement framework of urban land utilization efficiency can improve the science of land utilization efficiency measurement, while also conforming to the current state of urban land utilization cause a steep increase in regional ecological and environmental risks. Accordingly, this paper uses the panel data of 152 municipalities in China in 2004–2017, based on the 2012 China Smart City Pilot as the Quasi-Natural Experiment, use difference-in-differences (DID) method to investigate the impact of smart urban construction on the urban land green utilization efficiency and its transmission mechanism.
The contributions of this article are shown as follows: (1) Different from existing research that explores the impacts of the urban development level and urban characteristics on land utilization efficiency, they ignore the effect of new urban construction on the green utilization efficiency of urban land with undesirable output. This study evaluates the effects of new-type urban development on the green utilization efficiency of urban land in a scientific manner. (2) The green utilization efficiency of urban land may be affected by non-policy factors that vary over time and may present endogenous problems. Smart city construction provides a quasi-natural experiment for this study, separating other factors from policy factors to avoid endogenous problems. (3) Different from the traditional urban development model, this article is the first one based on the perspective of the new urban development model, and uses it to systematically examine the impact of smart city construction on the efficiency of green land use and its transmission mechanism, and to test the impact of smart city construction under different city scales and different city characteristics. The difference in the impact of land-use efficiency is expected to provide a theoretical basis for the comprehensive development of smart cities and the in-depth promotion of green development.
The remainder of this research is arranged as follows: Section 2 presents literature review; Section 3 presents the methodology and data; Section 4 discusses the impact of smart city construction on the green utilization efficiency of urban land and the robustness test; Section 5 presents the heterogeneity analysis; Section 6 is the inspection of transmission mechanism; and Section 7 offers conclusions, implications, and suggestions.

2. Literature Review

Urban land is an important medium for economic and social development. Under the background of accelerated urbanization and urban spatial expansion, the traditional extensive development model has increased the intensity of land resource consumption and severely deteriorated land ecology. So improving land utilization efficiency is a great challenge for urban development. The current issue of land utilization efficiency mainly focuses on three aspects.
The first is the measurement and evaluation of land utilization efficiency [12,13,14]. Conventional land utilization efficiency only considers a single indicator, such as land-use density or yield per unit of land [15,16,17,18]. However, the single-index evaluation method does not fully reflect the relationship between multiple inputs and outputs in the process of urban land utilization in terms of efficiency. Therefore, the evaluation of urban land efficiency has evolved from single- to multi-index evaluation methods that consider economic, social, environmental, and political factors [19,20,21,22,23]. However, issues remain with the multi-index comprehensive evaluation method, e.g., the wide-ranging subjectivity of evaluation indicator weights and difficulty in determining the ideal values, which affects the generalizability of evaluation results. With the continuous development of research technology, the data envelopment analysis (DEA) can apply an optimized method to determine the weights of various inputs, avoid human subjectivity, and effectively evaluate efficiency values more objectively, and it is gradually becoming a mainstream method for measuring urban land utilization efficiency. For example, Xin et al. [24] and Yang et al. [25] used conventional DEA methods that did not consider undesirable outputs to measure urban land efficiency from different scales. However, economic output is not the only output in the process of land use. In the efficiency calculation, environmental output such as SO2 emissions, wastewater emissions, and solid waste must be considered as the undesirable output of land use, so that the land-use efficiency can be measured more accurately [26,27,28]. With the deepening of green development and the advancement of research methods and technologies, the measurement of green utilization efficiency of urban land has gradually become a central issue in the research of current evaluations of land utilization. The slacks-based measure (SBM) undesirable model has improved on the conventional DEA model to account for the undesirable output of land use, thus becoming the mainstream measurement method for land utilization efficiency. For example, Yang et al. [29], Tao et al. [30], and Yu et al. [31] each applied this research approach to measure and study the green utilization efficiency of urban land at different scales. However, an issue remains with the SBM-undesirable model. The efficiency value of the effective decision-making unit cannot be broken down, resulting in the loss of effective decision-making information. Consequently, the super-efficient SBM model based on undesirable outputs can effectively resolve this issue in practical application [32,33,34].
The second is the analysis of the driving factors of land utilization efficiency. Current research suggests that land utilization efficiency is highly correlated with the level of economic development [18,35], the degree of market openness [36,37], the level of R&D [35,38], and the level of public infrastructure [39,40,41]. The main reason for this is that socioeconomic development results in more advanced technology and management skills in terms of regulating land utilization, reducing production costs, and eliciting the expansion of industrial land reproduction. Related studies on the subject demonstrate that land utilization efficiency is subject to city size, industrial development, and national macro policies [14,42]. Research by Guastella et al. [19] holds that land utilization efficiency has a positive linear relationship with city size, meaning that the larger the city size is, the higher city’s land utilization efficiency is. In contrast, Yan et al. [35] applied data from cities in Eastern China to explore the nonlinear effect of city size on land utilization efficiency, revealing an inverted U-shaped relationship between city size and land utilization efficiency. As the scale of a city expands, urban land utilization efficiency apparently exhibits a trend of initially rising and subsequently falling. Of course, some scholars have analyzed the reasons for low urban land utilization efficiency, including blind urban expansion, non-transparent land pricing, and the illegal transfer of land-use rights [14,43,44]. Researchers also proposed improvements to urban land utilization efficiency by implementing urban border policies to curb urban expansion [45]. However, none of these studies focused on the impacts on the green utilization efficiency of urban land. Existing studies on the green utilization efficiency of urban land mainly focus on measurements [27,28,32], while a mere handful of scholars have conducted research on the influencing factors. For example, Yu et al. [31] evaluated the land utilization efficiency of 12 city clusters in China, and suggested economic level, economic structure, and government oversight as the three main driving forces of land utilization efficiency. Li et al. [46] used the Tobit model to analyze the impact of economic development, openness, and technological progress on the green utilization efficiency of urban land. Lu et al. [33] investigated 285 cities in China from 2003 to 2016, applying the DID method to evaluate the impact of high-tech development zones on the green utilization efficiency of urban land. The study found that high-tech development zones also significantly improved the green utilization efficiency of urban land. Moreover, given the regional heterogeneity, the policies for cities in Eastern China are more significant.
The third is the transmission mechanisms of smart city construction on the green utilization efficiency of urban land. The impact of smart city construction on the green utilization efficiency of urban land is inextricably linked with the development of a local information technology (IT) industry and innovation capabilities. First, the construction of smart cities must endeavor to transform the existing traditional industry through the development of the IT industry. According to the 2012 National Smart City (District and Town) Pilot Indicator System report published by the Chinese Ministry of Housing and Urban-Rural Development, the presence and advancement of emerging innovative industries are considered to be an important performance indicator. IT industry development is a significant guarantee of an emerging industry and has a key influence on the level of smart city local construction by enhancing workers’ skills and advancing industry upgrades [47]. The construction of smart cities requires the support of IT, and the development of a local IT industry provides such support through establishing IT infrastructure and talent. IT is a technology and capital-intensive industry that is a quintessential example of an emerging industry and a technological prerequisite for the development of a new economy. The development of the IT industry generates technological support that plays a key role in advancing the digitalization of other industries, including the manufacturing and service industries. Thus, the development of the IT industry can itself bring about industrial structural optimization, as well as facilitate the technological upgrade of other local industries and the realization of industrial structural optimization. Smart city construction has generated a massive demand for emerging industries, stimulating the development of the IT industry and exerting a demand-pull that expands its growth. Industrial structural optimization can be achieved by increasing the presence and proportion of IT, which is representative of emerging industries, and the information industry can also expand the technological prowess of secondary, tertiary, and other industries. The improved efficiency caused by industrial structural optimization results in the advancement of the original resources and elements of other industries, reducing pollution emissions and improving land utilization efficiency.
Smart city construction promotes the green utilization efficiency of urban land through the development of innovation capabilities. Smart city construction uses modern IT to innovate on the urban development model [48], through the technology effects, configuration effects, and structural effects of in-novation, thereby reducing urban environmental pollution [49]. The development of China’s economy is undergoing a stage of transition from that of “factor-driven” to “innovation-driven” strategies. Strong local innovation capability implies that the added value of technology created by the same resources is higher, output capacity is stronger, and output efficiency is higher. Technology has an amplifier effect that can work wonders, and this kind of innovation effect has two aspects. One is that smart city construction promotes the improvement of green utilization efficiency of urban land through the innovative effect. The technological innovation of the IT industry will enhance a city’s innovation capabilities. In addition, the development of a new generation of IT and new materials will promote the accumulation of high-end talent, high-tech companies, R&D capital, and other innovative elements, thereby raising the level of local technological progress (technology effect), with an innovative amplifier effect to improve the green utilization efficiency of urban land. Second, through the empowerment of other industries’ innovation capabilities, the amplifier effect achieved will promote the green utilization efficiency of urban land. Therefore, in cities with strong preexisting innovation capability, the construction of a smart city “redoubles power” for innovation. With a higher level of IT development and the degree of intelligence in the city, its innovation capabilities can be further enhanced, increasing the output efficiency of tertiary industries, while reducing pollution emissions and improving the local green utilization efficiency of urban land.
In general, most of the existing literature is based on the perspective of conventional urban development models to investigate the impacts of macro factors, such as economic development, city size, and market openness on land use efficiency. In the context of the acceleration of urbanization, more attention should be paid to the qualities of the urbanization process, and the exploration of new urban development models has become key to the urban development strategy in the new era. As a new type of urban development model, smart cities rely on emerging information science and technology to transform urban governance models, which enhances the clustering effect of large-scale cities, while also improving the allocation and utilization efficiency of urban resources to solve urban challenges to transform and upgrade urban development. China selected the first batch of pilot smart cities in December 2012, making it possible and necessary to scientifically evaluate the impact of smart city construction on the green utilization efficiency of urban land and its transmission mechanism from the perspective of this new urban developmental model.

3. Methodology and Data

3.1. Benchmark Model

China initiated the Pilot Smart City Project in December 2012. The Ministry of Housing and Urban-Rural Development instituted the Interim Management Measures for National Smart City Pilot Project. The first batch of pilot smart cities included 90 prefectural-level (county-level) cites. This study regards the Smart City Pilot Project as a quasi-natural experiment, applying the DID model to quantitatively evaluate the impact of smart city construction on the green utilization efficiency of urban land, with sample data at the prefecture city level for research. According to the DID model, pilot smart cities are regarded as the treatment group and non-pilot cities are regarded as the control group. The sample data were processed as follows: (1) When setting up a smart city, in some cities, only a certain county or district within the prefecture-level city is used as a pilot city (for example, Chaoyang District of Beijing and Huairen County of Shuozhou are considered pilot smart cities). As this study uses prefecture-level city data, if this type of prefecture-level city is used as a pilot smart city, the green utilization efficiency of urban land in the smart city may be underestimated. Therefore, in the course of data processing, samples of this type of city were factored out. (2) As the second and third batches of smart cities were established in 2013 and 2014, respectively, to ensure that the results estimated in this study are the net effect of the 2012 smart city pilot policy, newly established city samples in 2013 and 2014 were also factored out. Thus, a specific econometric model is built as follows:
ln G L E i t = β 0 + β i T r e a t i × P o s t t + γ X i t + δ t + μ i + ε i t
where i represents cities, t represents years, and GLE represents the green utilization efficiency of urban land. Treat is a grouping variable for cities, wherein if the city is a pilot smart city, it will be 1, and if not, it will be 0. Post is a grouping variable for time; if Post = 1, this indicates that the smart city pilot policy was implemented during the t period, and if Post = 0, this indicates that the smart city pilot policy was not implemented during the t period. Due to the fact that the first batch of pilot smart cities was established in December 2012, this study takes the year 2013 as the first effective year of the policy. X indicates the set of control variables, δ t is the time fixed effects, μ i is the city fixed effects, and ε is the disturbance term.

3.2. Variables

For the measurement of the green utilization efficiency of urban land, Tone [50] proposed the super-efficiency SBM model with undesirable output based on the conventional SBM model. This model simultaneously integrates the advantages of the super-efficiency model and the SBM model. The effective decision-making unit with an efficiency value of 1 is further broken down and included in the model, thereby avoiding the loss of effective decision-making unit data. The model is formulated as follows:
m i n ρ = 1 m i = 1 m x ¯ i / x i k 1 r 1 + r 2 s = 1 r 1 y ¯ s d / y s k d + q = 1 r 2 y ¯ q u / y q k u
s u b j e c t   t o     x ¯ j = 1 , j k n x i j λ j y ¯ d j = 1 , j k n y s j d λ j y ¯ u j = 1 , j k n y q j u λ j x ¯ x k ;   y ¯ d y k d ; y ¯ u y k u λ j 0 i = 1 , 2 , , m ; j = 1 , 2 , , n ; s = 1 , 2 , , r 1 ; q = 1 , 2 , , r 2 .
In Equation (3), it is assumed that there are n decision-making units; every decision-making unit is composed of input m, desired output r1, and undesirable output r2, x, yd, yu, which are the factors in the corresponding input matrix, desired output matrix, and undesirable output matrix. ρ represents the value of the green utilization efficiency of urban land.
Based on the implications of the green utilization efficiency of urban land, previous studies [51,52] were referenced, and the following indicators for evaluating the green utilization efficiency of urban land were selected: (1) Desired Output: Considering that utilization of urban land is mainly intended for industrial and commercial purposes, the real added value of the secondary and tertiary industries in the urban district is used as the desired output indicator. Actually, the GDP index is used to convert the nominal industrial added value using 2004 as the base period. (2) Undesirable Outputs: In light of the change in caliber of industrial smoke (dust) emissions in 2010, industrial wastewater, industrial sulfur dioxide, and carbon dioxide emissions were selected as undesirable output indicators in this study. The figures on carbon dioxide were calculated referencing the method in Chen et al. [53]. (3) Land Inputs: Indicated by urban construction land area in urban districts. (4) Capital Inputs: Expressed by fixed-asset investment in urban districts from 2004 as the base period, the fixed asset investment price index is used to convert the nominal fixed asset investment value into a comparable actual fixed asset investment, applying the perpetual inventory method to calculate the capital stock of each city over the years [54]. (5) Labor Inputs: Expressed as the total number of employees in urban public units and private companies and self-employed workers (per ten thousand people) in the urban districts. The average green utilization efficiency of urban land from 2004 to 2017 is shown in Figure 1, and the spatial distribution of efficiency values of specific cities is shown in Figure 2 (only 2004, 2008, 2013, and 2017 are listed).
To reduce the endogeneity problem caused by missing variables, a series of control variables were added for this research, including (1) Level of Economic Development (lnpgdp), expressed by the logarithm of the city’s actual per capita GDP; (2) Foreign Direct Investment (fdigdp), measured by the ratio of the total amount of foreign capital actually used to GDP calculated after the exchange rate conversion of the current year; (3) Level of Scientific Development (sci), expressed by the scientific expenditure per unit of total GDP. (4) Financial Development Efficiency (fe), measured by the ratio of loan balances to deposit balances; and (5) Government Intervention (gov), the percentage of the GDP used in the local government’s general fiscal expenditures.
Intermediary Variables: (1) Information Industry Development (inf), expressed as the ratio of employees in the data transfer, computer services, and software industries to the overall employment figures and (2) Regional Innovation Capabilities (inno), measured by the number of patents filed per 10,000 employees in each prefecture-level city.

3.3. Data

The data was acquired from the China City Statistical Yearbook over the period 2005–2018 and the CEIC database. The patent data is from the China Research Data Service platform. Finally, we obtained a strong balanced panel data for 152 prefectural-level cities in China from 2004 to 2017, included 31 are pilot smart cities. The descriptive statistics of each research variable are listed in Table 1.

4. Empirical Analysis

4.1. Variable Collinearity Test

The test results in Table 2 demonstrate that the correlation coefficients between variables are rather small, and the correlation coefficient between government intervention (gov) and the level of scientific development (sci) is the highest at 0.552.
Variance Inflation Factor (VIF) Analysis. The VIF test results of the explanatory variables in this study are summarized in Table 3. Among all variables, the largest VIF value is 1.88, which is much less than 10.
Based on the analysis results of the correlation coefficients and VIF test, there is no concern regarding collinearity between variables.

4.2. Parallel Trend Test

This study employs the DID method to evaluate the effects of policy on smart city construction. One of the preconditions for the effectiveness of the DID estimation is that the treatment group and the control group must fulfill the parallel trend assumption [55,56], that is, before the smart city proposal, the time trend changes of the green utilization efficiency of urban land between the control group and the treatment group should be as similar as possible, and after the implementation of the smart city policy, changes in this parallel trend are mainly reflected in the comparison between the non-smart cities and the smart cities regarding the value of the green utilization efficiency of urban land. Figure 3 presents the DID parallel trend. According to Figure 3, before implementing the smart city project, the green utilization efficiency of urban land in pilot and non-pilot areas was essentially the same. After the policy implementation, the regional growth rate of the value of green utilization efficiency of urban land in the pilot area was higher than that of the non-pilot area, exceeding that of the non-pilot area for the first time in 2013. Therefore, this study uses the DID model to test the impact of smart city policy on the green utilization efficiency of urban land, which fulfills the parallel trend assumption.

4.3. Benchmark Regression

The effects of smart city construction on the green utilization efficiency of urban land are presented in Table 4 the regression result without control variables is shown in column (1), the regression result with control variables is presented in column (2), the time-dependent effect of policy regression results is shown in column (3), and the time-dependent effects of policy regression results under parallel trend control is presented in column (4). The regression results in columns (1) and (2) reveal that the coefficients (Treat × Post) of the policy items are all significant at the 1% level, indicating that smart city construction can significantly improve the green utilization efficiency of urban land. The green development efficiency of pilot cities increased by 14.8% following the implementation of the smart city policy in column (2), indicating that the smart city pilot policy strongly influences the development green utilization efficiency of urban land. Compared with regression results without control variables, the goodness of fit of the model is significantly higher after adding control variables. The further exhibits the time-dependent effects of policy implementation in column (3), demonstrating that the policy effect of smart city construction on land utilization efficiency has a trend of increasing first and then decreasing, with the significance gradually weakening.
To further demonstrate that this model’s agreement with the parallel trend test, a dummy variable of time for the period prior to the policy implementation is added in column (4) to assess the time trend of the treatment group. The time trend regression results of the treatment group in each year prior to the Smart City Pilot Project are not significant, satisfying the parallel trend assumption.
In terms of control variables, the level of economic development, foreign investment, and scientific development are significantly positive at the 1% level, indicating that the level of economic development, foreign investment, and scientific development positively impact the green utilization efficiency of urban land. However, the effect of financial development efficiency is not significant, and government intervention exhibits a significant inhibitory effect on the utilization efficiency of urban land.

4.4. Robustness Testing

PSM-DID Test. To control for the systemic differences between the treatment group and the control group and reduce DID estimation bias, the Propensity Score Matching (PSM) method is applied to screen the two groups of samples, performing DID estimation basis. Specifically, the Logit model that is used, with treat as the dependent variable, and level of economic development (lnpgdp), foreign direct investment (fdigdp), level of scientific development (sci), financial efficiency (fe), and government intervention (gov) as the dependent variables, using a radius matching method for robustness testing. The regression result using the radius matching method is shown in column (1) of Table 5. The result shows that the core explanatory variable (Treat × Post) is significantly positive at the 1% level, which is consistent with the regression results mentioned above, indicating the robustness of regression results.
One-Time-Period Lag of the Controlled Variables. A potential problem of the benchmark regression equation is that the dependent variables may have an inverse effect on the independent variable. In the event of the existence of simultaneous equation bias, the estimate of βi will be biased. To eliminate the possibility of reverse causality and evaluate the impact of smart city construction on the green utilization efficiency of urban land as accurately as possible, a one-time-period lag is used on all explanatory variables except dummy variables, again carrying out the regression. The results are presented in column (2) of Table 5 below. The coefficient of the policy item is still significant at the 1% level, confirming the robustness of the benchmark regression results.
Elimination of Latent Outlier Influence. To eliminate the estimation bias caused by individual outliers in the sample data, 1–99% winsorization is performed on all variables except dummy variables in the regression model, followed by the regression test. The result is displayed in column (3) of Table 5, indicating that the coefficients of policy items are significantly positive at the 1% level, once again confirming the robustness of the benchmark regression results.
Exclude the sample of provincial capital cities. Great differences may exist in economic scale, resource endowments, and innovation capabilities between provincial capital cities and other prefectural-level cities. Therefore, the relevant data of provincial capital cities based on all samples is factored out and the data are re-estimated. In Table 5, the DID coefficients remain significantly positive in column (4), which is basically consistent with the benchmark regression results.

5. Heterogeneity Analysis

5.1. City-Size Heterogeneity

The previous analysis indicates that smart city construction has a significant influence in improving the green utilization efficiency of urban land. However, does a “policy effect” exist for cities of different sizes? If so, are there differences in policy effects? In terms of city size, larger cities display a clustering economic effect. Accordingly, resource allocation and utilization efficiency are better, thus enabling improvements in the green utilization efficiency of urban land. Subsequently, mega cities are prone to encounter a congestion effect, intensifying urban problems, and pollution issues. Therefore, it is necessary to test the improvement effects of the green utilization efficiency of urban land in smart cities of different sizes.
This study bases on the most recent standards in the Notice of the State Council on Adjusting the Standards for Categorizing City Sizes issued by the State Council in 2014. According to the total population of the city, cities with a population of less than 500,000 are classified as small-sized cities, cities with a population of more than 500,000 and less than 1 million are classified as medium-sized cities, and cities with a population of more than 1 million are classified as large-sized cities. The policy effects of smart city construction of different city sizes on the green utilization efficiency of urban land are tested. The policy effects regression results of small-sized, medium-scale, and large-sized cities are presented in columns (1)–(3) of Table 6, respectively. Regression results indicate that smart city construction has no significant impact on the green utilization efficiency of urban land in small and medium-sized cities. For large-sized cities, the policy effect is significant at the 1% significance level, indicating that smart city construction can significantly promote the green utilization efficiency of urban land in large cities. This implies that the impact of smart city construction on the green utilization efficiency of urban land has significant city-size heterogeneity. Additionally, large cities are further divided according to population size into very large-sized cities and mega cities. The regression results are shown in columns (4)–(5) of Table 6. The results show that the green utilization efficiency of urban land in the different sizes of large cities is significantly diverse. Smart city construction in large-sized cities, very large-sized cities, and mega cities alike can promote the improvement of the green utilization efficiency of urban land, with the latter showing more evident policy effects. It is possible that the scale effect of larger cities and a more reasonable industrial structure are of influence here.

5.2. City-Feature Heterogeneity

Smart city construction mainly relies on emerging information technologies, such as the Internet of Things, big data, and artificial intelligence, to enhance the presence and perception of market information. Human capital, financial development, and information infrastructure are critical to ensuring the development of emerging IT, maximizing the orderly development of smart city construction. Accordingly, this article examines the characteristics of urban development from the three aspects of human capital, financial development, and information infrastructure, conducting a heterogeneity analysis of the improvement effect of smart city construction on green utilization efficiency. Specifically, due to the lack of first-hand city-level data to accurately measure the indicators of urban human capital, the number of college students per 10,000 population in the city is selected as a reflection of the level of human capital, the GDP proportion of the balance of deposits and loans of financial institutions is used to measure the level of financial development, and the number of Internet broadband access users is used to measure the level of information infrastructure. In addition, each index is divided into high and low groups according to the median value, and a classification test is conducted.
The regression results of the city group with low human capital level and the city group with high human capital level are presented in columns (1)–(2) of Table 7, respectively. The results indicate that in cities with high levels of human capital, the policy effect coefficient is 0.239, and the coefficient is significantly positive at the 1% level; however, in cities with low levels of human capital, the policy effect is not significant. This implies that in cities with high levels of human capital, the improvement effect of smart city construction on green utilization efficiency is more significant. The regression results of the city groups of low-level financial development and high-level financial development are shown in columns (3)–(4), respectively. The results indicate that in cities with high levels of financial development, the impact coefficient of smart city construction on the green utilization efficiency of urban land is positive at the 1% significance level, and the impact coefficient is the largest, indicating that the level of financial development has the greatest impact of all features in terms of the effect of smart city construction on green utilization efficiency. The possible reason is that financial development provides sufficient financial protection for smart city construction, which, in turn, provides financial support for the improvement of green utilization efficiency. The regression results of city groups with low-level and high-level information infrastructure are shown in columns (5)–(6). The results show that smart city construction has a significant improvement effect on green utilization efficiency in cities with high-level information infrastructure. Therefore, when the information infrastructure, which serves as the basis for smart technology, is ubiquitous and comprehensive, it can provide a technical guarantee for smart city construction to promote green utilization efficiency.

6. Transmission Mechanisms

The above empirical analysis indicates that smart city construction significantly improved green utilization efficiency in the pilot area. So, what are the mechanisms that can improve the green utilization efficiency of urban land in smart cities? Empirical research shows that IT industry development and regional innovation capabilities both have a significant influence on improving green utilization efficiency in smart cities. Smart cities require the support of information industry development, and smart city construction stimulates the demand for emerging industries, which drives information industry development, thereby exponentially accelerating upgrades to the industrial structure and improvement in the efficiency of urban green development. Consequently, smart city construction uses modern IT to promote innovation in the urban development model, which promotes the accumulation of high-level talent, high-tech enterprises, R&D capital, and other elements of innovation, improving local capacities for technological innovation overall, thereby enhancing cities’ core competitiveness and accelerating sustainable development. To put this mechanism to the test, this study draws on the research ideas of Baron and Kenny [57], Papyrakis and Gerlagh [58], and Groizard et al. [59] to test the transmission mechanism of correlation of IT industry development and regional innovation capabilities on the improvement effect of smart cities on green utilization efficiency:
M e d i t = α 0 + φ i T r e a t i × P o s t t + β i X i t + δ t + μ i + ε i t
l n G L E i t = α 0 + γ i T r e a t i × P o s t t + θ i M e d i t + β i X i t + δ t + μ i + ε i t
In the Equations (4) and (5), M e d i t is the mechanism variable representing the two transmission channels of the IT industry development and regional innovation capability improvement effects that impact the role of smart city construction on green utilization efficiency. φ i represents the effect of smart city construction on the mechanism variable; θ i represents the effect of the mechanism variable on smart city construction; and γ i represents the effect of smart city construction on green utilization efficiency after joining the transmission mechanism. The configuration of other variables is consistent with Equation (1). See Table 8 for regression results.
The results of the transmission mechanisms of the IT industry development effect are presented in columns (1)–(2) of Table 8. The coefficient of smart city construction on the IT industry is significantly positive at the 1% level in column (1), i.e., the construction of smart cities can significantly improve the development of the IT industry. The results in column (2) further imply that smart city construction can promote the improvement in the green utilization efficiency of urban land by driving the development of the information industry. The results of the transmission mechanism of the innovation capability improvement effect are presented in columns (3)–(4) of Table 8. The impact coefficient of smart city construction on regional innovation capability is significantly positive at the 1% level in column (3), i.e., smart city construction can significantly promote the improvement of regional innovation capabilities. The results in column (4) further imply that smart city construction can stimulate the green utilization efficiency of urban land by improving regional innovation capabilities.

7. Conclusions and Policy Implications

Smart city construction is a critical measure for improving the quality of Chinese urban development, and the development of a means to accurately assess the impact of smart city construction on improving green utilization efficiency is of practical significance. In light of this, this study uses the DID method to test the effect of smart city construction on the green utilization efficiency of urban land, based on panel data from 285 prefectural-level cities in China from 2004 to 2017. The conclusions of this study indicate the following: (1) Smart city construction significantly improves the green utilization efficiency of urban land, and on average, the improvement rate of green utilization efficiency of urban land is approximately 15%. (2) City-size heterogeneity analysis results show that the larger the city is, the more evident the impact of smart city construction on the green utilization efficiency of urban land is. (3) The city-feature heterogeneity analysis results indicate that smart city construction has a significant effect on improving the green utilization efficiency of urban land in cities with high levels of human capital, financial development, and IT infrastructure, and the effect of urban policy in cities with a high level of financial development is optimal. (4) The investigation of mechanisms reveals that smart city construction can affect the green utilization efficiency of urban land through IT industry development and the regional innovation capability improvement effects.
There are three significant policy implications of these conclusions of this study. First, the government should expand the scale of pilot smart city construction, actively promote the new urban development model, and improve the quality of urban development in China. The government should implement policy regulations, using big data and other innovative resources to the fullest to encourage resource sharing and accelerate smart city construction while also attending to environmental protection and improving the green utilization efficiency of urban land. Second, full consideration should be brought to the heterogeneity of urban development, and smart city construction projects should be carried out according to local conditions, based on factors such as city-scale and urban features. The implementation of smart city construction projects should not entail a “one size fits all” model for all cities, but the priority for implementation should be given to cities that have developed a certain level of human capital, financial development, and IT infrastructure, as smart cities have been shown to exert the best effect in such cities. Third, IT industry development and optimization of the urban industrial structure must be accelerated, while simultaneously leaning on artificial intelligence, cloud computing, and other technologies to advance the level of urban innovation and smart city construction. The government must play an active and positive role as a public service provider, building an innovative platform for research and development, establishing peerless R&D environments for scientific research and innovation and enhance regional innovation capabilities. Moreover, the government should continuously optimize the business environment from the institutional perspective, in an effort to provide institutional guarantees for the continuous development of the IT industry.

Author Contributions

Conceptualization, A.W. and H.W.; methodology, W.L.; software, W.L.; validation, A.W., W.L., B.L., H.W. and H.X.; formal analysis, H.X.; investigation, A.W., B.L. and H.X.; resources, H.W.; data curation, W.L.; writing—original draft preparation, A.W.; writing—review and editing, A.W.; visualization, W.L.; supervision, A.W.; project administration, A.W. and H.X.; funding acquisition, A.W. All authors have read and agreed to the published version of the manuscript.

Funding

This research was funded by National Social Science Fund of China, grant number 16BGL137.

Data Availability Statement

The datasets used and/or analyzed during the current study are available from the corresponding author on reasonable request.

Acknowledgments

The authors would like to thank the anonymous reviewers for their valuable comments.

Conflicts of Interest

The authors declare no conflict of interest.

References

  1. Seyfang, G.; Smith, A. Grassroots innovations for sustainable development: Towards a new research and policy agenda. Environ. Politics 2007, 16, 584–603. [Google Scholar] [CrossRef]
  2. Cartier, C. “Zone fever”, the arable land debate, and real estate speculation: China’s evolving land use regime and its geographical contradictions. J. Contemp. China 2001, 10, 445–469. [Google Scholar] [CrossRef]
  3. Huang, Y.; Yang, D.L. The political dynamics of regulatory change: Speculation and regulation in the real estate sector. J. Contemp. China 1996, 5, 171–185. [Google Scholar] [CrossRef]
  4. Chen, S. Environmental pollution emissions, regional productivity growth and ecological economic development in China. China Econ. Rev. 2014, 35, 171–182. [Google Scholar] [CrossRef]
  5. Martínez-Zarzoso, I.; Maruotti, A. The impact of urbanization on CO2 emissions: Evidence from developing countries. Ecol. Econ. 2011, 70, 1344–1353. [Google Scholar] [CrossRef] [Green Version]
  6. Grossman, G.M.; Krueger, A.B. Economic Growth and the Environment. Q. J. Econ. 1995, 110, 353–377. [Google Scholar] [CrossRef] [Green Version]
  7. Verma, P.; Raghubanshi, A.S. Urban sustainability indicators: Challenges and opportunities. Ecol. Indic. 2018, 93, 282–291. [Google Scholar] [CrossRef]
  8. Krekel, C.; Kolbe, J.; Wuestemann, H. The greener, the happier? The effect of urban land use on residential well-being. Ecol. Econ. 2016, 121, 117–127. [Google Scholar] [CrossRef] [Green Version]
  9. Zhou, Q.; Zhu, M.; Qiao, Y.; Zhang, X.; Chen, J. Achieving resilience through smart cities? Evidence from China. Habitat Int. 2021, 111, 102348. [Google Scholar] [CrossRef]
  10. Silvana, S.; Valerio, B.; Davide, C.; Paolo, B. Towards a hybrid model for the management of smart city initiatives. Cities 2021, 116, 103278. [Google Scholar]
  11. Chen, W.; Ning, S.; Chen, W.; Liua, E.; Wang, Y.; Zhao, M. Spatial-temporal characteristics of industrial land green efficiency in China: Evidence from prefecture-level cities. Ecol. Indic. 2020, 113, 106256. [Google Scholar] [CrossRef]
  12. Martinho, V. Efficiency, total factor productivity and returns to scale in a sustainable perspective: An analysis in the European Union at farm and regional level. Land Use Policy 2017, 68, 232–245. [Google Scholar] [CrossRef]
  13. Xie, H.; Chen, Q.; Lu, F.; Wu, Q.; Wang, W. Spatial-temporal disparities, saving potential and influential factors of industrial land use efficiency: A case study in urban agglomeration in the middle reaches of the Yangtze River. Land Use Policy 2018, 75, 518–529. [Google Scholar] [CrossRef]
  14. Du, J.; Thill, J.C.; Peiser, R.B. Land pricing and its impact on land use efficiency in post-land-reform China: A case study of Beijing. Cities 2016, 50, 68–74. [Google Scholar] [CrossRef]
  15. Desiere, S.; Jolliffe, D. Land productivity and plot size: Is measurement error driving the inverse relationship? J. Dev. Econ. 2018, 130, 84–98. [Google Scholar] [CrossRef] [Green Version]
  16. Wang, Z.; Chen, J.; Zheng, W.; Deng, X. Dynamics of land use efficiency with ecological inter-correlation in regional development. Landsc. Urban Plan. 2018, 177, 303–316. [Google Scholar] [CrossRef]
  17. Hui, E.C.M.; Wu, Y.; Deng, L.; Zheng, B. Analysis on coupling relationship of urban scale and intensive use of land in China. Cities 2015, 42, 63–69. [Google Scholar] [CrossRef]
  18. Chen, W.; Chen, W.; Ning, S.; Liu, E.; Zhou, X.; Wang, Y.; Zhao, M. Exploring the industrial land use efficiency of China’s resource-based cities. Cities 2019, 93, 215–223. [Google Scholar] [CrossRef]
  19. Guastella, G.; Pareglio, S.; Sckokai, P. A spatial econometric analysis of land use efficiency in large and small municipalities. Land Use Policy 2017, 63, 288–297. [Google Scholar] [CrossRef] [Green Version]
  20. Ferreira, M.; Feres, J.G. Farm size and Land use efficiency in the Brazilian Amazon. Land Use Policy 2020, 99, 104901. [Google Scholar] [CrossRef]
  21. Jin, G.; Deng, X.; Zhao, X.D.; Guo, B.S.; Yang, J. Spatio-temporal patterns of urban land use efficiency in the Yangtze River Economic Zone during 2005–2014. Acta Geogr. Sin. 2018, 73, 1242–1252. [Google Scholar]
  22. Jing, L.; Bixia, H.; Kuang, B.; Chen, D. Measuring of urban land use efficiency and its dynamic development in China. Econ. Geogr. 2017, 37, 162–167. [Google Scholar]
  23. Zhou, Y.; Tan, G. Impact of local government competition on the efficiency of urban land use. Areal Res. Dev. 2017, 36, 118–122. [Google Scholar]
  24. Xin, G.; Az, B.; Zs, C. How regional economic integration influence on urban land use efficiency? A case study of Wuhan metropolitan area, China. Land Use Policy 2020, 90, 104329. [Google Scholar]
  25. Yang, C.H.; Wu, L.; Lin, H.L. Analysis of total-factor cultivated land efficiency in China’s agriculture. Agric. Econ. 2010, 56, 231–242. [Google Scholar] [CrossRef]
  26. Zhu, X.; Li, Y.; Zhang, P.; Wei, Y.; Zheng, X.; Xie, L. Temporal–spatial characteristics of urban land use efficiency of China’s 35mega cities based on DEA: Decomposing technology and scale efficiency. Land Use Policy 2019, 88, 104083. [Google Scholar] [CrossRef]
  27. Hanif, I. Impact of economic growth, nonrenewable and renewable energy consumption, and urbanization on carbon emissions in Sub-Saharan Africa. Environ. Sci. Pollut. Res. 2018, 25, 1–11. [Google Scholar] [CrossRef] [PubMed]
  28. Peng, B.B.; Xu, J.H.; Fan, Y. Modeling uncertainty in estimation of carbon dioxide abatement costs of energy-saving technologies for passenger cars in China. Energy Policy 2018, 113, 306–319. [Google Scholar] [CrossRef]
  29. Yang, L.; Ouyang, H.; Fang, K.; Ye, L.; Zhang, J. Evaluation of regional environmental efficiencies in China based on super-efficiency-DEA. Ecol. Indic. 2015, 51, 13–19. [Google Scholar] [CrossRef]
  30. Tao, X.; Wang, P.; Zhu, B. Provincial green economic efficiency of China: A non-separable input-output SBM approach. Appl. Energy 2016, 171, 58–66. [Google Scholar] [CrossRef]
  31. Yu, J.; Zhou, K.; Yang, S. Land use efficiency and influencing factors of urban agglomerations in China. Land Use Policy 2019, 88, 104–113. [Google Scholar] [CrossRef]
  32. Zhu, X.H.; Zhang, P.F.; Wei, Y.G.; Li, Y.; Zhao, H. Measuring the efficiency and driving factors of urban land use based on the DEA method and the PLS-SEM model—A case study of 35 large and medium-sized cities in China. Sustain. Cities Soc. 2019, 50, 101646. [Google Scholar] [CrossRef]
  33. Lu, X.; Chen, D.; Kuang, B.; Zhang, C.; Cheng, C. Is high-tech zone a policy trap or a growth drive? Insights from the perspective of urban land use efficiency. Land Use Policy 2020, 95, 104583. [Google Scholar] [CrossRef]
  34. Wang, P.; Shao, Z.; Wang, J.; Wu, Q. The impact of land finance on urban land use efficiency: A panel threshold model for Chinese provinces. Growth Chang. 2021, 52, 310–331. [Google Scholar] [CrossRef]
  35. Yan, S.; Peng, J.; Wu, Q. Exploring the non-linear effects of city size on urban industrial land use efficiency: A spatial econometric analysis of cities in eastern China. Land Use Policy 2020, 99, 104944. [Google Scholar] [CrossRef]
  36. Chen, Y.; Henderson, J.V.; Cai, W. Political favoritism in China’s capital markets and its effect on city sizes. J. Urban Econ. 2017, 98, 69–87. [Google Scholar] [CrossRef] [Green Version]
  37. Huang, Z.; He, C.; Zhu, S. Do China’s economic development zones improve land use efficiency? The effects of selection, factor accumulation and agglomeration. Landsc. Urban Plan. 2017, 162, 145–156. [Google Scholar] [CrossRef]
  38. Xie, H.; Chen, Q.; Lu, F.; Wang, W.; Yao, G.; Yu, J. Spatial-temporal disparities and influencing factors of total-factor green use efficiency of industrial land in China. J. Clean. Prod. 2019, 207, 1047–1058. [Google Scholar] [CrossRef]
  39. Sun, Y.; Ma, A.; Su, H.; Su, S.; Chen, F.; Wang, W.; Weng, M. Does the establishment of development zones really improve industrial land use efficiency? Implications for China’s high-quality development policy. Land Use Policy 2020, 90, 104265. [Google Scholar] [CrossRef]
  40. Keivani, R.; Mattingly, M.; Majedi, H. Public management of urban land, enabling markets and low-income housing provision: The overlooked experience of Iran. Urban Stud. 2008, 45, 1825–1853. [Google Scholar] [CrossRef]
  41. Osman, T.; Divigalpitiya, P.; Arima, T. Driving factors of urban sprawl in giza governorate of greater cairo metropolitan region using AHP method. Land Use Policy 2016, 58, 21–31. [Google Scholar] [CrossRef]
  42. Barbosa, J.A.; Bragança, L.; Mateus, R. Assessment of land use efficiency using BSA tools: Development of a new index. J. Urban Plan. Dev. 2014, 141, 04014020. [Google Scholar] [CrossRef]
  43. Turnbull, G.K. Irreversible development and eminent domain: Compensation rules, land use and efficiency. J. Hous. Econ. 2010, 19, 243–254. [Google Scholar] [CrossRef]
  44. Wei, Y.D.; Li, H.; Yue, W. Urban land expansion and regional inequality in transitional China. Landsc. Urban Plan. 2017, 163, 17–31. [Google Scholar] [CrossRef]
  45. Kim, J.H. Measuring the containment and spillover effects of urban growth boundaries: The case of the Portland metropolitan area. Growth Chang. 2013, 44, 650–675. [Google Scholar] [CrossRef] [Green Version]
  46. Li, H.; Fang, K.; Yang, W.; Wang, D.; Hong, X. Regional environmental efficiency evaluation in China: Analysis based on the super-SBM model with undesirable outputs. Math. Comput. Model. 2013, 58, 1018–1031. [Google Scholar] [CrossRef]
  47. Verbano, C.; Crema, M. Linking technology innovation strategy, intellectual capital and technology innovation performance in manufacturing SMEs. Technol. Anal. Strateg. Manag. 2016, 28, 524–540. [Google Scholar] [CrossRef]
  48. Caragliu, A.; Del, B. Smart innovative cities: The impact of Smart City policies on urban innovation. Technol. Forecast. Soc. Chang. 2019, 142, 373–383. [Google Scholar] [CrossRef]
  49. Shi, D.Q.; Ding, H.; Wei, P.; Liu, J. Can smart city construction reduce environmental pollution. China Ind. Econ. 2018, 363, 119–137. [Google Scholar]
  50. Tone, K. A slacks-based measure of super-efficiency in data envelopment analysis. Eur. J. Oper. Res. 2002, 143, 32–41. [Google Scholar] [CrossRef] [Green Version]
  51. Meng, Y.; Zhang, F.R.; An, P.L.; Dong, M.L.; Wang, Z.Y.; Zhao, T. Industrial land-use efficiency and planning in Shunyi, Beijing. Landsc. Urban Plan. 2008, 85, 40–48. [Google Scholar] [CrossRef]
  52. Ding, C.; Lichtenberg, E. Land and urban economic growth in China. J. Reg. Sci. 2011, 51, 299–317. [Google Scholar] [CrossRef]
  53. Chen, J.; Gao, M.; Cheng, S.; Hou, W.; Shan, Y. County-level CO2 emissions and sequestration in China during 1997–2017. Sci. Data 2020, 7, 391. [Google Scholar] [CrossRef]
  54. Cao, X.; Deng, M.; Li, H. How does e-commerce city pilot improve green total factor productivity? Evidence from 230 cities in China. J. Environ. Manag. 2021, 289, 112520. [Google Scholar] [CrossRef]
  55. Bertrand, M.; Mullainathan, D.S. How Much Should We Trust Differences-in-Differences Estimates? Q. J. Econ. 2004, 119, 249–275. [Google Scholar] [CrossRef] [Green Version]
  56. Kahn, M.E.; Li, P.; Zhao, D. Water pollution progress at borders: The role of changes in China’s political promotion incentives. Am. Econ. J. Econ. Policy 2015, 7, 223–242. [Google Scholar] [CrossRef] [Green Version]
  57. Baron, R.M.; Kenny, D.A. The moderator-mediator variable distinction in social psychological research: Conceptual, strategic, and statistical considerations. J. Personal. Soc. Psychol. 1986, 51, 1173–1182. [Google Scholar] [CrossRef]
  58. Papyrakis, E.; Gerlagh, R. Resource abundance and economic growth in the United States. Eur. Econ. Rev. 2007, 51, 1011–1039. [Google Scholar] [CrossRef]
  59. Groizard, J.L.; Ranjan, P.; Rodriguez-Lopez, A. Trade costs and job flows: Evidence from establishment level data. Econ. Inq. 2015, 53, 173–204. [Google Scholar] [CrossRef] [Green Version]
Figure 1. Average Efficiency of Each Year. Notes: the horizontal axis represents the year from 2004 to 2017; the vertical axis represents the green utilization efficiency of urban land.
Land 10 00657 g001
Figure 2. Green Utilization Efficiency of Urban Land (GLE) in 2004, 2008, 2013 and 2017.
Land 10 00657 g002
Figure 3. Mean Variation of Green Utilization Efficiency of Urban Land. Notes: the horizontal axis represents the year from 2004 to 2017; the vertical axis represents the green utilization efficiency of urban land.
Land 10 00657 g003
Table 1. Descriptive Statistics.
VariableObs.MeanStd. Dev.MinMax
lnGLE2128−1.1390.534−2.6590.668
Treat21280.2040.40301
Post21280.3570.47901
inf21280.0110.0094.29 × 10−40.201
inno212819.81126.3320.217244.550
lnpgdp21289.3590.5447.66210.842
fdigdp21280.0170.01900.182
sci212816.66216.8380.145193.758
fe21280.6420.2090.2475.613
gov21280.0650.0260.0180.204
Table 2. Correlation Analysis.
VariablelnGLETreatPostlnpgdpFdigdpSciFeGov
lnGLE1.000
treat−0.0261.000
post0.3250.0001.000
lnpgdp0.1000.3850.0811.000
fdigdp−0.0120.200−0.0960.4001.000
sci0.1700.2130.3480.2780.2131.000
fe0.0260.1590.1020.2430.0110.1231.000
gov0.2330.1680.3720.3820.2790.5520.1791.000
Table 3. VIF Test.
Table 3. VIF Test.
VariableDidTreatGovSciLnpgdpPostFdigdpFeMean VIF
VIF1.881.751.731.601.521.501.301.091.55
1/VIF0.530.570.580.630.660.670.770.910.66
Table 4. The impact of smart city construction on green utilization efficiency of urban land.
Variable(1)(2)(3)(4)
lnGLElnGLElnGLElnGLE
Treat × Post0.152 ***0.148 ***
(0.032)(0.032)
Treat × year2005 −0.076
(0.079)
Treat × year2006 −0.021
(0.079)
Treat × year2007 0.073
(0.079)
Treat × year2008 0.020
(0.079)
Treat × year2009 0.027
(0.079)
Treat × year2010 −0.020
(0.079)
Treat × year2011 0.049
(0.079)
Treat × year2012 0.101
(0.079)
Treat × year2013 0.164 ***0.183 **
(0.059)(0.079)
Treat × year2014 0.171 ***0.190 **
(0.059)(0.080)
Treat × year2015 0.172 ***0.191 **
(0.060)(0.080)
Treat × year2016 0.117 *0.136 *
(0.060)(0.080)
Treat × year2017 0.113 *0.133 *
(0.060)(0.080)
lnpgdp 0.434 ***0.434 ***0.443 ***
(0.055)(0.055)(0.055)
fdigdp 0.0820.1100.131
(0.533)(0.534)(0.535)
sci 0.0018 ***0.0018 ***0.0017 ***
(6.568)(6.601)(6.652)
fe −0.072−0.071−0.073
(0.047)(0.047)(0.047)
gov −1.716 ***−1.734 ***−1.753 ***
(0.607)(0.608)(0.609)
_cons−1.173 ***−5.035 ***−5.038 ***−5.113 ***
(0.023)(0.505)(0.506)(0.508)
N2128212821282128
adj. R20.2740.3020.3010.300
City fixed effectsYesYesYesYes
Year fixed effectsYesYesYesYes
Note: Column (4) excludes the policy dummy variables of the base year to avoid collinearity. Values in parentheses are standard deviations, *, **, *** indicate significance at the 10%, 5%, and 1% significance levels, respectively.
Table 5. Robustness Testing.
Variable(1)(2)(3)(4)
PSM-DIDOne-Time-Period Control Variable Lag1–99% Winsorization Exclude the Sample of Provincial Capitals City
lnGLElnGLElnGLElnGLE
Treat × Post0.148 ***0.149 ***0.173 ***0.144 ***
(0.032)(0.032)(0.031)(0.034)
lnpgdp0.434 ***0.345 ***0.213 ***0.409 ***
(0.055)(0.058)(0.053)(0.054)
fdigdp0.082−0.2960.920 *−1.029 *
(0.533)(0.548)(0.549)(0.557)
sci0.0018 ***0.0023 ***0.0016 **0.0013 *
(6.568)(7.152)(7.531)(6.655)
fe−0.072−0.014−0.162 **−0.079 *
(0.047)(0.047)(0.079)(0.047)
gov−1.716 ***−2.392 ***−1.873 ***−1.785 ***
(0.607)(0.612)(0.607)(0.603)
_cons−5.035 ***−4.499 ***−2.656 ***−4.761 ***
(0.505)(0.533)(0.493)(0.502)
N2128197621282030
adj. R20.3020.3290.1710.304
City fixed effectsYesYesYesYes
Year fixed effectsYesYesYesYes
Note: The values in parentheses are standard deviations. *, **, *** indicate significance at 10%, 5%, and 1% levels, respectively.
Table 6. City-size Heterogeneity Analysis.
Variable(1)(2)(3)(4)(5)
Small-Sized CitiesMedium-Sized CitiesLarge-Sized CitiesVery-Large-Sized CitiesMega Cities and Above
PopulationLess than 5050~100≥100100~500>500
(Ten thousand)lnGLElnGLElnGLElnGLElnGLE
Treat × Post1.2090.1680.154 ***0.128 ***0.238 ***
(0.749)(0.173)(0.033)(0.036)(0.063)
lnpgdp2.5150.447 **0.387 ***0.195 ***0.257
(1.829)(0.222)(0.059)(0.060)(0.182)
fdigdp42.6731.9380.001−0.0131.849
(74.705)(1.807)(0.564)(0.566)(1.877)
sci−0.127−0.0010.002 ***26.363 ***0.005 ***
(651.691)(25.105)(7.052)(8.984)(18.581)
fe−0.9330.411−0.071−0.1240.013
(1.778)(0.263)(0.048)(0.095)(0.054)
gov8.2953.945−1.473 **−1.985 ***−0.110
(9.119)(2.827)(0.638)(0.675)(2.146)
_cons−25.601−5.632 **−4.633 ***−2.471 ***−3.808 **
(16.961)(2.141)(0.542)(0.572)(1.661)
N239120141454496
adj. R20.5110.3070.3090.1380.426
City fixed effectsYesYesYesYesYes
Year fixed effectsYesYesYesYesYes
Note: The values in parentheses are standard deviations. **, *** indicate significance at 5%, and 1% levels, respectively.
Table 7. City-Feature Heterogeneity Analysis.
Variable(1)(2)(3)(4)(5)(6)
Human CapitalFinancial DevelopmentInformation Infrastructure
LowHighLowHighLowHigh
Treat × Post−0.196 **0.239 ***−0.0730.310 ***0.0830.191 ***
(0.077)(0.034)(0.056)(0.044)(0.074)(0.036)
lnpgdp0.388 ***0.648 ***0.348 ***0.506 ***0.460 ***0.727 ***
(0.085)(0.073)(0.090)(0.083)(0.084)(0.095)
fdigdp−1.4671.861 ***−0.322−0.148−0.5192.299 ***
(0.985)(0.661)(0.860)(0.747)(0.875)(0.759)
sci0.0030.00040.00070.00120.004 ***−0.0005
(16.909)(6.652)(14.899)(8.239)(13.877)(8.533)
fe−0.121−0.022−0.244 **−0.008−0.170−0.001
(0.116)(0.048)(0.112)(0.053)(0.107)(0.045)
gov0.394−3.345 ***−1.863 *−1.139−0.618−2.435 ***
(0.981)(0.756)(1.001)(0.842)(0.882)(0.923)
_cons−4.488 ***−7.218 ***−4.109 ***−5.762 ***−5.098 ***−7.981 ***
(0.761)(0.700)(0.832)(0.768)(0.763)(0.902)
N106410641064106410641064
adj. R20.1670.4360.2970.2420.0180.412
City fixed effectsYESYESYESYESYESYES
Year fixed effectsYESYESYESYESYESYES
Note: The values in parentheses are standard deviations. *, **, *** indicate significance at 10%, 5%, and 1% levels, respectively.
Table 8. The transmission mechanism test.
Variable(1)(2)(3)(4)
inflnGLEinnolnGLE
Treat × Post0.002 **0.136 ***7.845 ***0.126 ***
(0.001)(0.032)(1.575)(0.032)
inf 7.198 ***
(0.946)
inno 0.003 ***
(0.000)
lnpgdp−0.0010.444 ***−11.349 ***0.465 ***
(0.001)(0.054)(2.654)(0.054)
fdigdp0.026 **−0.10490.528 ***−0.168
(0.013)(0.526)(25.888)(0.530)
sci−0.0000.002 ***0.694 ***−0.000
(0.155)(6.478)(319.206)(7.255)
fe−0.002 *−0.0563.708−0.082 *
(0.001)(0.047)(2.292)(0.047)
gov0.027 *−1.913 ***−94.382 ***−1.455 **
(0.014)(0.599)(29.479)(0.603)
_cons0.023 *−5.202 ***105.817 ***−5.328 ***
(0.012)(0.499)(24.558)(0.503)
N2128212821282128
adj. R2−0.0410.3210.5480.314
City fixed effectsYesYesYesYes
Year fixed effectsYesYesYesYes
Note: The values in parentheses are standard deviations. *, **, and *** indicate significance at the 10%, 5%, and 1% levels, respectively.
Publisher’s Note: MDPI stays neutral with regard to jurisdictional claims in published maps and institutional affiliations.

