Article

Understanding the Characteristics and Realization Path of Urban Land Use Transition in the Bohai Economic Rim: An Analytical Framework of “Dominant–Recessive” Morphology Coupling

1
School of Public Administration and Policy, Shandong University of Finance and Economics, Jinan 250014, China
2
Institute of Regional Economics, Shandong University of Finance and Economics, Jinan 250014, China
3
School of Economics, Shandong University of Finance and Economics, Jinan 250014, China
*
Author to whom correspondence should be addressed.
Land 2021, 10(5), 493; https://doi.org/10.3390/land10050493
Submission received: 9 April 2021 / Revised: 1 May 2021 / Accepted: 3 May 2021 / Published: 6 May 2021
(This article belongs to the Special Issue Efficient Land Use and Sustainable Urban Development)

Abstract

:
Taking the Bohai Economic Rim as the research area and 44 prefecture-level cities as research objects, on the basis of deepening the connotation of urban land use morphology, we constructed a multi-dimensional indicator system for urban land use transition based on the dominant and recessive morphologies of land use. The patterns of change and transition type are described by single-morphology and comprehensive morphology indices, respectively, while a decoupling elastic coefficient model was used to analyze the coupling relationship and evolution process between the dominant and recessive morphologies of urban land use. The results showed the following: (1) From 2000 to 2020, the single-morphology and comprehensive morphology indices of urban land use in the Bohai Economic Rim both improved, to a certain extent. Overall, the transition types of dominant and recessive morphologies of urban land use showed a development trend, in which the degree of recessive morphology transition was higher than the degree of dominant morphology transition, and the spatial difference of its distribution pattern was obvious. (2) From 2000 to 2020, the type of coupling relationship between the dominant and recessive morphologies of urban land use in the Bohai Economic Rim experienced an evolution, from a single-morphology recession decoupling to a single-morphology leading positive hook. The whole region was in the benign development stage of close coupling, where the degree of transition showed the spatial characteristics of Beijing–Tianjin–Hebei > Liaodong Peninsula > Shandong Peninsula. (3) Differences in the economic levels and urbanization processes of different cities led to different paths, speeds, and degrees of urban land use transition, showing stable, volatile, and non-transition paths. The direct influence of different influencing factors, as well as their potential effects, drive the dominant and recessive morphologies of urban land use to grow, in terms of coupling and synergy, promoting the realization of urban land use transition.

1. Introduction

Land change science has become an important part of global environmental change and sustainable development research [1]. As an important branch of land use/land cover change (LUCC), and as a guiding factor in response strategies and policies aimed at the side effects of high-speed urban expansion [2,3,4], land use transition has gradually developed into the current hot frontier of land change research. Land use transition originated from the forest transition hypothesis [5,6]. Grainger proposed the concept of land use transition from the perspective of national land use morphology [7]. After entering the 21st century, domestic and foreign scholars, such as DeFries, Foley, and Long, among others, have proposed improvements and supplements [8,9,10,11]. Since then, the field of land use transition research has continued to expand. The scope of such research includes the impacts of land use transition in agricultural production [12,13], the driving mechanisms of land use transition [14,15,16,17], the relationships between land use transition and urbanization [18,19], and the impacts of land use transition on the ecological environment [20,21,22,23]. Thus, the research field tends to be diversified.
With improvement at the socioeconomic level and the advancement of urbanization, importance had been attached to sustainable development [24,25], while land resources continue to be allocated to nonagricultural industries [26]. The transition of rural homesteads along the Yangtze River transects [27], along with the transition of cities in the New Orleans and Phoenix urban governances, which have foreshadowed this [28]. More and more studies have begun to pay attention to construction land transition, including the transition of urban–rural construction land and its coupling with population mobility [29], rural–industrial land transition [30], and rural–residential land transition [31,32]; however, various environmental pollution problems have been directly or indirectly caused by the accelerated expansion of construction land, such as air pollution [33] and water pollution [34]. These environmental problems originate from complex economic activities, for which a traditional qualitative analysis cannot obtain accurate results. For this reason, scholars have attempted to use a combination of big data collection technology and quantitative analysis methods for analysis through the use of remote sensing, geographic information systems, and other technical means and have explained that urban land use transition has exacerbated urban disasters and environmental pressures, introduced the conceptual framework of impact assessment for urban land use transition, and discussed the temporal and spatial evolutional characteristics of the ecological environment index [35,36,37]. Following these developments, an approach has been extended to the impact of land use transition on the entire ecosystem [38].
After land use transition was introduced in China, as a new way to study LUCC, Long continued to deepen the concept and connotation of land use transition from a theoretical perspective and proposed two land use morphologies—that is, the dominant morphology and the recessive morphology [39]. Scholars have carried out research based on these two morphologies of land use, such as analyzing the transition stage and spatial pattern for the scale change of urban construction land on a national scale [40], detecting the hotspot characteristics of the dominant morphology transition of urban land use on the regional scale [41,42], or revealing the characteristics of the recessive morphology transition of urban land use from a single dimension (e.g., function or input–output) [43,44,45]. Overall, the current research on urban land use transition has mainly focused on the analysis of a single morphology of land use or the related description based on certain numerical values. There has been less research on the comprehensive transition of urban land use, especially considering a combination of qualitative and quantitative analysis-phase processes or the trends of urban land use transition inflection points.
Land is the main place where humans produce and live and is an important carrier with which for cities to carry out socioeconomic activities. Urban land use transition can reflect the changes in human activities and the direction of urban development and, to a certain extent, can reveal the various pain points and problems in the socioeconomic development process. At present, China is in a critical period of transition, from high-speed urban expansion to high-quality development [46]. The way in which to achieve the harmonious development of the human–land–society system and to solve the difficulty of a land supply and demand balance have become the top priority in land resource management. Therefore, land management concepts and utilization methods need to be changed urgently. Under the premise of achieving the goal of sustainable urban development, it is of great significance to analyze the change process and transition characteristics of urban land use in order to determine the optimal urban land use and urban green development in the future. The comprehensive judgment of urban land use transition is helpful in describing the transition process and phase characteristics from more dimensions. In order to make up for the shortcomings of urban land use transition along this line, this study used the Bohai Economic Rim with its rapid urbanization and obvious differences as the research object, depicted the trend changes of the dominant and recessive morphologies of urban land use, and used the decoupling elastic coefficient model to further discuss the coupling relationship between the dominant and recessive morphologies and revealed the evolution path and its spatial and temporal patterns of urban land use transition. The theoretical framework of this study serves to supplement and enrich the ideas presented in existing land management research relating to the integration of land use morphology to provide a scientific reference for promoting high-quality urban development and to promote the formulation of land management policies.

2. Theoretical Framework

Land use transition refers to the change of land use morphology in a certain region over a certain period of time, usually corresponding to a social and economic development stage. With the continuous deepening and expansion of the concept of land use transition, Long stated that land use morphology can be characterized by dominant and recessive morphologies. Specifically, the dominant morphology includes the directly visible quantities, spatial structures, and so on, while the recessive morphology includes the qualities, property rights, inputs, outputs, operational modes, and functions of the land [38]. As the spatial carrier of human life and production, urban land has the basic properties, in terms of scale, structure, and function, of general land resources. At the same time, compared to rural land—due to differences in land properties, location, conditions, population, and industries—cities reflect an alienated morphology with inherent characteristics, such as the nationalization of urban land, clear property rights, and a fixed operational mode for a long time. The development of population urbanization promotes the continuous expansion of urban space on a large scale, dense urban population, strong service capacity, a high degree of spatial agglomeration, diverse urban industrial types, complex land structures, and high output efficiency, among other characteristics. Therefore, urban land use morphologies are both general and specific. In terms of the dominant morphology, considering that cities are typically embedded in vast arable land, their rapid expansion process has formed different spatial patterns in different geographical environments, demonstrating obvious visibility. The dominant morphology can, thus, be measured from the scale, structure, and pattern of urban land use. With the proposal of the new concept of “People’s City Built by the People, People’s City for the People”, it is to be understood that urban construction and development are increasingly developing in a people-oriented direction, where the living standard of urban residents has become an important direction to consider when assessing the urbanization quality. At the same time, in the process of rapid urban expansion, urban ecological land becomes squeezed, and urban ecological functions may be severely damaged. As it is an ecological space, concern and attention regarding maintaining and conserving urban green environments are ever increasing. Therefore, in terms of the comprehensive input and output of the production factors, land management methods, life, and ecology, the perspectives of urban high-quality development, urban production, and living and ecological qualities are used to represent the recessive morphology, revealing the potential for urban sustainable development from multiple viewpoints.
Chinese cities are now undergoing rapid development and transition. Due to the phased effect of a series of driving factors, such as population migration, industrial structure upgrading, ecological security, and policy regulation, urban land use presents the characteristics of multi-type and multi-path transitions (Figure 1). In the early stage of urban development (T1), when urbanization and industrialization have just started, a city is considered a “simple industrial production center”. The urban scale develops in an uncontrolled and irregular manner, the urban land structure is unreasonable, and the urban construction land presents a fragmented and decentralized pattern in space. The urban quality development is slow, and housing shortages, inadequate infrastructure construction, environmental pollution, and other “urban diseases” emerge and worsen, as the requirements for the living environment and ecological maintenance are not high. During this period, the urban scale, structure, pattern, and quality level are in their initial stages, such that coordinated changes of the dominant and recessive morphologies show a negative trend, and the transition momentum is insufficient. Later, due to the acceleration of urbanization and industrialization (T2), the urban boundary continues to spread to the periphery, and a large number of people begin to gather in the city. The urban land structure is mostly industrial and residential land, where the newly added urban construction land is mainly used to fill the internal gaps in the existing urban land. The city begins to pay attention to problems such as degradation of the ecological environment and insufficient infrastructure. The differences in the emphasis and centers of economic growth of different cities inevitably lead to the phenomenon of focusing on the development of the dominant or recessive morphology, such that it becomes easy to shift the dominant or recessive morphology to move toward the first positive development stage, while the other morphology is still in the decline stage. Consequently, the gap between the two grows, and the relationship between the two falls into a stage of confrontation. With socioeconomic transition and industrial optimization and upgrading (T3), the city gradually develops into a new type of “multi-form and multi-functional” living space. The scale evolves from expansion to a slower (or even stagnant) trend, the structure becomes more reasonable and coordinated, the diversity of the land use is constantly enriched, and the quality of the living environment is improved. During this period, the dominant and recessive morphologies of urban land use gradually approach a coordinated development trend as the gap between the two continuously reduces, showing a continuous coordinated urban–rural development trend. Due to the differences in the actual conditions of specific cities, the development processes of the dominant and recessive morphologies of urban land use present a differentiated transition path in different cities, which is either gradually promoted or “in one step”. Therefore, in this study, we used the method of identifying the coupling relationship between the dominant and recessive morphologies to describe the characteristics of urban land use transition; that is, urban land use transition is the transition process of the dominant and recessive morphologies of urban land use from an imbalanced state to coordinated development. This process helps to realize the gradual strengthening of the carrying capacity of the city, creating a more reasonable structure, a more compact pattern, and a continuous improvement of quality.

3. Study Area Selection, Data Sources, and Processing

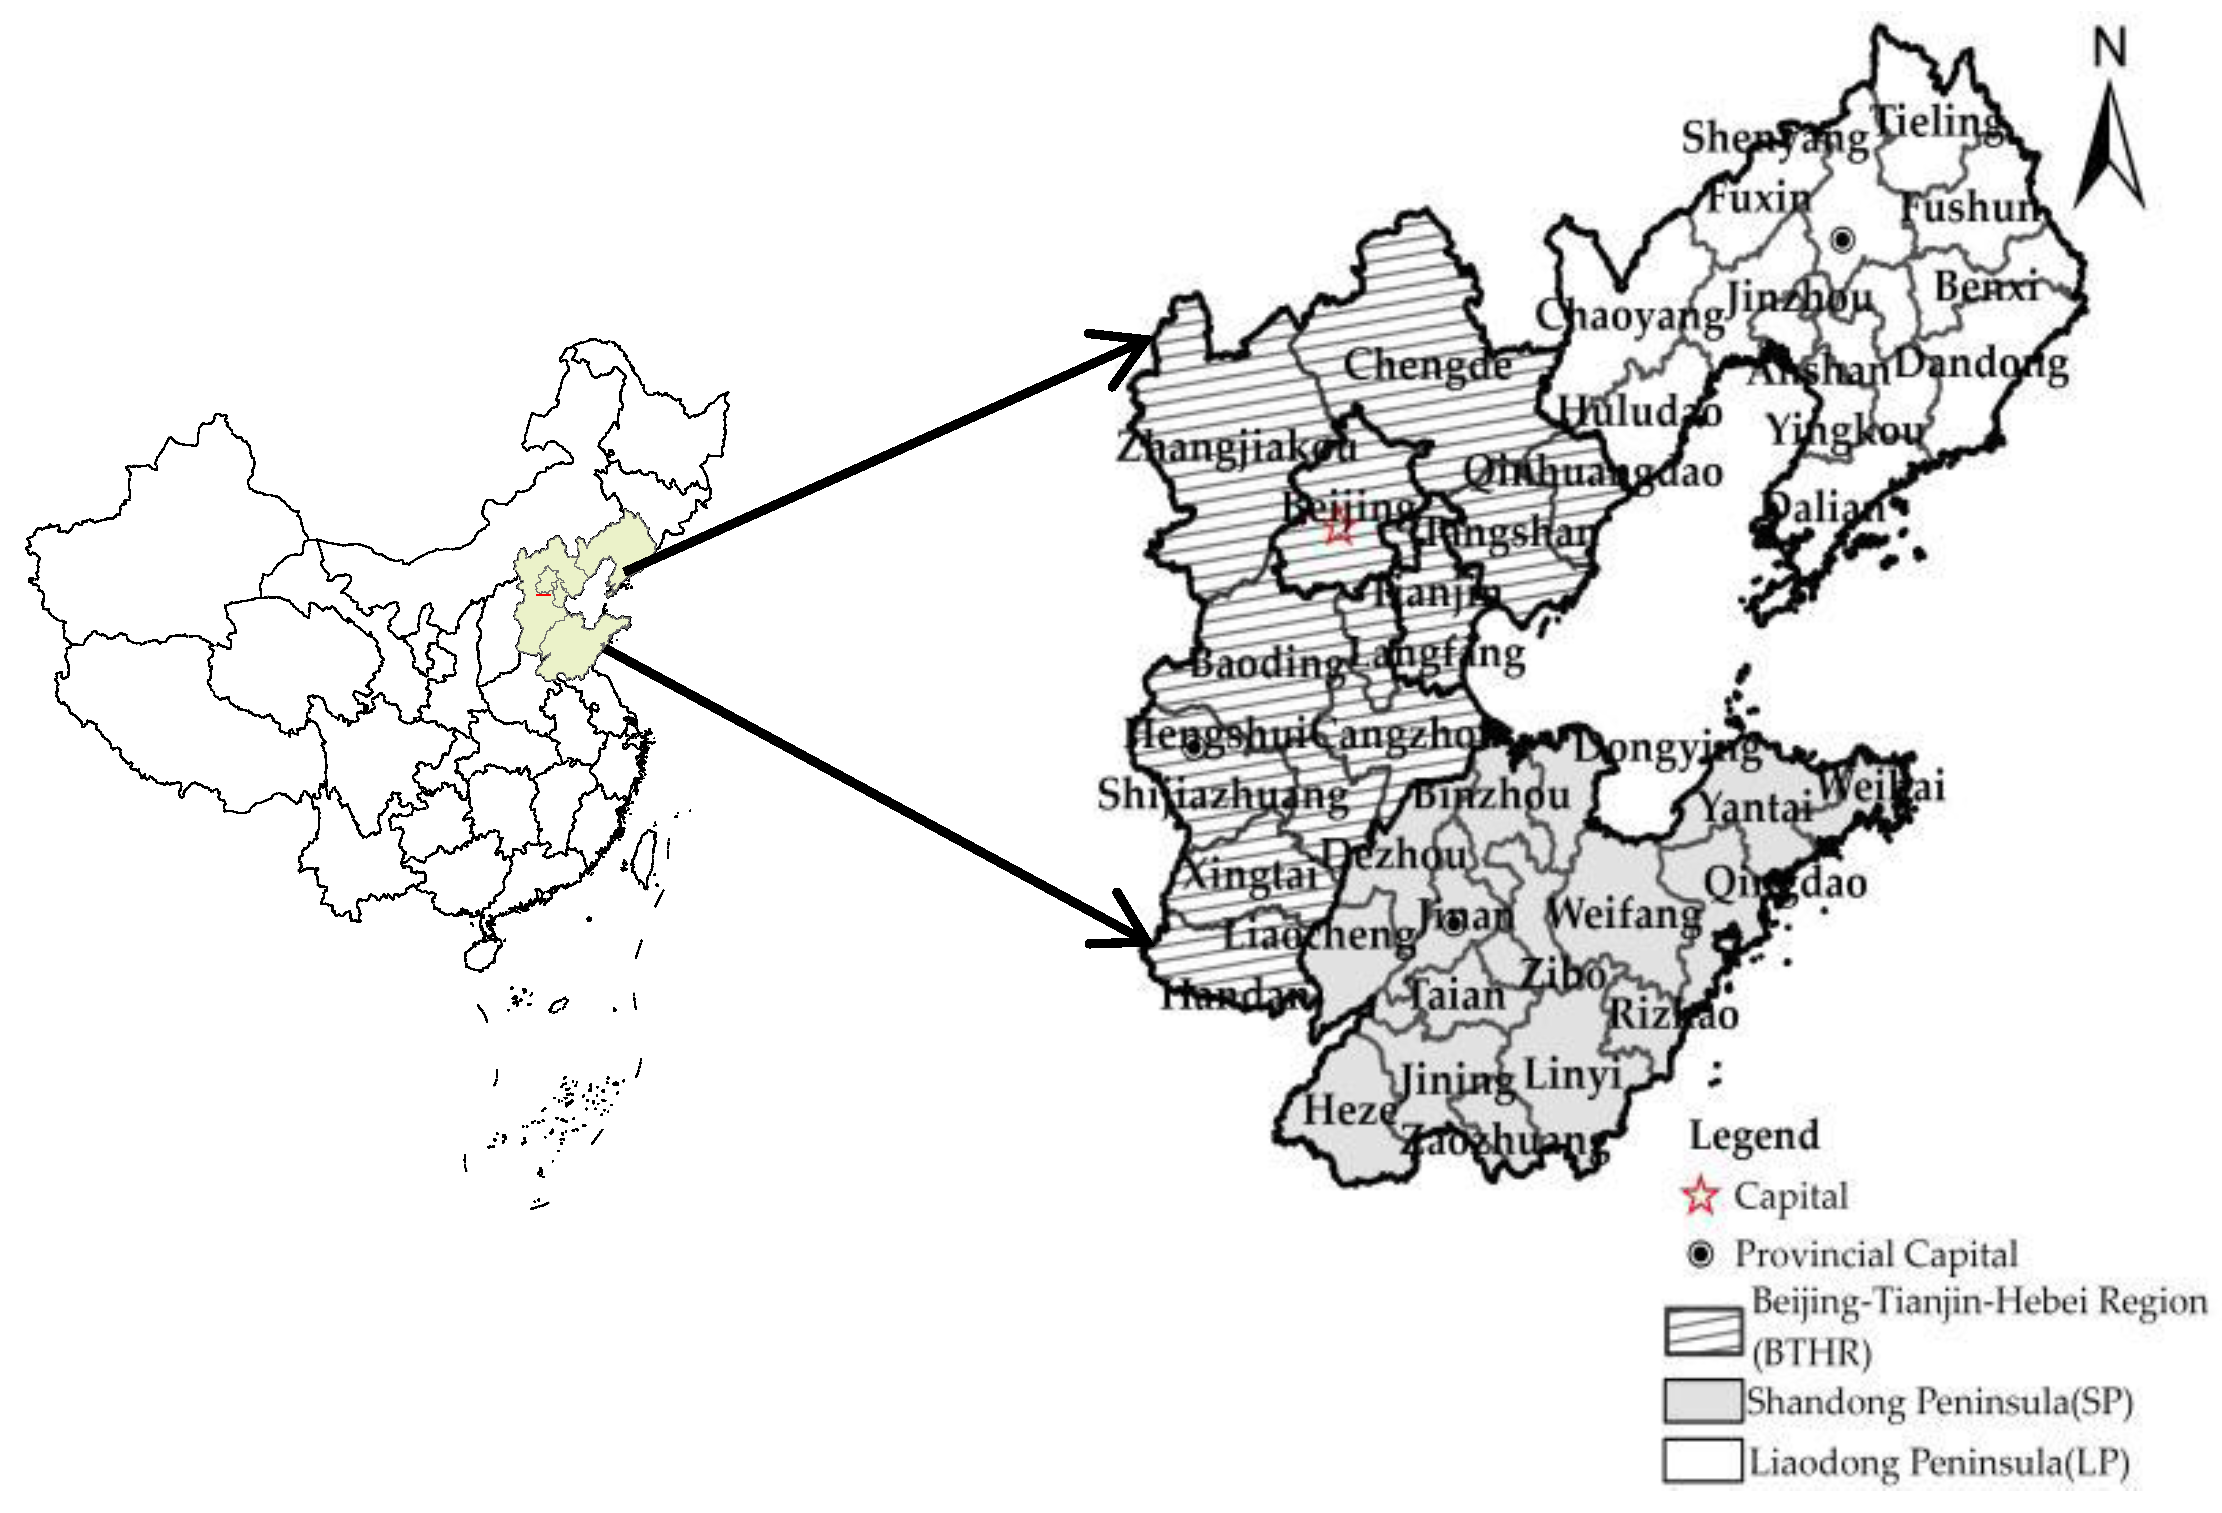
3.1. Study Area Selection

The Bohai Economic Rim refers to the economic area composed of the coastal areas surrounding the entire Bohai Sea and part of the Yellow Sea [47], including Liaoning Province, Hebei Province, Shandong Province, Beijing, and Tianjin, with convenient regional transportation and obvious locational advantages (see Figure 2). There are approximately 260 million people in the region, and its land area accounts for approximately 12% of the country. In 2020, the GDP of the region accounted for 18.5% of the country. As the center of China’s reform and opening up (gradually moving eastward) and global production factors (which have continued to move northward), the Bohai Economic Rim has become the third-largest growth pole of China’s economic growth, after the Pearl River Delta and the Yangtze River Delta [48], and is the most important open emerging economic circle in Northern China, integrating political, economic, cultural, and foreign trade development. At present, urban development in the Bohai Economic Rim is undergoing a drastic transition, and the level of urbanization is continually increasing. The urbanization rate of the population increased from 22.83% in 1986 to 65.34% in 2020, making it one of the fastest-growing regions in China at this stage. The land space that carries human activities has also shown dramatic changes. The scale of urban construction land increased from 2733 km2 in 1986 to 12,935 km2 in 2020, while the rate of land urbanization increased from 1.86% in 1986 to 15.46% in 2020 (which was obviously higher than that of the population urbanization). The scale of land development and utilization is large but unreasonable. At the same time, there still exist problems relating to uneven urban development in the Bohai Economic Rim. For example, Beijing’s per capita GDP is nearly four times that of Hebei Province. As a dense urban region and a priority development area, the Bohai Economic Rim has a high population density, severe resource and environmental pressures, intensified economic activities, and a shortage of reserve land resources. They way in which to improve the economical and intensive utilization of the land and to promote sustainable development are the core issues affecting the realization of high-quality development in the Bohai Economic Rim. Therefore, it is necessary and representative to carry out research on urban land use transition in the Bohai Economic Rim, where the contradiction between humanity and land is prominent.

3.2. Data Sources and Processing

In this study, we used 44 prefecture-level and above cities in the Bohai Economic Rim as a research object. We considered their connection with the five-year plan for national economic development; as such, five time nodes—in 2000, 2005, 2010, 2015, and 2020—were selected as the research period. Different data on the land use, spatial layout, and socioeconomic development of each city over this period were collected. Among these, the land use data included information on the scale and structure of urban land use, while the socioeconomic development data included information relating to the population, industries, and construction of facilities, mainly derived from the “China Urban Construction Statistical Yearbook” and the “China City Statistical Yearbook”. The urban pattern data included the location change information of city map spots during the study period, which were mainly derived from the 30-m resolution remote sensing image interpretation data of the Resource and Environmental Science Data Center of the Chinese Academy of Sciences (http://www.resdc.cn/, accessed on 5 May 2021), from which the city map spots were extracted. Fragstats software was used to calculate the pattern indices of each city map spot for the different periods. On this basis, we looked at 44 urban administrative regions as the basic units and used the ArcGIS spatial attribute link function to synthesize all kinds of information in order to form a basic database of urban land use transition data.

4. Research Methods

Based on the understanding of the above urban land use transition theory, the basic research methods of this study are shown in the figure below (Figure 3).

4.1. Selection of Transition Indicators

Based on the above understanding and theoretical assumptions about the transition process of the dominant and recessive morphologies of urban land use, and on the basis of the principles of comprehensiveness, representativeness, and data availability, an evaluation index system for the dominant and recessive morphologies of urban land use was constructed, referring to the relevant literature in combination with the actual situation of the study area (Table 1). The dominant morphology was described from three aspects: scale, structure, and pattern. The scale index was based on the principle of improving the carrying service capacity and restraining disorderly expansion. Based on the total urban land scale, the two indicators of urban land scale increment and average amount were extended to measure the transition characteristics of the relationship between urban and rural construction land and the urban human–land relationship, including three indicators: the urban built-up area, the proportion of newly increased urban construction land area to the total increased urban and rural construction land area, and the population per urban construction land unit area. The structure, considered the external mapping of urban system functions, determines the integrity of the urban functions and supporting facilities. We selected the residential; administration and public services; industrial and manufacturing; roads, streets, and transportation; and green space and square proportions as the five indicators representing structure, in accordance with the “Urban Land Classification and Planning Construction Land Standard” (GB50137-2011; referred to below as “Standards”). The proportions of all kinds of land used, as stipulated in the “Standards” specification, were designated as the ideal values (Table 2), while the actual proportion of urban land used was set as the actual value. By calculating the difference between the actual value and the ideal value, the rationality of the urban land use structure could be comprehensively judged. The pattern is a comprehensive reflection of the process of human production and those living activities promoting urban spatial expansion under certain environmental conditions. This process changes the size, shape, density, and connectivity of an urban area under the interaction of multi-scale spatial composition and the arrangement of the urban matrix and is regarded as a key indicator for understanding the multifunctional aspects of the urban system. Based on the principles of landscape ecology, four classic indicators—namely, area, landscape shape index, patch density, and contiguity index of the urban land—were selected to reveal the compactness and clustering of the pattern.
The recessive morphology of urban land use was expressed in three aspects: production quality, living quality, and ecological quality. The production quality, as an observed value reflecting the degree of economic development of a city, is an inexhaustible driving force and source of urban development and transition. Considering the high efficiency of urban economic output, excellent industrial structure, and fiscal revenue, we selected the per capita GDP, proportion of nonagricultural industry output value, per capita investment in fixed assets, and per capita public budget revenue as the four indicators representing the production quality. The living quality reflects the people-oriented living space, emphasizing the livability and security of the city, as well as the promotion of thought and civilization in the population. Considering urban life, wealth, medical, educational, and other public service resource configurations, we selected the annual per capita disposable income of urban households, per capita expenditure on science and education, number of doctors per ten thousand people, and per capita area of paved roads in the city as the four indicators representing the living quality. The ecological quality is a background aspect related to urban transition, upgrading, and sustainability. Urban land use plays a decisive role in maintaining and protecting ecosystem services [49]. Considering the degree of urban greening, garbage disposal, and pollution levels of green coverage, we selected the built district green space rate and comprehensively utilized the industrial solid wastes rate, wastewater treatment rate, and domestic garbage treatment rate as the four indicators representing the ecological quality.

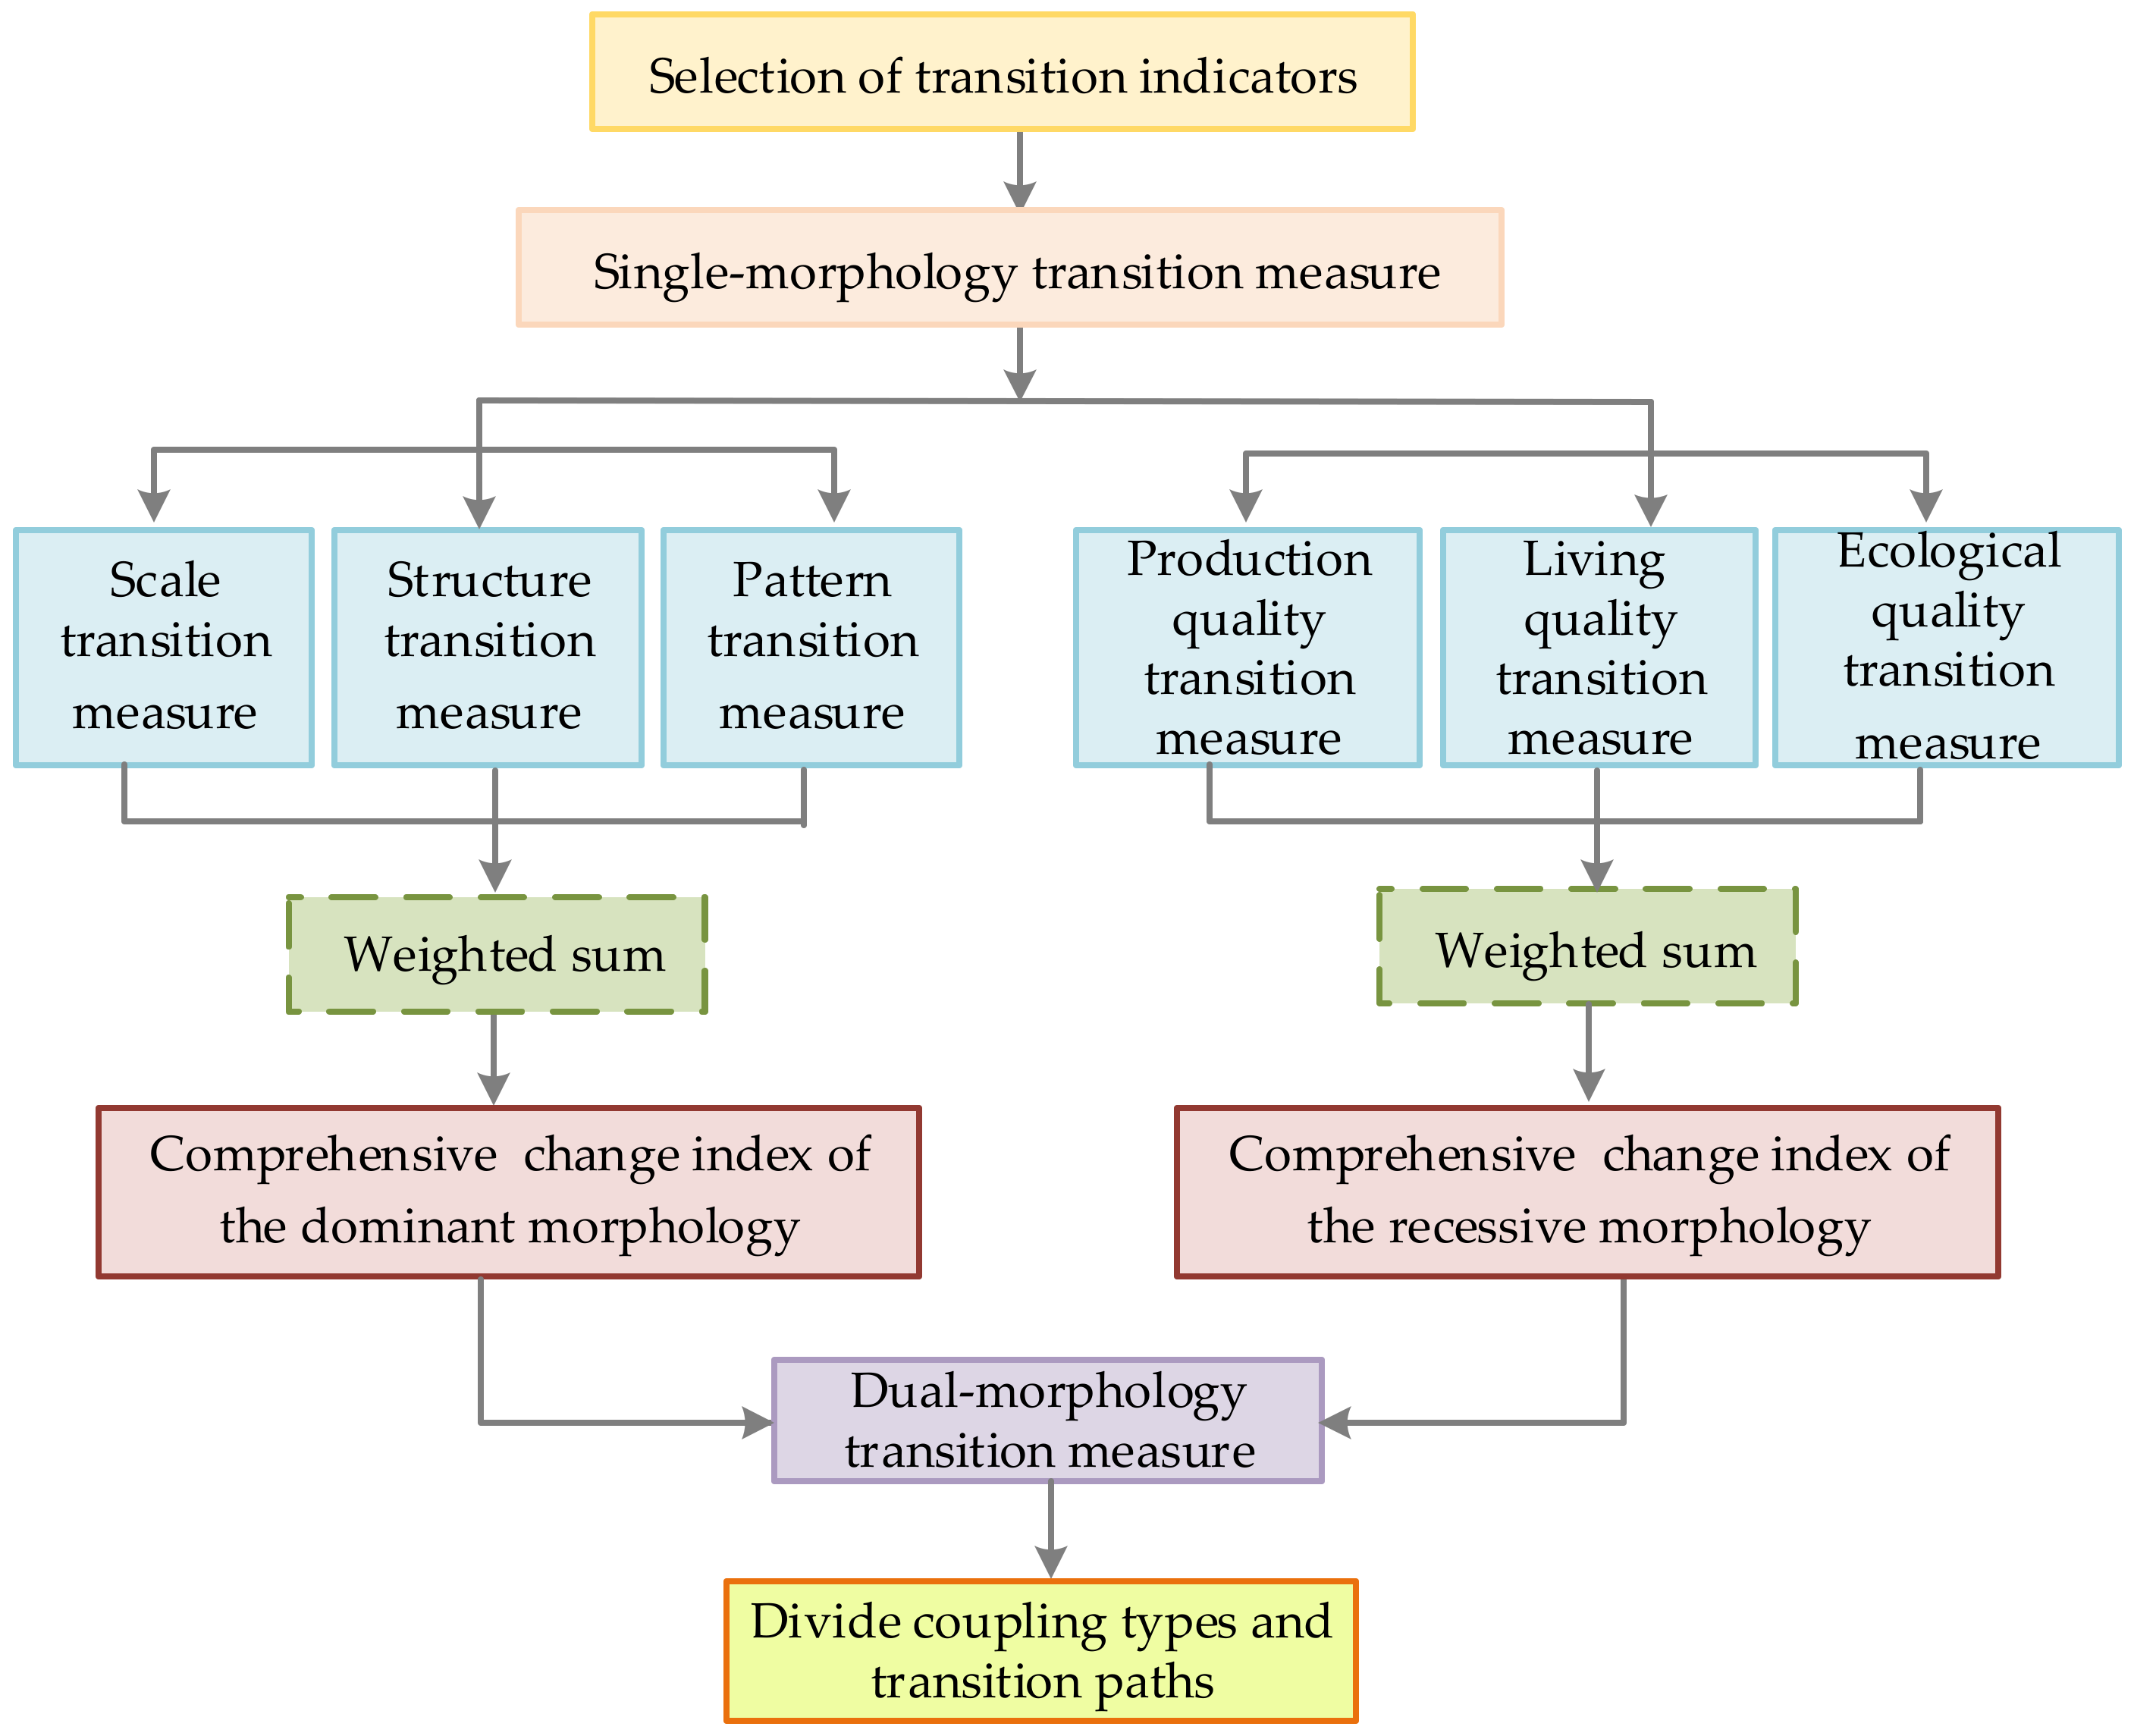
4.2. Transition Measurement Method

4.2.1. Single-Morphology Transition Measure

Both the dominant and recessive morphologies were measured using the multi-factor weighted sum method. First of all, considering the different indicators that characterize the urban land use transition process, as there are certain differences between them, different standardized methods should be used to normalize the indicators. Among them, the scale transition aims to continuously improve the carrying capacity of a city, and the various indicators show positive effects. Thus, the positive range standardization method (Formula (1)) was used for normalization. The structure transition aims at the rationality of land use allocation, where each indicator has a certain reasonable interval. Thus, a piecewise function (Formula (3)) was used for standardization. The pattern aims to make the urban space transition more compact and regular. All indicators show positive and negative interactions, and, so, the positive and negative range standardization methods (Formulas (1) and (2)) were used for normalization. The quality transition is aimed at high-level coordination, and all the indicators have a positive effect. Thus, the positive range standardization method (Formula (1)) was used for normalization. Then, according to the characteristics of the indicators, the weights were set. The structure adheres to the principle of balanced and diversified proportions of all kinds of construction land, so the weight was set as the same proportion. For the size, pattern, production quality, living quality, and ecological quality, the entropy value method was used to determine the initial weight of each index [50]. Due to the large time span of the study period and the large fluctuations in the developmental speeds of the cities in the study area, the average value of the initial weights for each period was used as the final weight of each indicator in order to reduce the degree of difference in the development levels of the different periods. Finally, Formula (4) was used to calculate the one-dimensional indices of the scale, structure, pattern, production quality, living quality, and ecological quality, while Formula (5) was used to calculate the comprehensive index of the dominant and recessive morphologies of the urban land use.
x i j = x i j x i , min x i , max x i , min
x i j = x i , max x i j x i , max x i , min
where x i j is the standardized score of index j in element layer i; x i j is the original score of index j in element layer i; x i , min and x i , max are the minimum and maximum scores of index j in element layer i, respectively; i represents the element layer, taking the values of 1, 2, and 3, which represent the scale, structure, and pattern, respectively, of the dominant morphology of urban land use and the production quality, living quality, and ecological quality, respectively, of the recessive morphology of urban land use; and j represents the index of each element layer, taking the values of 1, 2, 3,…, n.
x i j = x i j x i , min , x i j < x i , min 1 , x i , min < x i j < x i , max x i , max x i j , x i , max < x i j
In Formula (3), the connotations of x i j , x i j , i, and j are the same as above; x i , min and x i , max are the minimum and maximum values of the ideal value interval of index j in element layer i, which mainly correspond to the area proportions of various urban land use structures. The specific score values are shown in Table 2.
T d i j = i = 1 n x i j × w i j
where T d i j is the score of each element layer of the dominant and recessive morphologies of urban land use, the connotation of x i j is the same as above, and w i j is the index weight value of item j of the element layer i (see Table 1).
T k = α T d k 1 + β T d k 2 + γ T d k 3
where T k is the comprehensive index of the dominant and recessive morphologies of urban land use; k represents the dominant and recessive morphologies, with values of 1 and 2, respectively; T d k i is the scores of the element layer i of target layer k, respectively; and α, β, and γ represent the weight of each element layer, respectively (Table 1).
For each single and comprehensive index, according to its change trends and procedural characteristics in different periods, the types of transitions were divided into four types: stable, relatively stable, relatively unstable, and non-transition. A stable transition refers to the process of a continuous increase in the morphology index. A relatively stable transition refers to a process in which the morphology index fluctuates a little in the early stage and tends to increase in the later stage. A relatively unstable transition refers to the fact that, although the index tends to increase in the end, the whole process fluctuates more frequently. A non-transition refers to the fact that the various morphology indices are still lower than the initial point in the final period, regardless of whether the process continues or fluctuates.

4.2.2. Dual-Morphology Transition Measure

A dual-morphology transition refers to the evolution of the relationship between the dominant and recessive morphologies in terms of urban land use. On the basis of references to the relevant domestic and foreign literature [51,52], the decoupling elastic coefficient model (Formula (6)) was used to identify the coupling and transition process of two morphologies:
I d = Δ T e Δ T h = ( T e t T e t 1 ) T e t ( T h t T h t 1 ) T h t
where ID is the decoupling index of the dominant and recessive morphology of urban land use, ΔTe is the comprehensive change rate of the dominant morphology of urban land use, ΔTh is the comprehensive change rate of the recessive morphology of urban land use, Tet is the comprehensive index of the dominant morphology of urban land use at time point t, Tet−1 is the comprehensive index of the dominant morphology of urban land use at time point t − 1, Tht is the comprehensive index of the recessive morphology of urban land use at time point t, and Tht−1 is the comprehensive index of the recessive morphology of urban land use at time point t − 1.
As can be seen from Table 3 and Figure 4, the coupling relationship between the two morphologies theoretically included six types, the transition process had seven paths, and there were also some non-transition phenomena.
From the perspective of coupling types (Table 3), the relationship between the dominant and recessive morphology evolution of urban land use can be divided into two types: decoupling and hook. Decoupling means that the two morphologies are in a state of confrontation. At this time, Id < 0, and the urban land use transition is in an uncoordinated state. Decoupling can be divided into two types: dominant recession decoupling (DRD) and recessive recession decoupling (RRD). The former is characterized by ΔTe < 0 and ΔTh > 0, indicating that the dominant morphology index of urban land use is decreasing, the recessive morphology index of urban land use is increasing, and the transition of the dominant morphology needs to be strengthened; for the latter, ΔTe > 0 and ΔTh < 0, indicating that the dominant morphology index of urban land use is increasing, the recessive morphology index of urban land use is decreasing, and the transition of the recessive morphology needs to be strengthened. Hook means that the two morphologies are in a coordinated change state of increase and decrease. At this time, Id > 0, and, according to the direction of change, it can be divided into a positive hook and negative hook. When ΔTe < 0 and ΔTh < 0, it means that both the dominant and recessive morphologies of urban land use show a trend of decay, which is defined as the dominant and recessive negative hook (DRNH). At this time, an urban land use transition has not yet occurred. When ΔTe > 0 and ΔTh > 0, according to the relationship between the two, it can be divided into a dominant and recessive synergy hook (DRSPH) and dominant or recessive leading positive hook (RLPH or DLPH, respectively). The former is characterized by 0.8 ≤ ID ≤ 1.2, and, at this time, the growth rates of the dominant and recessive morphologies of urban land use are coordinated, which indicates the highest state of urban land use transition. In the latter case, either ID > 1.2 or 0 < ID < 0.8. At this time, both the dominant and recessive morphologies of urban land use are in a state of growth, but the growth rate is different, which indicates the transition type of urban land use transition from uncoordinated to coordinated.
From the perspective of the transition path (Figure 4), according to the above-mentioned coupling types, a certain area needs to realize the coordinated transition of the dominant and recessive morphology of urban land use. The evolution stage generally needs to undergo a transition process from DRND to DRSPH. However, due to different urban background conditions and influencing factors in different regions, the urban land use transition path can be divided into long and short. The long path goes through three types of evolution—namely, the primary transition from DRND to RRD or DRD, then to RLPH (or the transitional transition of DLPH), and, finally, to DRSPH—in order to achieve full transition (called the LP path). The medium path undergoes two evolution types to achieve transition, including DRND to RRD or DRD and then to DRSPH (called the MP1 path), DRND to RLPH or DLPH and then to DRSPH (called the MP2 path), and RRD or DRD to RLPH or DLPH and then to DRSPH (called the MP3 path). The short path undergoes one evolution type to achieve transition, including from DRND to DRSPH (called the SP1 path), RRD or DRD to DRSPH (called the SP2 path), and RLPH or DLPH to DRSPH (called the SP3 path). At the same time, the sequences of different paths to achieve transition are also different, which can be divided into stable paths and fluctuating paths. The former involves reaching type A step-by-step and remaining unchanged after the transition is realized, while the latter involves the process of reaching DRSPH. Comparing the twists and turns or turning to other types after reaching DRSPH is called an unstable transition path (called UP path). In addition, some cities have not yet reached DRSPH after multiple types of evolution and are still in the state of RLPH, DLPH, RRD, or DRD, staying in a transitional stage dominated by a single dominant or recessive morphology, which is called an incomplete transition path (IP path). This study sets up a collection of the initials that appear in the Appendix A (Table A1).

5. Results

5.1. The Transition Process of the Dominant Morphology of Urban Land Use

The overall level of the Bohai Economic Rim was obtained by adding the values of 44 cities to get the mean value, while the average level of each region was obtained by adding the values of the cities where each region is located to get the mean value. Judging from the average level of the Bohai Economic Rim as a whole and the three regions of Beijing–Tianjin–Hebei, Shandong Peninsula, and Liaodong Peninsula (Figure 5), the one-dimensional and comprehensive indices of the dominant morphology of urban land use from 2000 to 2020 generally presented a fluctuating and rising trend. Among them, the size index of the Bohai Economic Rim decreased slightly from 2000 to 2010 but increased significantly from 2015. The trend for the Beijing–Tianjin–Hebei region was similar to that of the Bohai Economic Rim. The trend for the Shandong Peninsula decreased slightly at first and then continued to increase. The trend for the Liaodong Peninsula fluctuated greatly and increased significantly, compared with that in the initial stage. The structure index of the Bohai Economic Rim and its three regions showed a continuous upward trend, where the Liaodong Peninsula was always stable at the highest level. The pattern index of the Bohai Economic Rim continued to decline from 2000 to 2015, only beginning to improve in 2015, with little fluctuation as a whole. The Beijing–Tianjin–Hebei and Liaodong Peninsula presented similar ups and downs within the Bohai Economic Rim. Although the Liaodong Peninsula rebounded, it did not exceed the initial level. Although there were slight fluctuations in the Shandong Peninsula, the overall situation was accelerated. The comprehensive index of the dominant morphology of urban land use in the Bohai Economic Rim showed a gradual increase in volatility from 2000 to 2015, where the acceleration increased after 2015. The Beijing–Tianjin–Hebei and Shandong Peninsula, as a whole, showed an upward trend, while the Liaodong Peninsula presented fluctuations that were relatively sharp and at a low level. From 2000 to 2020, the carrying capacities of the cities in the Bohai Economic Rim were strengthened, the ratio of urban land structure was reasonable and balanced, the pattern of urban land was compact and regular, and the dominant morphology of the urban land use developed positively and harmoniously.
Based on the above-mentioned overall analysis of the transition of the dominant morphology of urban land use, in order to further reveal the specific urban transition process and its regional agglomeration characteristics, an in-depth analysis of the spatial layout of the transition of the dominant morphology of urban land use was carried out. From the perspective of each city scale, the spatial pattern characteristics of the dominant morphological transition types of urban land use in the Bohai Economic Rim from 2000 to 2020 were obvious (Figure 6). The stable transition of scale mainly occurred in Beijing, Tianjin, and the developed coastal cities of Shandong Peninsula. These cities, as metropolitan areas with a relatively developed economic level, tended to have stabilized urbanization processes and paid more attention to improving their quality. Relatively stable transitions were scattered in the Liaodong Peninsula, with a small number concentrated in the west of Beijing–Tianjin–Hebei and Central Shandong Peninsula. Most of these cities were emerging cities that have continued to gather urban populations, the outer edges of which have continued to expand outward in recent years. Under the impetus of their internal driving forces, the sizes of these cities constantly expand. Relatively unstable transitions were scattered in the northern part of the Liaodong Peninsula and on both sides of Jinan. Such cities have had a late start to urbanization, gradually developing secondary and tertiary industries or promoting the construction of new urban areas. The problems of urban expansion and inefficient utilization coexist, and the transition process is not stable. Non-transitions are mainly distributed in the north and south of Beijing–Tianjin–Hebei and sporadically appear in Zibo and Zaozhuang on the Shandong Peninsula. Such cities are basically inland, with weak economic foundations, insufficient driving force for industrial development, and lack of a driving force or ability for urban expansion.
Stable transitions of structures mainly occur in provincial capital cities. Such cities are basically cities with early urbanization, where the types of urban infrastructure construction lands are complete and diverse, and the urban land structure has a high degree of balance. The relatively stable transitions are concentrated in the central part of Beijing–Tianjin–Hebei, Eastern Liaodong Peninsula, and Western Shandong Peninsula. Such cities are subject to policies and their own development needs, constantly improving their urban functions and weakening the leading role of single dominant land types, such that urban land use diversification can be sustainably promoted. The relatively unstable transitions are mostly distributed in Northern Beijing–Tianjin–Hebei and in small parts of Shandong Peninsula and Liaodong Peninsula. Such cities are mostly old industrial bases or traditional agricultural areas, with historical factors making the level of urban land use structures balanced and policy-oriented, with a time lag hindering their smooth transitions. Non-transitions are scattered in the three major regions in cities with less-developed economies, such as Chaoyang and Langfang. Industrial and mining land and residential land occupy a relatively high proportion of the interior of these cities. It is necessary to strengthen the policy control and guidance, improve the proportion of urban construction land, and increase the area of infrastructure and ecological land in these areas.
The stable transition of patterns only occurs in the northeast and west of Shandong Peninsula. In recent years, Shandong Province has expanded its urban construction land to form a contiguous development pattern [12]. At the same time, it has paid more attention to the reshaping of the urban landscape, gradually increasing the concentration of urban internal landscape, with most patches having a higher degree of morphological integration and the urban pattern becoming more compact and regular. The relatively stable transitions are concentrated in the central part of Beijing–Tianjin–Hebei and the central part of Shandong Peninsula. Most of these cities are located in provincial capitals and the surrounding cities. Influenced by policy and political factors, they have inevitably paid more attention to the regular appearance of a city. Most of the relatively unstable transitions are located in the central part of Liaodong Peninsula. As an old, heavy, industry base, industrial relics and idle lands are the main reasons for the fragmentation of the urban landscape pattern. Non-transitions mainly occur on the east and west sides of Liaodong Peninsula and the west of Beijing–Tianjin–Hebei. The blind and extensive development of such cities in urban expansion have led to fragmentation of the landscape pattern and irregular patch shapes. It is urgent to change the development concept and to reduce the degree of fragmentation of the landscape pattern and, thus, the degree of patch separation.
The stable transitions of the dominant morphology of urban land use occur in Beijing, Fushun, Tai’an, and Weihai. Most of these cities are in the stage of rapid urbanization development, such that the land use structure and spatial layout are constantly improved, while the urban construction land expands. Large areas of relatively stable transitions are appearing in the Liaodong Peninsula and the central and western regions of Beijing–Tianjin–Hebei, where most cities rely on policy support to attract capital to settle in, and the dominant morphology of urban land use has achieved long-term development under the promotion of internal and external factors. Most of the relatively unstable transitions are located in Northern Beijing–Tianjin–Hebei and the southern and central parts of Shandong Peninsula. This is due to the slow urbanization processes of small- and medium-sized cities, caused by geographical and other conditions, resulting in a relatively weak increase in the dominant morphology of urban lands. Non-transitions are scattered in the cities with slow urbanization in the three major regions. These cities have relatively backward industrial systems, a poor ability to attract capital, and insufficient motivation for the transition of the dominant morphology of urban land.

5.2. The Transition Process of the Recessive Morphology of Urban Land Use

Judging from the average level of the Bohai Economic Rim as a whole and the three regions of Beijing–Tianjin–Hebei, Shandong Peninsula, and Liaodong Peninsula (see Figure 7), the overall situations of the one-dimensional and comprehensive indices of the recessive morphology of urban land use from 2000 to 2020 improved. The production quality index of the Bohai Economic Rim gradually rose after a slight decline in the initial stage. The directions of Beijing–Tianjin–Hebei and Shandong Peninsula were similar to that of the Bohai Economic Rim. The Liaodong Peninsula continued to rise, accelerating the forward trend such that its final level was equal to that of Beijing–Tianjin–Hebei. The living quality index in the Bohai Economic Rim rose, amidst gradual fluctuations. Beijing–Tianjin–Hebei and Shandong Peninsula “made great progress” along the way, where their indices and growth rates exceeded the overall level of the Bohai Economic Rim; however, the growth of Liaodong Peninsula was the weakest, remaining at a low level. The ecological quality index of the Bohai Economic Rim increased sharply at the initial stage, then fell and rose. That of Shandong Peninsula fluctuated at a higher level, while Beijing–Tianjin–Hebei and Liaodong Peninsula showed rapid increases from their initially low levels. In the end, the differences between the three major regional indices were relatively small. As the comprehensive index of the Bohai Economic Rim was at a high level, the index rose slowly, while the three major regions all presented a steady upward trend. From 2000 to 2020, the social production capacity of the Bohai Economic Rim was efficient and of high quality, with the living standards continuously improving, the urban ecological environment also continuously improving, and the development capacity of the recessive morphology of urban land use being continuously enhanced.
Based on the above-mentioned overall analysis of the transition of the recessive morphology of urban land use, in order to further reveal the specific urban transition process and its regional agglomeration characteristics, an in-depth analysis of the spatial layout of the transition of the recessive morphology of urban land use was carried out. From the perspective of each city scale, the spatial heterogeneity of the recessive morphology transition types of urban land use in the Bohai Economic Rim from 2000 to 2020 were obvious (see Figure 8). In addition, the living quality and the ecological quality showed non-transition characteristics, except for the production quality in Beijing–Tianjin–Hebei. Stable transitions of the production quality were concentrated in the provincial capital cities. These cities relied on their own policy advantages and geographic conditions to achieve sustainable development within their social and economic levels. Relatively stable transitions were scattered in Beijing–Tianjin–Hebei and Shandong Peninsula. These cities were facing new economic situations, working hard to break through their own constraints, seeking development breakthroughs, and experienced gradually improving social productivity and economic capabilities. Most of the relatively unstable transitions were embedded in the surroundings of relatively stable transition cities. Due to the constraints of geographical location or inadequate development conditions, the urban economic production capacity was relatively weak, and the production capacity was susceptible to interference from external factors. Non-transition only occurred in Tangshan and Binzhou. The original extensive industrial development model was unable to effectively provide the driving force for production, where industrial structure optimization and other aspects of transition and upgrading are urgently needed.
Stable transitions of the living quality were scattered in areas close to the provincial capital cities. In recent years, with the advancement of ecological construction and the improvement of the quality of life of urban residents, for a provincial capital city, the construction of a livable city has become the key direction of urban living space optimization. Relatively stable transitions ran through Liaodong Peninsula. With the improvement of the living standards, the yearning for livable cities has become more obvious and, in response, the government has continuously improved the comfort and atmosphere of urban life. Relatively unstable transitions were concentrated in the western part of Beijing–Tianjin–Hebei and large areas in the middle and western parts of Shandong Peninsula. Due to low social and economic productivity, most cities have not paid enough attention to the spiritual lives of residents or the construction of service spaces. Therefore, it is necessary to continue to improve the living environment, living quality, and life happiness of the residents in these areas.
Stable transitions of the ecological quality were concentrated in Beijing, Tianjin and the western and southern parts of Liaodong Peninsula. The good ecological quality of these cities is related to increases in the protection of ecological lands and the strict implementation of ecological policies, such as restricting the development of high-emission and high-polluting enterprises. Relatively stable transitions were scattered between areas of stable and relatively unstable transitions. Most of these cities are tourist cities or close to the sea, with good urban ecological environments. Most of the relatively unstable transitions were located in the central part of Beijing–Tianjin–Hebei and Central and Western Shandong Peninsula. Most of these cities are inland, with a relatively high proportion of industrial industries, such that it is difficult to solve the problem of urban pollution. Therefore, it is necessary to strengthen the management of urban ecological spaces and improve the ecological environment quality in these areas.
Stable transitions of the recessive morphology of urban land use were mostly distributed in the provincial capital cities and the western part of Shandong Peninsula. Such cities had obvious first-mover advantages, where the continuous settlement of key national projects has continued to improve their economic development, living standards, and ecological environmental quality. Relatively stable transitions were scattered in Northern Beijing–Tianjin–Hebei and Central Liaodong Peninsula. Most of these cities were in a critical period of improving urbanization or trying to improve their own development constraints, attracting a large number of laborers to leave agriculture and enter secondary and tertiary industries. The level has changed, and the “production–living–ecological space” has been continuously optimized. The relatively unstable transitions were mainly concentrated in the central part of Beijing–Tianjin–Hebei and the northwestern part of Shandong Peninsula. The urbanization of these cities started relatively late, the functions of the cities are not complete, and the quality of these cities has not been significantly improved.

5.3. Coupling Characteristics of the Dominant and Recessive Morphology of Urban Land Use

5.3.1. Overall Coupling Characteristics

The coupling relationship between the dominant and recessive morphologies of urban land use in the Bohai Economic Rim became more and more distinct, showing a trend of centralized and optimized development. It can be seen from Table 4 that the number of coupling types of the dominant and recessive morphologies of urban land use in the Bohai Economic Rim on the whole, from 2000 to 2020, evolved from six to four (DRSPH, PLPH, DLPH, and DRD), where the proportions of the corresponding cities were 20.45%, 31.82%, 36.36%, and 11.36%, respectively, among which more than four out of five cities showed a positive relationship between the dominant and recessive morphologies of urban land use, indicating that most cities in the Bohai Economic Rim had dominant and recessive morphologies of urban land use that were growing more and more synchronized. At the same time, a very small number of cities were still in a state where the dominant and recessive morphologies of urban land use were not coupled. From the perspective of phased changes, the coupling type of the dominant and recessive morphologies of urban land use in the Bohai Economic Rim shifted from recession decoupling to dominant positive hook; that is, PLPH and DLPH accounted for the highest proportions. DRND, which characterized the co-decay of the dominant and recessive morphologies of urban land use, disappeared in T2. RRD, with quality degradation as the main state, disappeared in T4. DRD continued to decrease, indicating that the Bohai Economic Rim had solved the dilemma of the degradation and development of the dominant and recessive morphologies, and, at the same time, it was breaking away from the situation of the two constraints. The number of DRSPH cities in a coupled state continued to increase, from one in 2000 to nine in 2020, indicating that cities in the Bohai Economic Rim achieving urban land use transition continued to appear, and that the growth of the dominant and recessive morphologies of urban land use tended to balance out.

5.3.2. Local Coupling Feature Comparison

The coupling types of the dominant and recessive morphologies of urban land use in the Bohai Economic Rim are complex and diverse. From Figure 9, DRSPH, which was in a coupled state from 2000 to 2020, first appeared in Beijing–Tianjin–Hebei, then appeared in various regions and showed an upward trend. The number of RLPH and DLPH cities in a transition state increased in each region, indicating that the cities in each region were transitioning from a noncoupled state to a coupled state. The number of DRD and RRD cities in the uncoupled state indicate that the three regions tended to increase first and then decrease. Uncoupled DRND cities only appeared in Beijing–Tianjin–Hebei and Shandong Peninsula and then disappeared. The dominant and recessive morphology coupling types of urban land use in the Bohai Economic Rim had spatial agglomeration characteristics that tended to become better.
Based on the above-mentioned overall analysis of the coupling types of the dominant and recessive morphologies of urban land use, in order to further reveal the specific urban transition process and its regional agglomeration characteristics, an in-depth analysis of the spatial layout of the coupling types of the dominant and recessive morphologies of urban land use was carried out. From Figure 10, the core cities (e.g., Beijing, Tianjin, and Jinan) were in the DRSPH from 2000 to 2020. The RLPH was concentrated northeast of Liaoning Peninsula, the west of Beijing–Tianjin–Hebei, and the middle of Shandong Peninsula. The DLPH was mainly distributed in the central part of Liaodong Peninsula, the north and south of Beijing–Tianjin–Hebei, and the western part of Shandong Peninsula. A few peripheral cities located in more economically developed areas, such as the core cities, were in the DRD.
The subregional Beijing–Tianjin–Hebei coupling-type evolution showed the core cities driving the spatial patterns of ascension around the city, presenting patterns similar to concentric circles. Under the influence of the core cities, such as Beijing, Hebei Province broke through its own developmental restrictions, in addition to Tangshan entering the DLPH and RLPH transitional states in 2015. This was mainly due to the advancement of the Beijing–Tianjin–Hebei coordinated development strategy during the “Twelfth Five-Year Plan” period, which promoted in-depth linkage and complementary advantages between the cities. The core cities played significant radial driving roles, which significantly improved the quality of the regional urban development. The evolution process of the coupling types in Shandong Peninsula showed an economic gradient, where the economically developed cities, such as Qingdao, took the lead in transforming to DRSPH. Some less economically developed cities in Central and Western Shandong Peninsula were in the stage of transforming from a decoupling state to a transition state. This spatial pattern was related to the important order of urban development. Due to its natural geographical and transportation advantages, the coastal city of Qingdao has a high degree of opening to the outside world. The expansion of the urban land scale and the improvement of land use efficiency go hand-in-hand. The transition and upgrading of industrial technology constantly stimulate employment; promote consumption; and improve the urban economic level, infrastructure services, and living environment. As the provincial capital, Jinan itself possessed political resource advantages and had a good industrial foundation and urban development environment. Meanwhile, in inland western and central cities, industrialization and urbanization started relatively late, and urban expansion was accompanied by development issues, such as low-utility land, chaotic land structure, the imperfect construction of a modern industrial system, and the hindrance of urban development, resulting in the distribution of the dominant and recessive morphology coupling relationship in Shandong Peninsula, having obvious spatial-stage characteristics. The change processes of the coupling types in Liaodong Peninsula showed diversity and tended to be better than in Shandong Peninsula. The northern cities fluctuated repeatedly in the transitional and uncoupled states, while most of the southern cities showed a continuous tendency to become better. This is closely related to the country’s continued efforts to promote the comprehensive revitalization of Northeast China and focus on the construction of the Shenzhen–Dalian Economic Belt and another four economic belts during the “Twelfth Five-Year Plan” period. A large amount of capital moved into these areas, which promoted the expansion of the urban land scale, the optimization and upgrading of Liaodong Peninsula industries, and diversification and balancing of the construction land types, with consequent continuous improvements in the urban quality.

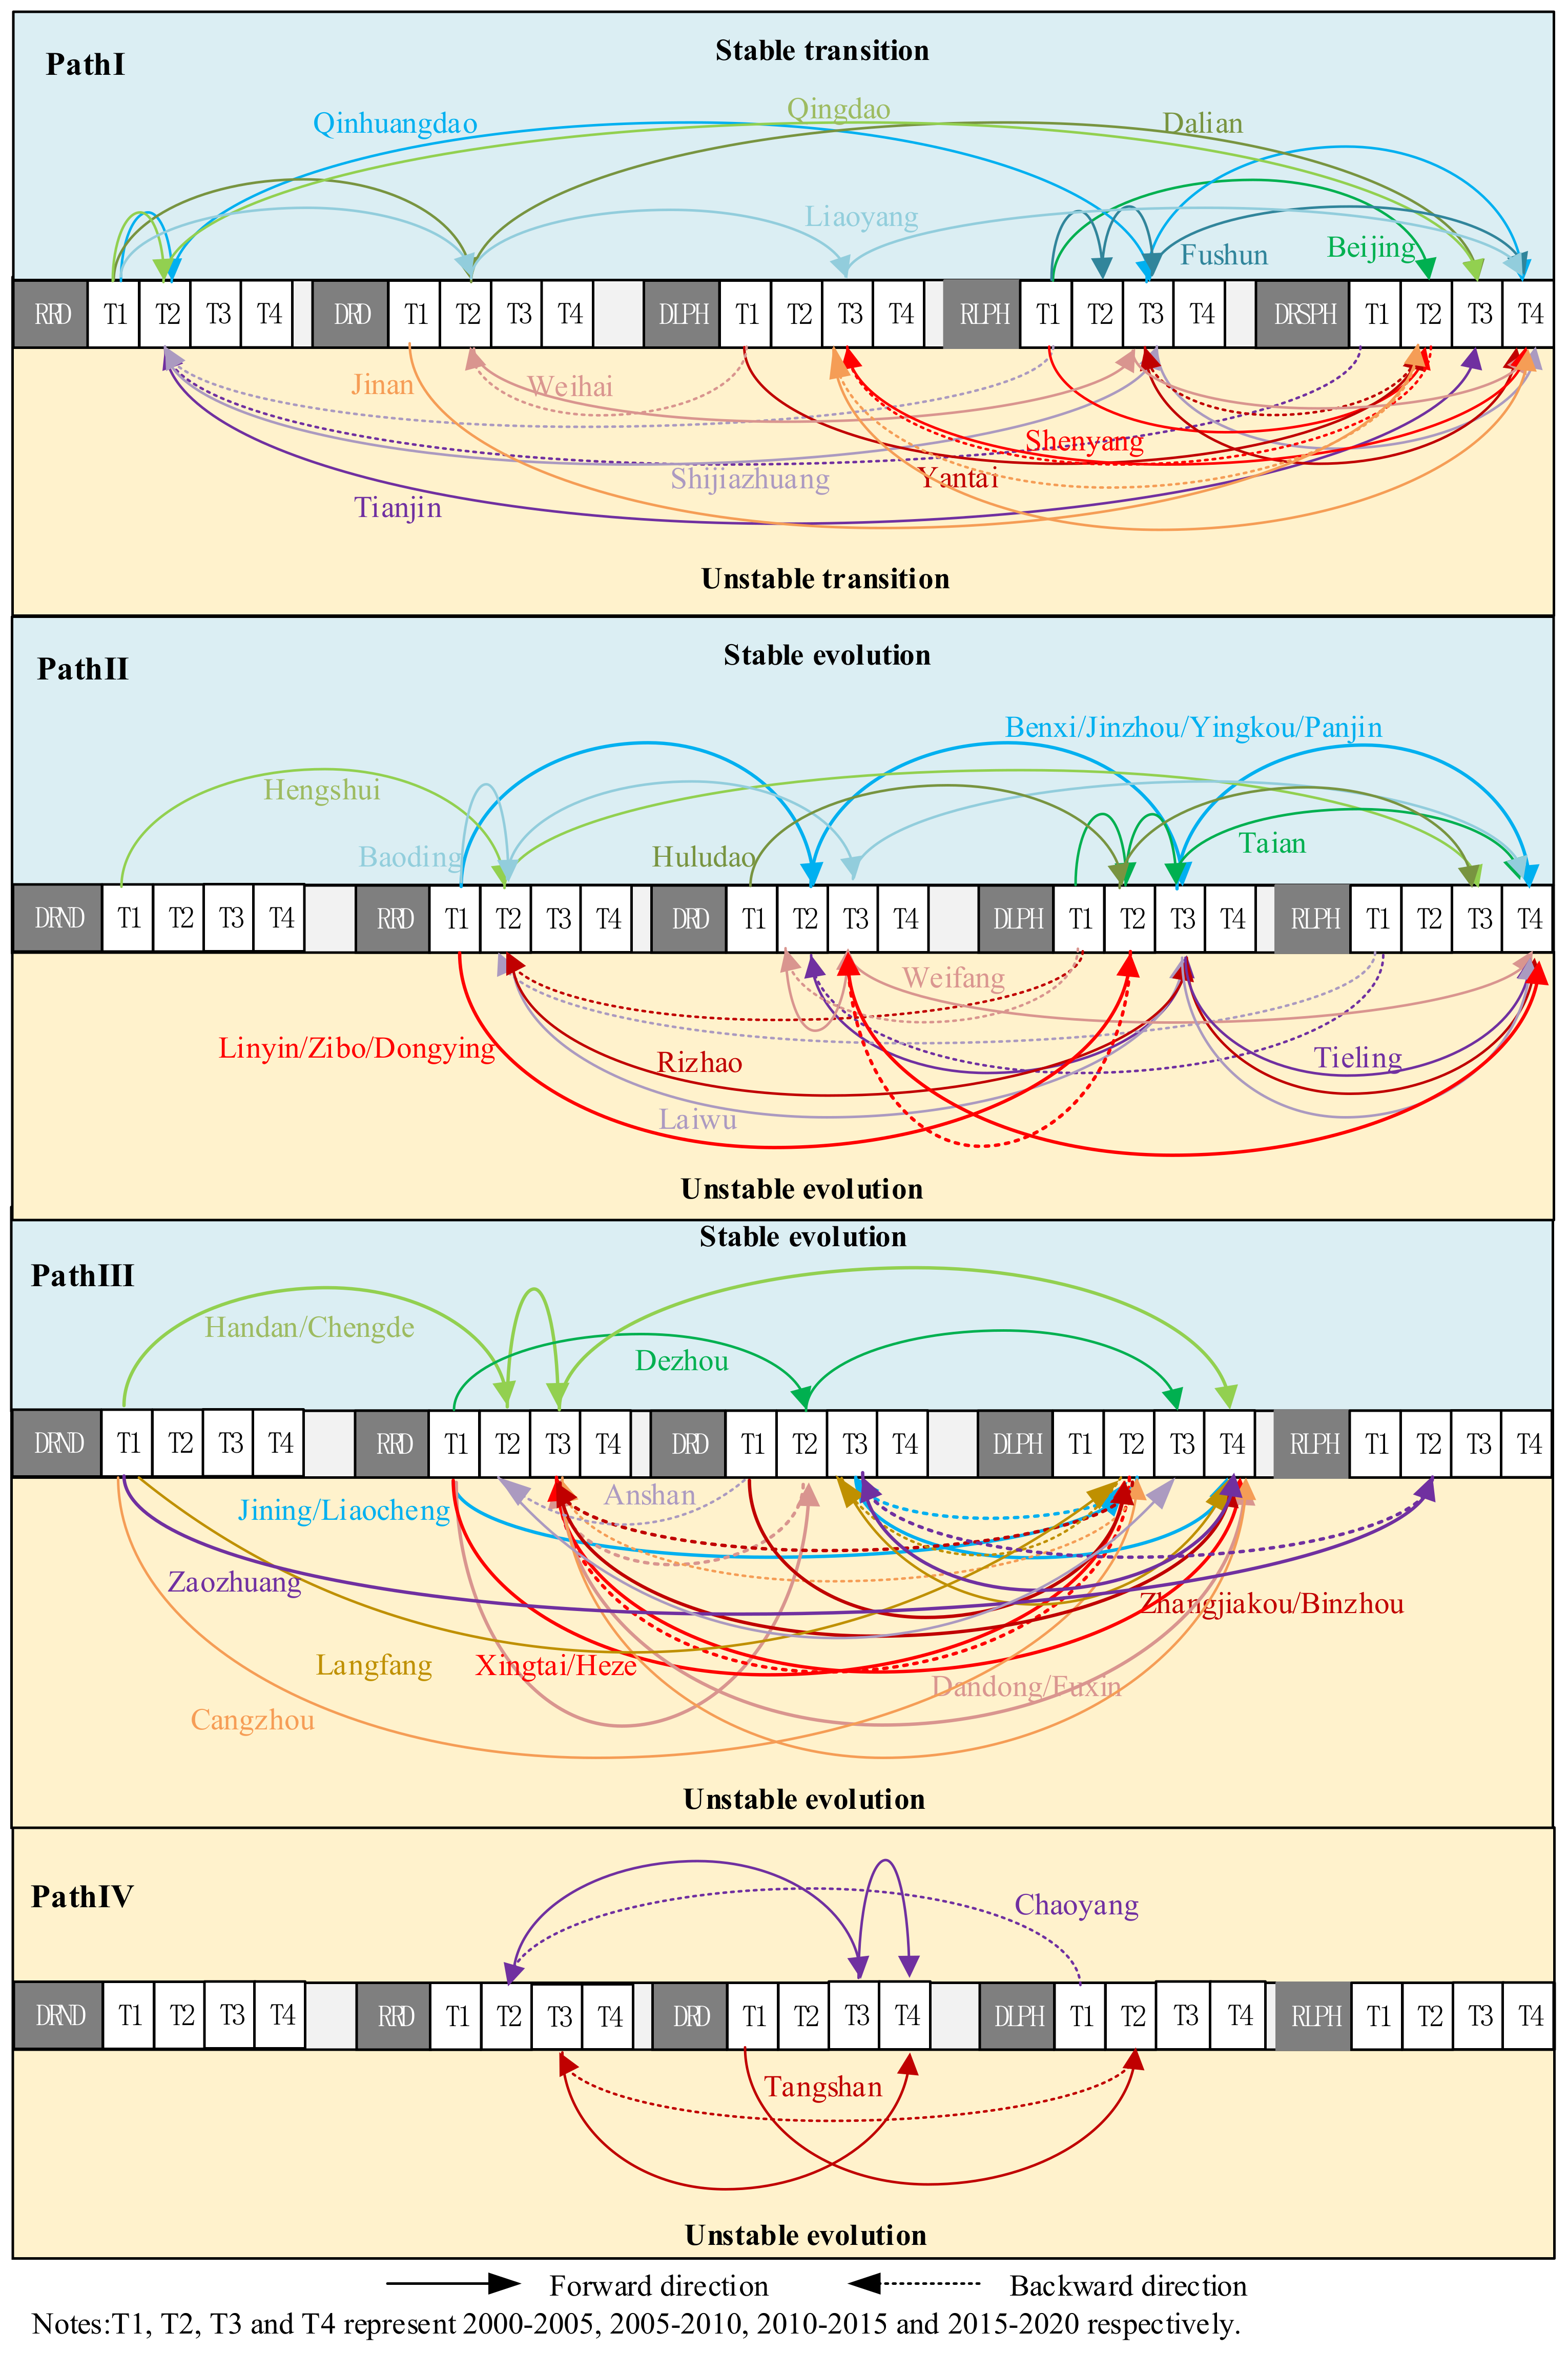
5.4. Path Analysis of Urban Land Use Transition

According to the evolution process of the urban coupling type, the transition processes of different types of cities were divided into the realizing transition stage, the transition I stage, the transition II stage, and the primary transition stage. Each stage, according to the differences in the stability of the transition process, was divided into a stable or unstable evolution (Figure 11).
Realizing the transition stage: At this stage, the city reached DRSPH and realized the transition. Qinhuangdao and Liaoyang passed from RRD in the initial stage of the study to reach DRSPH at T4 through the MP3 path; Qingdao and Dalian, at T1 and T2, stayed at RRD/DED and directly jumped through the SP2 path at T3 and stayed at DRSPH; Fushun reached DRSPH at T4 through the SP3 pathway after three periods of RLPH stagnation; Beijing passed from RLPH at T1 to DRSPH at T2 via the SP3 path and remained stable. The above-mentioned cities underwent transitions through different evolutional paths, either step-by-step or by leaping, and there was no rebound in the transition process, showing a stable trend toward transition. However, cities such as Tianjin, Jinan, and Weihai underwent transitions in the course of volatile and circuitous evolution, representing unstable transitions. Specifically, Tianjin dropped from DRSPH to the uncoupled RRD at T2, reached DRSPH at T3, and directly realized its transition through the SP2 path; Shijiazhuang and Weihai fell back from the transitional RLPH/DLPH to RRD/DRD and then reached DRSPH through the MP3 path; Jinan reached DRSPH through the SP2 path at T2 but fell to DLPH at T3 and then reached the DRSPH through the SP3 path again; Yantai and Shenyang realized the trend of repeated fluctuations in the transition process, passing through the SP3 path at T2 after reaching DRSPH, returning to the transitional state, and then realizing its transition through the SP3 path again. The cities in the transition stage were either provincial capitals or located in the coastal economic belt. With the dual advantages of their location and policy bias, these cities achieved rapid development. Among them, the instability in the transition processes of Shijiazhuang, Jinan, and other cities showed that, in the long-term process of development, such cities are more dependent on external driving forces, and their internal driving forces need to be improved.
Transition I stage: At this stage, the city has not achieved transition but stays in the RLPH, dominated by the recessive morphology. Hengshui gradually passed from DNRN to RRD, DLPH, and, finally, reached RLPH; Baoding stopped at RRD in T1 and T2, then passed through DRD to PLPH; Benxi, Jinzhou, Yingkou, and Panjin gradually passed from RRD through DRD, DLPH, and to RLPH; Huludao started from DRD to RLPH through DLPH; Taian stagnated at DLPH in T1 and T2, then reached RLPH at T3. The above-mentioned cities underwent transitions through different evolutional paths, step-by-step or by leaping, and there was no rebound in the transition processes, showing a stable trend toward transition. Linyi, Zibo, and Dongying upgraded from RRD to transitional DLPH but fell back to DDR at T3, then rose to RLPH; Rizhao, Laiwu, Weifang, and Tieling all fell back to an uncoupled state in the initial transition, DRD and RRD, and then rose back to RLPH at T4. The processes of the above cities reaching RLPH were accompanied by instability and volatility. Although they will eventually remain in a transitional state, their future trends are uncertain. Most of the cities are the result of the successful transitioning of old industrial bases and small- and medium-sized cities that have received attention in recent years. Due to the implementation of key national policies, such as revitalizing Northeast China and promoting the high-quality development of the Yellow River Basin, cities in the transition I stage showed good upward momentum and huge transition potential.
Transition II stage: In this phase, the city has not achieved a transition but has stayed in the DLPH, dominated by the dominant morphology. Handan and Chengde upgraded from DRND to DLPH; Dezhou upgraded from RRD to DLPH. The above-mentioned cities underwent transitions through different evolutional paths, step-by-step or by leaping, and there was no rebound in the transition processes, showing a stable trend toward transition. Cangzhou changed from DRND to DLPH, but, at T3, it dropped to RRD, then rose to DLPH at T4; Jining, Liaocheng, Xingtai, and Heze had similar transition paths, all of which were first upgraded from RRD to DLPH, returned to DRD/RRD at T3, then upgraded back to DLPH again at T4; Dandong and Fuxin repeatedly oscillated between RRD and DRD in T1–T3 and finally turned to DLPH at T4; Zhangjiakou, Binzhou, and Anshan switched from DRD to RRD at the early stage, then were promoted to DLPH at T3, and the cities were in a stable state. The processes of the above cities reaching DPH were accompanied by instability and volatility. Although they will eventually remain in a transitional state, their future trends are not clear. Cities in the transition II stage are in the early stages of development, occupying more advantageous land resources; however, the tradition of heavy agriculture or heavy industry has slowed the development of urban industries, and the predicament of deformed industrial structures should be addressed as soon as possible. The development of the recessive morphology of such cities has always been in a weak position, and the quality of these cities needs to be improved.
Primary transition stage: At this stage, a city has not achieved transition or even completed the transition but has simply broken away from DRDN and completed the primary transition. Chaoyang declined from DLPH back to RRD at the initial stage, then changed to DRD at T3; Tangshan rose from DRD to DLPH, then fell to RRD and, at T4, changed to DRD. Chaoyang and Tangshan, as resource-based cities, tend to deplete their resources; however, they have not moved past their dependence on natural resources, and the development of alternative industries is insufficient. In addition, under the traditional guidance of “production first, life later”, the degree of urban service space development is generally low, and there is a serious lack of motivation for urban transition.

6. Discussion

6.1. General Characteristics

The current research on land use transition tends to describe specific figures and is artificial and subjective. As cities are highly directional and differentiated individuals, simply focusing on numerical changes can easily obliterate the unique characteristics and regional particularity of cities. In this study, we regarded cities as whole systems and analyzed the change characteristics within and between their subsystems, as well as regarded the dominant and recessive morphologies of urban land use as two aspects for measuring the urban systems. Among them, the dominant morphology subsystem of urban land use includes three types of elements: scale, structure, and pattern. Meanwhile, the recessive morphology subsystem of urban land use includes three types of elements: production quality, living quality, and ecology quality. The dominant morphology of urban land use, as a directly visible display form, represents the evolutional pattern of urban land recessive morphology acting on the land through the forms of quantity and spatial layout. The former is the concrete manifestation of the latter, while the latter is the essence and foundation of the former. Therefore, there is a correlation between the two. This approach also provides a new perspective for measuring the urban land use transition. The resulting transition of the dominant and recessive morphologies of urban land use reflects the transition processes and realization paths from negative to positive (or from zero to one), eliminates the uncertainty of the relative measurement values, and improves the reliability and scientific attributes of the results. The recessive morphology of urban land use is the core of urban land transition. At present, it is gradually changing from the development of the dominant morphology to the promotion of the recessive morphology, in order to promote the improvement of the dominant morphology. The synergistic and coupling evolution of the two morphologies is the key to urban system transition and upgrading. Therefore, urban land use transition is a long-term, comprehensive, and nonlinear process, manifesting as the trend of coupling between the dominant and recessive morphologies of urban land use. At the same time, the phases of the socioeconomic development process will inevitably lead to phases of urban land use transition [15]. Under the influence of the urban development stage, socioeconomic conditions, and policies, urban land use transitions have obvious periodic and phase characteristics, the dominant and recessive morphologies of urban land use in different cities have different change trends, and the transition paths and speeds also vary.

6.2. Drive Mechanism

As a human labor object and labor resource, land has dual attributes—that is, resources and the environment. Cities are a dense combination of multiple functions, such as market transaction functions and living and residential functions. Therefore, urban land use transitions are affected by factors from different dimensions. The driving factors of urban land use transitions can be divided into the proximate and underlying causes [53]. The proximate causes are direct human activities at a certain location, including urban infrastructures, land intensity, labor quality, and so on, while the underlying causes act on the proximate causes to affect urban land use transitions, including their self-conditions, economics, and policies. These factors, through direct and potential influences, promote the combined development of the dominant and recessive morphologies of urban land use. The cascading driving effect of the underlying causes along the path of action through the proximate causes is the key to revealing the transition mechanism of urban land use. The basic process is shown in Figure 12.
A city is a living body with vitality and continuity, and its development has a unique trajectory. On the one hand, cities are restricted by their own geographical locations, being either inland or located on the coast, combined with differences in their urban hierarchical statuses and land resources as a prerequisite for urban development, making the infrastructural conditions, industrial patterns, and urban scales of each city different, thus affecting the surge of the labor force. Higher labor compensation and better public service facilities encourage young people with high academic qualifications to stay in or move to big cities, which leads to huge differences in the allocation of land resources and human settlements between different cities and which is also the basis for the different degrees and paths of urban land use transitions. On the other hand, with the progress and development of human civilization, the diversification of thoughts from all walks of life and the rise of “a life community”, different views on the concept of land, and the emergence of new ideas have given rise to the transition from the one-sided pursuit of land motivated by commodity value ideas of new classical economics to the value of land utility management and sustainable economic thought, leading to great changes in land values in terms of land ethics and natural and ecological functions of land resources, prompting national policies and social cognition, which attach importance to urban ecological problems and green space construction. With economic development, the price advantage of land prices over other factors of production, such as labor and raw materials, have gradually emerged [54], and the scarcity of land has become increasingly serious. This has urged the market and the state to set the goals of land use and management to focus on improving the intensity of land use. With the continuous expansion of the urban land scale, the intensity, density, and standardization of urban land use are also continuously improving. Furthermore, in the face of insufficient urban development momentum and uneven urban development between regions, the government can use macro-policy adjustments to effectively intervene in urban development, promoting industrial development through government policies and, thus, attracting a large number of factor inputs to promote social productivity and the socioeconomic level, further promoting the realization of urban land use transition. Then, with the improvement of the level of urbanization, the “invisible hand” of the market will naturally promote the transformation and upgrading of the urban industrial structure, updating the industrial supply chain and promoting the sound optimization of the urban land use morphology.
Overall, this cascading effect—through the direct influence of the city’s own condition and demographic factors, the indirect drive of its cultural factors, as well as the effective regulation of the combined effect of the economic and policy factors—intervenes in different regions and different types of urban systems, promoting the transition of urban land use from extensive and low-quality to intensive and high-quality, in the direction of reasonable urban scale, balanced structure, compact layout, efficient production, and livable and beautiful environments.

6.3. Path and Policy Enlightenment

In the context of comprehensively deepening reform in the new era, high-quality economic growth, and increasingly enhanced resources and environmental constraints [26], the core content of creating new urbanization has come to strictly control the expansion of urban boundaries, reasonably adjust the structures of urban construction lands, build strategies for sustainable urban development, and promote urban transition and upgrading. From the perspective of the synchronization of the coupling effects of the dominant and recessive morphologies, the current urban land use transition is in three states: The synergy of the dominant and recessive morphologies of urban land use is continuously improved, and the transition is realized; the synergy of the dominant and recessive morphologies of urban land use first rises and then falls, such that the transition is not fully realized, accompanied by the transition of timing and degree of difference; and the synergy of the dominant and recessive morphologies of urban land use are continuously decreased, moving further away from the transition. In this regard, the types and paths of urban land use transition differ, and classification, guidance, and intervention based on the local conditions are required. In view of the state of the transition shown, the four options for advancing the urban land use transition in the future are as follows (Figure 13): (a) the continuous and stable path—for cities that achieve the synchronization and continuous maintenance of the dominant and recessive morphologies, it is necessary to continuously innovate the land development and utilization model; to ensure the reasonable development of the city; to build a larger spatial economic cooperation system; to spread the city’s superior capabilities; and to accelerate the construction of a harmonious, livable, and vibrant modern city, in order to enhance the comprehensive competitiveness of the city and to maintain the transition results. (b) The moderately advanced path—for cities where the dominant and recessive morphologies are synchronized but fluctuate in the process, it is necessary to improve the efficiency of land use, to give full play to the social benefits of land, to reduce the adverse ecological impacts of land use, and to ensure the positive development of the dominant morphology while stabilizing the recessive in order to improve the situation, to promote the reform of the land system, to reduce the gap between urban and rural areas, and to strengthen inner city vitality, thus maintaining the transition trend for good development. (c) The accelerated adjustment path—for cities that have just achieved synchronization between the dominant and recessive morphologies and that still have an unclear future development process, it is necessary to pay close attention to the needs of industrial development, to promote industrial transition and upgrading, and to promote urban land use structure balance and diversity, considering the recessive morphology for the benign development of bedding, promoting urban intensive development, function optimization, and quality improvement, thus providing high-quality living spaces for residents and further stimulating the potential of urban development in order to reduce the negative effects of future uncertain factors on the transition results. (d) A strong reversing path. In view of the continuous decrease in synergy between the dominant and recessive morphologies at this stage, and with the realization that synchronization is required for a long time to achieve this kind of city, we need to rely on major national development strategies, expanding the opening to the outside of the pattern. At the same time, we must solve the practical problems, such as imperfect urban infrastructure and insufficient employment opportunities, enhance the city’s own development as the core content, strengthen the noncore functions of big cities, and facilitate industrial transfers to improve the ecological environment, enhance the city’s self-repair capabilities, and create conditions for the realization of the urban land use transition.

7. Conclusions

Based on the theory of land use transition, the urban system was divided into the dominant morphology subsystem and the recessive morphology subsystem, in which the six elements of scale, structure, pattern, production quality, living quality, and ecological quality were selected, in order to construct an urban land use morphology index system. On the basis of analyzing the transition characteristics of each subsystem, we explored the coupling relationship between the dominant and recessive morphologies of urban land use in the Bohai Economic Rim, as well as the paths to achieve urban land use transition through a decoupling elastic coefficient model. Our key findings were as follows:
(1) From 2000 to 2020, both the dominant and recessive morphology indices of urban land use in the Bohai Economic Rim were on the rise. The transition patterns of the two morphology patterns generally showed that the degree of transition in the east was higher than that in the west, while the spatial patterns of the core cities drove the development of the surrounding cities. Overall, the urban scale in the Bohai Economic Rim was expanded in an orderly manner, the land-carrying capacity was continuously improved, the proportion of urban land use structure became more balanced, the land function was diversified, and the urban landscape layout was generally more clustered and compact. The urban production was highly efficient and of high quality, the living standards constantly improved, and the cities paid more attention to the improvement of the ecological environment and the utilization of ecological lands.
(2) From 2000 to 2020, the coupling relationship of the dominant and recessive morphologies of urban land use in the Bohai Economic Rim changed from complex and diverse trends to agglomeration and optimization, experiencing a single-morphology recession decoupling type dominated by an uncoupled state to single-morphology dominated by a transitional state as a whole. The linking type was the main trend of the evolutional process. More than 88% of the cities in the whole region tended to be in the transitional state and the coupled state of positive hook. The optimization process of Beijing–Tianjin–Hebei had a certain degree of volatility, while Shandong Peninsula was characterized by an economic gradient, and Liaodong Peninsula was diversified and optimized. Different types of cities had different transition paths and degrees of fluctuations in the process of transition. According to the characteristics of the transition types of the cities in each period, four transition processes were drawn, targeted at cities with different levels of economic development, which were proposed to promote the transition strategy.
(3) This study attempted to introduce the dominant morphology and recessive morphology coupling relationships of urban land use in order to identify the inflection point of urban land use transition and reveal the coupling process of urban land use transition in the Bohai Economic Rim from 2000 to 2020. We constructed the theoretical framework of the coupling relationship between the dominant and recessive morphologies of urban land use from a qualitative perspective, then conducted comprehensive research from a quantitative perspective (e.g., through methods and indicator systems), which was of positive significance for analyzing the urban land use transitions from the perspective of the relationship between the land use morphologies. The theoretical framework and method setting have universality and significance. According to the specific evaluation index system, different types of regions can select indicators, according to their own conditions, and make appropriate changes. However, it should be pointed out that there are still some problems in this paper, such as the insufficient exploration of the inflection point of urban land use transition trends and insufficient disclosure of the internal mechanisms of transition. In the future, facing the current rapid urbanization process, accurately grasping the mechanisms and evolution of urban land use transitions, achieving urban land use transitions, carrying out simulation research on the trend of urban land use transitions, providing references and suggestions for urban construction and land management, and promoting the high-quality green development of cities under the guidance of people-oriented policies are worthwhile research directions to make further progress.

Author Contributions

Conceptualization, Y.Q.; methodology, Y.Q.; software, H.Z.; validation, Y.S.; formal analysis, Y.Q. and Y.S.; data curation, H.Z.; writing—original draft preparation, Y.S.; writing—review and editing, H.S., Z.Y. and T.L.; visualization, Y.S.; supervision, Y.Q., H.S. and Z.Y.; funding acquisition, Y.Q. All authors have read and agreed to the published version of the manuscript.

Funding

This research was funded by National Natural Science Foundation of China, grant number 42077434, National Natural Science Foundation of China, grant number 41771560 and Shandong Provincial Institutions of Higher Learning “Youth Innovation Team Development Plan” Project, grant number 2019RWG016. The APC was funded by National Natural Science Foundation of China, grant number 41771560.

Institutional Review Board Statement

Not applicable for studies not involving humans or animals.

Informed Consent Statement

Not applicable for studies not involving humans.

Data Availability Statement

The data presented in this study are openly available in [CNKI (https://data.cnki.net/, accessed on 5 May 2021)] and [the Resource and Environmental Science Data Center of the Chinese Academy of Sciences (http://www.resdc.cn/, accessed on 5 May 2021)], reference number [2000–2020].

Conflicts of Interest

The authors declare no conflict of interest.

Appendix A

Table A1. Abbreviations and interpretations.
AbbreviationsExplanations
DRSPHDominant and recessive synergy hook
RLPHRecessive leading positive hook
DLPHDominant leading positive hook
DRDDominant recession decoupling
RRDRecessive recession decoupling
DRNHDominant and recessive negative hook
The LP pathFrom DRND to RRD or DRD, then to RLPH or DLPH and finally to DRSPH
The MP1 pathFrom DRND to RRD or DRD and then to DRSPH
The MP2 pathFrom DRND to RLPH or DLPH and then to DRSPH
The MP3 pathFrom RRD or DRD to RLPH or DLPH and then to DRSPH
The SP1 pathFrom DRND to DRSPH
The SP2 pathFrom RRD or DRD to DRSPH
BERThe Bohai Economic Rim
BTHBeijing–Tianjin–Hebei Region
LPLiaodong Peninsula
SPShandong Peninsula

References

  1. Turner, B.L.; Lambin, E.F.; Reenberg, A. The emergence of land change science for global environmental change and sustainability. Proc. Natl. Acad. Sci. USA 2007, 104, 20666–20737. [Google Scholar] [CrossRef] [PubMed] [Green Version]
  2. Rigillo, M. Infrastrutture verdi e servizi eco-sistemici in area urbana: Prospettive di ricerca per la progettazione ambientale/Green Infrastructures and Ecosystem Services in urban areas: Research perspectives in environmental design. Techne 2016, 11, 59–65. [Google Scholar]
  3. Grimm, N.; Faeth, S.; Golubiewski, N.; Redman, C.; Wu, J.; Bai, X.; Briggs, J.M. Global change and the ecology of cities. Science 2008, 319, 756–760. [Google Scholar] [CrossRef] [PubMed] [Green Version]
  4. Sandström, S. Green infrastructure planning in urban Sweden. Plan. Pract. Res. 2002, 17, 373–385. [Google Scholar] [CrossRef]
  5. Mather, A.S. Global Trends in Forest Resources. Geography 1987, 72, 1–15. [Google Scholar]
  6. Mather, A.S. The forest transition. Area 1992, 24, 367–379. [Google Scholar]
  7. Grainger, A. National land use morphology: Patterns and possibilities. Geography 1995, 80, 235–245. [Google Scholar]
  8. De Fries, R.S.; Foley, J.A.; Asner, G.P. Land-use choices: Balancing human needs and ecosystem function. Front. Ecol. Environ. 2004, 2, 249–257. [Google Scholar] [CrossRef]
  9. Foley, J.A.; DeFries, R.; Asner, G.P. Global consequences of land use. Science 2005, 309, 570–574. [Google Scholar] [CrossRef] [Green Version]
  10. Long, H. Land use rransition and rural transformation development. Prog. Geogr. 2012, 31, 131–138. [Google Scholar]
  11. Long, H. Land use transition and land management. Geogr. Res. 2015, 34, 1607–1618. [Google Scholar]
  12. Zhu, F.; Zhang, F.; Li, C.; Zhu, T. Functional transition of the rural settlement: Analysis of land-use differentiation in a transect of Beijing, China. Habitat Int. 2014, 41, 262–271. [Google Scholar] [CrossRef]
  13. Lü, D.; Gao, G.; Lü, Y.; Xiao, F.; Fu, B. Detailed land use transition quantification matters for smart land management in drylands: An in-depth analysis in Northwest China. Land Use Policy 2020, 90, 104356–104366. [Google Scholar] [CrossRef]
  14. Chen, L.; Zhou, L.; Lü, B.; Chang, T.; Ting, C. Characteristics and Driving Forces of Regional Land Use Transition Based on the Leading Function Classification: A Case Study of Jiangsu Province. Econ. Geogr. 2015, 35, 155–173. [Google Scholar]
  15. Cheng, J.; Cheng, J. The spatio-temporal pattern, driving forces and transformation mode of inter-provincial recessive land use morphology in China. China Land Sci. 2017, 31, 60–68. [Google Scholar]
  16. Jadin, I.; Meyfroidt, P.; Lambin, E.F. International trade, and land use intensification and spatial reorganization explain Costa Rica’s forest transition. Environ. Res. Lett. 2016, 11, 80–95. [Google Scholar] [CrossRef]
  17. Nourqolipour, R.; Shariff, A.R.B.M.; Balasundram, S.K.; Ahmad, N.B.; Sood, A.; Buyong, T. Predicting the Effects of Urban Development on Land Transition and Spatial Patterns of Land Use in Western Peninsular Malaysia. Appl. Spat. Anal. Policy 2016, 9, 1–19. [Google Scholar] [CrossRef]
  18. Shin, H.; Chae, S. Urbanisation and land use transition in a second-tier city: The emergence of small factories in Gimpo, South Korea. Land Use Policy 2018, 77, 534–541. [Google Scholar] [CrossRef]
  19. Díaz-Palacios-Sisternes, S.; Ayuga, F.; García, A.I. A method for detecting and describing land use transformations: An examination of Madrid’s southern urban–rural gradient between 1990 and 2006. Cities 2014, 40, 99–110. [Google Scholar] [CrossRef]
  20. Ojoyi, M.M.; Mutanga, O.; Odindi, J.; Kahinda, J.M.M.; Abdel-Rahman, E.M. Implications of land use transitions on soil nitrogen in dynamic landscapes in Tanzania. Land Use Policy 2017, 64, 95–100. [Google Scholar] [CrossRef]
  21. Sługocki, Ł.; Czerniawski, R.; Kowalska-Góralska, M.; Senze, M.; Reis, A.; Carrola, J.S.; Teixeira, C.A. The Impact of Land Use Transformations on Zooplankton Communities in a Small Mountain River (The Corgo River, Northern Portugal). Int. J. Environ. Res. Public Health 2018, 16, 20. [Google Scholar] [CrossRef] [Green Version]
  22. Chen, W.; Zhao, H.; Li, J.; Zhu, L.; Wang, Z.; Zeng, J. Land use transitions and the associated impacts on ecosystem services in the Middle Reaches of the Yangtze River Economic Belt in China based on the geo-informatic Tupu method. Sci. Total Environ. 2020, 701, 134690–134703. [Google Scholar] [CrossRef]
  23. Liu, Y.; Long, H.; Li, T.; Tu, S. Land use transitions and their effects on water environment in Huang-Huai-Hai Plain, China. Land Use Policy 2015, 47, 293–301. [Google Scholar] [CrossRef]
  24. Ferreira, V.; Barreira, A.P.; Loures, L.; Antunes, D.; Panagopoulos, T. Stakeholders’ Engagement on Nature-Based Solutions: A Systematic Literature Review. Sustainability 2020, 12, 640. [Google Scholar] [CrossRef] [Green Version]
  25. Kurowska-Pysz, J.; Castanho, R.A.; Loures, L. Sustainable Planning of Cross-Border Cooperation: A Strategy for Alliances in Border Cities. Sustainability 2018, 10, 1416. [Google Scholar] [CrossRef] [Green Version]
  26. Huang, Z.; Wei, Y.D.; He, C.; Li, H. Urban land expansion under economic transition in China: A multi-level modeling analysis. Habitat Int. 2015, 47, 69–82. [Google Scholar] [CrossRef]
  27. Long, H. Land use transition: A New integrated approach of land use/cover change study. Geogr. Geo Inf. Sci. 2003, 19, 87–90. [Google Scholar]
  28. Henrik, E.; Van der Leeuw, S.E.; Charles, L.R.; Douglas, J.M.; George, D.; Christine, A.; Thomas, E. Urban transitions: On urban resilience and human-dominated ecosystems. Ambio 2010, 39, 531–545. [Google Scholar]
  29. Zhu, C.; Zhang, X.; Wang, K.; Yuan, S.; Yang, L.; Skitmore, M. Urban-rural construction land transition and its coupling relationship with population flow in China’s urban agglomeration region. Cities 2020, 101, 102701–102711. [Google Scholar] [CrossRef]
  30. Xu, M.; Zhang, Z. Rural Industrial Land Transition Characteristics in Beijing-Tianjin-Hebei Region under the Background of Rural Industry Revitalization. Econ. Geogr. 2020, 40, 174–182. [Google Scholar]
  31. Qu, Y.; Jiang, G.-H.; Tian, Y.; Shang, R.; Shuwen, W.; Li, Y. Urban-Rural construction land Transition(URCLT) in Shandong Province of China: Features measurement and mechanism exploration. Habitat Int. 2019, 86, 101–115. [Google Scholar]
  32. Qu, Y.; Jiang, G.-H.; Li, Z.; Tian, Y.; Wei, S. Understanding rural land use transition and regional consolidation implications in China. Land Use Policy 2019, 82, 742–753. [Google Scholar] [CrossRef]
  33. Romero, H.; Ihl, M.; Rivera, A.; Zalazar, P.; Azocar, P. Rapid urban growth, land-use changes and air pollution in Santiago, Chile. Atmos. Environ. 1999, 33, 4039–4047. [Google Scholar] [CrossRef]
  34. You, H. Impact of urbanization on pollution-related agricultural input intensity in Hubei, China. Ecol. Indic. 2016, 62, 249–258. [Google Scholar] [CrossRef] [PubMed]
  35. Avashia, V.; Garg, A. Implications of land use transitions and climate change on local flooding in urban areas: An assessment of 42 Indian cities. Land Use Policy 2020, 95, 104571–104580. [Google Scholar] [CrossRef]
  36. Nuissl, H.; Haase, D.; Lanzendorf, M.; Wittmer, H. Environmental impact assessment of urban land use transitions—A context-sensitive approach. Land Use Policy 2008, 26, 414–424. [Google Scholar] [CrossRef]
  37. Yang, Y.; Bao, W.; Li, Y.; Wang, Y.; Chen, Z. Land Use Transition and Its Eco-Environmental Effects in the Beijing–Tianjin–Hebei Urban Agglomeration: A Production–Living–Ecological Perspective. Land 2020, 9, 285. [Google Scholar] [CrossRef]
  38. Long, H.; Liu, Y.; Hou, X.; Li, T. Effects of land use transitions due to rapid urbanization on ecosystem services: Implications for urban planning in the new developing area of China. Habitat Int. 2014, 44, 536–544. [Google Scholar] [CrossRef]
  39. Lü, X.; Liu, Q. Wetland Resource in the Yangtze Basin and Its Protection and Restoration. Geogr. Geo Inf. Sci. 2013, 19, 87–91. [Google Scholar]
  40. Qu, S.; Hu, S.; Li, Q. Stages and spatial patterns of urban built-up land transition in China. Acta Geogr. Sin. 2020, 75, 1539–1553. [Google Scholar]
  41. Guo, C.; Gao, J.; Fan, P.; Yao, F. Land Use Transition and Hotspots Detection in Yongcheng City based on the Grid Scale. China Land Sci. 2016, 30, 43–51. [Google Scholar]
  42. Tian, J.; Wang, B.; Cheng, L.; Wang, S. The process and mechanism of regional land use transition guided by policy: Acase study of Northeast China. Geogr. Res. 2020, 39, 805–821. [Google Scholar]
  43. Zhang, X.; Jin, X.; Fan, Y.; Liu, J.; Shan, W.; Zhou, Y. Spatial-temporal characteristics and coordination status of the land use function transition in Jiangsu province from 1995 to 2015. J. Nat. Resour. 2019, 34, 689–706. [Google Scholar]
  44. Qu, Y.; Long, H. The integrated research on regional land use recessive morphology from the perspectives of exploitation and output: The case of the Huang-Huai-Hai Region. Geogr. Res. 2017, 36, 61–73. [Google Scholar]
  45. Qu, Y.; Long, H. Spatial Differentiation of the Recessive Morphology of Urban Land Use and Its Influential Factors: A Case Study of 289 Prefecture-Level Cities in China. Econ. Geogr. 2016, 36, 1–9. [Google Scholar]
  46. Luo, H.; Hu, S.; Wu, S. Research Trends and Development Trends of Land Use Transformation in China. Nat. Resour. Econ. China 2019, 376, 65–75. [Google Scholar]
  47. Fang, F.; Liu, Y.; Long, H.; Li, Y. A study on the moderate non farming of land in the counties around Bohai Sea in China. J. Nat. Resour. 2013, 28, 889–897. [Google Scholar]
  48. Yang, R.; Liu, Y.; Long, H. The study on non-agricultural transformation co-evolution characteristics of “population-land-industry”: Case study of the Bohai Rim in China. Geogr. Res. 2015, 34, 475–486. [Google Scholar]
  49. Jiang, W.; Wang, W.; Chen, Y.; Liu, J.; Tang, H.; Hou, P.; Yang, Y. Quantifying driving forces of urban wetlands change in Beijing City. J. Geogr. Sci. 2012, 22, 301–314. [Google Scholar] [CrossRef]
  50. Zhang, W.; An, J.; Han, C. Application of entropy to evaluation of urban sustainable development. J. Quant. Tech. Econ. 2003, 20, 115–118. [Google Scholar]
  51. Luo, L.; Hu, S.; He, J.; Zeng, G. Relationship between Green Development and Economic Growth of Yangtze River Delta Urban Agglomeration: Based on the Decoupling Index Analysis. Econ. Geogr. 2020, 40, 40–49. [Google Scholar]
  52. Tapio, P. Towards a theory of decoupling: Degrees of decoupling in the EU and the case of road traffic in Finland between 1970 and 2001. Transp. Policy 2005, 12, 137–151. [Google Scholar] [CrossRef] [Green Version]
  53. Van Vliet, J.; de Groot, H.L.; Rietveld, P.; Verburg, P.H. Manifestations and underlying drivers of agricultural land use change in Europe. Landsc. Urban Plan. 2015, 133, 24–36. [Google Scholar] [CrossRef] [Green Version]
  54. Song, X. Discussion on land use transition research framework. Acta Geogr. Sin. 2017, 72, 471–487. [Google Scholar]
Figure 1. Theoretical framework of urban land use transition.
Land 10 00493 g001
Figure 2. The Bohai Economic Rim (BER).
Land 10 00493 g002
Figure 3. Urban land use transition research methods diagram.
Land 10 00493 g003
Figure 4. Realization paths of urban land use transition.
Land 10 00493 g004
Figure 5. Evolution trend of the dominant morphology index of urban land use in the Bohai Economic Rim from 2000 to 2020.
Land 10 00493 g005
Figure 6. Spatial patterns of the dominant morphology transition types of urban land use in the Bohai Economic Rim from 2000 to 2020.
Land 10 00493 g006
Figure 7. Evolution trend of the recessive morphology index of urban land use in the Bohai Economic Rim from 2000 to 2020.
Land 10 00493 g007
Figure 8. Spatial pattern of the recessive morphology transition types of urban land use in the Bohai Economic Rim from 2000 to 2020.
Land 10 00493 g008
Figure 9. Proportion of cities with different coupling types.
Land 10 00493 g009
Figure 10. Spatial pattern of the dominant and recessive morphology coupling relationships in the Bohai Economic Rim from 2000 to 2020.
Land 10 00493 g010
Figure 11. Schematic diagram of the transition process of urban land use around the Bohai Economic Rim from 2000 to 2020.
Land 10 00493 g011
Figure 12. The roles of the factors affecting urban land use transitions.
Land 10 00493 g012
Figure 13. Zoning map of the urban land use transition.
Land 10 00493 g013
Table 1. The urban land use morphology evaluation index system.
Target LayerElement LayerIndex LayerWeightDirection
Dominant morphology Scale (0.352)Area of urban built-up area (km2)0.22+
Proportion of the newly increased urban land construction area to the total increased urban and rural construction land area (%)0.32+
Population per urban construction land unit area (person/km2)0.46+
Structure (0.364)Proportion of residential land area (%)0.20+/−
Proportion of land area for administration and public services (%)0.20+/−
Proportion of land area for industrial and manufacturing (%)0.20+/−
Proportion of land area for roads, streets, and transportation (%)0.20+/−
Proportion of land area for green spaces and squares (%)0.20+/−
Pattern ①
(0.284)
Area0.18+
Landscape shape index0.23
Patch density0.32
Contiguity index0.27+
Recessive morphologyProduction quality
(0.365)
Per capita GDP (10,000 yuan/person)0.29+
Proportion of non-agricultural industry output values (%)0.19+
Per capita investment in fixed assets (10,000 yuan/person)0.29+
Per capita public budget revenue (10,000 yuan/person)0.23+
Living quality
(0.410)
Annual per capita disposable income of urban households (10,000 yuan/person)0.25+
Per capita expenditure on science and education (10,000 yuan/person)0.37+
Number of doctors per 10,000 population (person)0.22+
Per-capita area of paved roads in city (m2/person)0.16+
Ecological quality (0.225)Built district green space rate (%)0.35+
Comprehensively utilized industrial solid wastes rate (%)0.17+
Wastewater treatment rate (%)0.28+
Domestic garbage treatment rate (%)0.21+
① Note: Please refer to “Landscape Ecology—Pattern, Process, Scale and Level” (Wu Jianguo, Higher Education Press) for the specific calculation methods of the various land use pattern indicators.
Table 2. Planning urban construction land structures.
Land Use TypeProportion of Urban Construction Land (%)
Residential25–40
Administration and public services5–8
Industrial and manufacturing15–30
Roads, streets, and transportation10–25
Green spaces and squares10–15
Table 3. Discrimination of the coupling types of the dominant and recessive morphologies of urban land use.
Decoupling IndexThe Relationship between ΔTe and ΔThCoupling Type
0.8 ≤ Id ≤ 1.2ΔTe > 0, ΔTh > 0Dominant and recessive synergy hook (DRSPH)
0 < Id < 0.8ΔTe > 0, ΔTh > 0, and ΔTe > ΔThRecessive leading positive hook (RLPH)
Id > 1.2ΔTe > 0, ΔTh > 0, and ΔTe < ΔThDominant leading positive hook (DLPH)
Id < 0ΔTe < 0, ΔTh > 0Dominant recession decoupling (DRD)
ΔTe > 0, ΔTh < 0Recessive recession decoupling (RRD)
Id > 0ΔTe < 0, ΔTh < 0Dominant and recessive negative hook (DRNH)
Table 4. Coupling types and changes in the Bohai Economic Rim from 2000 to 2020.
Coupling TypeNumber of Cities/Proportions
2000–2005 (T1)2005–2010 (T2)2010–2015 (T3)2015–2020 (T4)2000–2020
DRSPH1/2.274/9.094/9.0912/27.279/20.45
RLPH7/15.912/4.557/15.9115/34.0914/31.82
DLPH5/11.3614/31.8213/29.5515/34.0916/36.36
DRD6/13.6412/27.2710/22.732/4.555/11.36
RRD19/43.1812/27.2710/22.7300
DRND6/13.640000
Publisher’s Note: MDPI stays neutral with regard to jurisdictional claims in published maps and institutional affiliations.

