1. Introduction
Tailings dams are earth dams without an impermeable core, designed for permanent containment of mineral waste. One of the most used construction methods is the upstream method, by which the dam banks grow during the tailing’s storage activity at a rate of about 1–1.5 m/year. This method is the most cost-effective [
1,
2], as it consists in the construction of a foundation base very resistant to load and of the so-called starter dam, then the tailings are discharged into the basin until it is saturated and the placing of the new material occurs within the existing impoundment, that is, the new embankments are founded on tailings [
3,
4]. These latter ones consist of solid or liquid waste represented by a mixture of fine particles, in some cases toxic or radioactive, deriving from mechanical separation processes of the mineral of economic interest from the gangue.
As its height and therefore the load increases, this kind of dam is more susceptible to geotechnical failure, or it can evolve in conditions of instability, as the new embankments are founded on tailings, which are in most cases highly erodible due to their fine particle size and can contain unwanted minerals and process chemicals [
5].
In the past 20 years, the number of tailings dam failures has doubled [
6] with dramatic consequences due to the toxicity of the stored tailings and the large run-out distances (up to hundreds of km), causing losses and major damage to health and environment. An upward trend in high-consequence failure events since 1990 has been also highlighted by Bowker and Chambers [
7].
Azam and Li [
8] summarized the major tailings dam failures from 1910 to 2010, reporting that the annual failure frequency for major tailings dams is about 0.12%, which is more than two orders of magnitude greater than the annual failure frequency for large water retention dams [
9]. Major failures occur with a frequency that ranges from two to five times per year, whereas minor failures occur around 35 times per year [
10]. The most common result of failure is bursting of the dam which surrounds the facility and release of a huge mass of liquefied tailings mixed with water in the form of a flood wave.
Stefaniak and Wróżyńska [
10] and Bowker and Chambers [
7] described some examples of the over 100 documented catastrophic failures of tailings dams in the world over the last 50 and 100 years, respectively, and Rico et al. [
4] conducted a study on 147 cases of tailings dam failures worldwide, 26 of which had occurred in Europe. The most important causes of failure described on literature are the following: issues related to foundations, slope instability, overfilled tailings pond, mine subsidence or deformations of the dam body, unusual heavy rainfall, water pressure excess in tailings, piping/seepage, seismic liquefaction caused by earthquakes, structural issues, management, or operational errors. In many cases, no single precise cause for the failures has been identified, and various overlapping factors could combine [
10]. Lyu et al. [
2] also summarized the influence of the failure height, the building type, the geographical location, and time distribution of the tailings dam failures, and interestingly highlighted that upstream dams have a high probability (58%) of damage, and that the majority (85%) of tailings dam failures have occurred in dams of less than 45 m high.
On 5 November 2015, Samarco’s tailings dam breached, destroying two villages, killing 19 people, and seriously polluting 650 km of the Rio Doce River in the Brazilian state of Minas Gerais. In the same state, and with the same mine owner, in January 2019, the Corrego do Feijão dam at Brumadinho collapsed, killing about 248 people. The 86 m height tailings dam, constructed with the upstream method, catastrophically failed, releasing 12 million m
3 of mineral waste. Catastrophic failures at Samarco and Brumadinho in 2015 and 2019, respectively, brought mine tailings disasters onto the global level in unprecedented ways, and several studies have developed these themes following these events (e.g., [
6,
11,
12,
13,
14,
15,
16]).
Another very serious failure event took place in 1985, at two tailings dams nearby the town of Trento in Northern Italy. The collapse triggered a disastrous mudflow [
17] that destroyed the villages of Stava and Tesero, killing 268 people. In this case, human factors contributed most to the failure; the dam’s superstructure which did not meet high safety standards [
18] and the failure of the two dam bodies can be explained through excess amount of water in the tailings pond and liquefaction by infiltration phenomenon [
19,
20].
The assessment of tailings dam stability involves the study of the hydrogeological settings, tailing material characterization, deposition methods and of the possible trigger factors leading to dam failure (e.g., earthquakes, extreme rainfall, man-made factors [
21]). However, the monitoring of deformations of the dam body is also of primary importance, even if it is challenging due to the size and inaccessibility of these facilities, which are among the world’s largest engineered structures.
In-situ geotechnical instruments, levelling, total stations, or GNSS and visual inspections represent the conventional labor-intensive and time-consuming monitoring systems generally used at tailings dams. However, traditional techniques are conducted on a point-by-point basis with limited spatial coverage [
22]. Satellite remote sensing technologies such as Synthetic Aperture Radar (SAR) Interferometry (InSAR), can overcome this limitation, allowing for the analysis of wide areas, and ability to obtain information from the past, using data archives. This consolidation technique can be an effective tool for the engineers in charge of structural health monitoring of dams (e.g., [
23,
24,
25,
26,
27]) and tailings dams [
14,
15,
16,
22,
28]. Specifically, Advanced Differential SAR Interferometry (A-DInSAR) can provide information about the ongoing and past deformations with millimeter accuracy and can be used for the prediction of catastrophic events (e.g., [
12,
15]), by the detection of precursory deformation at the dam structure before the failures occur.
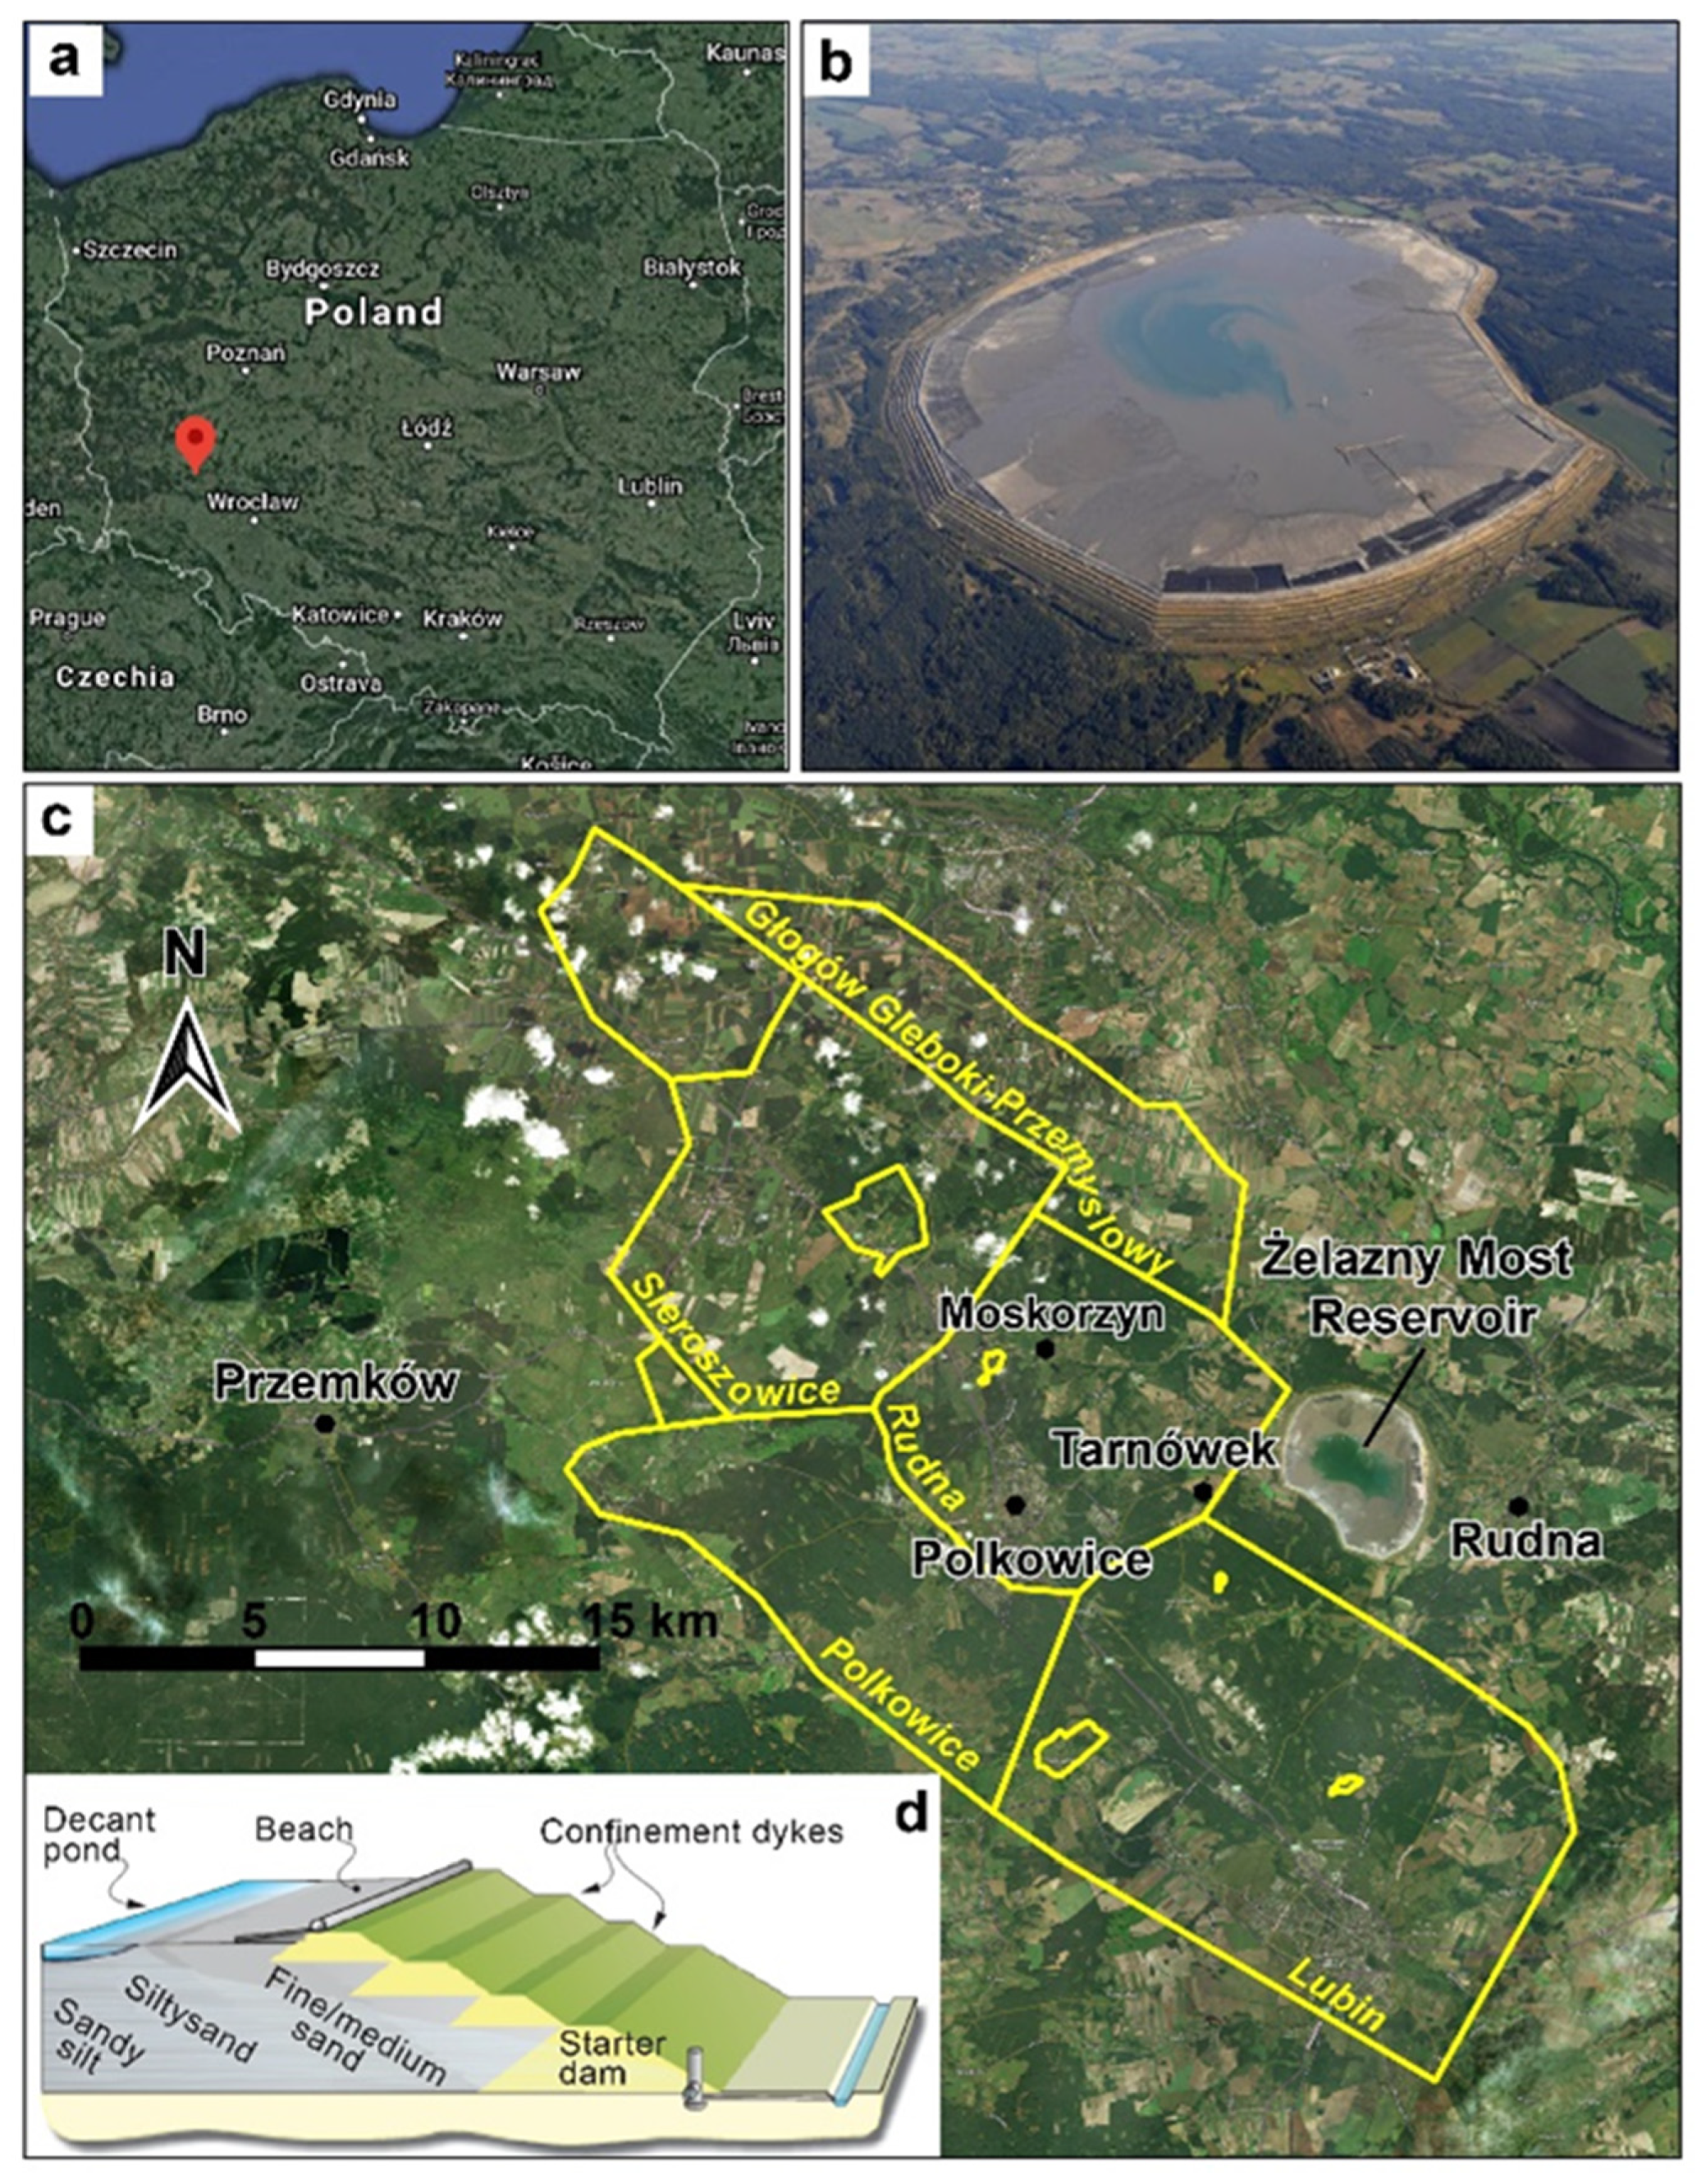
This paper focuses on the deformation phenomena that affect the tailings dam of Żelazny Most (
Figure 1) using satellite A-DInSAR. The Żelazny Most Tailings Storage Facility (TSF) is the largest sump reservoir in Europe built using the upstream method (
Figure 1d, [
1,
29]) and is one of the largest in the world. It stores the waste derived from copper extraction activities of the adjacent Legnica Glogow Copper District (LGCD, Poland) the most important copper mines of Lower Silesia, managed by the KGHM Polska Miedź S.A. For more details on the mining basin and on the superficial deformation phenomena that affect it, see Antonielli et al., submitted to this journal. More than 99% of the original ore extracted in the copper mines of Lubin, Rudna, and Polkowice-Sieroszowice (
Figure 1c) represents waste: everyday an average of 80,000 tons of waste derived from the mechanical separation processes are produced [
29] and then discharged in the basin, by means of flotation.
2. Study Area
The morphological depression in the southeastern portion of the Dalkowskie Hills indicated the site as suitable for the location of this tailings dam. The construction of the Żelazny Most TSF started in 1974, and the discharge of tailings started in 1977. The ring dams surrounding the disposal area are 14.3 km long, and the area of the basin is 16,380,000 m
2, where more than 600 million m
3 of tailings have been deposited [
30]. The dam’s height has varied over time from 40 to 71.5 m. In this type of construction, the coarse fraction of the tailings (i.e., sand), that is separated from the fine fraction (i.e., silt and clay), is used to build the shell in a series of lifts [
29]. The Żelazny Most TSF is formed of a selected sandy material, deposited on the so-called beaches of the storage facility. Only a part of this material is deposited, and most of it is used to build the embankment [
10].
The construction technique causes the stability of the dam to vary over time as an embankment is added to the dam, posing a relevant threat for the surrounding areas. TSF is adjacent to urbanized and populated areas: Tarnówek village is 600 m to the west of the site boundary, Rudna village is 1 km to the east, and Grodowiec and Rynarcice villages are 1.5 km to the north and to the south, respectively, of the dam boundary. The structure is continuously monitored and adapted to avoid rupture. KGHM Polska Miedź has been preparing future tailings storage methodology to ensure deposition until 2042 (1 billion m
3; [
30]). The development of the Żelazny Most TSF has been planned by constructing the Southern Extension (609 ha) adjoining the main dam basin to the south.
The study site is in the Lower Silesia region (south-western part of Poland) which is a part of the Fore-Sudetic Monocline, where metamorphic rocks and volcanogenic-sedimentary beds outcrops. In particular, the Fore-Sudetic Monocline is composed of a thick epi-Hercynian sequence of sediments and rocks of Carboniferous, Rotliegende, and Zechstein age [
4]. Copper ore of the LGCD mine is located at the base of Zechstein formations, and the thickness of ore layers varies from 0.1 to 15 m [
4].
Tectonic recognition of faults of a large stratigraphic throw in the area of the KGHM copper ore mine reveals that the main faults strike NW–SE [
31,
32]. The dominant fault system in the mining area coincides with the fault zone of Rudna and Lubin, which represent two parallel structures striking NW-SE. Rudna fault is considered the most representative among the faults which pose a seismic hazard and is located about 5 km south from Żelazny Most tailings dam.
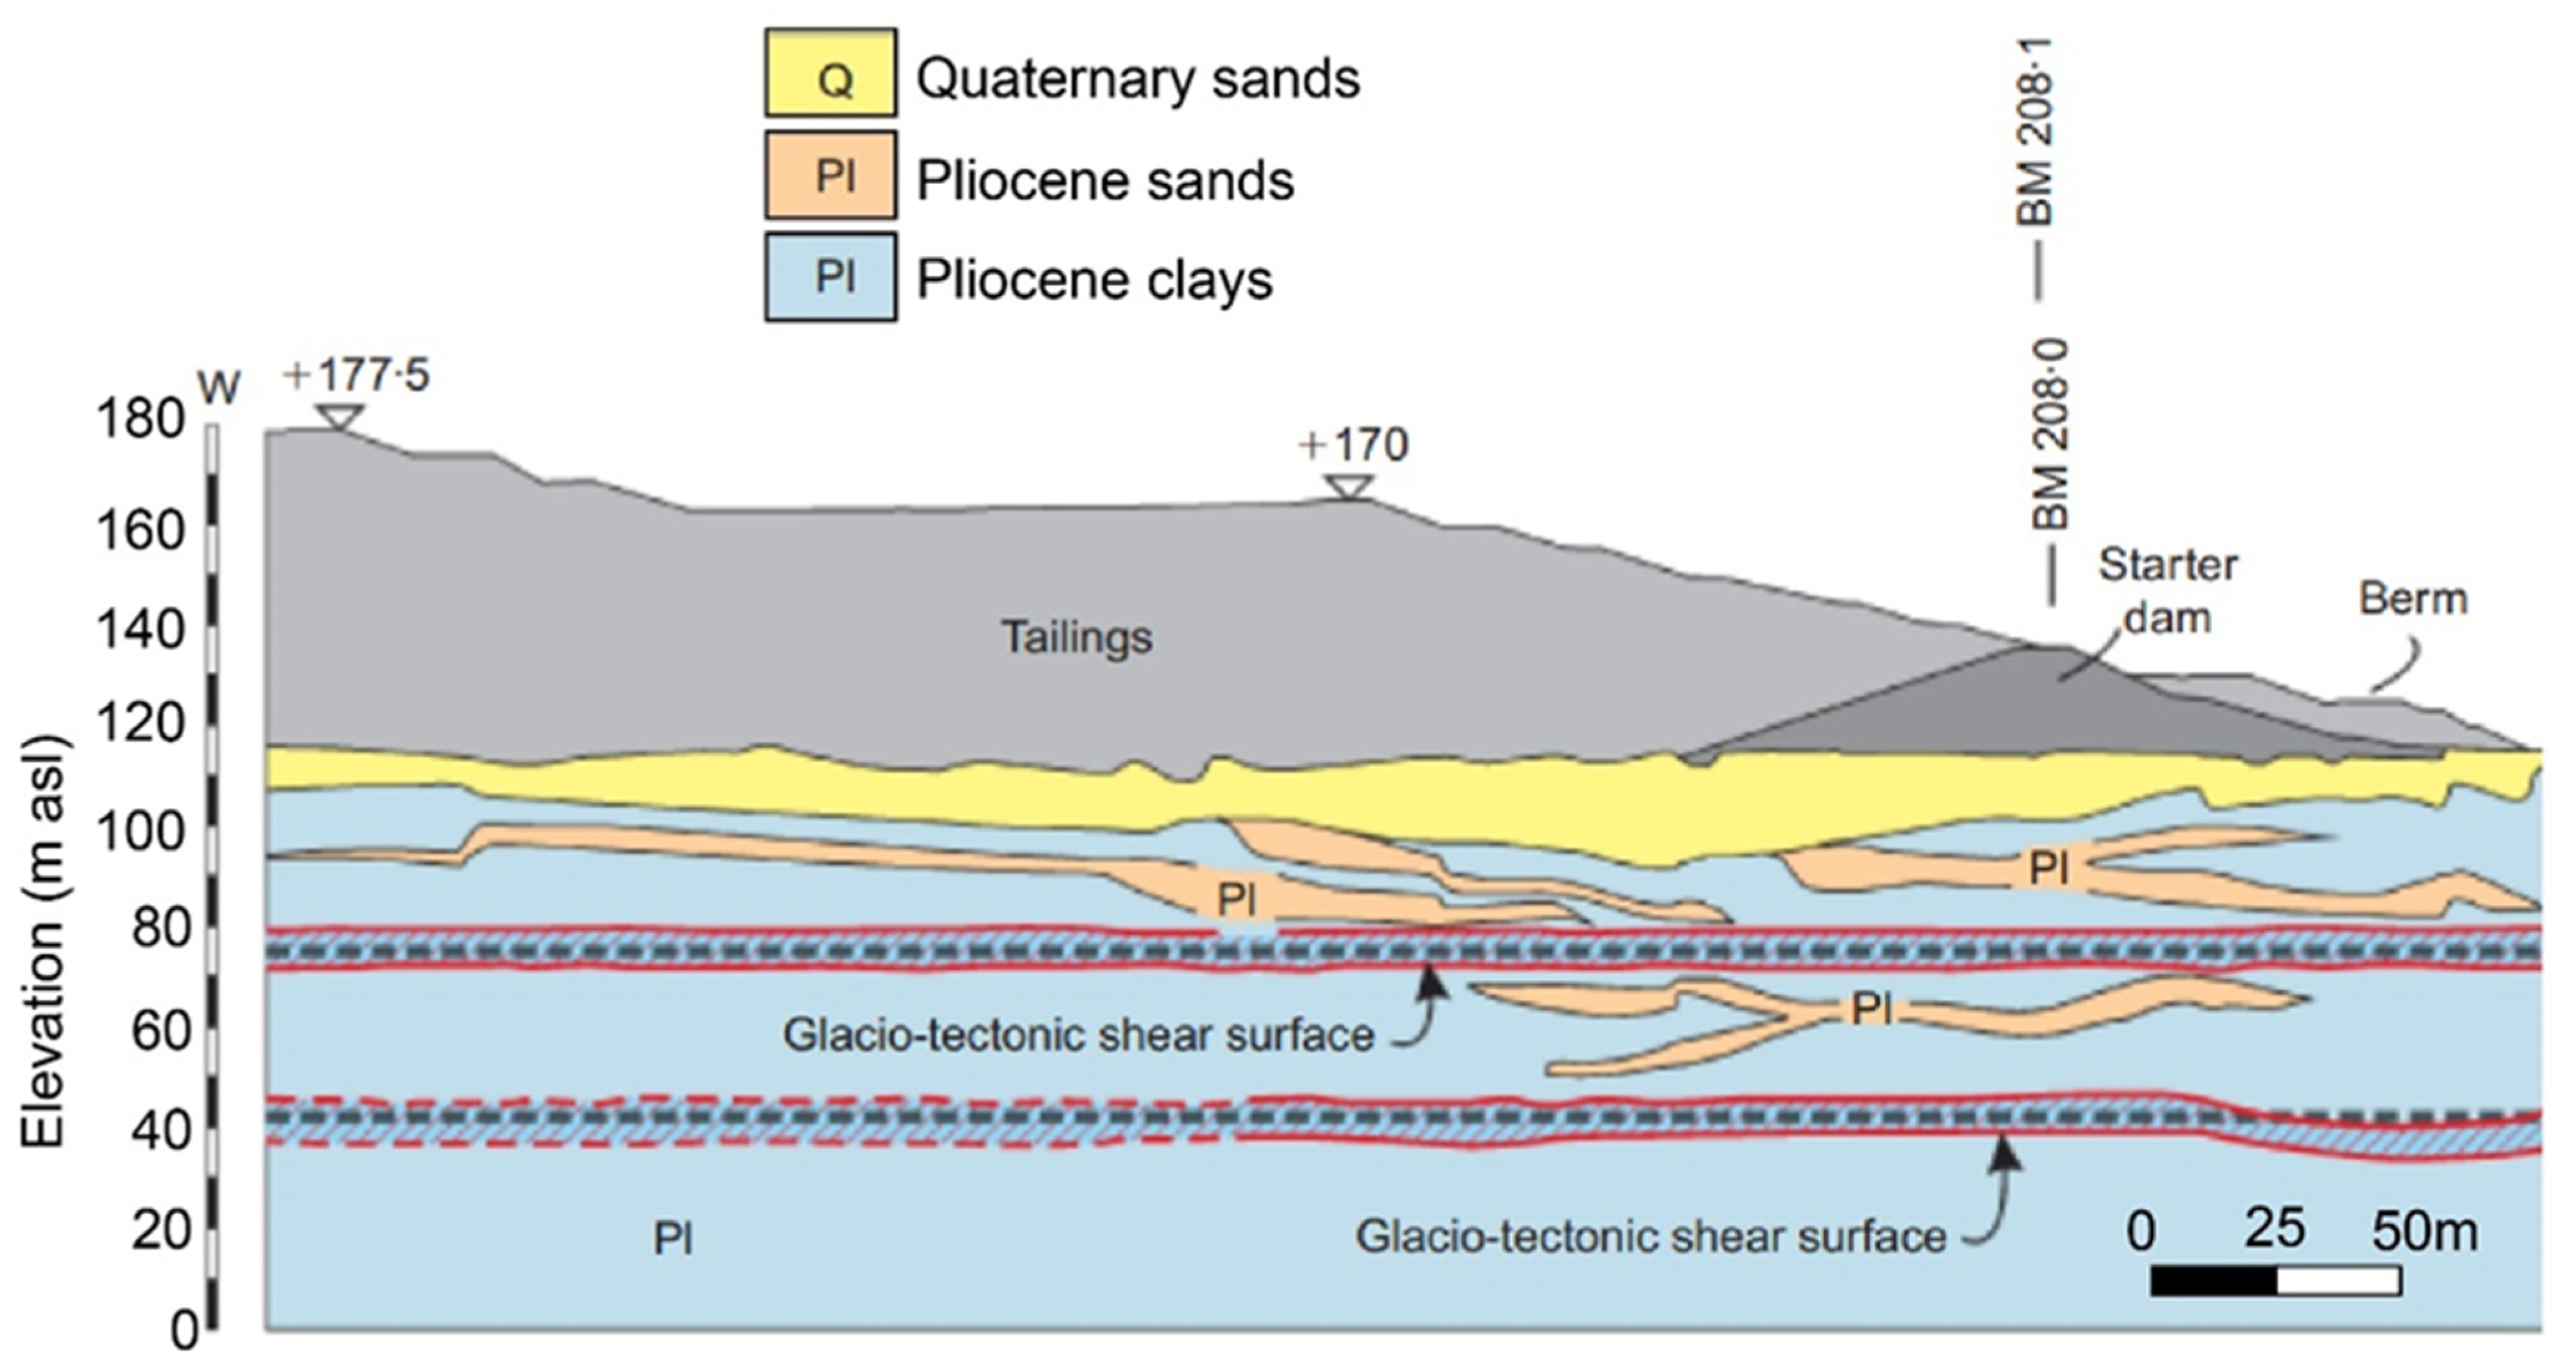
The Żelazny Most tailings dam was built on a Quaternary and Tertiary clay substrate [
1,
33]. The storage facility is located in a morphological depression in the southeastern portion of the moraine hills of Dałków [
30,
34], surrounded by frontal moraine-dammed hills of the Riss glaciation. More detail on Quaternary stratigraphy and paleogeography of the study area can be found in [
35,
36,
37,
38]
In particular, the dam is located on clayey and sandy lacustrine deposits Pleistocene aged, which rest on a thick layer of lacustrine clays with medium-high plasticity, interbedded with thin peaty or sandy layers.
During the Pleistocene, Central Europe was affected by at least three glaciations with relative progradation of glacial masses towards the south of Poland, where the study area is located [
1,
29,
39]. The thickness of the ice masses was at least 1000 m and the weight caused deformation phenomena (the so-called glacio-tectonics) that could have affected the subsoil up to hundred meters in depth [
1,
29]. The thrusting (horizontal or inclined) caused shear surfaces in the Pliocene clays (
Figure 2), which have a low strength, referred to as the residual strength [
30]. The shear stress caused by the passage of glaciers during the cooling events generated several sub-planar shear surfaces that formed in the high plasticity clays. The orientation of the major shear surfaces within Pliocene clays is expected to follow the general direction of the Quaternary ice movement, i.e., NW-SE direction to the southeast.
The Quaternary deposits consist of sands and gravels, deposited as outwash from the Pleistocene icesheets. The glaci-tectonics thrusting pushed these large lenses of gravels over the Neogene clays. The resulting complex geometry of the Quaternary gravels outlines the drainage boundaries to the masses of Neogene clay and controls the drainage of the waters below the dam [
30].
3. Methods
InSAR (Interferometric Synthetic Aperture Radar [
40,
41] can be considered one of the most powerful satellite remote sensing techniques used for the measurement of displacements of the Earth’s surface. It is based on the comparison between RADAR images acquired in different times over the same area. The Advanced Differential SAR Interferometry (A-DInSAR) approach consists of the combination of many SAR images, allowing for the retrieval of the temporal evolution of displacements of objects on the ground during the investigated time period [
42,
43]. The use of this Multi-Image technique allows for the identification of the deformation process, past or in progress, and to estimate its evolution over time and space, so it can be profitably exploited to investigate the spatial and temporal evolution of ground deformation processes with millimetric accuracy.
In this study, 411 Sentinel-1 SAR scenes, in ascending and descending orbital geometries covering the study area, have been analyzed using a Multi-Image A-DInSAR technique. Sentinel-1 (European Space Agency, ESA) is a two-satellite constellation carrying onboard a C-band SAR sensor (5.40 GHz frequency and about 5.55 cm wavelength), operating since the second half of 2014. The acquired stacks cover a period of about 4 years and 7 months (from October 2014 to April 2019). We used Interferometric Wide beam mode in Single Polarization (IW) SAR images, characterized by a spatial resolution of approximately 5 × 20 m, a wavelength of 5.6 cm (C-band), and 250 km wide images (
Table 1).
A-DInSAR analysis were performed to acquire information regarding past displacements that affected the ground surface over the entire investigated area since late 2014. The multi-temporal interferometric analyses have been carried out using Persistent Scatterers Interferometry (PSI) technique [
41,
42,
43,
44,
45] and with proprietary procedures implemented in SARPROZ software [
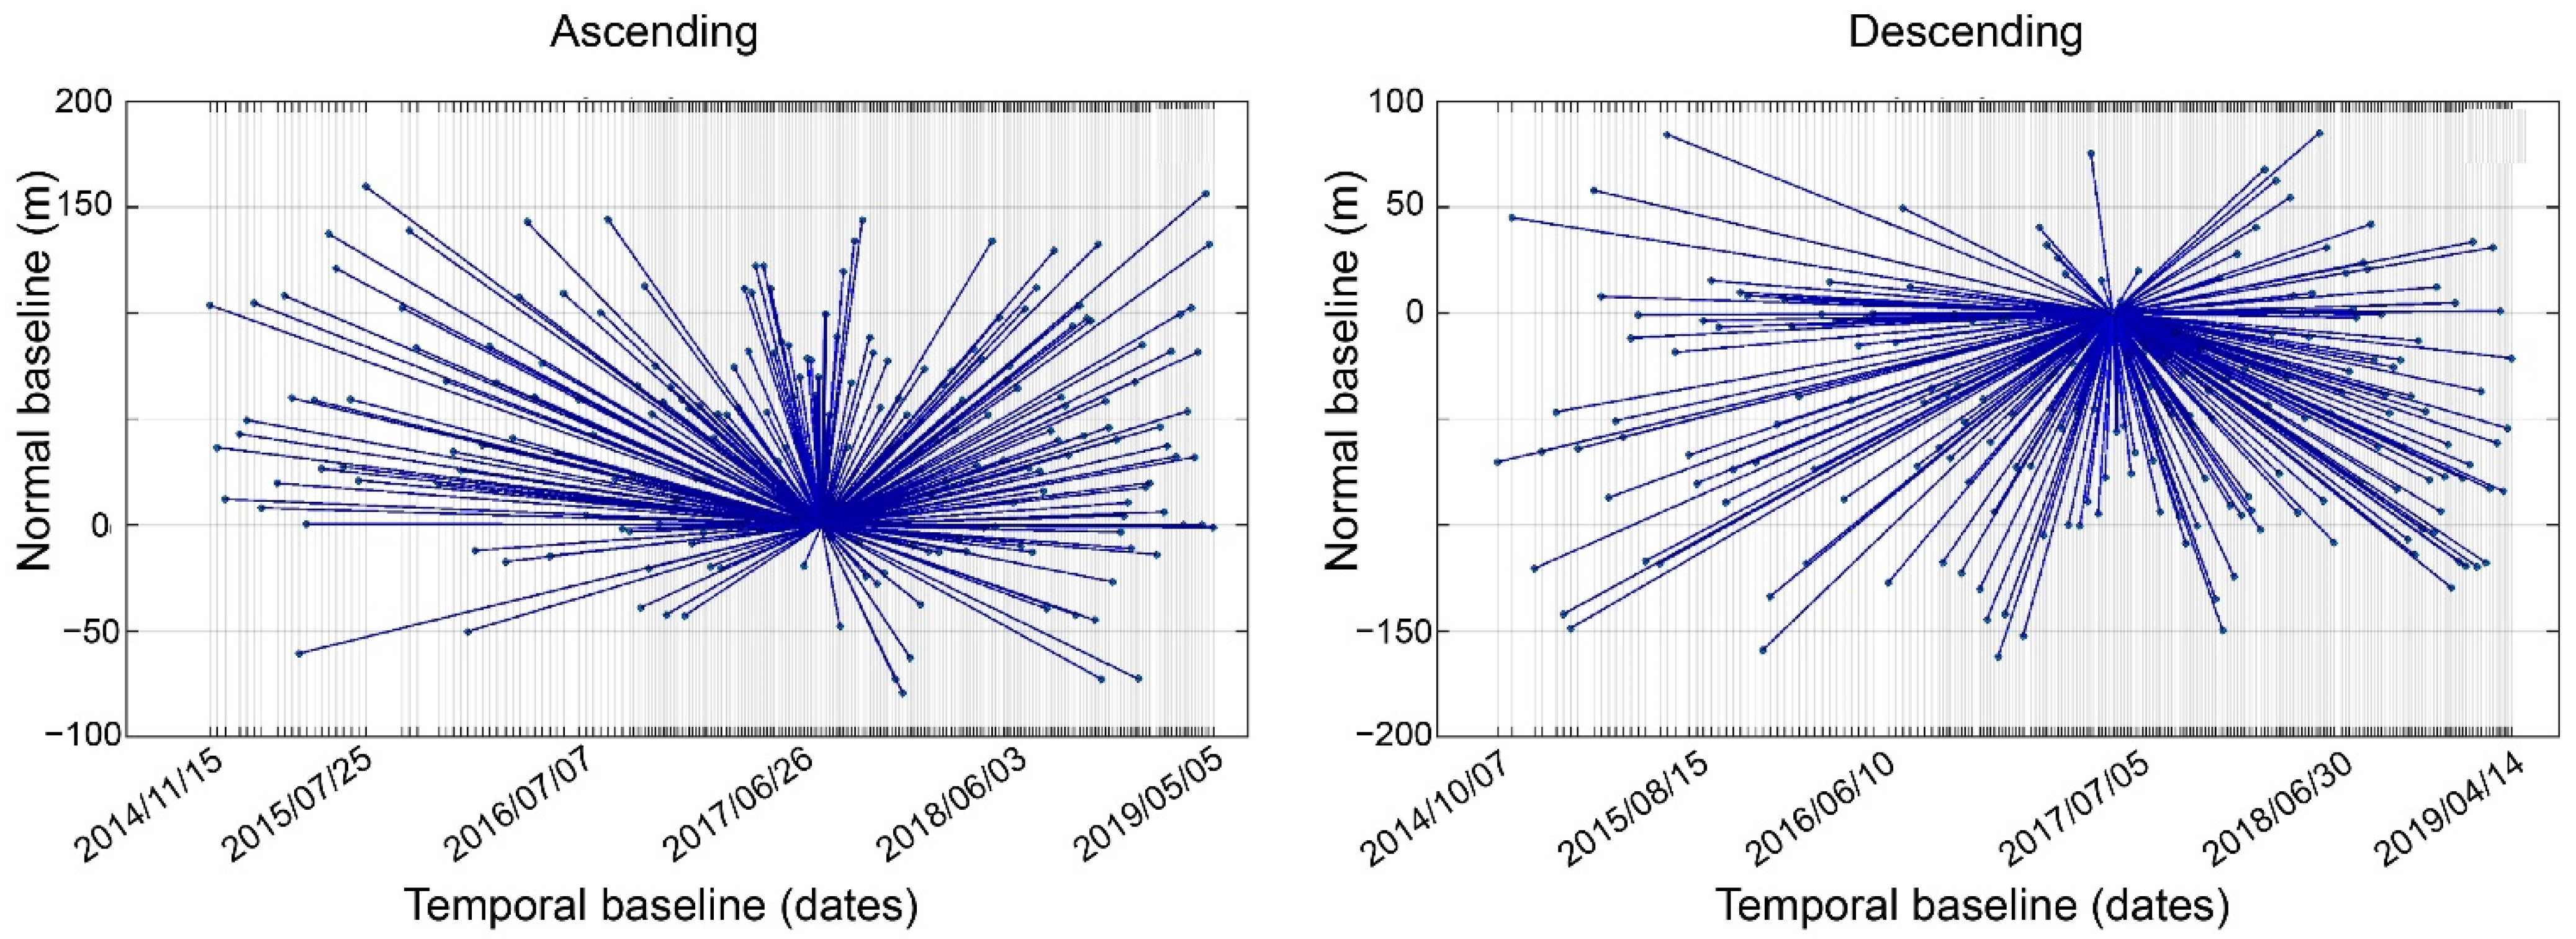
46]. The accuracy of the PSI results depends on many parameters, such as the number of SAR images, the spatial distribution of PSs, climatic and atmospheric conditions, distance from the reference point, and the quality of PSs within the area of interest. Specifically, to reduce the decorrelation effects, all images were related to a single master image, which was selected by considering the perpendicular and temporal baselines. After all images were co-registered to the master image, the maps of the radar parameter were generated: the reflectivity map (a multi-temporal amplitude value for each pixel) and the amplitude stability index map (the coefficient of variation of the amplitude). These maps were used as quality estimators for the selection of persistent scatterer candidates (PSCs) in the PSI workflow. Then, the standard “star” graph (
Figure 3; [
43]) has been used to connect all slave images to a single master image and thus to generate interferograms. This graph represents all the SAR images according to their temporal baseline (X axis) and their normal baseline (Y axis), both for ascending and descending orbital geometries, and allows to generate a network by connecting all the images (slave images) to one (master image;
Figure 3).
A network of PSCs was created to estimate preliminary height and displacement parameters. This step is needed to detect and remove the atmospheric phase screen (APS), starting from the residual phase components. After APS estimation and removal, the final estimation of the velocity and residual height for the Persistent Scatterers (PS), was performed on a much larger set of points, as the final step of the PSI procedure. For each PS the velocity values along the Line of Sight (LOS), the displacement time series, and the height, were computed (relative to a reference point identified in a stable region). The resulting PSs have been selected by applying a high temporal coherence threshold, thus selecting only pixels characterized by a temporal coherence >0.6, in order to obtain reliable time series. It is worth mentioning that displacements are measured along the satellite LOS, the path between the satellite sensor and the target (e.g., look angle in
Table 1). The results of the procedure are represented by velocity of displacement maps (mm/yr) in the LOS direction for both ascending and descending datasets.
The Up-Down and East-West velocities of displacement have been retrieved by combining the ascending and descending orbital geometries [
47,
48]. An application for vector decomposition owned by NHAZCA S.r.l. was used for this purpose. After a discretization of the LOS maps in a grid of hexagonal cells, the vertical and horizontal velocity rates can be achieved by the combination of at least one PS from the ascending and one PS from the descending. Through the vector decomposition of the ascending and descending LOS vectors, the velocities are projected along the vertical and horizontal directions (up-down and east-west). The horizontal component of the motion along the north-south direction cannot be properly measured, because the SAR satellites fly in the near-polar orbit, approximately parallel to the north-south direction and perpendicular to the LOS [
48,
49]. Thus, in the non-polar regions, the N–S surface displacements contribute very little to the A-DInSAR LOS measurements.
4. Results
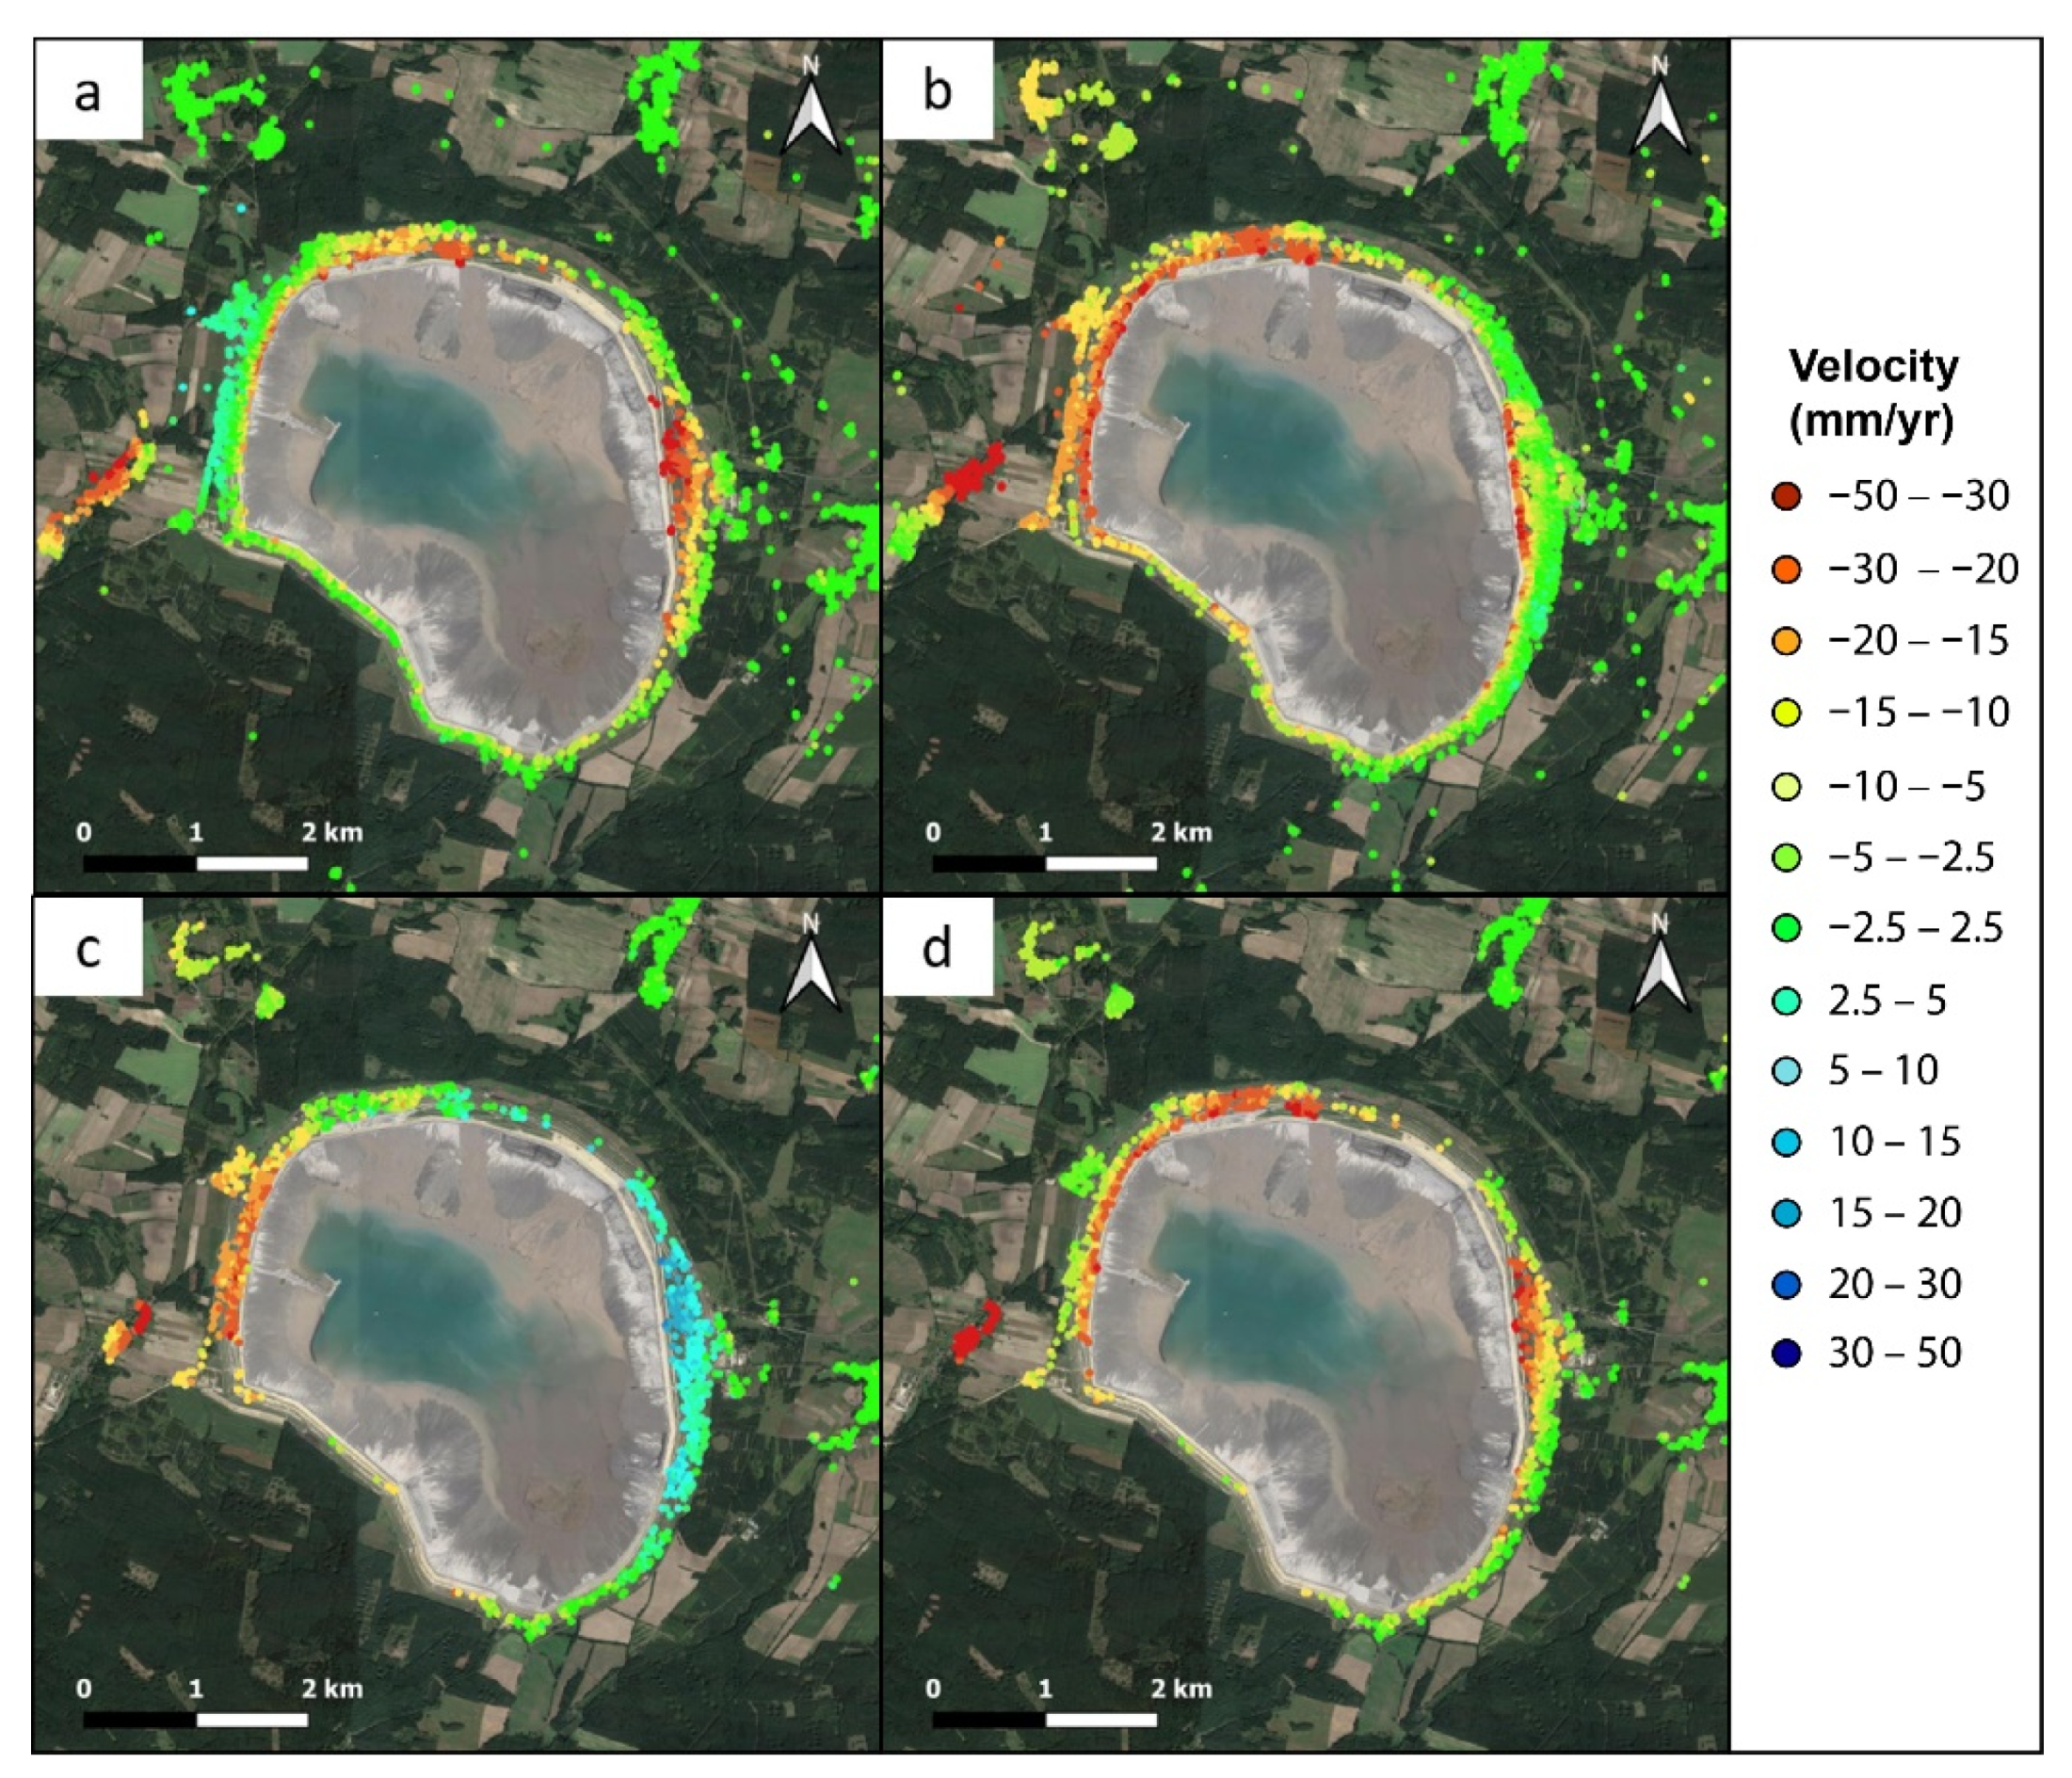
The A-DInSAR velocity maps of the Żelazny Most TSF, for the period October 2014–April 2019, are shown in
Figure 4. The panels a and b show the LOS velocity, in ascending and descending orbital geometry respectively, while c and d the east-west and up-down velocity maps, respectively. For the LOS velocity maps, the used convention for the color bar is as follows: green PSs represent the velocity range between −2.5 and 2.5 mm/yr, which has been considered no deformation; PSs moving away from the satellite are in yellow, orange, and red, while PSs moving toward the satellite are from cyan to blue. For the east-west and up-down velocity maps, the green PSs represent no displacement; yellow to red PSs are moving westwards or downward, respectively, while cyan to blue PSs are moving eastward or upwards, respectively.
As regards the horizontal displacements (east-west direction in
Figure 4c), it is worth noting that, along the eastern embankment of the dam, PSs are moving eastwards with velocity up to 30 mm/yr, while along the western embankment, PSs are moving westwards, with similar maximum rate of displacement (up to −30 mm/yr). Therefore, in these sectors of the dam, the embankment is deforming outwards, i.e., the velocity vectors are radial with respect to the center of the basin. Along the northern sector of the dam, instead, the east-west deformation rates are very small, with values ranging between 5 and −5 mm/yr. The horizontal rates in the north-south direction, as mentioned in the previous paragraph, cannot be properly measured by InSAR [
49,
50].
As regards the vertical displacements (
Figure 4d), PSs moving downwards (subsidence) are in yellow to red colors, while there are no areas with PSs moving upwards (uplift). The velocity values measured along the vertical direction show that several parts of the dam ring are affected by subsidence or settlement (hereinafter considered as synonyms). The southern part of the dam shows lower subsidence (from −5 to −15 mm/yr), while in all other sectors of the dam, subsidence is more intense, especially in the innermost and higher rings. In the eastern sector, the subsidence rate is up to −30 mm/yr in the innermost part of the tailings dam ring, with peak values of −50 mm/yr in the central part of the eastern sector. Subsidence decreases up to values of −5 mm/yr towards the base of the dam structure, i.e., in the so-called starter dam. In the western sector of the tailings dam a similar pattern of deformation can be observed: in the innermost rings the subsidence is up to −30 mm/yr, while in the starter dam the settlements are in the order of −6 mm/yr. In the northern sector of the dam, the maximum velocity is about −35 mm/yr in the inner portion of the dam and decreases in the starter dam.
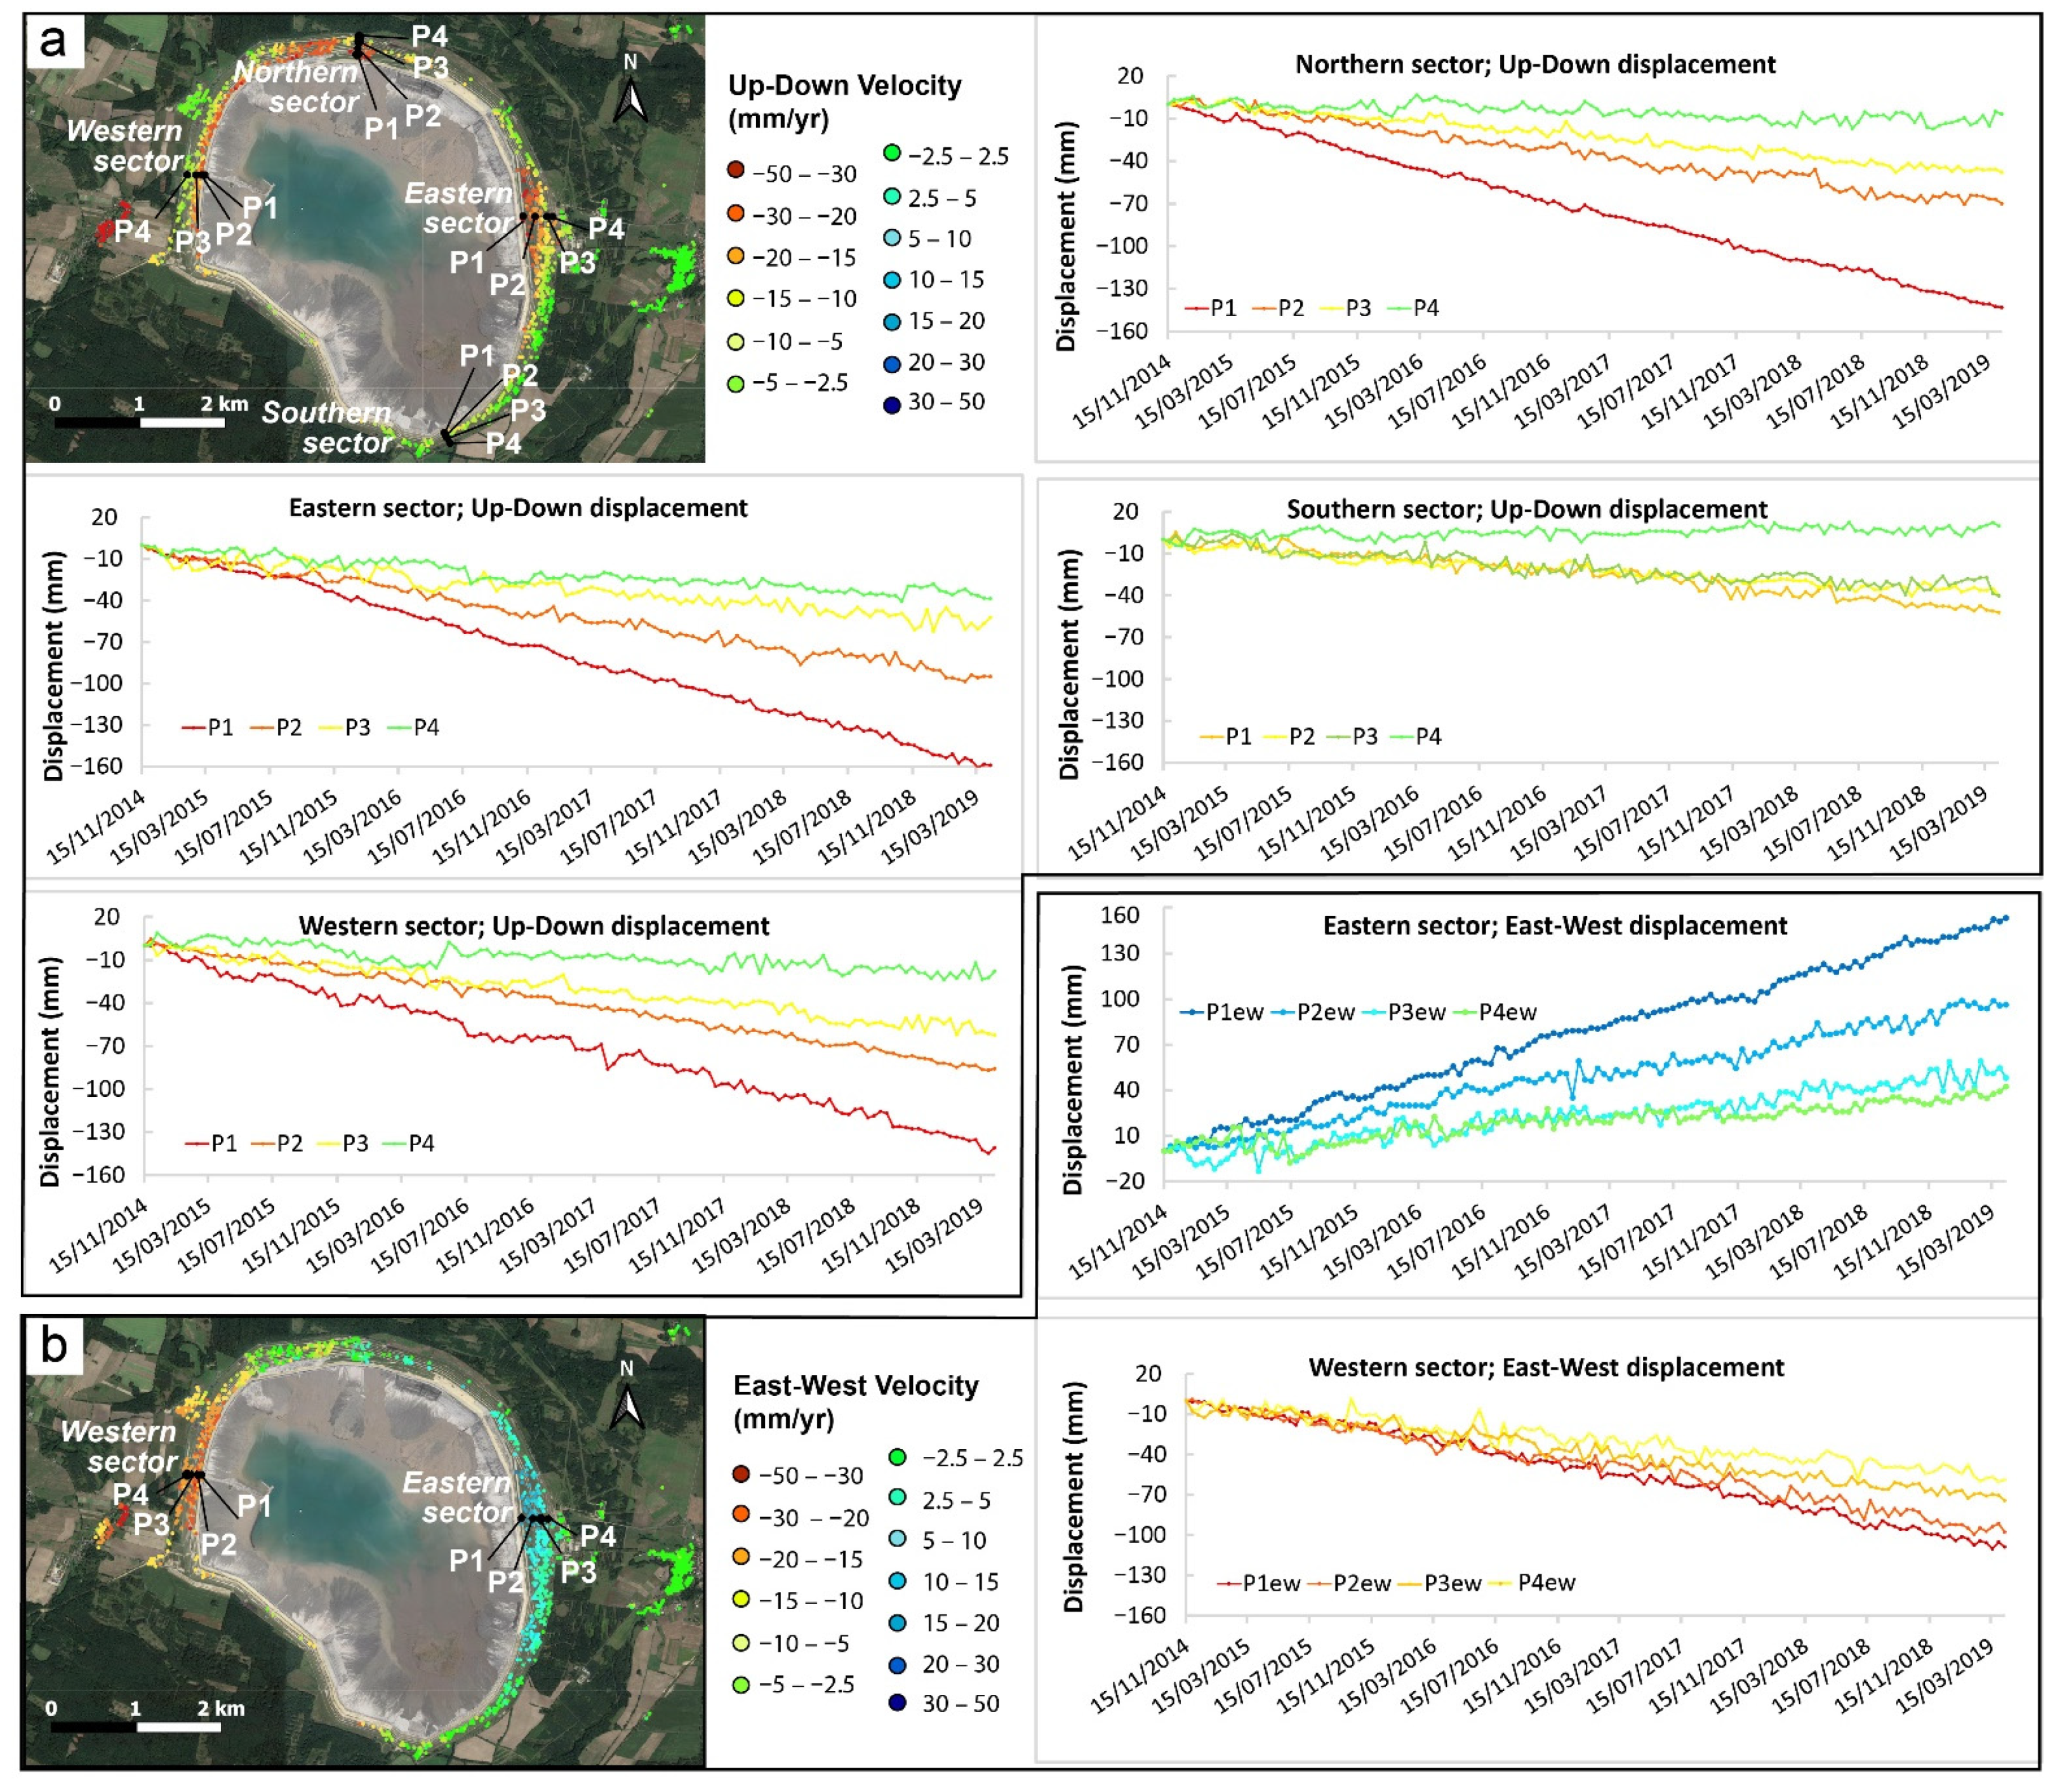
In order to analyze the trend of horizontal and vertical displacement over time, the time series of displacement has been computed for each measurement point. Some interesting examples are shown in
Figure 5: for each sector of the dam, four time series selected at different highs of the dam body are represented (location of the selected points is also given in the map panels). For each dam sector, Points P1 are located near the beach and the ponds, in a higher position; points P2 and P3 are selected in the middle highs, and P4 are located on the starter dam. The time series of vertical displacements (
Figure 5a) highlights that the points P1 show steep trends, as they are affected by intense deformation. The deformation pattern increases quite steadily over time (from October 2014 to April 2019), with a linear trend. The displacements become more and more moderate, going down in altitude at points P2, P3, and P4 (less steep time series).
As regards the time series of east-west displacements (
Figure 5b), the eastward displacements are shown in blue, and westward displacements are in red. Also in this case, the trend of the time series shows larger cumulative displacements values for points located near the beach and the ponds (P1ew and P2ew) compared to the points at the foot of the dam (P3ew and P4ew). However, such difference in the horizontal deformation patterns is very weak in the western sector of the dam, where the displacement towards the west (or towards the outside), seems to take place as an en bloc movement.
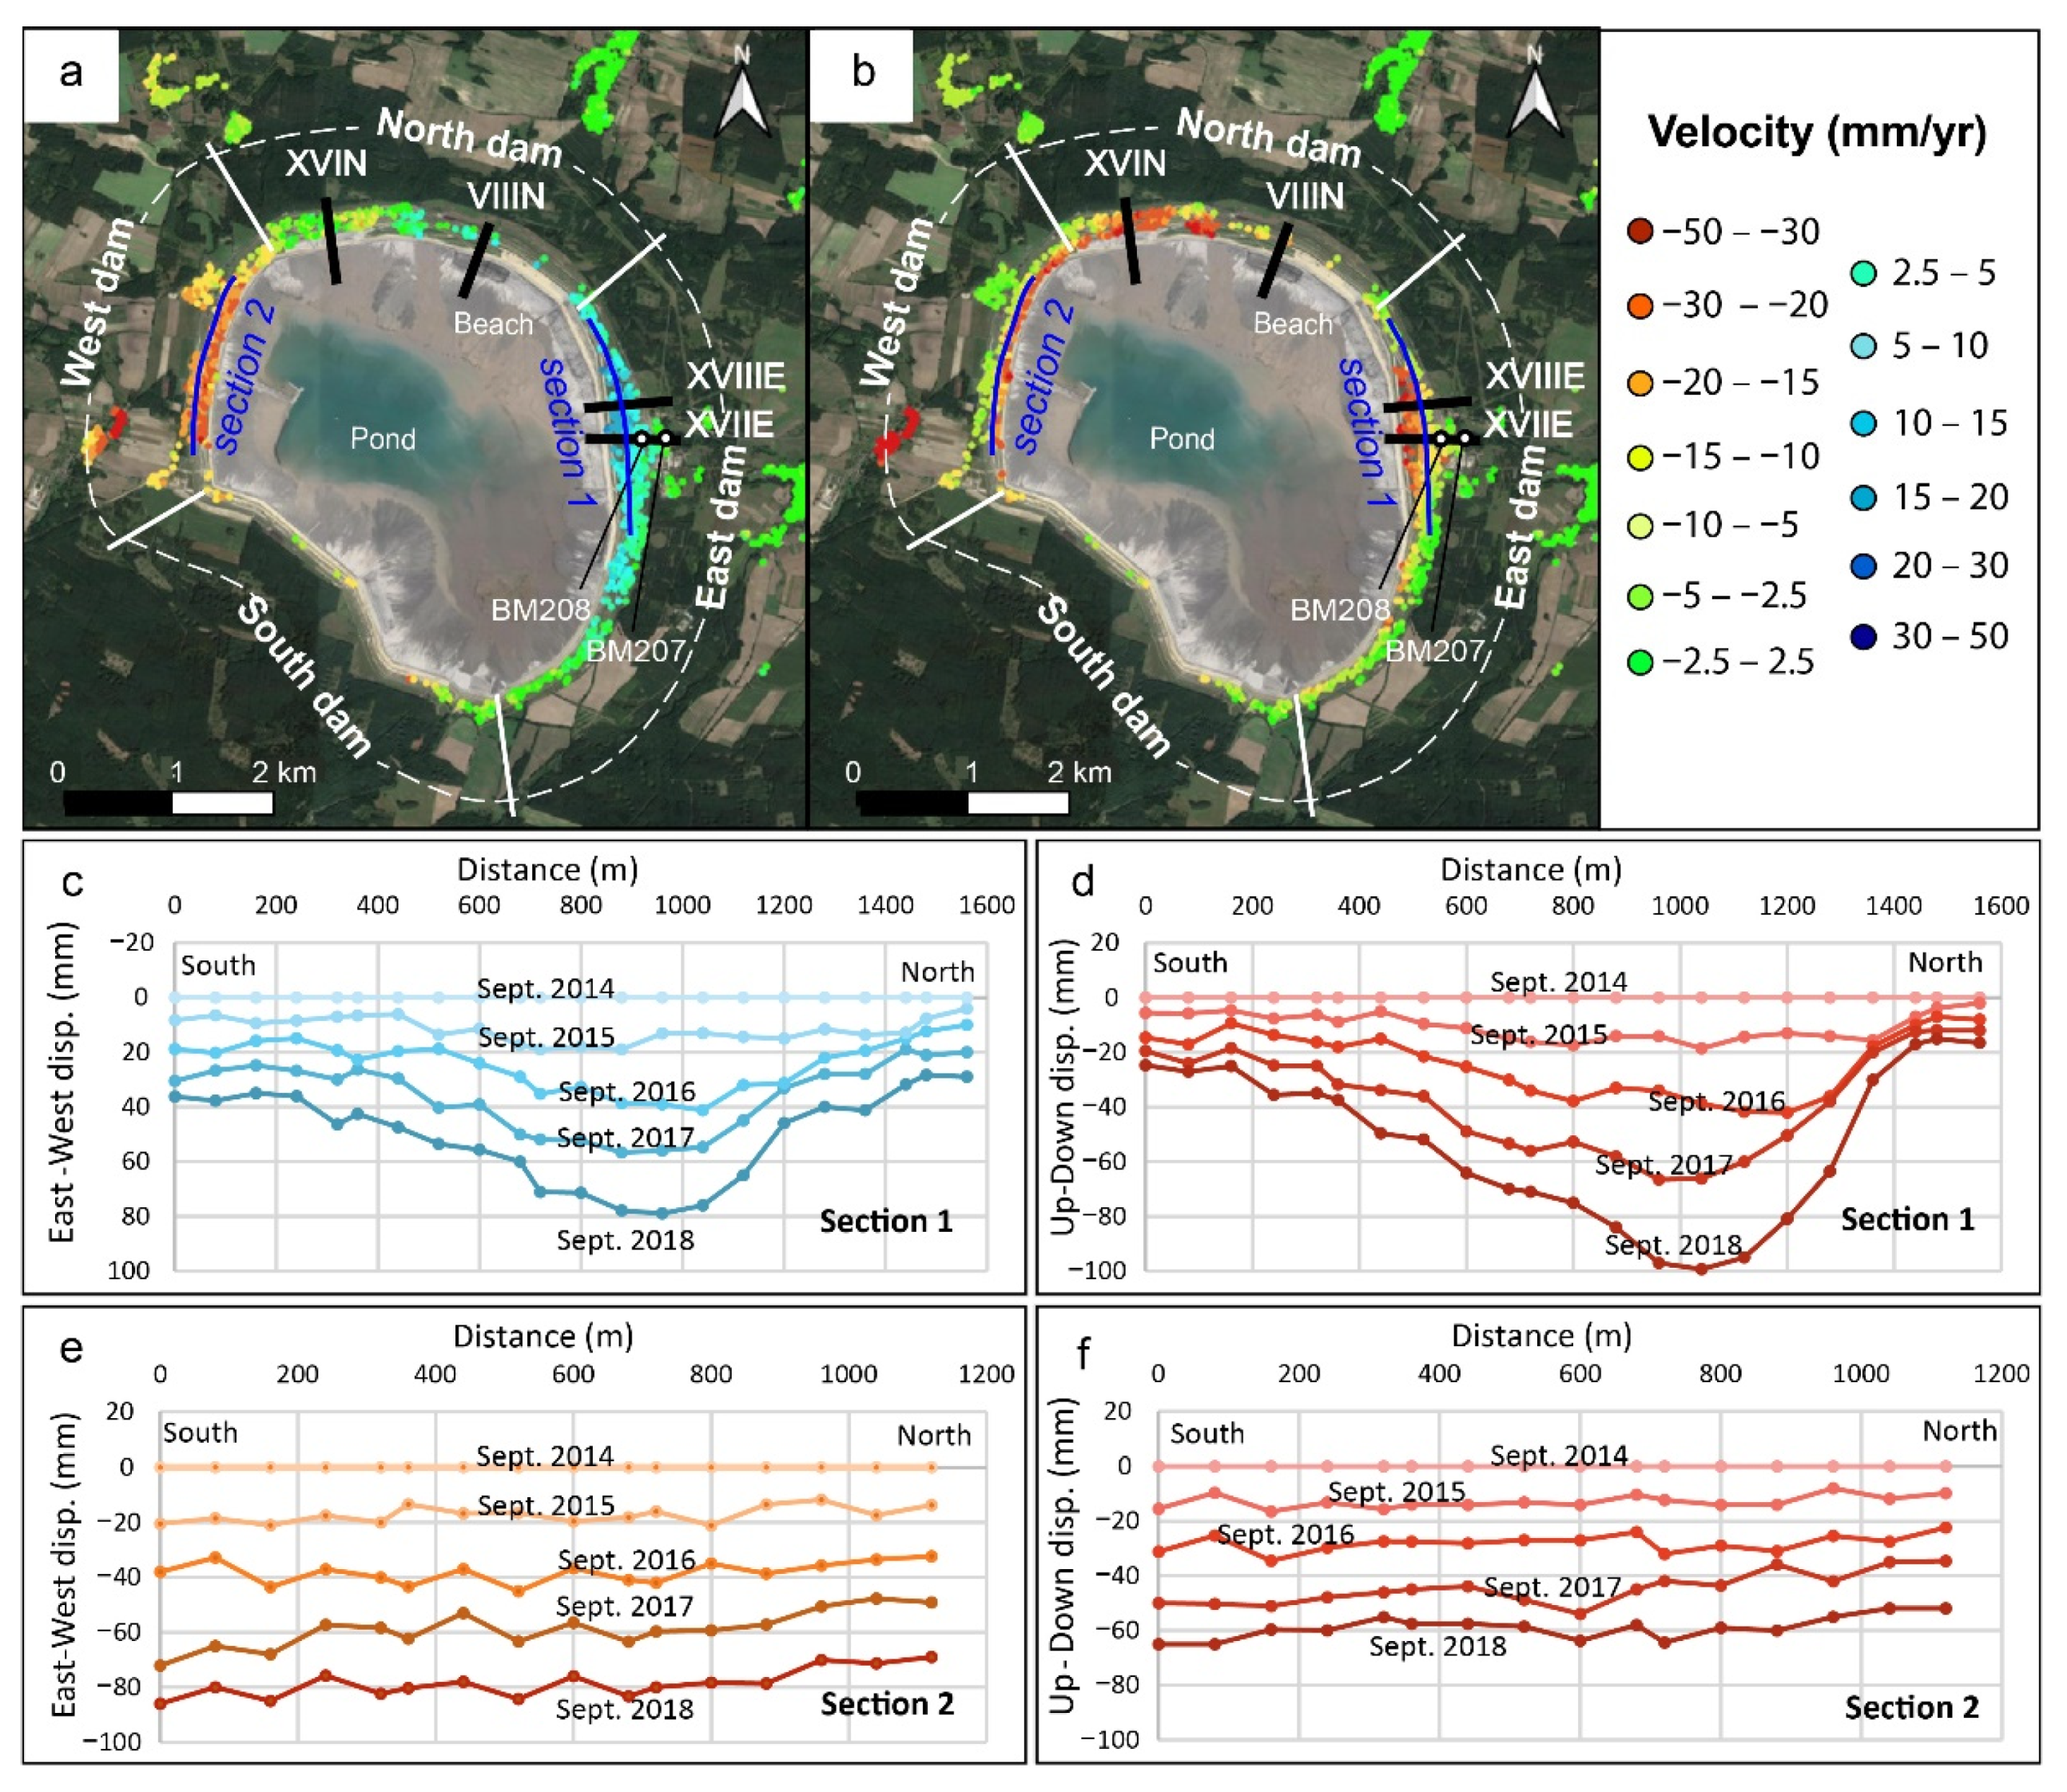
The displacement pattern in space has been investigated through two cross sections parallel to the dam body, along the eastern and western embankments (Sections 1 and 2, located in
Figure 6a,b). The cross sections run at a middling altitude of the dam body. Each curve of the section graphs (
Figure 6c–f) represents the A-DInSAR displacement profile of the dam at that height, for each analyzed year. In particular, the curves of the graphs show the cumulative deformation that affected those sectors of the dam up to September of each year, and therefore the used time span is from October 2014 to September 2018. Greater distances between the graph curves represent higher velocities of displacement.
Section 1, which concerns the eastern dam, shows that the eastern perimeter of the dam does not deform uniformly, but the central zone of the section shows more intense displacement, both in the horizontal (
Figure 6c) and vertical directions of movement (
Figure 6d), with maximum cumulative displacement of 80 mm eastwards and 100 mm downward, in about four years. As discussed above, higher deformation values are expected at higher altitudes of the dam, and lower values are expected at the base of the dam.
Section 2, along the western dam, instead shows a uniform pattern of deformation both in the horizontal (
Figure 6e) and vertical directions (
Figure 6f), with maximum horizontal cumulative displacements similar with respect to the eastern sector (about 80 mm), but in the opposite direction (i.e., westwards), and the cumulative subsidence is around 60 mm in about four years.
5. Discussion
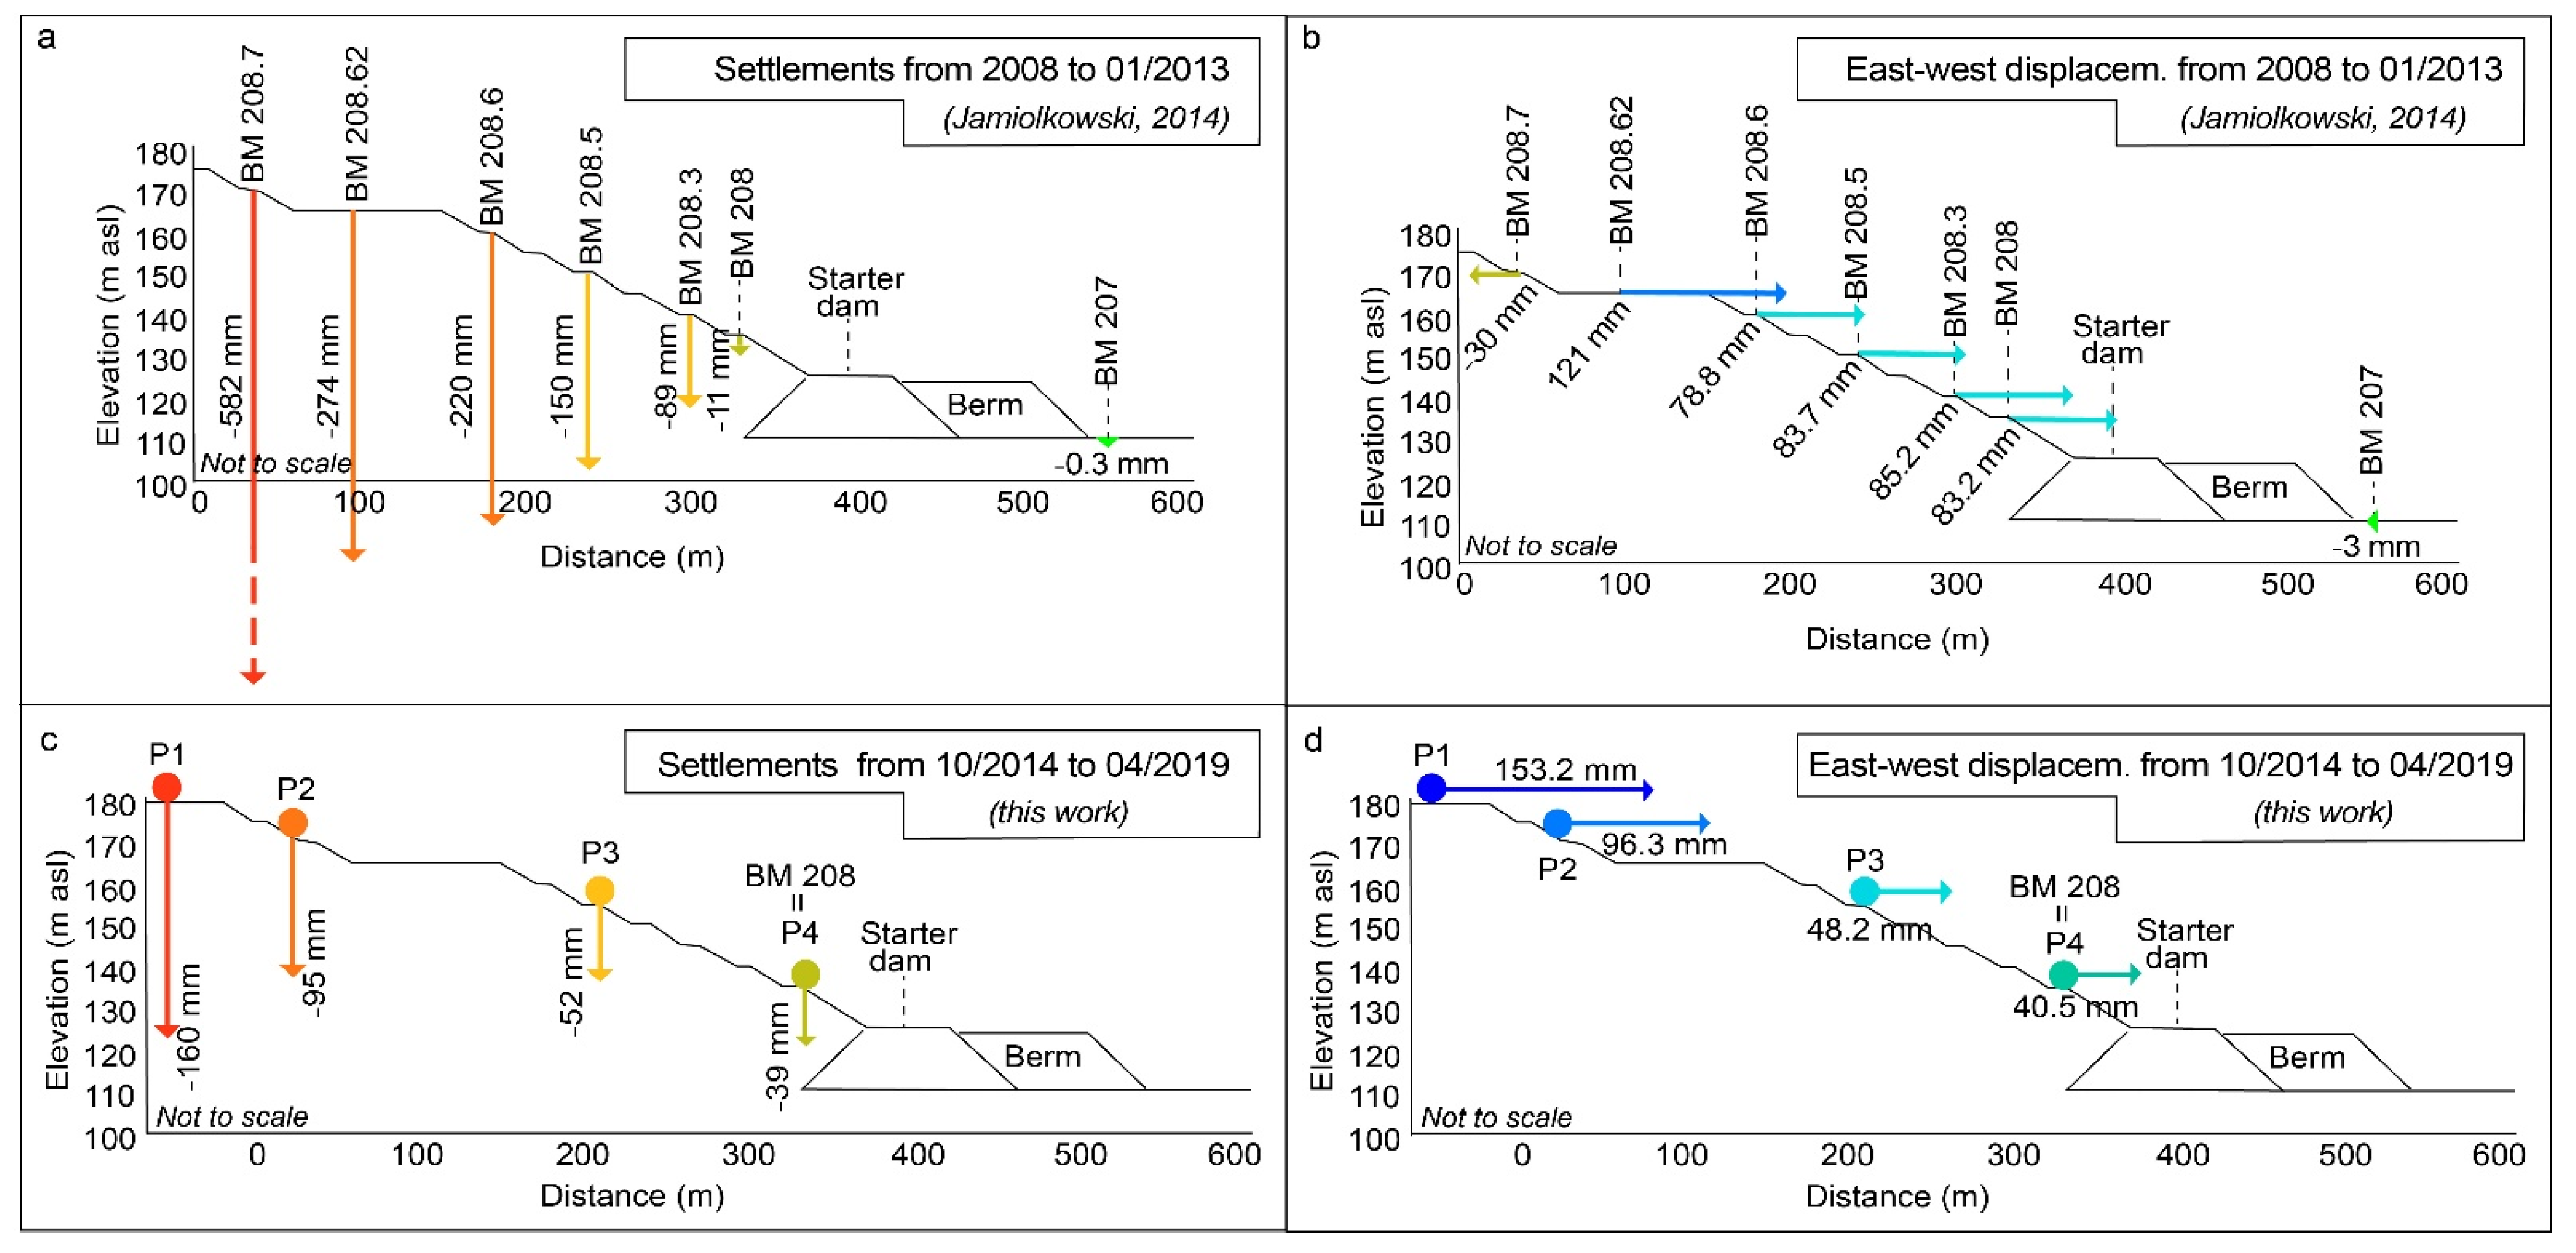
The Żelazny Most dam structure is affected by a complex deformation pattern that involves both the vertical and horizontal directions. As regards the vertical displacements, the deformation corresponds to subsidence (or settlements) occurring on the dam ring with different intensity depending on the position and altitude along the dam body: higher in the upper part and lower at the base of the dam ring. Such differential movement also concerns horizontal displacements for the eastern sector. This pattern of deformation is represented on a schematic cross section (cross-section XVIE of Jamiolkowski [
1] located in
Figure 6a,b) in
Figure 7, where both settlements and horizontal displacement are represented for two time intervals: from 2008 to 2013, with values deduced from Jamiolkowski [
1] and from 2014 to April 2019, with data measured by A-DInSAR technique. The original values of cumulated displacements provided by Jamiolkowski [
1] covered different time frames for each benchmark represented on
Figure 7 a,b, as each benchmark was monitored since different dates: for example, the benchmark BM-208 located at the starter dam (location in
Figure 6a,b), was monitored from 1981 until 2013, while BM-208.7, on top of the dam, was added later and was monitored from 2007 until 2013. To make these displacement values comparable to each other and roughly comparable also with those retrieved by the A-DInSAR four-year analysis, the average annual velocity for each benchmark has been calculated, and the related displacement value has been obtained for a time interval of four years.
Figure 7c and d show the superficial deformation achieved by A-DInSAR technique from October 2014 to April 2019 at the points P1, P2, P3, and P4, located in
Figure 5.
In both time intervals 2008 to January 2013, and October 2014–April 2019, the stronger settlement affects the highest and the most recent part of the storage facility, although the intensities of the deformation are different, and are more moderate in the second time interval, probably due to stabilization measures implemented and slowdown in dam construction operations.
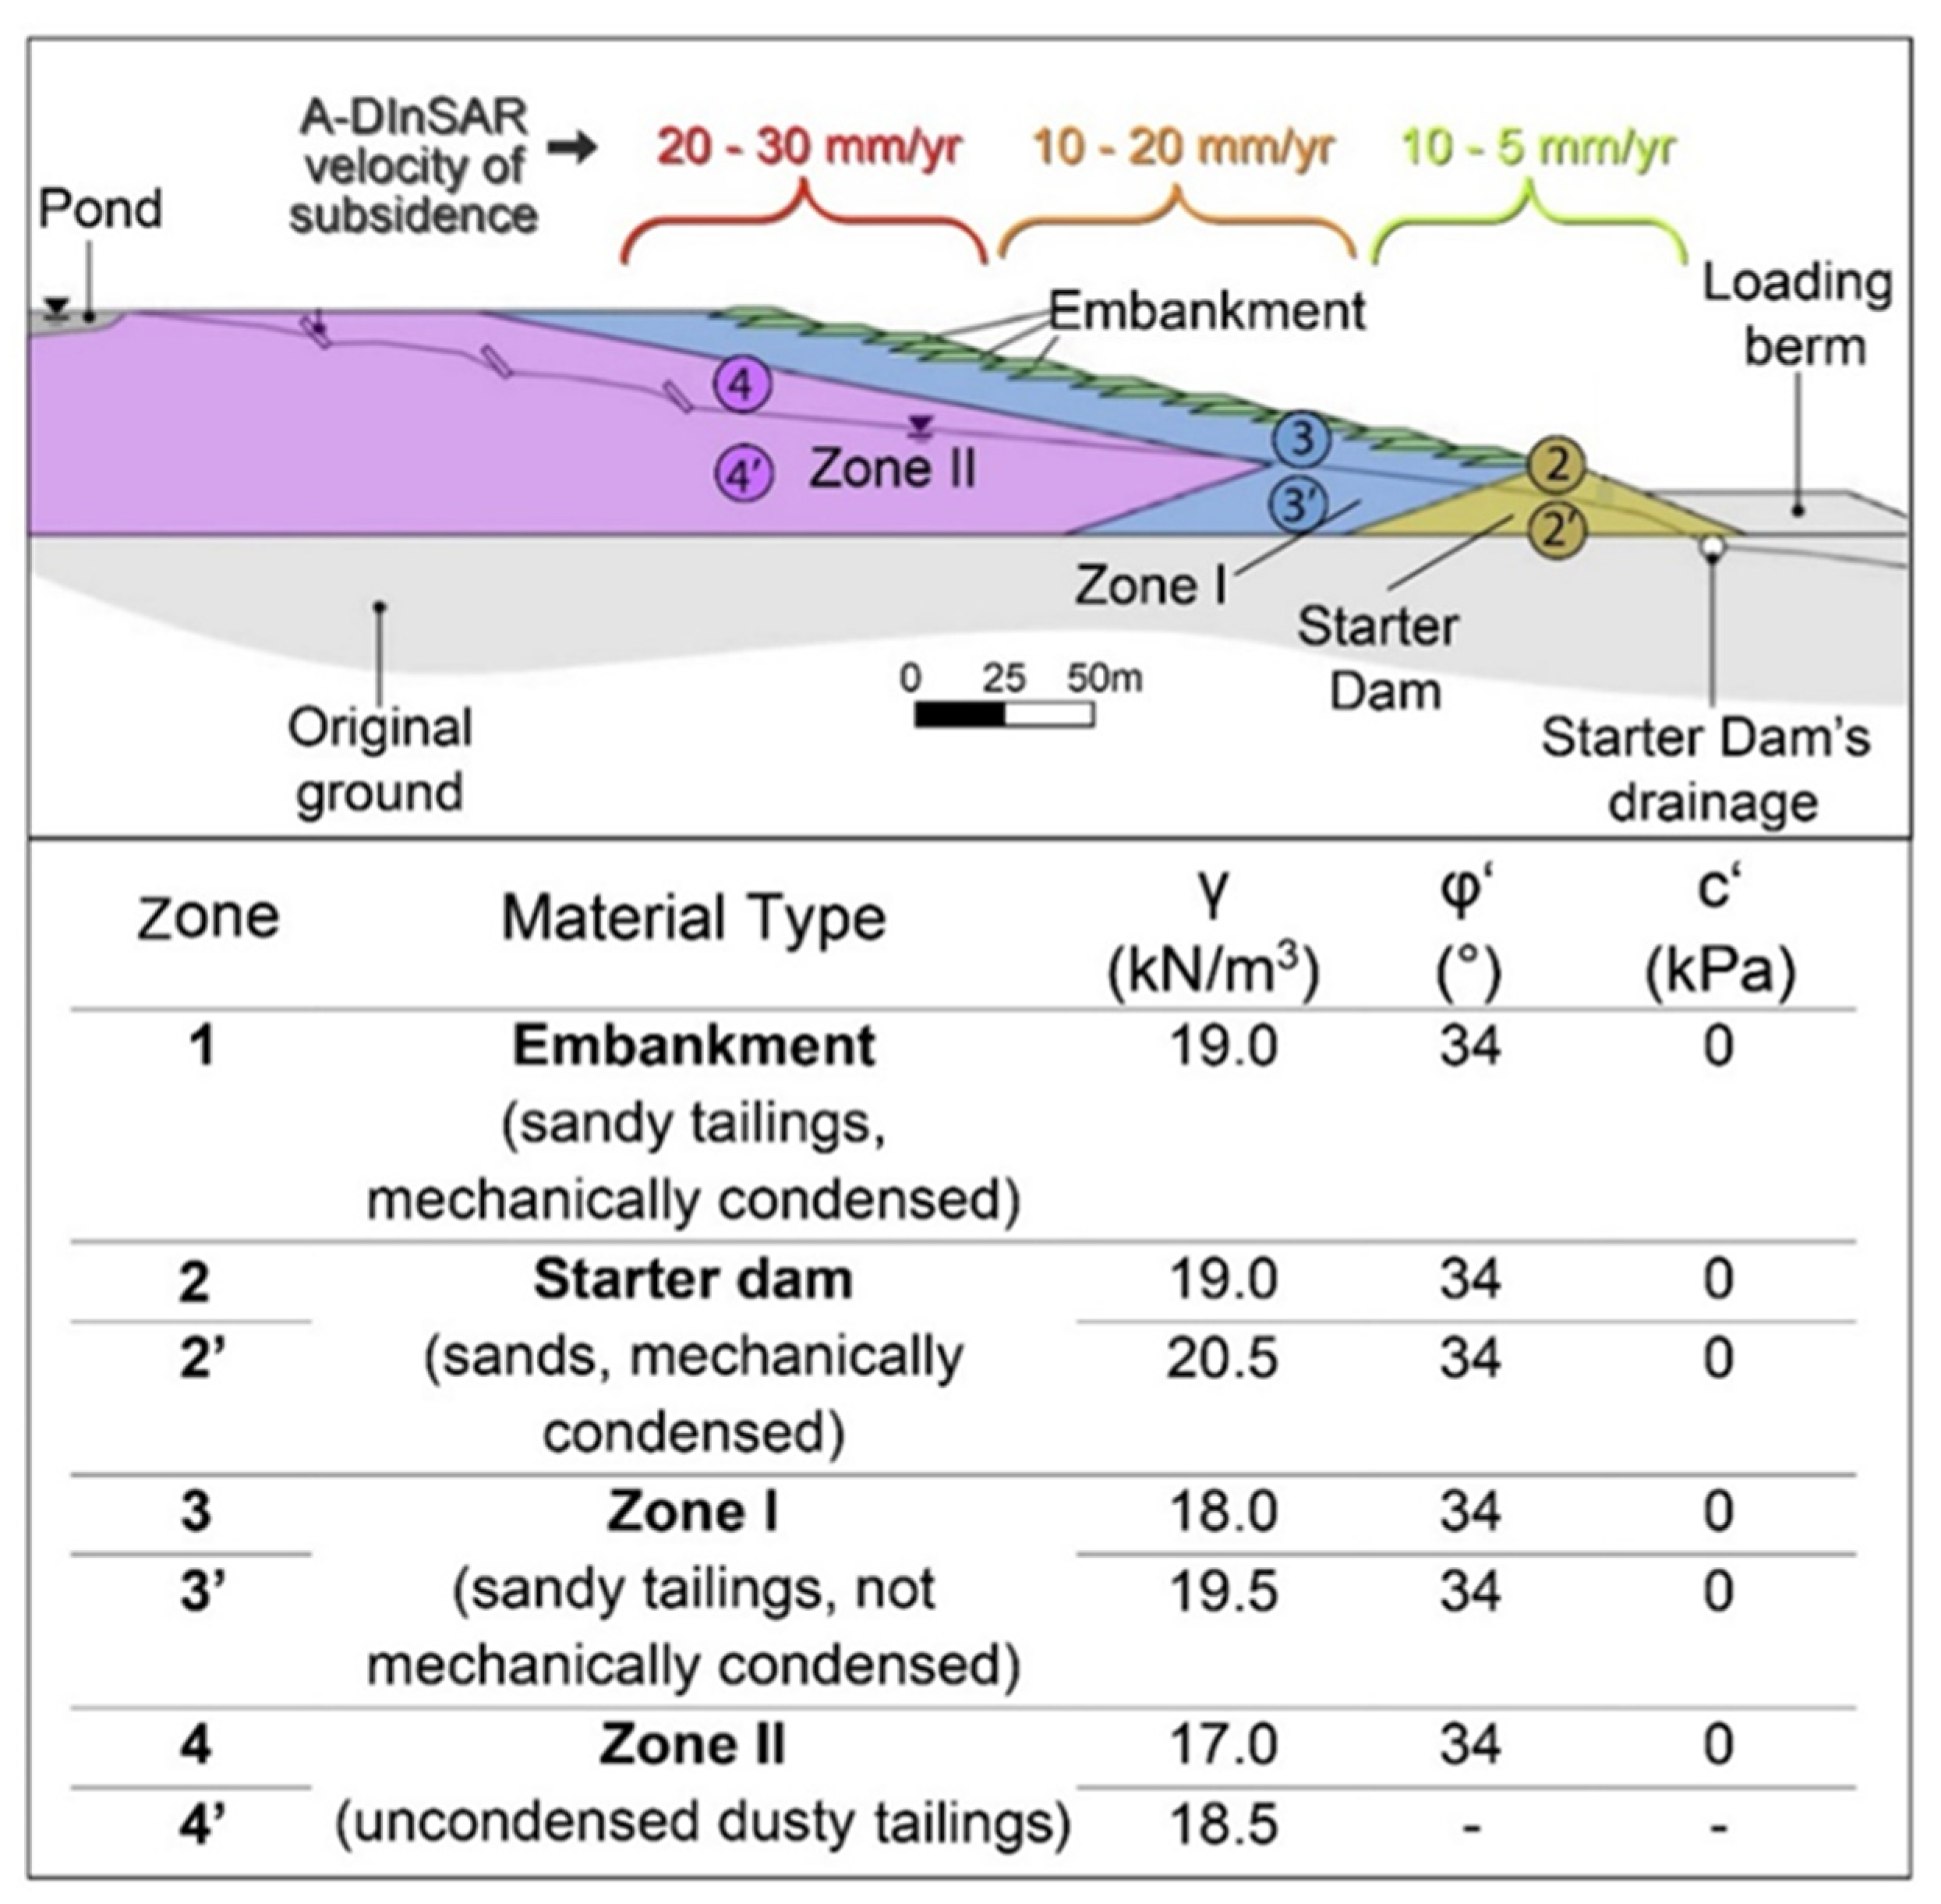
In general, it is possible to conclude that on the starter dam the deformation is moderate, while it increases towards the higher, inner, and therefore most recent parts of the dam. Such spatial distribution of subsidence rates could be linked to the age of construction and therefore to a different consolidation degree of the tailings, but it could also be linked to internal zoning of the dam materials and to differences in their thicknesses. Stefanek et al. [
30] described the deposition system adopted for the tailings dam construction. These authors state that the coarse tailings remain on the beach, while fine-grained (dusty) tailings flow into the pond, forming an impermeable layer underneath the water table, useful to strongly reduce seepage beneath the pond. A scheme of tailings zoning in the site’s embankment is given in
Figure 8, as well as the list of the selected geotechnical parameters of the soil for each zone of the dam structure [
30]. The range of subsidence A-DInSAR velocities, corresponding to each part of the dam section (eastern and the western sectors of the dam which show a similar pattern of vertical deformation), are also reported above the profile in
Figure 8.
According to Stefanek et al. [
30], the material type that forms the starter dam is sand mechanically condensed (2 and 2’ in
Figure 8). In this basal part of the dam ring, the subsidence rate can range from 5 to 10 mm/yr. Zone I consists of sandy tailings, not mechanically condensed (3 and 3’ in
Figure 8) and Zone II, which is the most inner part of the dam structure (4 and 4’ in
Figure 8) is made of uncondensed dusty tailings. The parts of the embankment affected by more intense subsidence (20–30 mm/yr) are founded on greater thicknesses of sandy tailings not mechanically condensed or on uncondensed dusty tailings (note the thickness of the Zone II in
Figure 8). Therefore, the more pronounced subsidence rates in the highest sectors of the dam could be linked both to the most recent age of construction and to the larger thickness of compressible materials in the inner part of the dam body.
As regards the horizontal deformation rates, the eastern sector of the dam moves towards the east and the western one moves towards the west, with vector intensity of more than 30 mm/yr in both cases. Northern and Southern sectors of the dam do not show evident horizontal deformations in the east-west direction. It could be possible that these sectors undergo horizontal deformations in the north-south direction along which the classical AD-InSAR technique cannot provide measurements [
48,
49].
By the analysis of the horizontal displacements that occur along the eastern and western sectors, the dam structure appears to deform towards the outside, with velocity vectors approximately radial to the center of the basin, and about the same intensity in both sectors of the basin.
The velocities recorded with A-DInSAR along the dam were compared with those acquired by Jamiolkowski [
1], who analyzed inclinometer measurements located along the dam. Along the eastern side of the dam, 26 deep inclinometers were placed and aligned along two cross sections, the XVIE and XVIIIE (located in
Figure 6a,b). These measurements highlight the occurrence of horizontal displacements localized at precise depths, where horizontal deformation takes place along sliding planes [
1]. According to the author, the movement in the dam foundation is indeed concentrated along sub-horizontal shear planes, formed through glacio-tectonic phenomena in the Pliocene clays. Such planes can be described as ‘horizontal thrusts’ where the shear strength is close to residual, thus controlling the stability of the dam [
1,
30,
51]. Therefore, the inclinometers measured the horizontal displacements of the top layers of Pliocene high plasticity clays, which are induced by tailings load. The inclinometer installed at the benchmark-208 (BM-208 located at the cross-section XVIE in
Figure 6a), shows two active shear planes, at elevations 75 m and 45 m asl [
1].
In
Table 2 are listed the horizontal velocities of displacement at BM208, from 1999 to 2013, using data from Jamiolkowski [
1], while from 2014 to 2018, the horizontal velocities of displacement have been retrieved by the A-DInSAR analysis, averaging the velocity for each analyzed year. Such east-west velocities are well comparable with the horizontal rates measured by Jamiolkowski [
1] for previous years, i.e., 2011–2013. According to Jamiolkowski [
1], towards the end of 1995, when the dam crest had reached the height of 40 m, the rate of horizontal surface displacement increased, so that during 2001–2009 displacement rates were between 40 and 50 mm/year. The horizontal displacements were mitigated by some stabilization measures implemented during 2007–2009 at the dam structure, which resulted in a moderate reduction of movement measured at BM208 (i.e., at the starter dam) of about one-third of the previously observed rate of displacement (
Table 2).
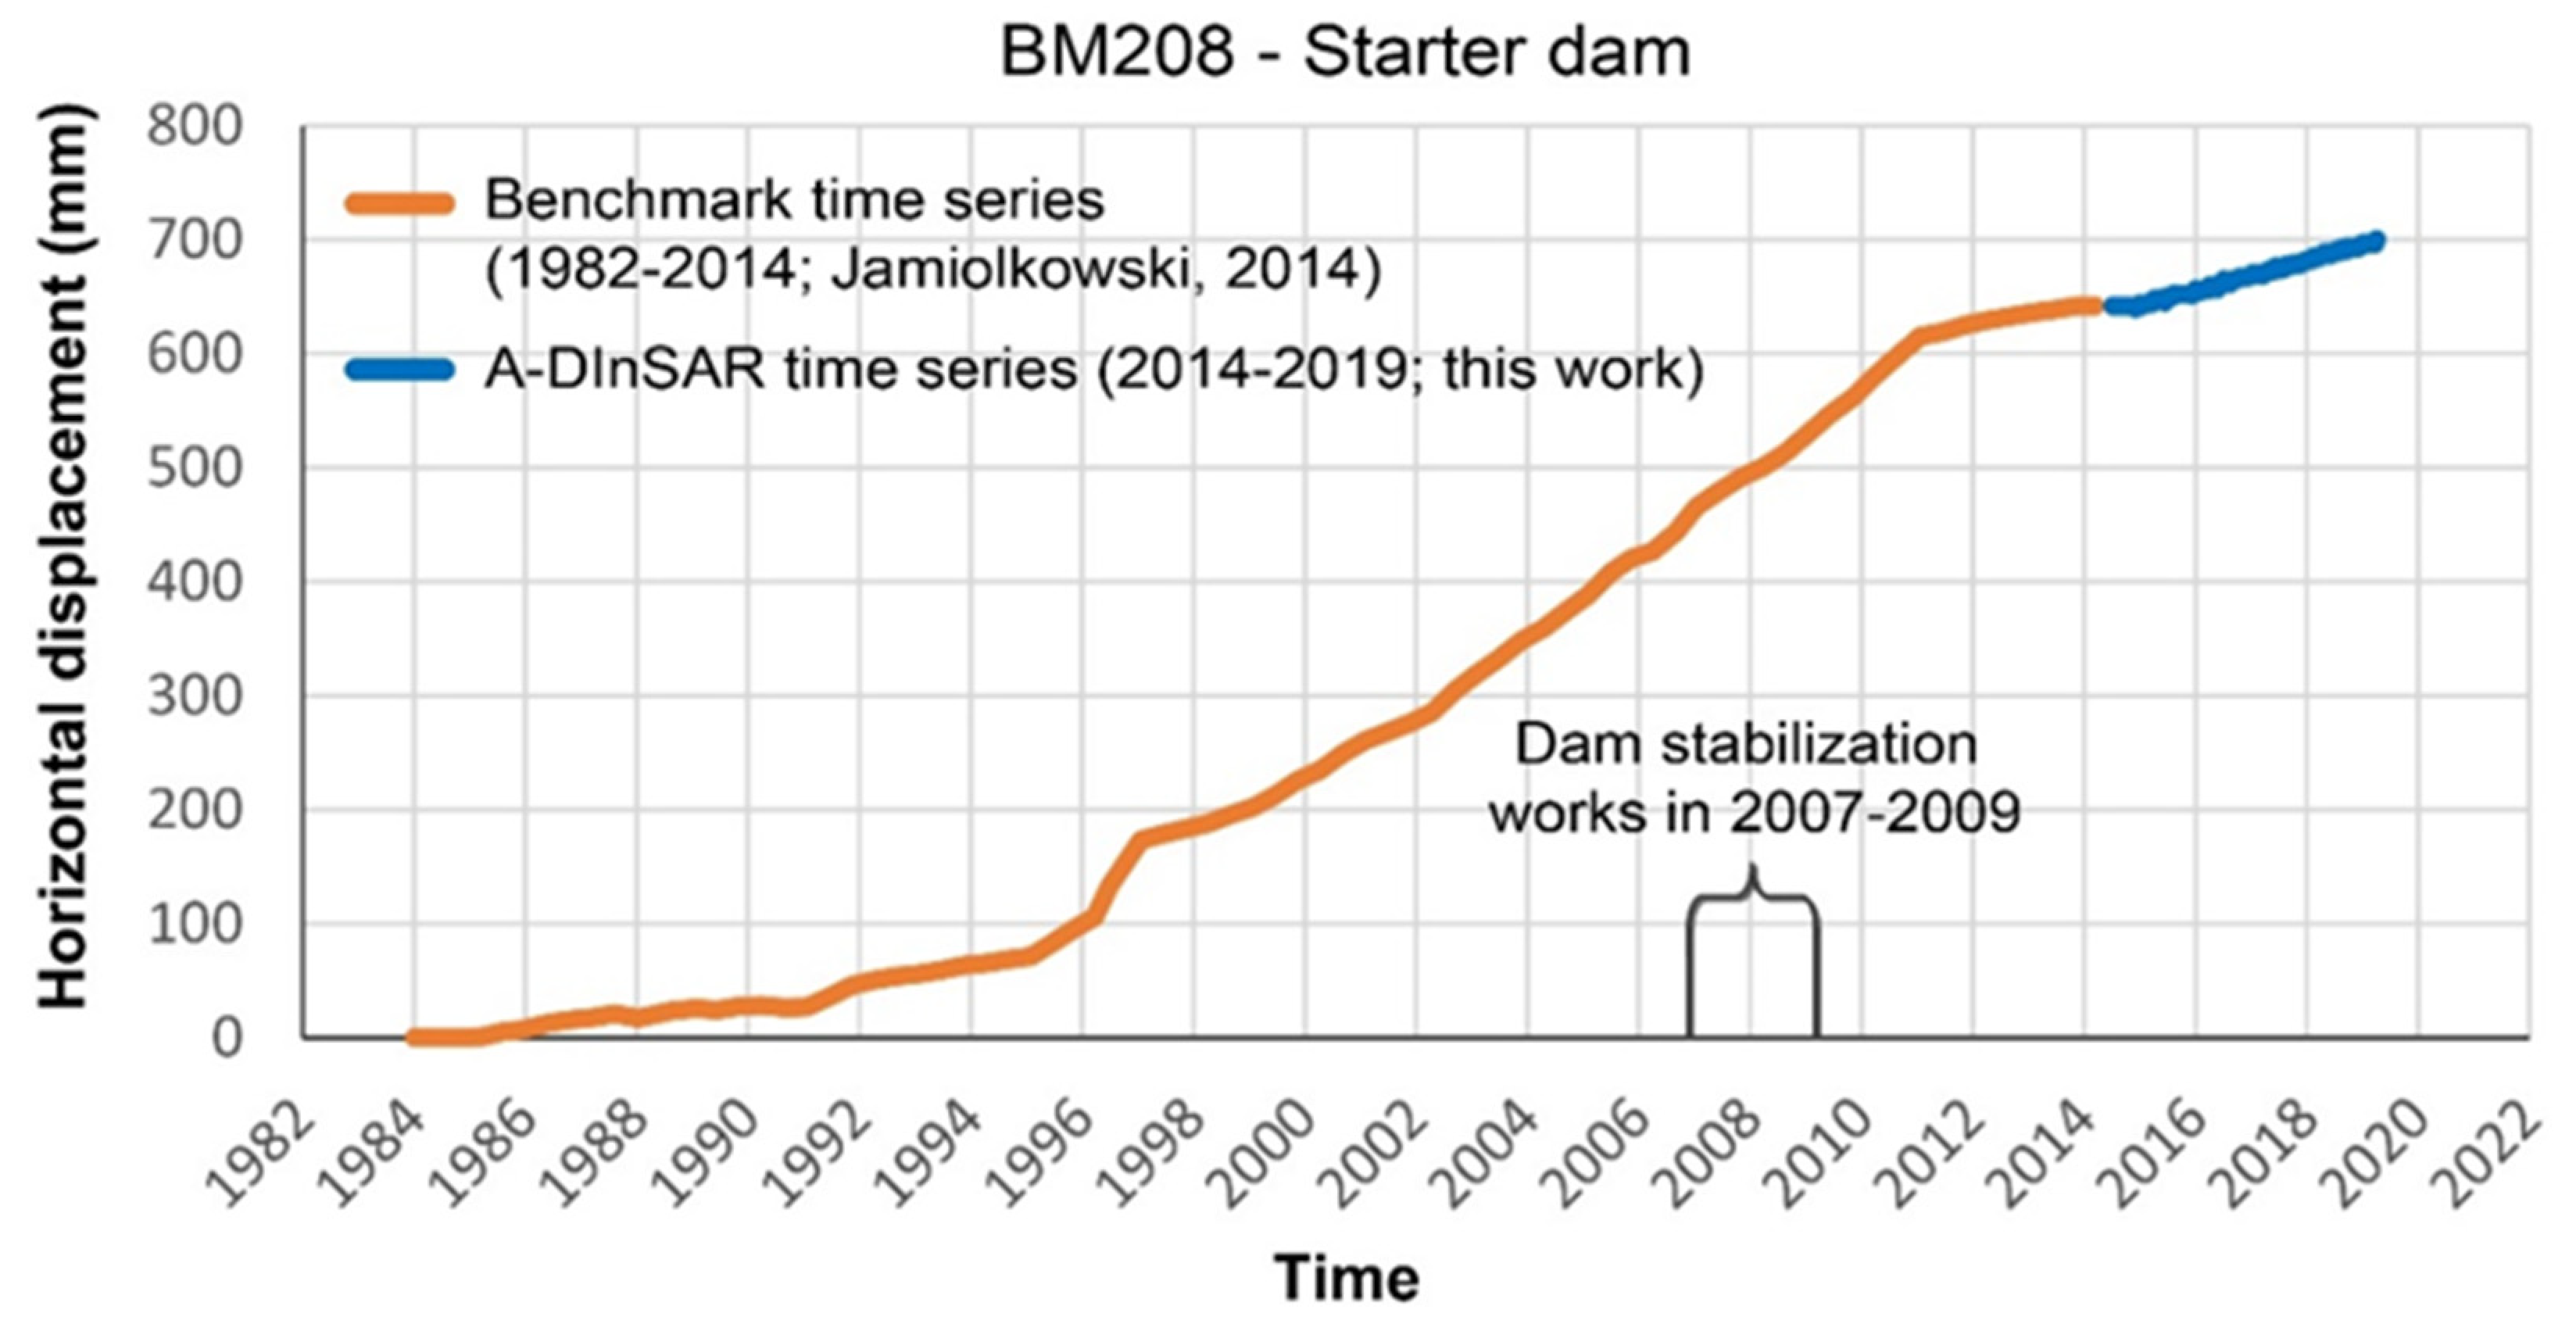
The time series of displacement of BM208, from 1982 to 2014, achieved by benchmark time series [
1], has been extended to 2018 (
Figure 9), using the A-DInSAR measurements. The time series since the second half of the 90s until 2011 shows a steady growth of the eastward movement, with a constant velocity. From 2011 to 2014, and therefore until the end of the period analyzed by Jamiolkosky [
1] (orange line in
Figure 9), the curve reaches a plateau, and the horizontal displacement slows down. From 2015 to 2019, the A-DInSAR analysis shows instead that the cumulative displacement values of the eastern dam begin to slightly grow again (blue line in
Figure 9) at the BM208.
It is worth mentioning that the time series of the displacement of BM208 represents the behavior of the base of the dam structure (starter dam), while at higher altitudes of the dam, the intensity of horizontal displacements is considerably greater, as stated above (
Figure 7b,d). As discussed in previous works, the geodetic and the inclinometer data show that the starter dam and the foundation soil above the shallower shear plane in clays (45 m asl) move as a single, rigid body [
1]. This behavior changes at higher elevations within the dam, where there is a more complex deformation mechanism.
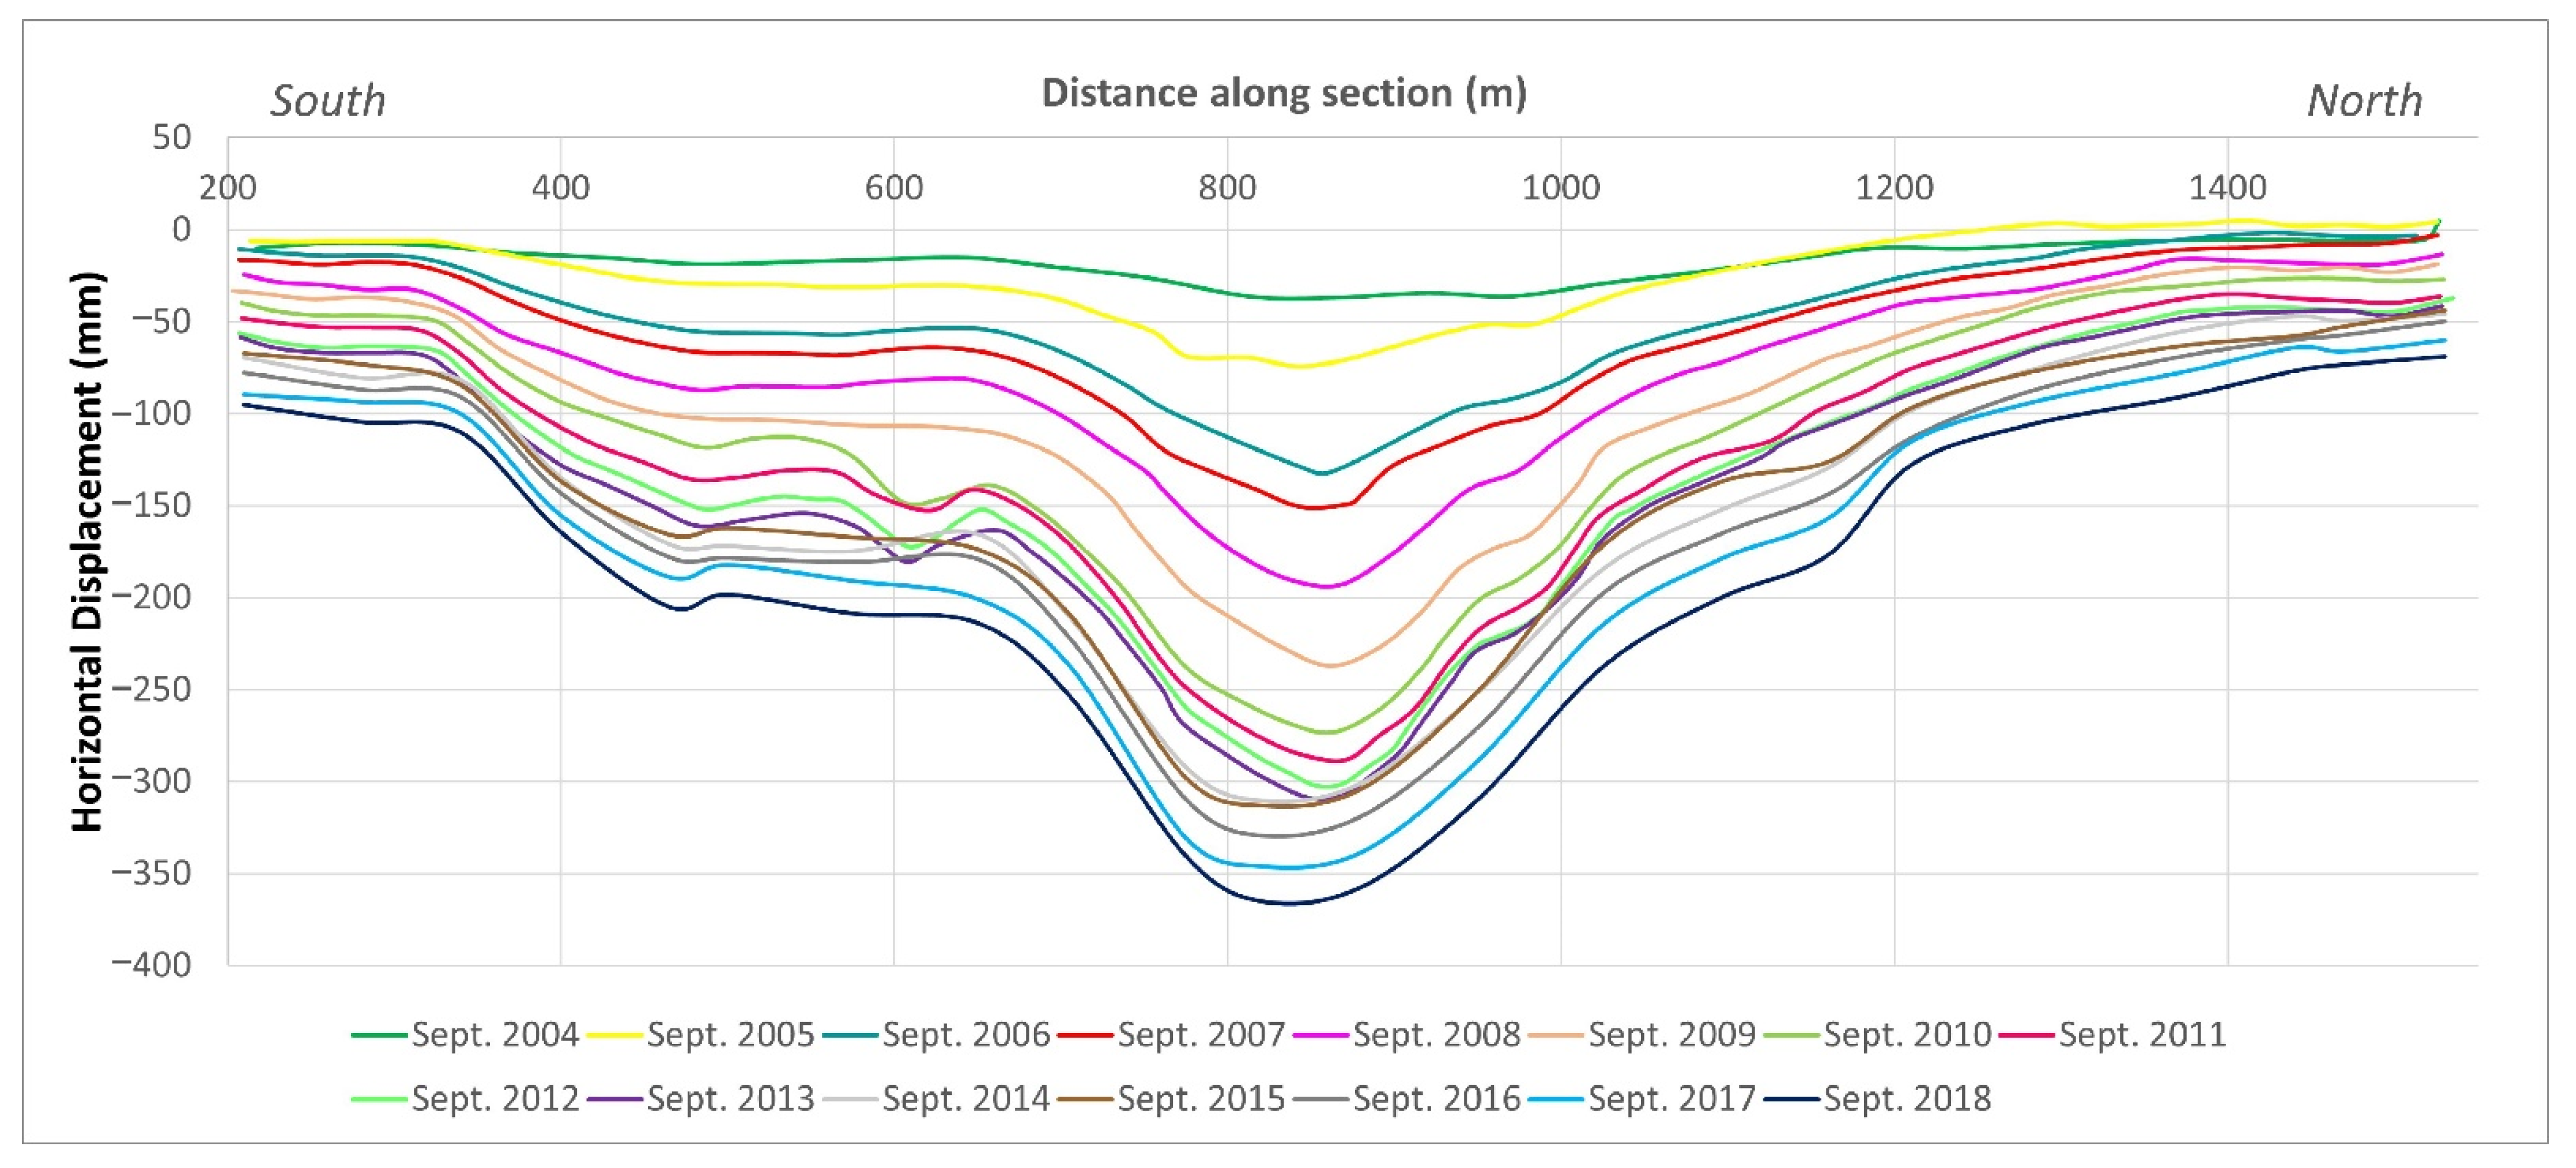
The longitudinal section along the eastern dam (Section 1 in
Figure 6a,b) shows how cumulative displacement is distributed along the eastern perimeter and allows for the analysis of the spatial deformation pattern of the east side of the dam. Each curve of the graph shows the cumulative deformation that affected the dam up to September of each year. This timing was chosen in order to compare and combine this graph with the same longitudinal section of Jamiolkowski [
1], which represents a plan view of horizontal cumulated displacements from 2004 to 2013. The latter has been extended with the measurements obtained by A-DInSAR for the years 2014–2018, along the longitudinal section at medium height of the dam (
Figure 10). Despite some uncertainties about the exact location of the section of Jamiolkowski, the curves show a very similar trend: greater displacements occur in the central part of the eastern dam, and the rates of eastward displacement (that can be deduced by the distance between the curves) are similar. Two remarks can be made about the above mentioned discussion: the first one is that in the eastern sector of the TSF, the dam does not behave like a rigid body and shows areas of greater weakness in the central part; the second remark is that, although the horizontal deformation seems to have had a slowdown from 2010 to 2013, it continued in 2014 to 2018 with recovered intensity, up to almost 370 mm of displacement. It is possible that stabilization and prevention works performed to reduce the lateral sliding of the dam have not been effective.
In the western sector of the dam (which was not described by Jamiolkowski [
1]), the deformation rates are very similar to that of the eastern dam, apart from the direction of the horizontal movement, which is to the west, and the spatial pattern of the displacement along the longitudinal section (
Figure 6e), which shows a displacement in bloc of the dam body. Therefore, in this sector there are no localized areas of weakness, as is evident for the eastern sector, and the horizontal movement is uniformly distributed along the perimeter of this part of the dam.
According to the above-mentioned hypothesis that the whole embankment structure is moving outwards, the horizontal displacement of the northern and southern sectors of the dam should be, respectively, northward and southward. As aforementioned, the typical limitation of the InSAR technique in measuring displacements in the North-South direction could therefore lead to an underestimation of north and south displacement of the dam. In support of this hypothesis, the north dam started exhibiting horizontal displacements in 2006/2007, and the rates increased with time, according to Jamiolkowski, [
1]. These displacements were localized along two sections of the dam: section VIIN and section XVIN (localized in
Figure 6a,b), with a total cumulated displacement since 1987 to 2013 of 283 mm and 408 mm, respectively. Even in the northern sector the horizontal deformation did not occur uniformly but affected mainly these two specific areas. As regards the southern sector of the dam basin, on the other hand, we do not have any precise information on the possible occurrence of southward displacements at the embankment.
The displacement of the dam towards the outside of the dam basin can be produced by two combined factors: (1) the load of the tailings pushing on the containment banks, (2) the sliding along sub-horizontal shear planes at depth, in the high plasticity, over-consolidated Pliocene clays, where the shear strength is close to the residual (details on shear strength parameters can be found in Jamiolkosky [
1], and reference therein). The high-plasticity clays exhibit a strong spatial variability, discontinuous pattern, and variable lateral extension [
1]. The occurrence of some localized areas of weakness, with greater horizontal deformations, observed in the eastern and in the norther parts of the dam embankment (sections XVIE, XVIN and VIIN in
Figure 6a,b), could be linked to peculiar settings of the Pliocene clays at depth; otherwise, it could be linked to structural issues of the dam structure.
Horizontal displacements potentially could cause the dam failure, as the development of progressive failure in a weak soil layer in the dam foundation is indeed considered an important mechanism of failure for tailings dam build up with the upstream method [
21]. A failure simulation at a Żelazny Most dam crest elevation of 205 m asl. (or dam height of 91 m), has been developed by [
21]. This height is expected to be reached in 2023 if the present filling rate is continued. The failure mode would result in an active rupture mechanism that continues in depth into the Pliocene clays down to the deepest measured shear zones. The authors state that this failure mode is pushing the dam forward along the pre-sheared zones in the clays at the dam foundation, ending with a passive failure mechanism in front of the dam.
A further destabilizing factor for the Żelazny Most TSF stability is represented by the effects of the mining-induced seismicity. The intense seismicity documented at LGCD (e.g., [
52,
53]) counts thousands of small tremors every year; more than 2000 events with magnitudes between 0.9 and 3.5 are recorded yearly in this district [
53]. The earthquakes with magnitude >4 could have an influence on the susceptibility of tailings to failure and can represent a triggering factor for such a system, affected by active and continuous deformation processes. Several mining-induced tremors occurred in the analyzed time span near the dam facility: two M 4.0 events in September and October 2015 struck the mine district at 2.8 km and only 400 m from the dam, respectively, and in 2016, four other major events (ML 4.1, 4.3, and 4.5) occurred within a radius of 9 km from the dam. The closest epicenter was that of the ML 4.3 tremor of 17 October, which occurred about 3.7 km away from the dam. However, these important seismic-induced earthquakes that affected the area near the Żelazny Most TSF caused no observable changes in the dam’s deformation pattern analyzed by A-DInSAR. As described in Jamiolkowski [
1], various Norwegian Geotechnical Institute technical reports investigated the effects of mining-induced seismicity on the stability of the East dam and of the tailings, and according to these authors, the impact on the stability of the ring dam has not been considered as relevant.
6. Conclusions
Evaluation of tailings dam stability is a complex geotechnical study, involving the hydrogeological settings assessment, the analysis of the tailing material composition, the deposition technology and the possible triggering factors leading to dam failure, like man-made factors but also including earthquakes or heavy rainfalls.
The monitoring of these delicate and important infrastructures is of strategic importance to prevent damage or failures and to plan tailored risk mitigation measures. Satellite remote sensing technologies, such as satellite SAR Interferometry, represent a consolidate and effective tool for monitoring of structures and infrastructures, including the tailings dams, allowing for analysis of the whole basin, and obtainment of temporal information, using data archives.
The deformation processes at Żelazny Most tailings dam have been analyzed by A-DInSAR technique from October 2014 to April 2019, showing that the storage facility is affected by both vertical deformation (settlements or compaction phenomena) and horizontal sliding towards the outside of the dam. The displacements have been compared with the deformation pattern observed by in situ measurements for the previous years by Jamiolkowski [
1], especially for the eastern part of the dam.
Subsidence or settlements in the tailings dam constructed by the upstream method, where the new embankments are founded on tailings, is generally expected as its height increases. The settlement rates of the 2014–2019 period is lower than those described by Jamiolkosky [
1] for the previous years, but they have a constant growth trend during the analyzed period. The more affected zones are the upper and the recent parts of the TSF due to both a lower consolidation degree of the recent tailings, and a larger thickness of compressible materials in this inner part of the dam structure.
Horizontal displacements at the Żelazny Most TSF are of primary importance in assessing the stability of the dam. The direction of such horizontal displacements is radial from the center of the dam basin, and in the eastern and northern sectors, it is more severe in some localized areas, while the western sector is moving westward evenly. The outward displacements can be produced by two combined factors: the load of the tailings is pushing the dam forward along horizontal slip zones at depth in the glacio-tectonic surfaces located in the over consolidated Pliocene clay, where the shear strength is close to the residual. This mechanism could end with a passive failure in front of the dam, with a major negative impact on the economy, surrounding properties, and people’s lives aggravated by possible large run-out distances. An accurate monitoring of the storage facility is therefore of crucial importance, especially in the dam sectors where intense deformations have been identified. A proper monitoring plan to mitigate the risk of a dam failure could include the use of Terrestrial SAR interferometry ([
54,
55,
56]), which is considered a proper technology for early warning purposes. Due to its high sampling frequency of data collection (in the order of few minutes or even seconds) and its high accuracy of displacement measurement (up to decimal millimeter order), this technique can be effective for high resolution, local-scale real-time monitoring.
A subsequent development and improvement of this study should consist of the accurate estimate of the local displacement field, including possible N-S movements, overcoming the intrinsic limitations of the 1-D LOS measurements of the satellite SAR interferometry [
48,
49]. A straightforward approach is the combination of multiple InSAR LOS measurements from different viewing geometries and different angles of incidence [
50,
57], but it is also possible to resolve the full 3-D surface displacement vectors merging LOS measurements together with other geodetic observations, mainly GPS data [
58,
59,
60].


 ,
, 


