Article

The Mediating Role of Social Capital in Digital Information Technology Poverty Reduction an Empirical Study in Urban and Rural China

1
School of Business, Nanjing Normal University, No. 1 Wenyuan Road, Nanjing 210023, China
2
College of Public Administration, Nanjing Agricultural University, No. 1 Weigang, Nanjing 210095, China
*
Author to whom correspondence should be addressed.
Land 2021, 10(6), 634; https://doi.org/10.3390/land10060634
Submission received: 7 May 2021 / Revised: 9 June 2021 / Accepted: 10 June 2021 / Published: 15 June 2021
(This article belongs to the Section Urban Contexts and Urban-Rural Interactions)

Abstract

:
Widespread use of digital information technology is having a significant impact on economic growth and people’s well-being. This paper assesses the mediating role of social capital in the impact of digital information technology on multidimensional poverty. Due to differences in regional, industrial structure and other factors, digital information technology has different impacts on urban and rural residents. In this paper, the China Family Panel Studies (CFPS) database is used for data, and a mediating effect model is used to study the problem. The digital information technology use was found to enhance social capital from social network, social participation and social trust, and subsequently alleviates multidimensional poverty. The results indicate that social trust plays a more significant mediating role than social capital and social participation on the impact of digital information technology on multidimensional poverty. Furthermore, the results reveal that the use of digital information technology has varying effects on poverty reduction among different income groups, with a much higher effect on low-income groups. However, the mediating effect of social capital in high-income groups is higher than that in low-income groups. In particular, social capital in the top 25% of income groups has the highest mediating effect. In the heterogeneity analysis between urban and rural areas, it is found that the multidimensional poverty situation in urban areas is significantly better than that in rural areas, because urban residents have a higher use of digital information, and at the same time, the quality of social capital in urban and rural groups is different, leading to the difference in the effect of digital information technology on poverty reduction of multidimensional poverty. Based on the results of the study, we believe that the use of digital information technology has actually improved the multi-dimensional poverty status of all groups, and social capital plays a key mediating role in it. Relying on the progress of digital information technology, we can build more convenient social network. Establish more adequate channels of information communication, enhance social trust and social participation, and alleviate multidimensional poverty.

1. Introduction

As the study of poverty is a continuous process, the understanding of poverty has changed from absolute poverty to relative poverty, from one-dimensional poverty to multidimensional poverty, and from income poverty to ability poverty.
In history, when the level of economic development was relatively low, absolute poverty received more attention. In the early 20th century, the British economist Rowntree first defined poverty as a situation that exists when the total income is insufficient to obtain the minimum life necessities required to maintain the normal function of the body, including food, clothes, housing, etc., [1]. American economists established the “Engel’s coefficient”, dividing the minimum food cost by the corresponding consumption expenditure to get the Engel’s coefficient as the poverty line [2]. With economic development, the proportion of absolute poverty decreases, whereas relative poverty gradually becomes prominent. It is now established that measuring poverty should not rely on income solely, since poverty includes also the deprivation of welfare and the increase of vulnerability. In this respect, the relative poverty theory asserts that poverty analyses should go beyond meeting the basic living needs to acknowledge issues related to exclusion and deprivation [3]. However, either absolute or relative poverty takes income as the only measurement. It cannot comprehensively reflect the diversity of poverty and characteristics of poverty changes. Other poverty and human development issues cannot be depicted from the single perspective of income. The concept of poverty has gradually broadened from the income dimension to the ability poverty and the right poverty. Amartya Sen, pointed out that poverty not only refers to low income, but also to the deprivation of human basic needs and rights, including education, health, drinking water, housing, and sanitation [4]. At present, the bulk of the literature on multidimensional poverty focuses on its measurement and identification, consisting of income, education, health, and living standard, etc. Human poverty, proposed by the United Nations development program (UNDP) in 1997, includes economic indicators such as per capita national income, life expectancy, education, and living conditions. Rights poverty is redefined as poverty caused due to lack of rights in relation to social, economic, political, and other fields. In 2010, the UNDP broadened its view to multidimensional poverty to include health, education and living standard, which cover 10 indicators such as educational attainment, drinking water, electricity, daily fuel, and school attendance. Currently, the most widely used multidimensional poverty index (MPI) is the one proposed by the Oxford Poverty and Human Development Center (OHPI) and UNDP, which is constituted of 10 indicators and includes three dimensions, namely: education, sanitation, and life condition. According to Sen [4], the root of family poverty is caused by the deprivation of basic ability and rights, and thus he proposed in that the multidimensional poverty theory should be defined by the standard of capacity [4]. Therefore, multidimensional poverty is widely applied because of its precise measurement of family living conditions. In 17 goals of the 2030 Agenda for Sustainable Development, eliminating poverty in all forms around the world is set to be the primary goal (SDG#1) [5]. At present, China has just announced that it has solved the problem of absolute poverty comprehensively. Therefore, we have an interest in this research. When we solve the problem of income poverty comprehensively, what is the situation of multidimensional poverty in China?
Digital information technology also offers new ways to reduce poverty. Along with the wave of the fifth information revolution, the influence of digital information technology on life is increasing. Since the emergence of the fourth generation of mobile communication and its technology in 2012, digital information technology represented by mobile phones and the Internet has been rapidly popularized in China and is increasingly influencing production and life. In 2019, the penetration rate of digital economy in China’s agriculture, industry and service industry was estimated at 8.2%, 19.5%, and 37.8%, respectively. As the application of digital information technology expands and its influence deepens in China, we begin to consider its impact on multidimensional poverty. Several studies have pointed out that the use of digital information can improve people’s working and living standards. For example, Feldman and Klaas (2002) found that the use of the Internet helps residents to obtain suitable jobs, thus alleviating income poverty [6]. However, the use of digital information affects residents’ lives in multiple ways. On the one hand, digital information makes residents’ life and connection with the outside world more convenient. The truth is that the poor do not have access to digital information due to the low income, geographic isolation and limited transportation, so they cannot benefit from digital information technology. The digital divide brought about by this passive choice is unconducive to their poverty alleviation, rather it may even increase the gap between the rich and the poor to some extent, aggravating multidimensional poverty. Therefore, the first question in this paper is how the use of digital information technology affects multidimensional poverty. Second, the paper addresses the questions of how does the use of digital information affect multidimensional poverty? Is there heterogeneity among different groups? How to deepen the promotion of digital information technology in order to solve the multidimensional poverty problem more effectively?
Social capital, an important part of family capital, is found to have a significant effect on poverty and well-being. The concept was first put forward by Lidda Hannifan, who regarded “social capital” as a beneficial resource to the development of individuals and communities. This means that individuals will benefit from the mutual assistance, sympathy, and friendship provided by the community, and subsequently the community as a whole will be developed on the basis of the cooperation of its members [7]. The French sociologist Pierre Bourdieu further explained social capital from the perspective of social network, regarding it as a relatively stable, institutionalized, and sustainable social relationship network that can provide certain resources. It exists in kinship, professional, organizational, and neighborhood relationships, being strengthened through institutionalized network relationships and fixed behaviors [8,9]. As for the benefits of social capital, Putnam [10] views social capital from a public goods perspective and indicates that intensive social interaction network and the restrictive mechanism of voluntary associations reduce opportunism, opportunism and “free riding”, which represent the necessary basis for the establishment of trust relationship and credit society [10]. The influence of social capital on welfare is studied through dividing social capital. Han divided social capital heterogeneity into bonding social capital, bridging social capital and connecting social capital. He pointed out that the welfare of the poor changes with their social capital [11].
With the development of social capital theory, the literature suggests that social capital has a significant impact on income, employment and other multidimensional family poverty. Granovetter argues that any individual economic behavior is always embedded in the social network, bound to be influenced by social relationships, norms, and trust unconsciously [12]. Social trust and norms can significantly alleviate farmer’s multidimensional poverty. Social capital is one of the most important variables that influence poverty, so impoverished people in poor areas are able to get rid of poverty if they have rich social capital that ensures close social network and a high level of trust and mutual benefit [13]. Using the US census data, Rati studied the relationship between social capital and income distribution and concluded that every 1% increase in social capital would reduce the income inequality coefficient by 0.2% [14].
A critical look at the previous studies points out a number of research gaps. First, although the relationship between Internet use and poverty is studied extensively, emerging carriers such as mobile phones are not considered. The connotation of digital information technology broadens and its influence on life increases because of the rapid development of communication technology. Therefore, the more inclusive and explanatory extension of traditional Internet is developed, the more digital information technology is powerful to explain multidimensional poverty. Second, in terms of the impact of the Internet on multidimensional poverty, previous studies focus on the assessment of the impact, whereas the mechanisms of the impact received less attention, making it difficult to understand exactly how the use of digital information affects multidimensional poverty.
Third, the majority of studies about mediating effect models use coefficient difference method for testing, which cannot be applied to more complex mediating analyses involving multiple mediating variables or with adjustment [15]. In this paper, the coefficients method’s product is selected with the Bootstrap test method to test the mediating effect of social capital, which can identify the proportion of the mediating effect and its significance and influence degree.
Although it is generally believed that the development and use of digital information technology is conducive to the accumulation of social capital, previous studies were generally theoretical in nature and lack empirical analysis. Some studies have drawn empirical conclusions, but they focused mainly on economic poverty rather than multidimensional poverty. In addition, the impact of digital information on multidimensional family poverty through “social capital” pathway remains underreached.
Therefore, this paper extends the existing literature by offering a new theoretical framework for analyzing the in the relationships between digital information, social capital and family multidimensional poverty (Figure 1). With empirical data, the influence of digital information technology on multidimensional family poverty and its internal mechanism are analyzed. Digital information technology enhances social trust by reducing the cost of connecting to social networks, providing more publicly available data, and providing residents with more channels for social participation. These influences on social capital further affect the development opportunities of families and the material living standards to alleviate the multi-dimensional poverty of families. Suggestions on how to effectively exploit the potential of information technology to reduce multidimensional poverty are put forward. More specifically, the paper contributes to the existing knowledge in several important ways. First, the paper extends the definition of poverty from economic poverty to multidimensional poverty by including 7 dimensions. To measure family life and development in a more comprehensive way. Second, the paper explores the reduction of multidimensional poverty from the perspectives of digital information technology use and social capital and it tests its influencing factors using Logit regression. Third, the paper uses a large survey data from the China Family Panel Studies (CFPS), which cover 25 Chinese provinces to study the relationship between the use of digital information and multidimensional poverty of households, and thus it offers a comprehensive assessment of the impact of digital information technology on multidimensional poverty. Fourth, the paper uses a mediating effect test of social capital to further analyze the mechanism by which digital information technology influences multidimensional poverty to expand the research on the effect of digital information on multidimensional poverty. Fifthly, through the analysis of the heterogeneity of digital information technology use and social capital of urban and rural groups, the paper further discusses the mechanism of digital information technology on multidimensional poverty.

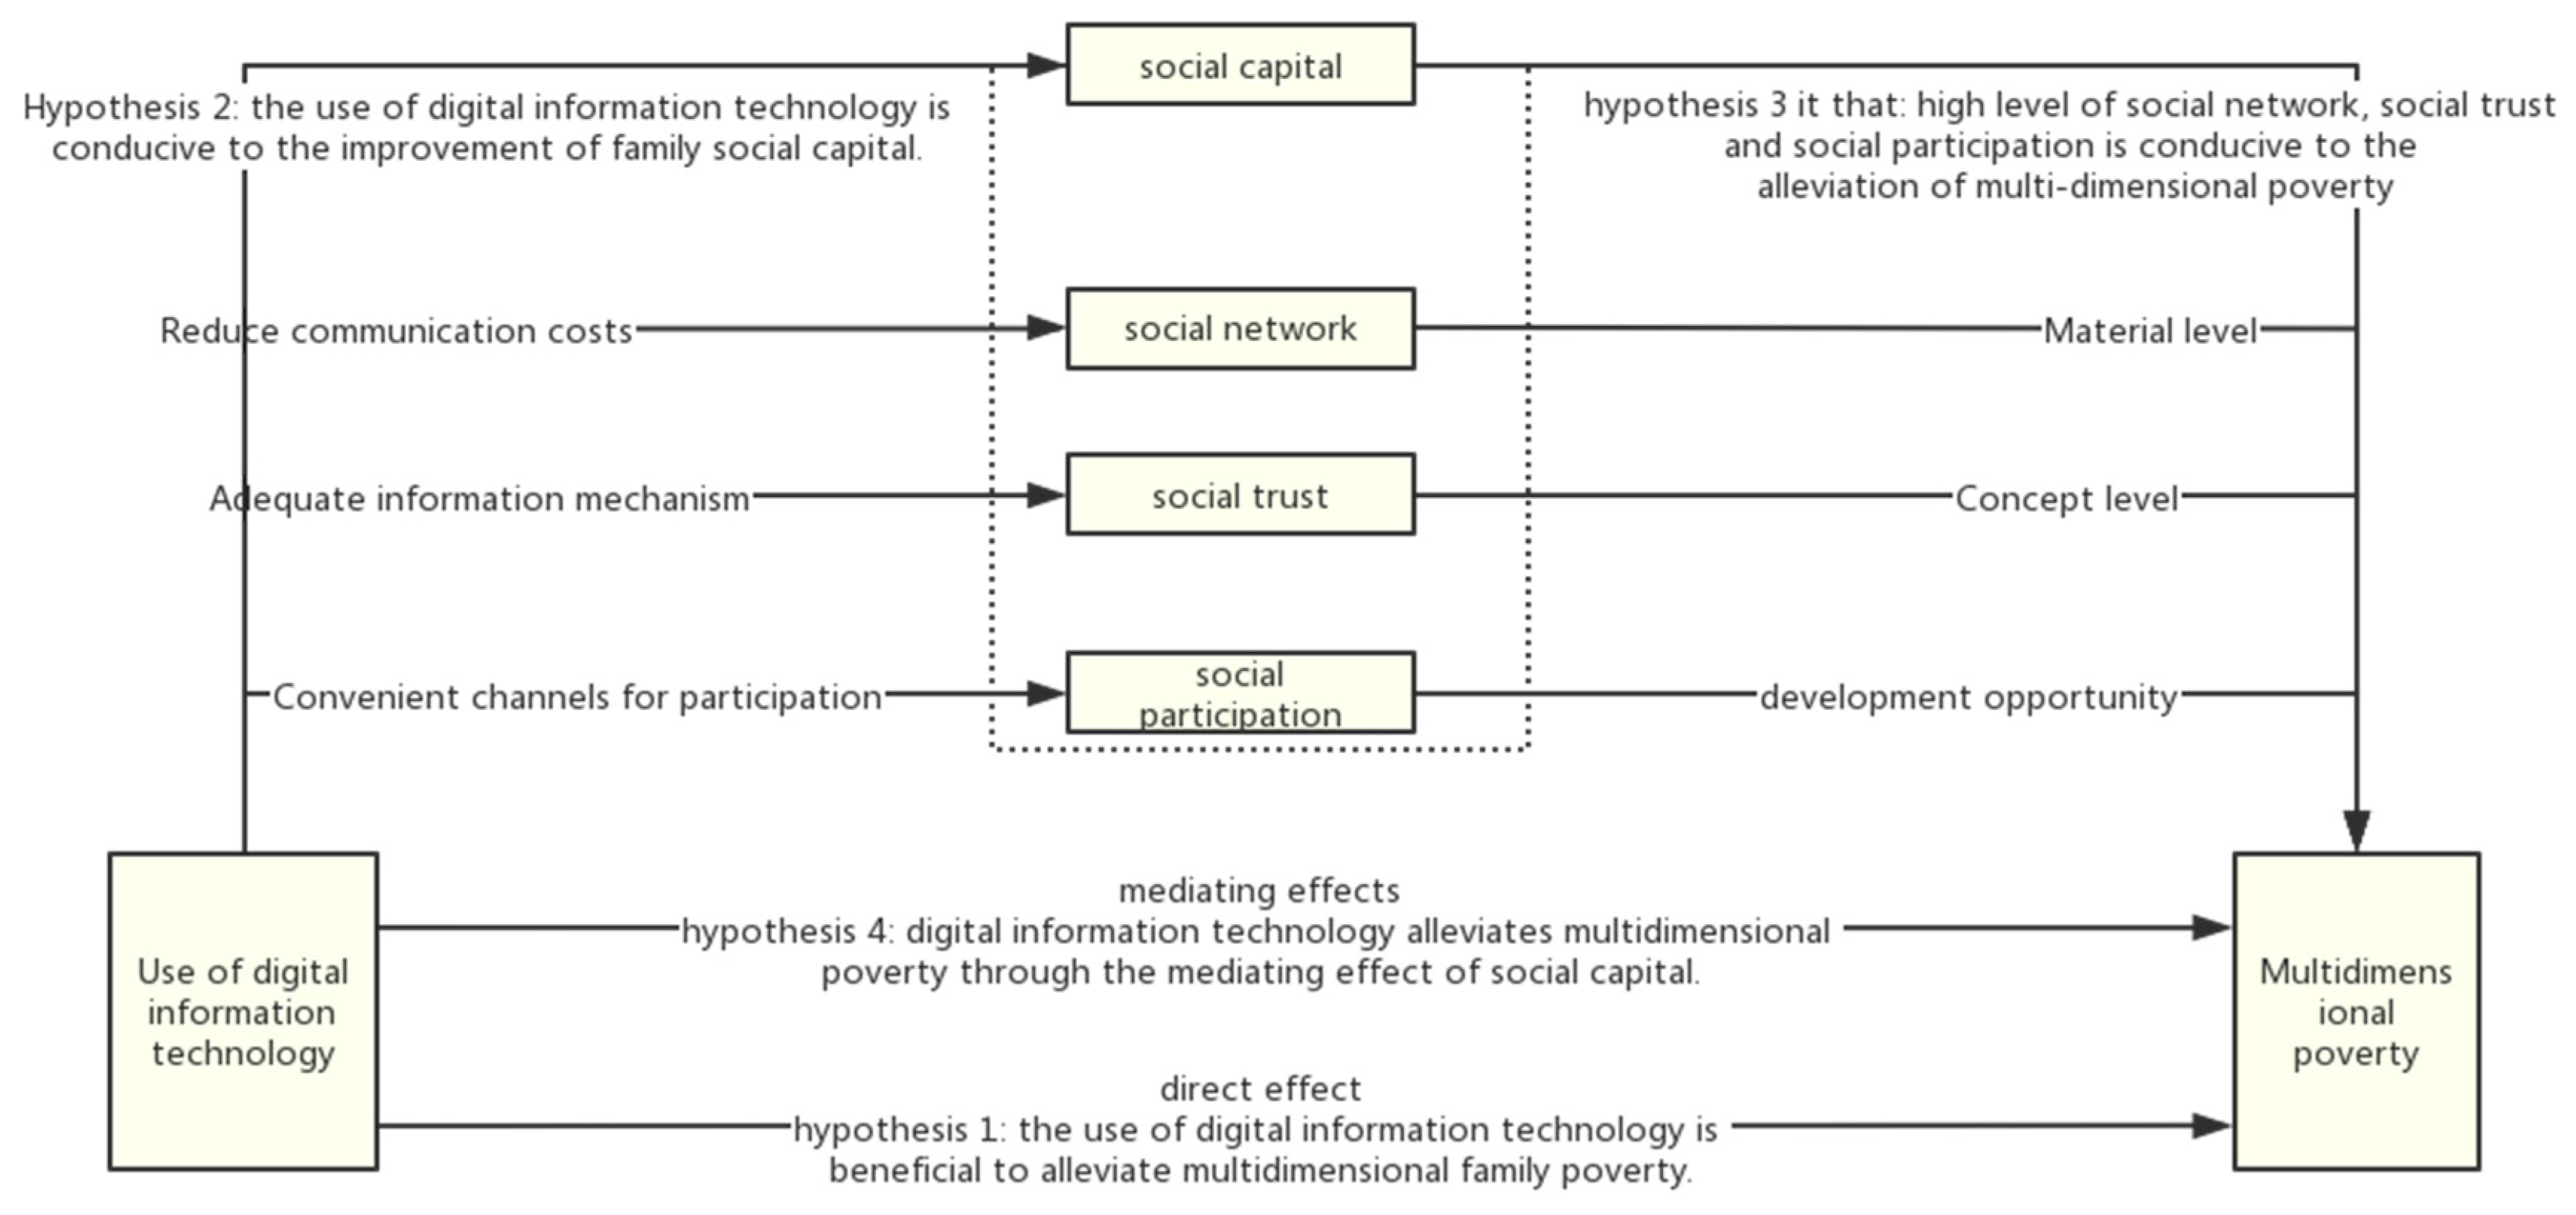
2. Theoretical Framework

2.1. The Relationship between the Use of Digital Information Technology and Multidimensional Poverty

Changes brought by digital information technology cover all aspects of life. According to the empirical studies on evaluating the economic effects of digital financial development, it is generally believed that digital information technology has the characteristics of inclusive growth, which contributes to economic growth and plays a positive role in narrowing the urban-rural income gap [16]. However, Toffler found that information gap and wealth disparity are broadened because of differences in the ownership, application, and innovation ability of information and network technology. This implies that the relationship between digital financial development and multidimensional poverty may be more complex [17]. Does digital information technology reduce income inequality, or does it make poverty worse because of the digital divide? Fabritz studied the effect of regional broadband availability on local economic activity in German taking local employment as a main indicator. He found that the Internet popularizing rate has a positive impact on the employment rate, especially in rural areas [18]. Likewise, Feldman et al. found that the use of the Internet is conducive to obtaining suitable jobs for resident [6]. Based on this evidence, this paper proposes the first research hypothesis (Hypothesis 1): the use of digital information technology can contribute to alleviating multidimensional family poverty.

2.2. The Relationship between the Use of Digital Information Technology and Social Capital

Some studies pointed out that different ways of digital information communication will influence different types of social capital. For example, WeChat, Chinese multifunctional mobile messaging application, helps accumulate bonding, connect social capital, and microblog is conducive to maintaining social capital [19]. From the perspective of digital information use, Ellison et al. found that social media has become an important way for people to obtain and exchange information, which significantly increases bridging social capital [20]. Accordingly, this paper proposes the second research hypothesis (Hypothesis 2): the use of digital information technology is conducive to the improvement of family social capital.

2.3. The Relationship between Social Capital and Multidimensional Poverty

Social capital is a multidimensional concept. Putnam divided social capital into three dimensions: social network, social trust, and social participation [21]. Social network is a network of human resources composed of embedded relationships among members of a common organization, the construction of which becomes more convenient and low-cost because of digital information technology. Narayan found that social network makes people more likely to be transferred from pure farming to work in township enterprises, or go out to work. He thought that social network plays an important role in the process of transmitting labor market information. Thus, the popularization of social network can improve residents’ income to a certain extent and alleviate poverty [22]. Besides, social network has the function of sharing risks and smoothing shocks [23].
As another important core dimension of social capital, social trust is defined as a kind of psychological expectation that members in mutual communication have for others’ behavior in line with social norms and rules. It alleviates multidimensional poverty by increasing information transparency, truthfulness, and filtering redundant information to reduce the transaction time and money costs. This is because trust originates from the rational choice and repeating interaction between people. We note that reducing information asymmetry can be more conducive to trust building. Using data from the World Values Survey, Fisman et al. confirm the positive effect of two-way communication on trust establishment [24]. Arrow proposed that social trust can significantly promote economic growth because trust should be involved in all business transactions, and thus, he argued that the recession of the world economy is due to the lack of mutual trust [25].
Social participation refers to the behavioral input in which an individual can freely communicate and exchange information with others through participation in political, economic, cultural, and other social activities [26]. Social participation, also known as the reciprocity index, is a measure of a family’s social capital from higher social goals and social literacy. This means the willingness of individuals to help others and the belief that they will be helped by others at some point in the future. Therefore, the third research hypothesis (Hypothesis 3) it that: high levels of the social network, social trust, and social participation are conducive to the alleviation of multidimensional poverty. However, the core argument is Hypothesis 4: digital information technology alleviates multidimensional poverty through the mediating effect of social capital.

3. Data and Methods

3.1. Data Sources

The empirical analyses in this paper are based on data from CFPS, a biennial tracking survey conducted for the first time in 2010 by the China Social Science Survey Center at Peking University. The CFPS National Baseline Survey covers 25 provinces and uses a three-stage cluster sampling design with unequal probability, which can be regarded as a nationally representative sample. While this paper focuses on the intermediary effect of social capital on the relationship between the use of digital information and multidimensional poverty, social capital and multidimensional poverty are often measured as a family unit, and thus our sample will be limited to data with complete information at the family level. Thus, after screening, the final samples were 37,816 samples from CFPS database in 2014, 2016, and 2018.

3.2. Measurement of Multidimensional Poverty

This paper uses the A-F method to construct multidimensional poverty index. Sen’s theory of multidimensional poverty of building “double threshold method” is used for A method to measure the multidimensional poverty. At present, this method is the mainstream approach for multidimensional poverty measurement, which meets the requirement of the dimension of poverty measurement and rational and have stronger reality and technical feasibility. In addition, the method has been widely adopted due to its suitability for both continuous and discrete data [4,27]. A-F method is a combination of Alkire and Foster’s method based on multidimensional poverty index and SEN1′s method. The establishment of the multidimensional poverty indicator system is based on the adaptive correction of MPI1 made by the authors of this study and the information provided by CFPS survey data [28,29]. Specifically, seven applicable dimensions were defined, as shown in Table 1. A family was regarded to be poor, if it was deprived on three or more indicators. Where, M P qit represents the poverty status of the i family in the q dimension in the year t, poverty ( M P qit = 1) and non-poverty ( M P qit = 0), the formula for calculating the multidimensional poverty status M P qit of the family is as follows:
M P it = q = 1 7 M P qit

3.3. Measures of Social Capital

Drawing on Pulnam’s definition of social capital, this paper comprehensively measures family social capital from three dimensions: social network, social trust and social participation, and it further introduces a number of secondary indicators based on the specific context of China [30]. The social network index is measured by the breadth and depth of the social network. The breadth index assesses the status and the depth index measures the expense of human etiquette. The social trust index includes not only the connection and trust with the specific individuals around us, but also the trust in society and the confidence to have a better future life. Digital information brings more convenient and effective communication, regular communication links, or convenient transportation, which enhances mutual understanding and improve the probability and willingness to help each other. In this paper, transportation and communication expenditure and confidence in the future are selected as indicators of social trust. In the index of social participation, this paper selects whether the family has made social donations in the past year to measure the degree of social participation (reciprocity index) of the family.
Social capital has multidimensional characteristics, which require a comprehensive measurement method, such as: principal component analysis, factor analysis, and coefficient of variation method. In order to reflect the contribution of different indicators to family social capital, this paper uses the coefficient of variation method to calculate the weight of each indicator. Compared to the principal component and factor analysis, the coefficient of variation method originates from the dataset itself, which helps avoiding the subjective judgment brought by the expert rating, and thus it can objectively reflect the actual level of family social capital. The coefficient of variation of the index I in the coefficient of variation method is defined as follows:
V i = σ i / x i ¯
The corresponding weight formula is as follows:
ω i = V i / i = 1 n V i ( 0 ω i 1 )
The above formula is the standard deviation of index i of σ i , and x i ¯ is the average value of index x i . The greater the weight of ω i , the more important the index is to family social capital. Considering the dimensionality of different indicators, this paper adopts the linear deviation coefficient method to standardize each indicator. The specific formula is as follows:
x ij = ( A ij m ij ) / ( M ij m ij )
where x ij is the standard value of the JTH index after standardization, with a value range of 0 and 1, A ij is the original value of the JTH index, m ij is the minimum value of the JTH index, and M ij is the maximum value of the JTH index.
The assigned weight of each index in dimension i is:
S ocial i = 1 ω i 1 2 ( 1 x i 1 ) 2 + ω i 2 2 ( 1 x i 2 ) 2 + + ω ik 2 ( 1 x ik ) 2 ω i 1 2 + ω i 2 2 + ω i 3 2
Target layer for the social capital, the rule layer for the social network, social trust, social participation, the plan layer for five specific indicators, then the standardized processing to the various index, and level of index weight is obtained by calculating the variation coefficient respectively and secondary index weight, finally calculated the social network, social trust, social participation, and social capital measurement results, as shown in Table 2.
The measurement data in Table 2 show that the weights of social network, social trust, and social participation are 0.249, 0.242, and 0.509, respectively. The weight of social network is different from the weight in common cognition, with a relatively low proportion, implying that the influence of informal institutions gradually decreases in the process of social change and economic development. The weight of social participation is larger, which indicates that the reciprocity increases with the strengthening of social links under the development of digital economy.

4. Model Setting and Verification

4.1. Model Setting

4.1.1. Ordered Logit Regression Model

According to Equation (1), the dimensional number of the explained variable “multidimensional poverty” can be used as orderly and internally arranged data so that the larger the value, the deeper the multidimensional poverty of a family. In line with existing literature, the paper chooses the multidimensional poverty dimension as the explained variable to study the impact of digital information technology use and social capital on multidimensional poverty. The larger the poverty dimension, the deeper the multidimensional poverty of poor households. Thus, the multi-classified ordered Logit regression model was constructed as follows:
p ( M P it = j | x it ) = 1 1 + e ( α + β x it )
where M P it is the explained variable, representing the multidimensional poverty status of poor households, and each grade of M P it is assigned a value j (j = 0, 1, 2, 3, 4, 5, 6, 7). Different values of j respectively represent “no poverty”, “one-dimensional poverty”, “two-dimensional poverty”, “three-dimensional poverty”, “four-dimensional poverty”, “five-dimensional poverty”, “six-dimensional poverty”, and “seven-dimensional poverty”;
x it represents explanatory variables and control variables of digital information use and social capital dimensions. α represents the parameter to be estimated at the intercept and β represents the partial regression coefficient of each explanatory variable. Since β cannot be directly used to explain the probability of the classification variable, it needs to be explained in the form of risk ratio (OR value). The above Logit regression model is further transformed into:
logit ( P j ) = ln P ( MP it j ) 1 P ( MP it j ) = α + β x it
where P j represents the probability when M P it is evaluated as j; α and β are the parameters to be estimated. After the parameter estimation is obtained, the probability of occurrence in a particular case can be obtained by the following formula:
P ( MP it j ) = e α + β x it 1 + e α + β x ti

4.1.2. Mediating Effect Model

In recent years, mediating effect models have been widely used in psychology and other fields of social sciences because they can analyze the process and mechanism of the influence of independent variables on dependent variables [15]. In order to accurately evaluate the intermediate transmission mechanism of social capital, this paper builds the following mediating effect model. According to the sequential test of mediating effect proposed by Baron and Kenny [31], the relationship between variables is as follows:
Y = cX + ε 1
M = aX + ε 2
Y = c X + bM + ε 3
In the mediating effect model, the coefficient c of Equation (9) is the total utility of the independent variable X to the dependent variable Y. The coefficient a of Equation (10) is the effect of X on the mediating variable M. The coefficient b of Equation (11) measures the influence of the mediating variable on Y after controlling for the influence of X. The effect of M on Y, the coefficient c ‘is the direct effect of X on Y after controlling for the effect of M. AB is the mediating effect of X on Y through M, that is, the influence of independent variable X on dependent variable Y through the mediating variable M is called indirect effect. The relationship between total and direct effects is as follows:
c = c + ab
In order to empirically analyze the impact of digital information use on family multidimensional poverty and the role of social capital in this mechanism, two econometric models are constructed. First, in order to investigate the direct impact of digital information technology use on multidimensional poverty of households, this paper examines the relationship between digital information use and multidimensional poverty on the basis of controlling the characteristics of mutual assistance, family characteristics and social characteristics, as shown in Equation (13):
MP it = α 0 + α 1 DIU it + Σ α 2 X i t + ε 1 it
Second, in order to further investigate the indirect influence path of digital information use on multidimensional poverty of households, social capital is added as an intermediary variable, and Equation (13) is extended to Equations (14)–(16):
MP it = α 0 + α 1 DIU it + Σ α 2 X i t + ε 1 it
SC it = β 0 + β 1 DIUse it + Σ β 2 X it + ε 2 it
MP it = γ 0 + γ 1 DIU it + γ 2 SC it + Σ γ 3 X it + ε 3 it
where MP it represents the multidimensional poverty index and DIU it represents the use of digital information use.
In Equations (11)–(13), SC   it is the social capital variable which consists of three dimensions: social network ( SC 1 t = Social   network t ), social trust ( SC 2 t = Social   trust t ), and social participation ( SC 3 t = Social   participation t ). The Digital   information   use it variable measures the degree of digital information use. Digital   information   use it represents digital information and it is composed of four dimensions, namely, the importance of the Internet as an information channel, the average monthly family mobile phone cost, the frequency of Internet social networking, and the frequency of Internet business activities, through principal component analysis;
α 1 , β 1 , γ 1 , γ 2 are the variable coefficients to be estimated, respectively. If the above regression coefficients are all significant, this implies that the mediating effect test has been passed. That is, the mediating effect of social capital on the use of digital information and multidimensional poverty exists. X it is the control variable, and ε 1 it , ε 2 it , ε 3 it is the random error term.
In this study, the characteristics of head of household, including householder age and age squared, were controlled. The quadratic term of age was introduced to test the nonlinear effect of age on digital information use. Gender of household head is set to a two-dimensional dummy variable, which takes the value 1, if the household is male-headed, and zero otherwise. Family characteristics include family size, family labor force, medical security and registered permanent residence in rural areas, including the number of family members, average age of family members, the number of family members, and the proportion of family registered permanent residence in rural areas. Social characteristics include family urban–rural classification. Descriptive statistical of sample variables are presented in Table 3.

4.2. Model Test

The Bootstrap method was used to test the model, which allows for avoiding the defects of the causal step method and the coefficient difference method. Bootstrap method is a method of repeated sampling from the sample, with a more accurate confidence interval. The number of samples in each experiment was 500. After repeated sampling with replacement, the samples for Bootstrap test are obtained. Then the estimate of 500 coefficient product calculated through Bootstrap is arrayed from small to large order to construct a 95% confidence interval. If the confidence interval excludes 0, it indicates the existence of a mediation effect [15].

5. Empirical Results and Discussions

5.1. Descriptive Statistical Analysis

5.1.1. Descriptive Statistical Analysis of Multidimensional Poverty

The results in Table 4 show that the incidence rate of income poverty among rural residents is 7.20% when the per capital net income of rural households is less than 2300 yuan (at constant prices in 2011), indicating the effect of periodic poverty alleviation and a significant reduction in the absolute level of income poverty. At the same time, the incidence rate of housing poverty among households is 16.7%, indicating that the vast majority of households already have basic housing security. However, the high poverty rate in relation to car ownership (77.8%) indicates that car ownership remains a luxury item for the vast majority of households. In terms of education and health, the incidence of poverty in the average number of years of schooling and health status of a family are 52% and 56%, respectively. Low education level affects the future sustainability of a family, while poverty in health status increases the risk for a family, and it is easy to lead to poverty due to illness and reverse poverty due to illness. The incidence of poverty in cooking water and cooking fuel, which measure the living standard, are calculated for 29.1% and 32.4%, respectively, indicating that some households still lack access to clean energy and clean water sources, and fail to achieve a reasonable living standard. The quality of poverty alleviation still needs to be improved, which is the key problem to be solved in poverty alleviation.

5.1.2. Multidimensional Measures of Poverty and Deprivation in Households

Table 5 depicts the depth and breadth of deprivation of multidimensional poverty in households. When K is equal to 1, the poverty incidence rate is 94.94%, indicating that there are households with poverty in at least one dimension. When K is equal to 2, the poverty incidence rate is 0.792, indicating that 79.2% of households have poverty in at least two MPI indicators. When K is equal to 6, the incidence of poverty is 0.021, and the poverty deprivation index is 87.2%. This implies that only 541 households have six-dimensional poverty phenomenon, and 65 poor households are in the extreme poverty situation, where all the indicators are poor (K = 7). At the same time, nearly 50% of households are between two-dimensional poverty and three-dimensional poverty, which shows that poverty control has achieved initial results. However, there are still a large number of households in need of improvement in terms of high quality of family life. More than 10% of households are in high poverty of above five dimensions, which means that targeted poverty alleviation for extreme poor households requires further improvement.

5.2. Empirical Results and Discussion

5.2.1. Baseline Estimation Results

Table 6 presents the results of the estimated ordered logit regression models of factors determining multidimensional poverty. In general, the P values and log likelihood values indicate the goodness-of-fit of the of the four models. By and large, the regression results of the estimated models are quite similar. The discussion in the following sections will focus on the final selection model IV.
(1)
The impact of digital information technology use on multidimensional poverty: The use of digital information technology has a highly statistically significant negative impact on family multidimensional poverty, indicating that more and convenient information communication brought by digital information have improved the livelihood of households. This finding comports with the findings of Feldman and Klaas [6] showing that Internet use and adequate information provide easier job searching and improve households’ access to suitable jobs. As for the conclusion that digital information technology can provide more diversified jobs in job searching, this is consistent with Feldman’s conclusion that the use of digital information can improve workers’ income and job diversity [32]. This proves H1;
(2)
The impact of social capital on multidimensional poverty: As shown in Table 6, social capital has a statistically significant negative effect on the multidimensional poverty at 1% level of significance, indicating that the social capital of a family helps alleviate the multidimensional poverty situation. From the perspective of social capital as a whole, as an important part of family capital, it plays a significant role in improving family education, medical treatment, and life;
(3)
The influence of individual factors and family characteristics on multidimensional poverty: Table 6 shows that the gender of the household’s head, the age square, and other personal factors are significant predictors of a family’s multidimensional poverty. The gender of the household’s head has a significant positive effect on multidimensional poverty at the 1% significance level. In Model Ⅳ, age square of a household head was found to have a significant effect on multidimensional poverty at the 10% significance level. However, the significance level of this effect was even higher in Models Ⅰ and Ⅲ. The study shows that age has a positive impact on multidimensional poverty, that is, older householders are more likely to fall into poverty due to their poor adaptability to environmental changes and poor ability to transform the mode of production. This feature is also reflected in the average age of a family (the level of 1% is significant). The older the average family age is, the slower it is to accept new things and the more difficult it is to enjoy the convenience brought by digital information technology.
From a spatial perspective, the results show that Urban’s multidimensional poverty condition is much higher than that for the rural areas. This finding is consistent with the findings of previous studies, which show that urban and rural areas have different natural conditions, public facilities, and funding for poverty alleviation and policy is different, so the urban and rural factor at 1% level affect multidimensional poverty in rural households, there is an obvious heterogeneity. This conclusion was also tested again in the proportion of rural households registered permanent residence. The proportion of rural household registered permanent residence was positively correlated with multidimensional poverty, and it was significant at the 1% level of significance. Surprisingly, political parties are positively associated with multidimensional poverty in households (at the 1% significance level), which is different from the common concept that the family members have higher social status and income, and is worth further exploration.

5.2.2. Analysis of Influence Mechanism

Table 7 presents the results of the mediating effect of social capital on the impact of digital information use on multidimensional poverty, estimated by using a step regression method. The empirical results show that social capital has a significant mediating effect on reducing multidimensional poverty through the use of digital information technology. The results of Model V show that the use of digital information technology is associated with significant reductions in the level of multidimensional poverty. Since social capital is captured by continuous variables, Model Ⅵ was estimated using OLS regression. The results show that the digital information technology used for social capital has significant positive influence. The coefficients of both fixed and the random effects’ models are significant at 1% level, implying that using digital information technology improves social capital of the family. Finally, we included digital information technology used in model Ⅶ and social capital as two independent variables to investigate the effect on the multidimensional poverty. It can be seen that both the use of digital information technology and social capital have a significant negative impact on the multi-dimensional poverty level at the level of 1%. The results of the mediating effect test show that social capital plays a significant mediating role when digital information technology plays a role in reducing multidimensional poverty. The use of digital information technology has increased family’s social capital, and then the multidimensional poverty of the family has been alleviated. The mediating effect of social capital is significant at 1% level, suggesting that an increased use of digital information does have an impact on social capital and that an improved social capital of households does reduce multidimensional poverty.
Table 8 further divides social capital into three dimensions: social network, social trust, and social participation to make a regression of multidimensional poverty, and discusses exactly the impact of each dimension on multidimensional poverty. The results show that social network, social trust, and social participation are statistically significant at 1% level of significance, with social trust showing the strongest effect on poverty alleviation. This suggests that digital information technology facilitates information exchange and communication that promote information transparency, enhance the social trust, and thus reduce multidimensional poverty. DiMaggio et al. pointed out that the Internet use is an important tool to expand social capital and that workers can expand private social networking through online job hunting to obtain more employment channels [33]. In the context of agricultural challenges, it is proposed that Internet use significantly increases farmers’ social capital, and thus improves the probability of farmers’ off-farm employment. Digital information technology affects multidimensional poverty through induced changes in social networks, social trust, and social participation, which proves H4.
In Table 9, the coefficient values of Path 1 and Path 2 represent the effect of digital information use on the mediating variable, and the impact of the mediating variable on the multidimensional poverty of households, respectively. These two coefficients correspond to β1 and γ2 in Equation (15) and Equation (16), respectively. The mediating effect coefficient represents the influence of digital information on multidimensional family poverty through the mediating variable social capital. The mediating effect coefficient is significant, that is, hypothesis H2 and H3 are valid. The Bootstrap test results showed that the mediating effects of social network, social trust, social participation and social capital are all statistically significant at 1% confidence level. More specifically, the results first show that a wider use of digital information technology brings more convenient communication and lower communication cost to a certain extent, which strengthens social network of households. The development of a social network gives households more opportunities for development, and also increases access to information channels. As an important way for people to obtain information, social media use can significantly increase bridging social capital [20]. Additionally, previous research show that different types of social media improve different types of social capital; but on the whole, social media used by digital information technology increase social capital [19], which proves H2.
Second, digital information technology has also significantly improved the level of social trust. Digital information technology can enhance the level of social trust by promoting offline social interaction and improving interpersonal relationship satisfaction. This is consistent with Fisman and Khanna’s conclusion that reducing information asymmetry is beneficial to trust building [24]. The use of digital information has brought about more adequate information exchange and reduced information asymmetry. The widespread use of digital information technology has led to a reduction in multidimensional poverty because of the more transparent information it brings. Transparent information will enhance the family’s trust in society, and the behaviors that accompany the higher trust are usually micro-actions such as increasing investment expenditure and education expenditure. These actions have led to the alleviation of multidimensional poverty in families. That proves H2.
Third, the mediating effect of social participation also passed the significance level test of 1%. Social participation means that individuals make full use of the advantages of information and trust obtained by social participation, which is conducive to the realization of their own goals. It also means that trial and error costs, sunk costs, and opportunity costs would be reduced, which would then minimize the probability of falling into multidimensional poverty. This shows that the closer connection and help brought by a wider use of digital information also alleviate multidimensional poverty to a certain extent. This proves H1 and H4.

5.3. Heterogeneity Analysis

Table 10 reports the impact of digital information and social capital on multidimensional family poverty at different income levels, where income levels are categorized according to households’ per capita income. For all levels of income, the use of digital information and social capital have a reducing effect on multidimensional poverty. Among them, digital information use and social capital all passed the significance test of 1% under different income levels, indicating that digital information use and social capital can alleviate multidimensional poverty of groups of all income levels.
Based on these results, we find a heterogenous impact for digital information technology on poverty reduction among different income groups. Overall, the alleviation effect of the use of digital information technology on poverty gradually increases with the decrease in income levels, indicating that promoting and reducing the cost of digital information use can maximize the benefits that lower-income groups can achieve. The group with per capita income between CNY 6666 and 13,506 had the highest poverty reduction effect. Further, as per capita income levels continue to fall, the poverty reduction effect actually decreases. This is the digital divide in the Washington study. It is believed that with the penetration rate of PC and Internet, while considering a series of social factors such as gender, age, race, income, education, and geography, the difference in income and education level is the main reason for the inequality of access [34]. In addition, the impact of social capital on reducing multidimensional poverty shows different trends, with an overall trend suggesting that an improvement in income level is associated with an increasing effect for social capital on multidimensional poverty reduction. It shows that social capital has the particularity of establishment and application. Families with higher income levels tend to have higher social status and thus higher quality social capital. High-quality social capital, on the other hand, has a bigger impact on living standards.
Table 11 reports the growth effect of social capital brought by digital information at different income levels. The results reveal that the use of digital information increases the social capital of all income groups, indicating the existence of a mediating effect for social capital on digital information technology for all income groups. The top 25% of the income groups has the largest increment of social capital, because high-income households have higher social status and more social resources that can be mobilized to effectively build social capital (Figure A1).
Table 12 reported according to different families described in the area, the standard for urban and rural will be divided into two groups, and regression analysis, urban and rural areas of multidimensional poverty reduction are significant at 1% level, urban areas of the coefficient is −1.351, rural coefficient is −1.315, shows that digital information technology is better than that of rural poverty reduction effect of the urban areas (Figure A2). The reason may be that there are more industries associated with digital information technology in cities. This result is different from what we usually think will be produced by considering the marginal effect. The analysis suggests that even in cities, the alleviation of multidimensional poverty by digital information still has an upward space and has not reached the stage of diminishing marginal utility, which further proves the feasibility of digital information technology as a new means of poverty alleviation. At the same time, the alleviation of multidimensional poverty by social capital in urban and rural areas is also significant at the 1% level, and the coefficient of urban and rural areas is −1.092 and −0.941, indicating that the poverty reduction effect of social capital in rural areas is better than that in urban areas. This is consistent with the expectation of our analysis, which may be due to the higher marginal utility of social capital in urban areas because the quality of social capital in urban areas is generally higher than that in rural areas, and the social help that can be provided by relatives, friends and society is stronger.
Table 13 reports the impact of digital information technology use on social capital in different regions. The increase of social capital in both urban and rural areas is significant at the 1% level, and the difference between urban and rural areas is small. The analysis shows that digital information technology will bring about a general increase of social capital, while regional differences do not have a significant impact on the increase.

6. Conclusions and Policy Recommendations

6.1. Conclusions

This paper constructs a theoretical framework to analyze the interlinkages among digital information, social capital and household multidimensional poverty. The empirical analysis was based on data from CFPS covering 37,816 households in 25 Chinese provinces. The mediating effect model was used to empirically examine the impact of digital information on multidimensional poverty of households. Based on the findings from this paper, the following conclusions can be drawn. First, the use of digital information has a significant effect on reducing multidimensional poverty among the surveyed households, with a statistically significant mediating effect of social capital. As the core component of household livelihood capital, social capital has an important influence on households’ behavior regarding livelihood choice. An increased use of digital information promotes households’ social capital and helps them to escape multidimensional poverty. Second, the empirical results show that digital information improves all aspects of social capital, i.e., social network, social trust, and social participation, with the highest mediating effect being for the social trust dimension. Third, the results reveal that the use of digital information technology has heterogenous effects on multidimensional poverty among households with different income levels. That is, the poverty-reducing effect of digital information technology use was much higher for low-income groups than that for high-income groups. Furthermore, we found differences in the mediating effect of social capital among different groups, and the social capital of the group with the highest 25% income had the highest mediating effect proportion. This is consistent with our expectation that high-quality social capital will have a greater impact on life, and it also indicates that life can be effectively improved through the improvement of social capital. In the analysis of urban-rural heterogeneity, the use of digital information technology brought about a general increase in social capital. The use of digital information technology had a good effect on poverty reduction in both urban and rural areas, and the effect of poverty reduction in urban areas was better.

6.2. Policy Recommendations

First, in the multidimensional poverty management, we should promote digital information technology to enhance residents’ social network connection, open up information exchange channels, and build public information platforms, so that residents can enjoy more convenient communication methods and lower communication costs, and get rid of poverty.
Second, relying on digital information technology to bring more transparent information channels and more adequate information consultation is conducive to the enhancement of residents’ social trust. At the same time, it further improves the openness of social information, enhances the social trust of residents, and reduces the cost of social communication.
Third, developing more convenient and efficient modes of digital information technology can facilitate residents’ participation in social governance and mobilize their enthusiasm and initiative in social participation.

Author Contributions

Conceptualization: Z.L. and Y.W.; methodology: Z.L.; software: Y.W.; validation: Z.L.; formal analysis: Z.L.; data curation: Y.W.; writing—original draft: Y.W.; writing—review and editing: Q.L.; visualization: Z.L.; supervision: J.L.; project administration: Z.L. and J.L. All authors have read and agreed to the published version of the manuscript.

Funding

This research is supported by the National Natural Science Foundation of China (Grants No. 72074114 and 719115130164), Fundamental Research Funds for the Central Universities (SKYC2019003), Jiangsu Province Philosophy and Social Science Planning Fund Office (Grant No. 18JD010).

Institutional Review Board Statement

Not applicable.

Informed Consent Statement

Not applicable.

Data Availability Statement

Conflicts of Interest

The authors declare no conflict of interest.

Appendix A

Figure A1. The impact of income heterogeneity on multidimensional poverty.
Land 10 00634 g0a1
Figure A2. Impact of area heterogeneity on social capital.
Land 10 00634 g0a2

References

  1. Rowntree, B.S. Poverty: A Study of Town Life; Macmillan: New York, NY, USA, 1902; ISBN 1861342020. [Google Scholar]
  2. Fisher, G.M. The development and history of the poverty thresholds. Soc. Sec. Bull. 1992, 55, 3. [Google Scholar]
  3. Townsend, P. A Rejoinder on Poverty. Soc. Policy Adm. 1984, 18, 165–167. [Google Scholar] [CrossRef]
  4. Sen, A. Development as Freedom; Oxford Paperbacks: Oxford, UK, 2001; ISBN 0192893300. [Google Scholar]
  5. Desa, U.N. Transforming Our World: The 2030 Agenda for Sustainable Development; United Nations: New York, NY, USA, 2016. [Google Scholar]
  6. Feldman, D.C.; Klaas, B.S. Internet job hunting: A field study of applicant experiences with on-line recruiting. Hum. Resour. Manag. 2002, 41, 175–192. [Google Scholar] [CrossRef]
  7. Hanifan, L.J. The rural school community center. Ann. Am. Acad. Political Soc. Sci. 1916, 67, 130–138. [Google Scholar] [CrossRef] [Green Version]
  8. Bourdieu, P. Distinction: A Social Critique of the Judgement of Taste; Harvard University Press: Cambridge, MA, USA, 1984; ISBN 0674212770. [Google Scholar]
  9. Bourdieu, P.; Richardson, J.G. The Forms of Capital; John Wiley & Sons: Hoboken, NJ, USA, 1986. [Google Scholar]
  10. Putnam, R.D. Tuning in, tuning out: The strange disappearance of social capital in America. Political Sci. Politics 1995, 28, 664–684. [Google Scholar] [CrossRef]
  11. Han, S. Compositional and contextual associations of social capital and self-rated health in Seoul, South Korea: A multilevel analysis of longitudinal evidence. Soc. Sci. Med. 2013, 80, 113–120. [Google Scholar] [CrossRef] [PubMed]
  12. Granovetter, M. Economic action and social structure: The problem of embeddedness. Am. J. Sociol. 1985, 91, 481–510. [Google Scholar] [CrossRef]
  13. Grootaert, C. Social Capital, Household Welfare, and Poverty in Indonesia; The World Bank: Washington, DC, USA, 1999. [Google Scholar]
  14. Ram, R. Social capital and income inequality in the United States. Atl. Econ. J. 2013, 41, 89–91. [Google Scholar] [CrossRef]
  15. Zhonglin, W.; Baojuan, Y. Mediating effect analysis: Methodology and model development. Adv. Psychol. Sci. 2014, 22, 731–745. [Google Scholar]
  16. Kapoor, A. Financial inclusion and the future of the Indian economy. Futures 2014, 56, 35–42. [Google Scholar] [CrossRef]
  17. Toffler, A. Powershift: Knowledge, Wealth, and Violence at the Edge of the 21st Century; Bantam Books: New York, NY, USA, 1990. [Google Scholar]
  18. Fabritz, N. The Impact of Broadband on Economic Activity in Rural Areas: Evidence from German Municipalities; Ifo Working Paper No. 166; Leibniz-Institut für Lebensmittel-Systembiologie an der Technischen Universität München: Freising, Germany, 2013. [Google Scholar]
  19. Shuguang, Z. Social Media Use Effectiveness: A Social Capital Perspective. Int. Press 2014, 7, 146–159. [Google Scholar]
  20. Ellison, N.B.; Steinfield, C.; Lampe, C. The benefits of Facebook “friends”: Social capital and college students’ use of online social network sites. J. Comput. Mediat. Commun. 2007, 12, 1143–1168. [Google Scholar] [CrossRef] [Green Version]
  21. Leonardi, R.; Nanetti, R.Y.; Putnam, R.D. Making Democracy Work: Civic Traditions in Modern Italy; Princeton University Press: Princeton, NJ, USA, 2001; ISBN 1282397427. [Google Scholar]
  22. Narayan-Parker, D.; Pritchett, L. Cents and Sociability: Household Income and Social Capital in Rural Tanzania; World Bank Publications: New York, NY, USA, 1997; Volume 1796. [Google Scholar]
  23. Fafchamps, M.; Gubert, F. The formation of risk sharing networks. J. Dev. Econ. 2007, 83, 326–350. [Google Scholar] [CrossRef] [Green Version]
  24. Fisman, R.; Khanna, T. Is trust a historical residue? Information flows and trust levels. J. Econ. Behav. Organ. 1999, 38, 79–92. [Google Scholar] [CrossRef]
  25. Arrow, K.J. Gifts and Exchanges; Princeton University Press: Princeton, NJ, USA, 2014; ISBN 1400853567. [Google Scholar]
  26. Diedrich, A.; Stoeckl, N.; Gurney, G.G.; Esparon, M.; Pollnac, R. Social capital as a key determinant of perceived benefits of community-based marine protected areas. Conserv. Biol. 2017, 31, 311–321. [Google Scholar] [CrossRef] [PubMed]
  27. Alkire, S.; Foster, J. Understandings and misunderstandings of multidimensional poverty measurement. J. Econ. Inequal. 2011, 9, 289–314. [Google Scholar] [CrossRef] [Green Version]
  28. Quanhong, Z.; Bo, L.; Qiang, Z. Dynamic measurement, structural decomposition and targeted poverty alleviation in China. J. Financ. Econ. 2017, 4, 31–40. [Google Scholar]
  29. Xiaolin, W.; Alkire, S. Multidimensional poverty measurement in China: Estimates and policy implications. China’s Rural Econ. 2009, 12. [Google Scholar]
  30. Putnam, R.D. Making Democracy Work: Civic Traditions in Modern Italy; Princeton University Press: Princeton, NJ, USA, 1993. [Google Scholar]
  31. Baron, R.M.; Kenny, D.A. The moderator-mediator variable distinction in social psychological research: Conceptual, strategic, and statistical considerations. J. Personal. Soc. Psychol. 1986, 51, 1173. [Google Scholar] [CrossRef]
  32. Lee, S.-H.; Kim, J. Has the internet changed the wage structure too? Labour Econ. 2004, 11, 119–127. [Google Scholar] [CrossRef]
  33. DiMaggio, P.; Bonikowski, B. Make money surfing the web? The impact of Internet use on the earnings of US workers. Am. Sociol. Rev. 2008, 73, 227–250. [Google Scholar] [CrossRef] [Green Version]
  34. Areas, U. Falling through the Net: A Survey of the “Have Nots” in Rural and Urban America; National Telecommunications and Information Administration (DOC): Washington, DC, USA, 1995. [Google Scholar]
1
The calculation of MPI is divided into five steps: The first step is to determine the dimensions and indicators of poverty. We should take the connotation of multidimensional poverty as the basis and give consideration to comprehensiveness, representativeness, operability, and comparability so as to fully and comprehensively measure the multidimensional poverty situation. The second step is to determine the critical value of deprivation of each index. Suppose that i represents an individual family, and its value on the JTH index is X ij , and Z represents the critical value of deprivation, which is used to judge whether the family is in a state of poverty. The critical value of deprivation on the J th index is Z j . When X ij Z j . It means that the individual i is not poor on the JTH index. On the contrary, when X ij < Z j , it means that individual i belongs to poverty in the JTH index. The third step is to determine the weight of each dimension and index. The current popular equal-weight approach is adopted, in which different poverty dimensions are equally important. The fourth step is to calculate the multidimensional poverty deprivation number of each family, so as to identify whether the family is in multidimensional poverty, and introduce the critical value of multidimensional poverty index K   ( K = 1 , 2 10 ) . If the index value of individual I being deprived is expressed by C i ( k ) , when C i ( k ) k , it means that the family is poor in at least one dimension. According to the international standard ( k = 3 ), when C i ( k ) 3 , it means that the family is in a state of multidimensional poverty, that is, the family is deprived in three or more indicators. The fifth step is to calculate a multidimensional poverty index. The multidimensional poverty index was calculated and the dimensions were decomposed. Q represents the number of multidimensional poor households, N represents the total sample, and H represents the incidence of multidimensional poverty, then H = Q / N ; A is used to represent the multidimensional poverty deprivation depth index, then A = i = 1 n C i ( k ) / q ; Multidimensional poverty index MPI = H × A , indicating that multidimensional poverty is affected by multidimensional poverty incidence rate and deprivation degree.
Figure 1. Action schematic.
Land 10 00634 g001
Table 1. Multidimensional poverty dimensions, indicators, assignments, and weights.
DimensionDeprived of Thresholds and AssignmentsWeight
Net income per capitaIf the per capita annual net income of the family is less than 2300 yuan, the assigned value is 11/7
Average level of educationIf the average education level of the family is below junior high school, the value is 11/7
Health conditionIf there is an unhealthy member in the family, the value is 11/7
Use water to cookIf the drinking water comes from non-tap water, the assigned value is 11/7
Cooking fuelIf the family uses firewood for cooking, the assigned value is 11/7
Home ownershipIf the family does not own full property rights, the assigned value is 11/7
Car ownershipIf the family is unable to own a car, the assigned value is 11/7
Table 2. Social capital index selection and weight.
Destination LayerCriterion LayerFirst Level Weight IndexScheme LayerMean ValueStandard DeviationSecond-Level Index Weight
social capitalsocial network0.249 Courtesy expense0.123 0.165 0.752
social trust0.242The level of future confidence0.748 0.206 0.195
Transportation and communication cost0.160 0.181 0.805
social participation (reciprocity)0.509Social donation0.192 0.391 1.000
Table 3. Descriptive statistics of variables.
Variable NameMean ValueStandard DeviationMinimumMaximumComments
Multidimensional poverty2.7231.41807
Digital Information Use0.6910.717−1.5661.671
Internet Importance2.3841.27305The importance of the Internet as an information channel is 1 as very unimportant and 5 as very important
phone expenses53.64841.0110200Per capita mobile phone expenses; The outliers between 99% and 100% are replaced by 99% quantiles for mobile phone charges
Internet operating frequency6.1631.539171. Almost everyday
2. 3–4 times a week
3. 1–2 times a week
4. Once a month
5. Once a few months
6. never
Internet social frequency5.162.048171. Almost everyday
2. 3–4 times a week
3. 1–2 times a week
4. Once a month
5. Once a few months
6. never
Social capital0.1430.16700.98+
Social participation0.1280.20901+
Social trust0.7480.20601+
Social network0.1890.15601+
Gender0.5350.49901Householder gender,
1 = male, 0 = female
Hage23107.1372002.96525612100Householder age squared,
Control for the nonlinear effects of age
Hage53.10316.94716110Householder age
Age47.71313.5257.595Mean family age
Members3.681.826121Number of family members
Area0.5070.501Family urban-rural classification;
1 = urban, 0 = rural
Party0.0860.21301Percentage of family members
registration0.7140.42401Percentage of rural household registration
sample size37,212
Table 4. Indicators of poverty rate among the sample households.
Dimensionality Poor HouseholdsThe Total Number of HouseholdsPoverty Incidence (%)
Net income per capita272337,8167.201
Average level of education19,81737,81652.404
health condition 21,38337,81656.545
Use water to cook10,98937,81629.059
Cooking fuel12,26237,81632.425
Home ownership635237,81616.797
Car ownership29,43937,81677.848
Table 5. Multidimensional poverty incidence, deprivation index and MPI at different K values.
KThe Number of PoorPoverty Incidence HProportion of Poverty in Each DimensionCumulative Incidence of PovertyPoverty Deprivation Index AMultidimensional Poverty Index MPI
019140.0005.0605.0600.0000.000
159620.94915.77020.8300.1320.126
292820.79224.55045.3700.2780.220
393380.54624.69070.0700.4360.238
470460.29918.63088.7000.5760.172
534680.1139.17097.8700.7160.081
67410.0211.96099.8300.8720.019
7650.0020.170100.0001.0000.002
Table 6. Ordinal Logit regression analysis of the influencing factors of multidimensional poverty.
Variable NameModel ⅠModel ⅡModel ⅢModel Ⅳ
Regression CoefficientOR ValueRegression CoefficientOR ValueRegression CoefficientOR ValueRegression CoefficientOR Value
Digital Information Use −1.376 ***
(0.025)
0.252 ***
(0.006)
−1.306 ***
(0.026)
0.270 ***
(0.007)
Social capital −1.565 ***
(0.064)
0.209 ***
(0.013)
−0.985 ***
(0.065)
0.373 ***
(0.024)
Gender0.0211.0210.069 **1.071 **0.0401.0410.078 ***1.082 ***
(0.028)(0.028)(0.027)(0.029)(0.027)(0.029)(0.027)(0.030)
Hage 2−0.000 ***0.999 ***0.0001.000−0.000 ***0.999 ***0.000 *1.000 *
(0.000)(0.000)(0.000)(0.000)(0.000)(0.000)(0.000)(0.000)
Hage0.028 ***1.028 ***0.0001.0000.020 ***1.020 ***−0.0010.998
(0.004)(0.004)(0.004)(0.004)(0.004)(0.004)(0.004)(0.004)
Age0.056 ***1.058 ***0.021 ***1.02 ***0.054 ***1.056 ***0.022 ***1.022 ***
(0.001)(0.001)(0.001)(0.001)(0.001)(0.001)(0.001)(0.001)
Members0.027 ***1.027 ***0.0001.0000.030 ***1.030 ***0.0061.006
(0.009)(0.009)(0.009)(0.009)(0.009)(0.009)(0.009)(0.009)
Area−1.20 ***0.298 ***−0.966 ***0.380 ***−1.163 ***0.312 ***−0.941 ***0.390 ***
(0.038)(0.011)(0.038)(0.014)(0.038)(0.012)(0.038)(0.014)
Party0.850 ***2.339 ***0.599 ***1.821 ***0.949 ***2.58 ***0.604 ***1.829 ***
(0.061)(0.142)(0.065)(0.119)(0.065)(0.170)(0.065)(0.120)
registration2.08 ***8.04 ***1.727 ***5.625 ***1.996 ***7.36 ***1.681 ***5.371 ***
(0.048)(0.387)(0.047)(0.269)(0.048)(0.357)(0.048)(0.258)
Prob > chi20.0000.0000.0000.0000.0000.0000.0000.000
Log likelihood−55,777.538−55,777.538−53,960.915−53,960.915−54,555.793−54,555.793−53,270.78−53,270.78
sample37,44137,44137,21237,21236,78136,78136,78136,781
Notes: standard errors in parentheses, while *, **, and *** indicate a significant level of 10%, 5%, and 1%, respectively.
Table 7. Results of the mediating effect test of social capital.
Variable NameModel ⅤModel ⅥModel Ⅶ
Regression CoefficientOR ValueRE Regression CoefficientFE Regression CoefficientRegression CoefficientOR Value
Explained variableMultidimensional povertySocial capitalMultidimensional poverty
Regression methodOrdinal Logit RegressionOLSOrdinal Logit Regression
Use of digital information technology−1.376 ***
(0.025)
0.252 ***
(0.006)
0.082 ***
(0.002)
0.054 ***
(0.003)
−1.306 ***
(0.026)
0.270 ***
(0.007)
social capital −0.985 ***
(0.065)
0.373 ***
(0.024)
control variableyesyesyesyesyesyes
Prob > chi20.0000.000 0.0000.000
Log likelihood−53,960.92−53,960.92 −53,270.78−53,270.78
rho 0.2090.436
Number of obs37,21237,21236,78136,78136,78136,781
Notes: standard errors in parentheses, while *** indicate a significant level of 1 per cent.
Table 8. Results of the mediating effect test of social network, social trust, and social participation.
Variable NameModel ⅤModel ⅤModel Ⅶ
Regression CoefficientOR ValueRegression CoefficientOR ValueRegression CoefficientOR Value
Explained variableMultidimensional poverty
Regression methodOrdinal Logit Regression
social network−1.72 ***0.177 ***
(0.096)(0.017)
social trust −3.461 ***0.031 ***
(0.093)(0.002)
social participation −0.316 ***0.728 ***
(0.033)(0.024)
Use of digital information technology−1.31 ***0.268 ***−1.125 ***0.324 ***−1.341 ***0.261 ***
(0.025)(0.006)(0.026)(0.008)(0.026)(0.006)
control variableyes yes yes
Prob > chi20.0000.0000.0000.0000.0000.000
Log likelihood−53,799.771−53,799.771−52,685.588−52,685.588−53,914.98−53,914.98
Number of obs37,21237,21236,78136,78137,21237,212
Notes: standard errors in parentheses, while *** indicate a significant level of 1 per cent.
Table 9. Mediating effect of digital information technology on multidimensional family poverty.
Influence Coefficient α1 of Digital Information on Multidimensional PovertyPath 1: The Impact of Digital Information on Transmission MechanismsThe Coefficient β1Path 2: The Impact of Transmission Mechanisms on Multidimensional PovertyThe Coefficient γ2Mediating Effect Coefficient of Digital Information on Multidimensional PovertyThe Bootstrap Test (Z-Value/P-Value)The Mediation Effect Percentage/% (AB/C)
−1.376Digital information is critical to social capital0.054 ***Social capital versus multidimensional poverty−0.985 ***−0.05416.09/0.0006.945
−1.376Digital information to social networks0.030 ***Social networks against multidimensional poverty−1.720 ***−0.05219.17/0.0006.303
−1.376Digital information has social trust0.055 ***Social trust in multidimensional poverty−3.461 ***−0.19335.82/0.00024.327
−1.376Digital information for social participation0.085 ***Social participation in multidimensional poverty−0.316 ***−0.02710.24/0.0003.189
Notes: *** indicate a significant level of 1 per cent.
Table 10. The impact of income heterogeneity on multidimensional poverty.
Income ClassificationTotal0–25%25–50%50–75%75–100%
Regression CoefficientOR ValueRegression CoefficientOR ValueRegression CoefficientOR ValueRegression CoefficientOR ValueRegression CoefficientOR Value
explained variableMultidimensional poverty
regression methodOrdinal Logit Regression
Digital Information Use−1.306 ***0.270 ***−1.200 ***0.300 ***−1.293 ***0.274 ***−1.239 ***0.289 ***−1.129 ***0.323 ***
(0.026)(0.007)(0.069)(0.020)(0.065)(0.018)(0.058)(0.016)(0.048)(0.015)
social capital−0.985 ***0.373 ***−0.815 ***0.442 ***−0.606 ***0.545 ***−0.832 ***0.434 ***−0.937 ***0.391 ***
(0.065)(0.024)(0.175)(0.077)(0.163)(0.089)(0.140)(0.060)(0.111)(0.043)
control variableyesyesyesyesyesyesyesyesyesyes
Log likelihood−53,270.780−53,270.780−14,050.597−14,050.597−13,096.922−13,096.922−13,079.494−13,079.494−13,424.630−13,424.630
Prob > chi20.0000.0000.0000.0000.0000.0000.0000.0000.0000.000
sample36,78136,78191179117891789179037903797109710
Notes: *** indicate a significant level of 1 per cent, respectively.
Table 11. Impact of income heterogeneity on social capital.
Income ClassificationTotal0–25%25–50%50–75%75–100%
Explained VariableSocial Capital
Regression MethodOLS
Digital Information Use0.0550.0370.0450.0310.053
0.0000.0000.0000.0010.000
control variablecontrolcontrolcontrolcontrolcontrol
sample36,7819117891790379710
Table 12. The impact of area heterogeneity on multidimensional poverty.
AreaTotalUrbanRural
Regression CoefficientOR ValueRegression CoefficientOR ValueRegression CoefficientOR Value
Explained variableMultidimensional poverty
Regression methodOrdinal Logit Regression
Digital Information Use−1.378 ***0.251 ***−1.351 ***0.258 ***−1.315 ***0.268 ***
(0.026)(0.006)(0.035)(0.009)(0.040)(0.010)
Social capital−1.049 ***0.350 ***−1.092 ***0.335 ***−0.941 ***0.389 ***
(0.065)(0.023)(0.085)(0.028)(0.106)(0.041)
Control variable (excluding area)yesyesyesyesyesyes
Log likelihood−53,573.625−53,573.625−25,862.441−25,862.441−27,442.989−27,442.989
Prob > chi20.0000.0000.0000.0000.0000.000
sample36,78136,78118,65018,65018,13118,131
Notes: *** indicate a significant level of 1 per cent respectively.
Table 13. Impact of area heterogeneity on social capital.
Income ClassificationTotalUrbanRural
Explained VariableSocial Capital
Regression MethodOLS
Digital Information Use0.0560.0530.054
0.0000.0000.000
Control variable (excluding area)controlcontrolcontrol
Sample36,78118,65018,131
Publisher’s Note: MDPI stays neutral with regard to jurisdictional claims in published maps and institutional affiliations.

