1. Introduction
Landscape perception is a common issue in landscape assessment and plays a key role in the approach to and definition of landscapes [
1,
2]. How a landscape is perceived relates to aesthetic judgment, a sense of place, identity, recreation, the familiarity of the setting, attractiveness, and a wide range of ecosystem services (e.g., [
3,
4,
5,
6]). Hence, landscape perception is crucial with regard to aesthetic preferences, well-being, landscape character assessment, tourism, travel motivation, planning, and regional development [
7,
8,
9,
10,
11].
A number of studies have been published in the international literature delving into how landscape is perceived and how landscape perception can be assessed (e.g., [
12]). Reports in the literature [
13] differentiate between cognitive and attributive approaches, the former being placed among subjective procedures and the latter among objective working methods. The cognitive approach assumes that landscape evaluation lies exclusively in opinions and ratings given by users. This approach stems from environmental psychology and can be summarized using cognitive and phenomenological concepts such as disturbance or naturalness (e.g., [
1]). Its main assumption is that landscape perception is a construct of the individual; therefore, this approach is subjective and difficult to generalize. Generalization is complicated for several reasons, including the fact that no two people perceive or value the landscape in the same way, and judgments may be influenced by topophilia or feelings of attachment to a given place [
14]. Judgments tend to influence each other, and opinions are the result of a variety of beliefs, so the procedure is understood to be holistic. Many works use the cognitive approach as an attempt to pinpoint what users think and feel about the landscape (e.g., [
3,
4,
15,
16]). On the other hand, the attributive approach is based on valuing physical elements of the landscape such as the type of land cover or vegetation and rating them systematically according to previously agreed criteria. Hence, this approach addresses preferences for tangible landscape components (e.g., [
5]). The rationale is that landscape evaluation comes (mainly) from the elements composing the landscape, so it can be georeferenced and generalized by considering such elements. For example, visual attractiveness was assessed in [
17] by aggregating natural and cultural components through a geographic information system (GIS). The result was a spatial distribution of areas of high and low scores that correlate with the presence of higher- or lower-rated landscape features.
From a spatial point of view, classification entails a critical aspect [
13]. The attributive approach allows for mapping of landscape evaluations easily, as it is based on physical landscape elements with clear geographic locations. On the contrary, the cognitive approach encounters difficulty in this respect, because people’s opinions tend not to be restricted to the locations of physical elements in the landscape, or to systematically covering it all. Consequently, the mapping is restricted to discrete locations explicitly pointed out by users. The nature of each approach also reinforces a distinct mapping facility. The attributive approach focuses on each element separately because it primarily involves analytical processes, whereas the cognitive approach tends to view the landscape holistically, as the elements under consideration are judged together. The main point of this distinction is that attributive methods, by their inherent nature, tend to produce spatially explicit results, while cognitive methods tend not to. This rationale is condensed by the observer-dependence paradigm [
2] from which landscape is approached.
In the cognitive approach, the landscape is understood as a continuous feature that is difficult to segment [
14]. A public participation GIS (PPGIS) is an excellent means of collecting place-based information [
18,
19,
20]. A PPGIS uses public participation to elicit georeferenced information, usually from the general public and non-expert users, and produce spatial outputs. Its spatial nature allows a wide range of events to be mapped, including preferences, attitudes, conflicts, and behaviors in a variety of situations [
21]. Spatial outputs can be produced in any of the typical geometries available in GIS—points, lines, and polygons—although points are the most common feature. It has been demonstrated that points are easier to use and understand than other geometries and, hence, they are simpler for the general public to apply and more useful for achieving greater participation rates [
22]. However, point geometries restrict users’ opinions to spatial extents defined only by single pairs of geographic coordinates, while users usually mean greater extents defined by several pairs of coordinates (i.e., polygons).
Some authors (e.g., [
10]) noted that points in PPGIS environments tend to respond to fuzzy logic, as their associated attributes extend outwardly to some undefined and variable distance. Efforts have been made to pinpoint the spatial influence of PPGIS points across a studied area. However, works assessing the spatial influence of PPGIS points in the landscape and cognitive landscape perception are lacking. A notable exception is provided by studies analyzing point concentration, surface density, and spatial clusters [
16,
20,
23,
24]. However, these studies do not focus on how values spread and spatially correlate, but instead on how the values are concentrated, as they pay attention to the density of occurrence. To the best of our knowledge, spatial interpolation from points to areas in landscape-related topics is still poorly explored, and studies delving into how to translate point-based landscape opinions into areal ones are scarce. Interpolation exercises have been conducted to approach social change with regard to protected areas, in order to study perceived aesthetic value in natural environments and to map scenic beauty in urban settings [
25,
26,
27]. However, despite specific exceptions, the use of an interpolation procedure to assess spatial variability in landscape opinions has not been sufficiently explored. Therefore, the following questions are posed: How can PPGIS and spatial analysis techniques be used to develop a continuous landscape perception map? How do people perceive the landscape in a protected site?
The aim of this paper was to ascertain users’ landscape perception using a cognitive-type approach, a place-based procedure, and spatial analysis to infer likely perceptions of sites that have not been directly judged. To do so, we collected landscape opinions using point geometries and interpolated them by means of spatial techniques in a GIS environment. We used a PPGIS procedure based on Google Maps as the data source, the semantic differential method [
28] as a method for estimating perceptions on a cognitive basis, and the inverse distance weighted (IDW) algorithm and multi-criteria evaluation (MCE) as spatial analysis procedures. This research is novel because it pinpoints cognitive opinions of the landscape on a spatial basis by using interpolation techniques and contributes to landscape approaches with new working methods.
2. Materials and Methods
In the first stage of the study, a PPGIS platform based on Google Maps was designed, tested, and set up to compile users’ opinions on the landscape. In the second stage, a number of analyses were conducted on users’ input to give spatial meaning to the information collected.
2.1. Area Studied
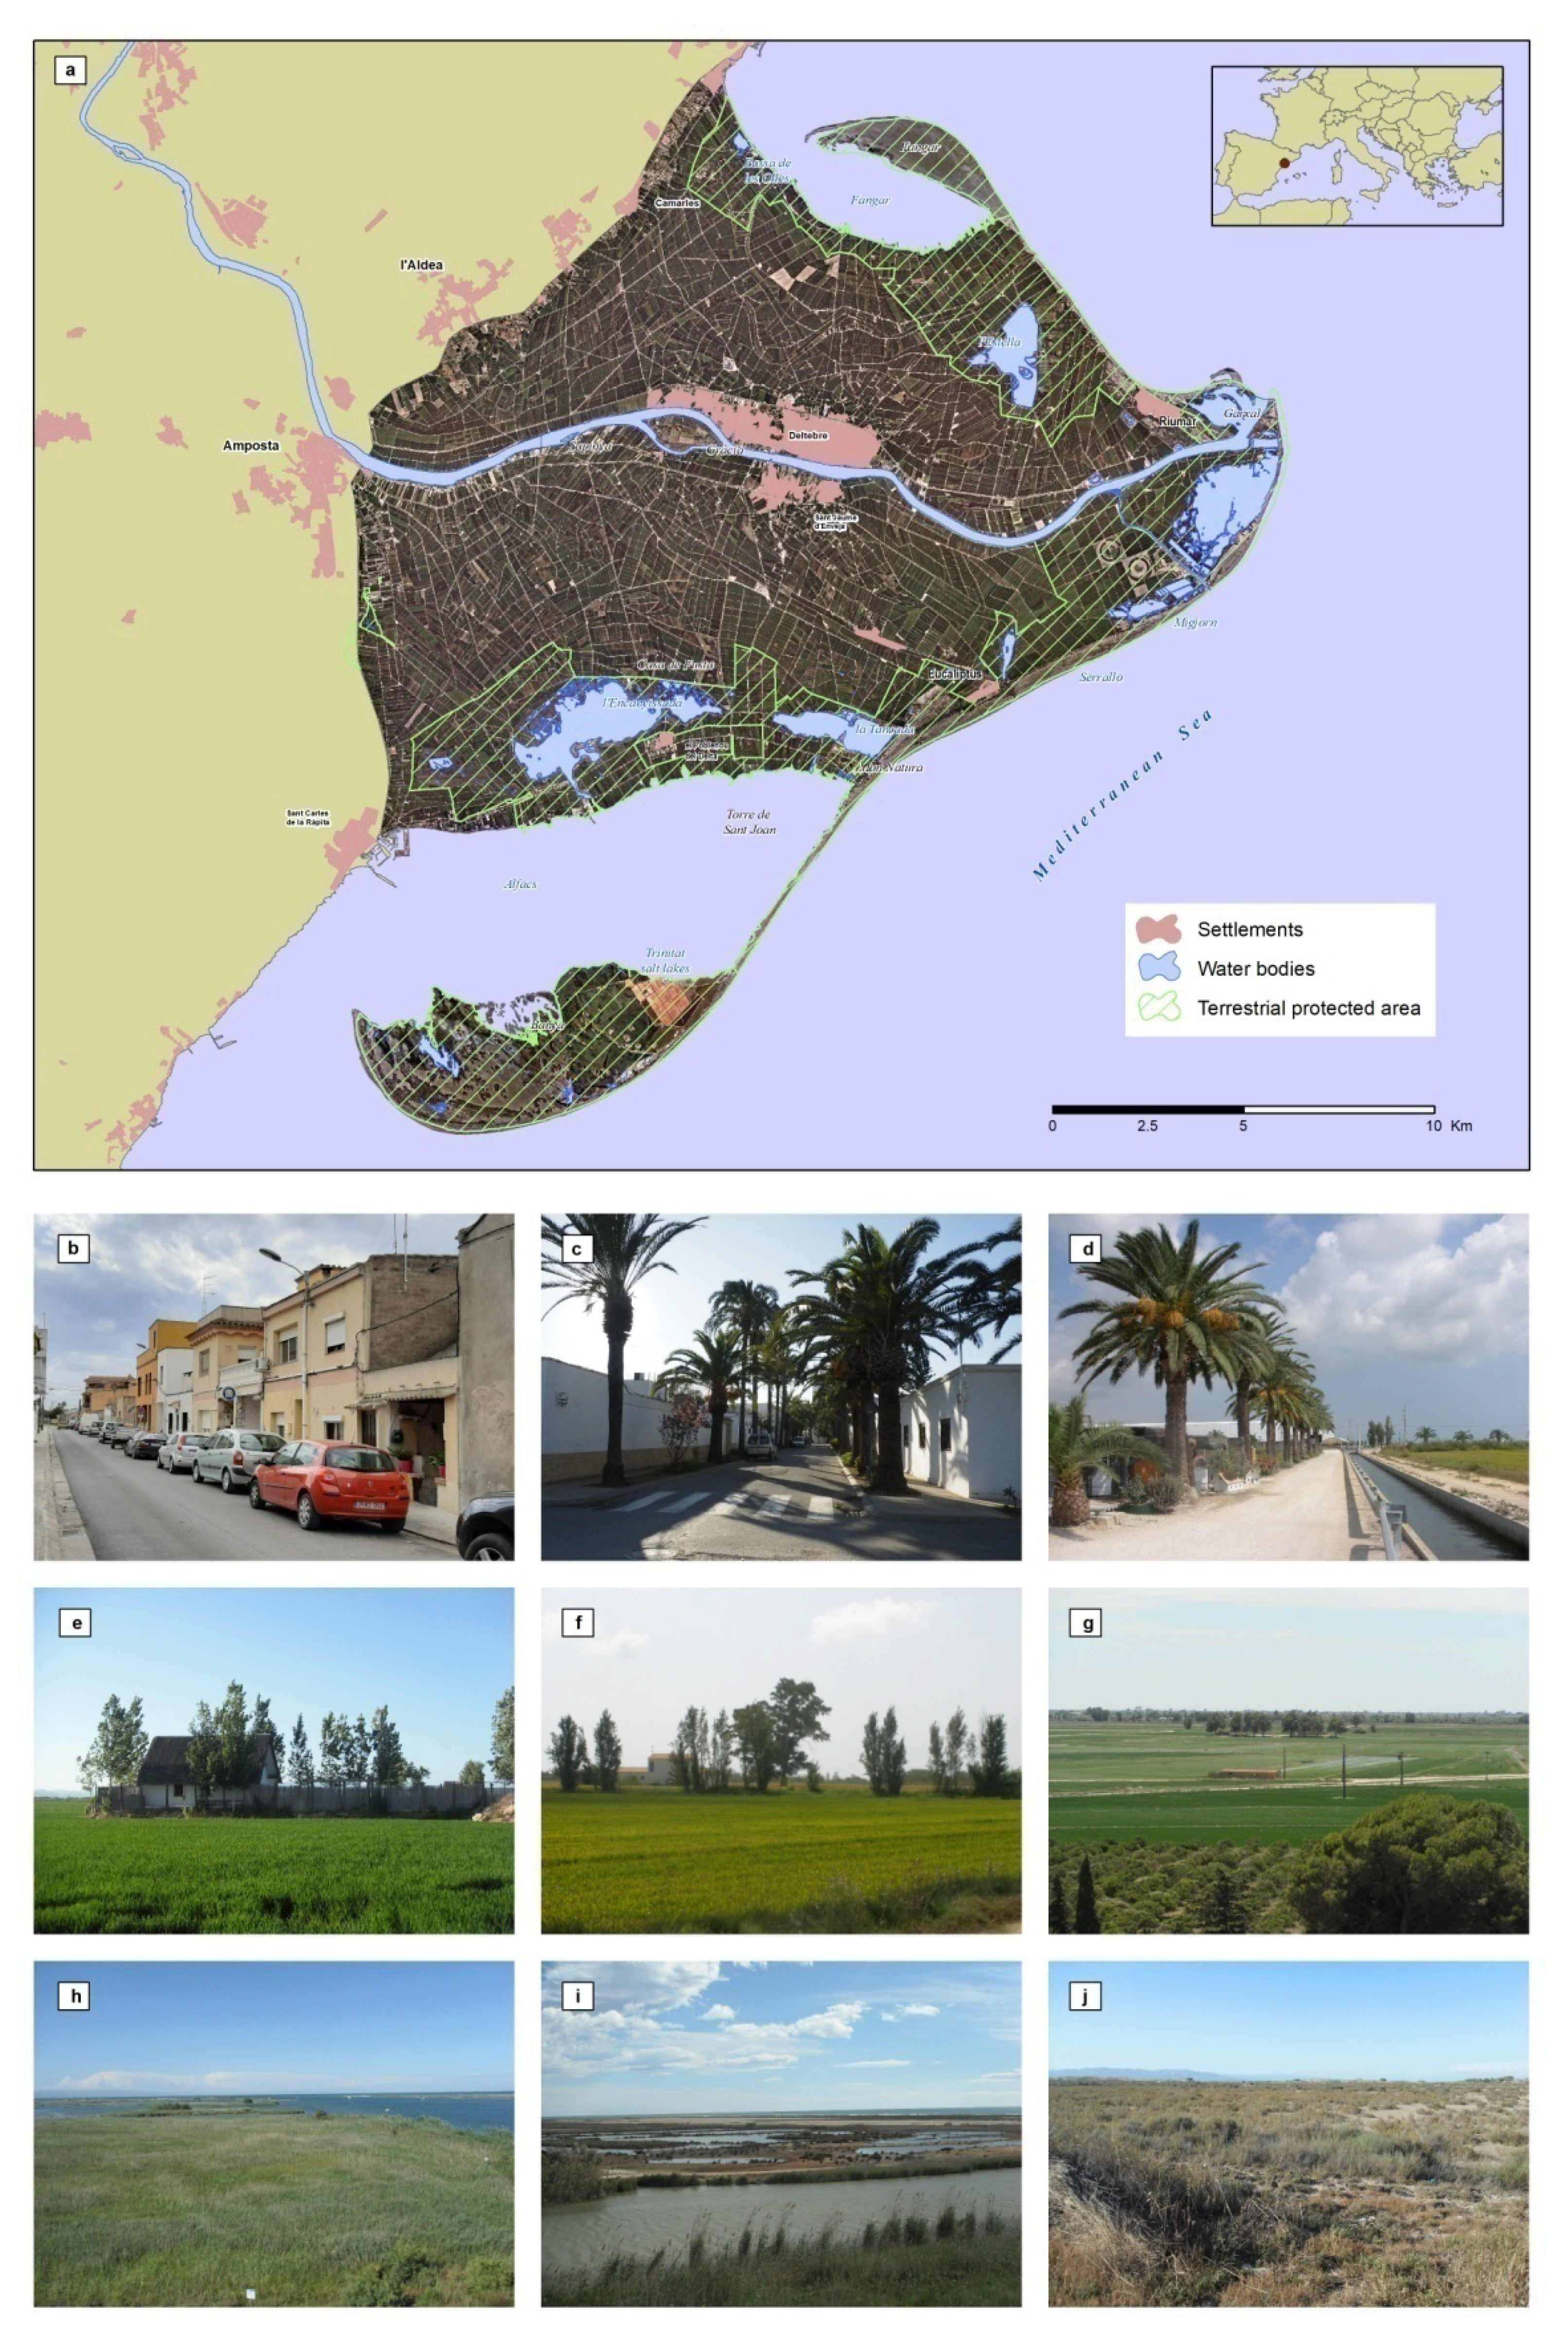
The study was conducted in the Ebro Delta in northeastern Spain. The area covers 330 km
2 and is one of the largest wetlands in the western Mediterranean. It is covered by rice fields (65%), beaches and dunes (8.1%), lagoons (6.2%), marshes (6.1%), and built-up areas (5.02%), along with several riverine forests (0.3%) and historic buildings, forming a rich and diverse landscape (
Figure 1).
The Ebro Delta’s natural resources and cultural heritage are protected by several designations, including natural parks, the Man and Biosphere Programme, the Ramsar Convention on Wetlands, and the European Union Natura 2000 network. Over 150,000 visitors take in the sights every year [
29], who are mainly attracted by the distinctive scenery, beaches, and outdoor activities. A tourist profile study revealed that the area attracts different types of visitors; ecotourists (44.6%) and beach tourists (39.3%) are the most common. The main tourist attractions for visitors are nature-related, such as wildlife observation, followed by others related to the sun and beaches [
30]. Park managers take part in environmental education programs and conduct a wide range of activities to communicate the value of the Ebro Delta to visitors [
29].
2.2. Landscape Perception
Humans tend to approach concepts in a dichotomous way, according to bipolar pairs such as darkness and light or life and death [
14]. Proceeding based on this human predisposition, landscape perception was assessed using the semantic differential method [
28], which is a procedure based on bipolar adjective pairs that describe and characterize a place [
31]. Respondents were asked to locate and rate the landscape according to 8 concepts on a scale ranging from −2 to +2: −2 = very negative; −1 = negative; 0 = neutral; +1 = positive; and +2 = very positive.
Adjectives were chosen by a panel of experts made up of researchers at the Universitat Rovira i Virgili (Spain) and the Université François Revelais (France) and managers from the Ebro Delta Natural Park and the Loire-Anjou-Touraine Regional Natural Park. All 8 bipolar pairs were related to each other. However, in order to ensure a thorough approach, 4 were primarily associated with landscape characteristics and 4 were primarily associated with perceived experience (
Table 1).
“Naturalness” was separated into “natural” and “artificial”, referring to landscapes with a low degree of artificiality versus highly artificial ones, such as built-up areas and agricultural fields. “Attractiveness” included the adjectives “attractive” and “repulsive”, referring to charming or beautiful landscapes, and unpleasant landscapes or disagreeable views. “Productiveness” was split into “productive” and “unproductive”, and it focused on landscapes perceived as being useful from an economic point of view versus those perceived having no economic value. “Cleanliness” included the adjectives “clean” and “dirty”, and it referred to landscapes without litter, rubbish, or any kind of human refuse, and landscapes with litter, waste, or discarded items.
“Peacefulness” was separated into “quiet” and “crowded”, and it focused on places experienced as having not too many people versus places with too many visitors. “Interest” included the pair “interesting” and “boring”, and it covered landscapes viewed as exciting or charming that pique curiosity versus landscapes that are experienced as dull, bland, or monotonous. “Silence” was divided into “silent” and “noisy”, and it described places perceived as quiet or calm versus places that are loud or noisy. “Neatness” included the adjectives “clean” and “dirty”, and it described landscapes experienced as clean and tidy versus those seen as neglected or untidy.
2.3. PPGIS Online Questionnaire
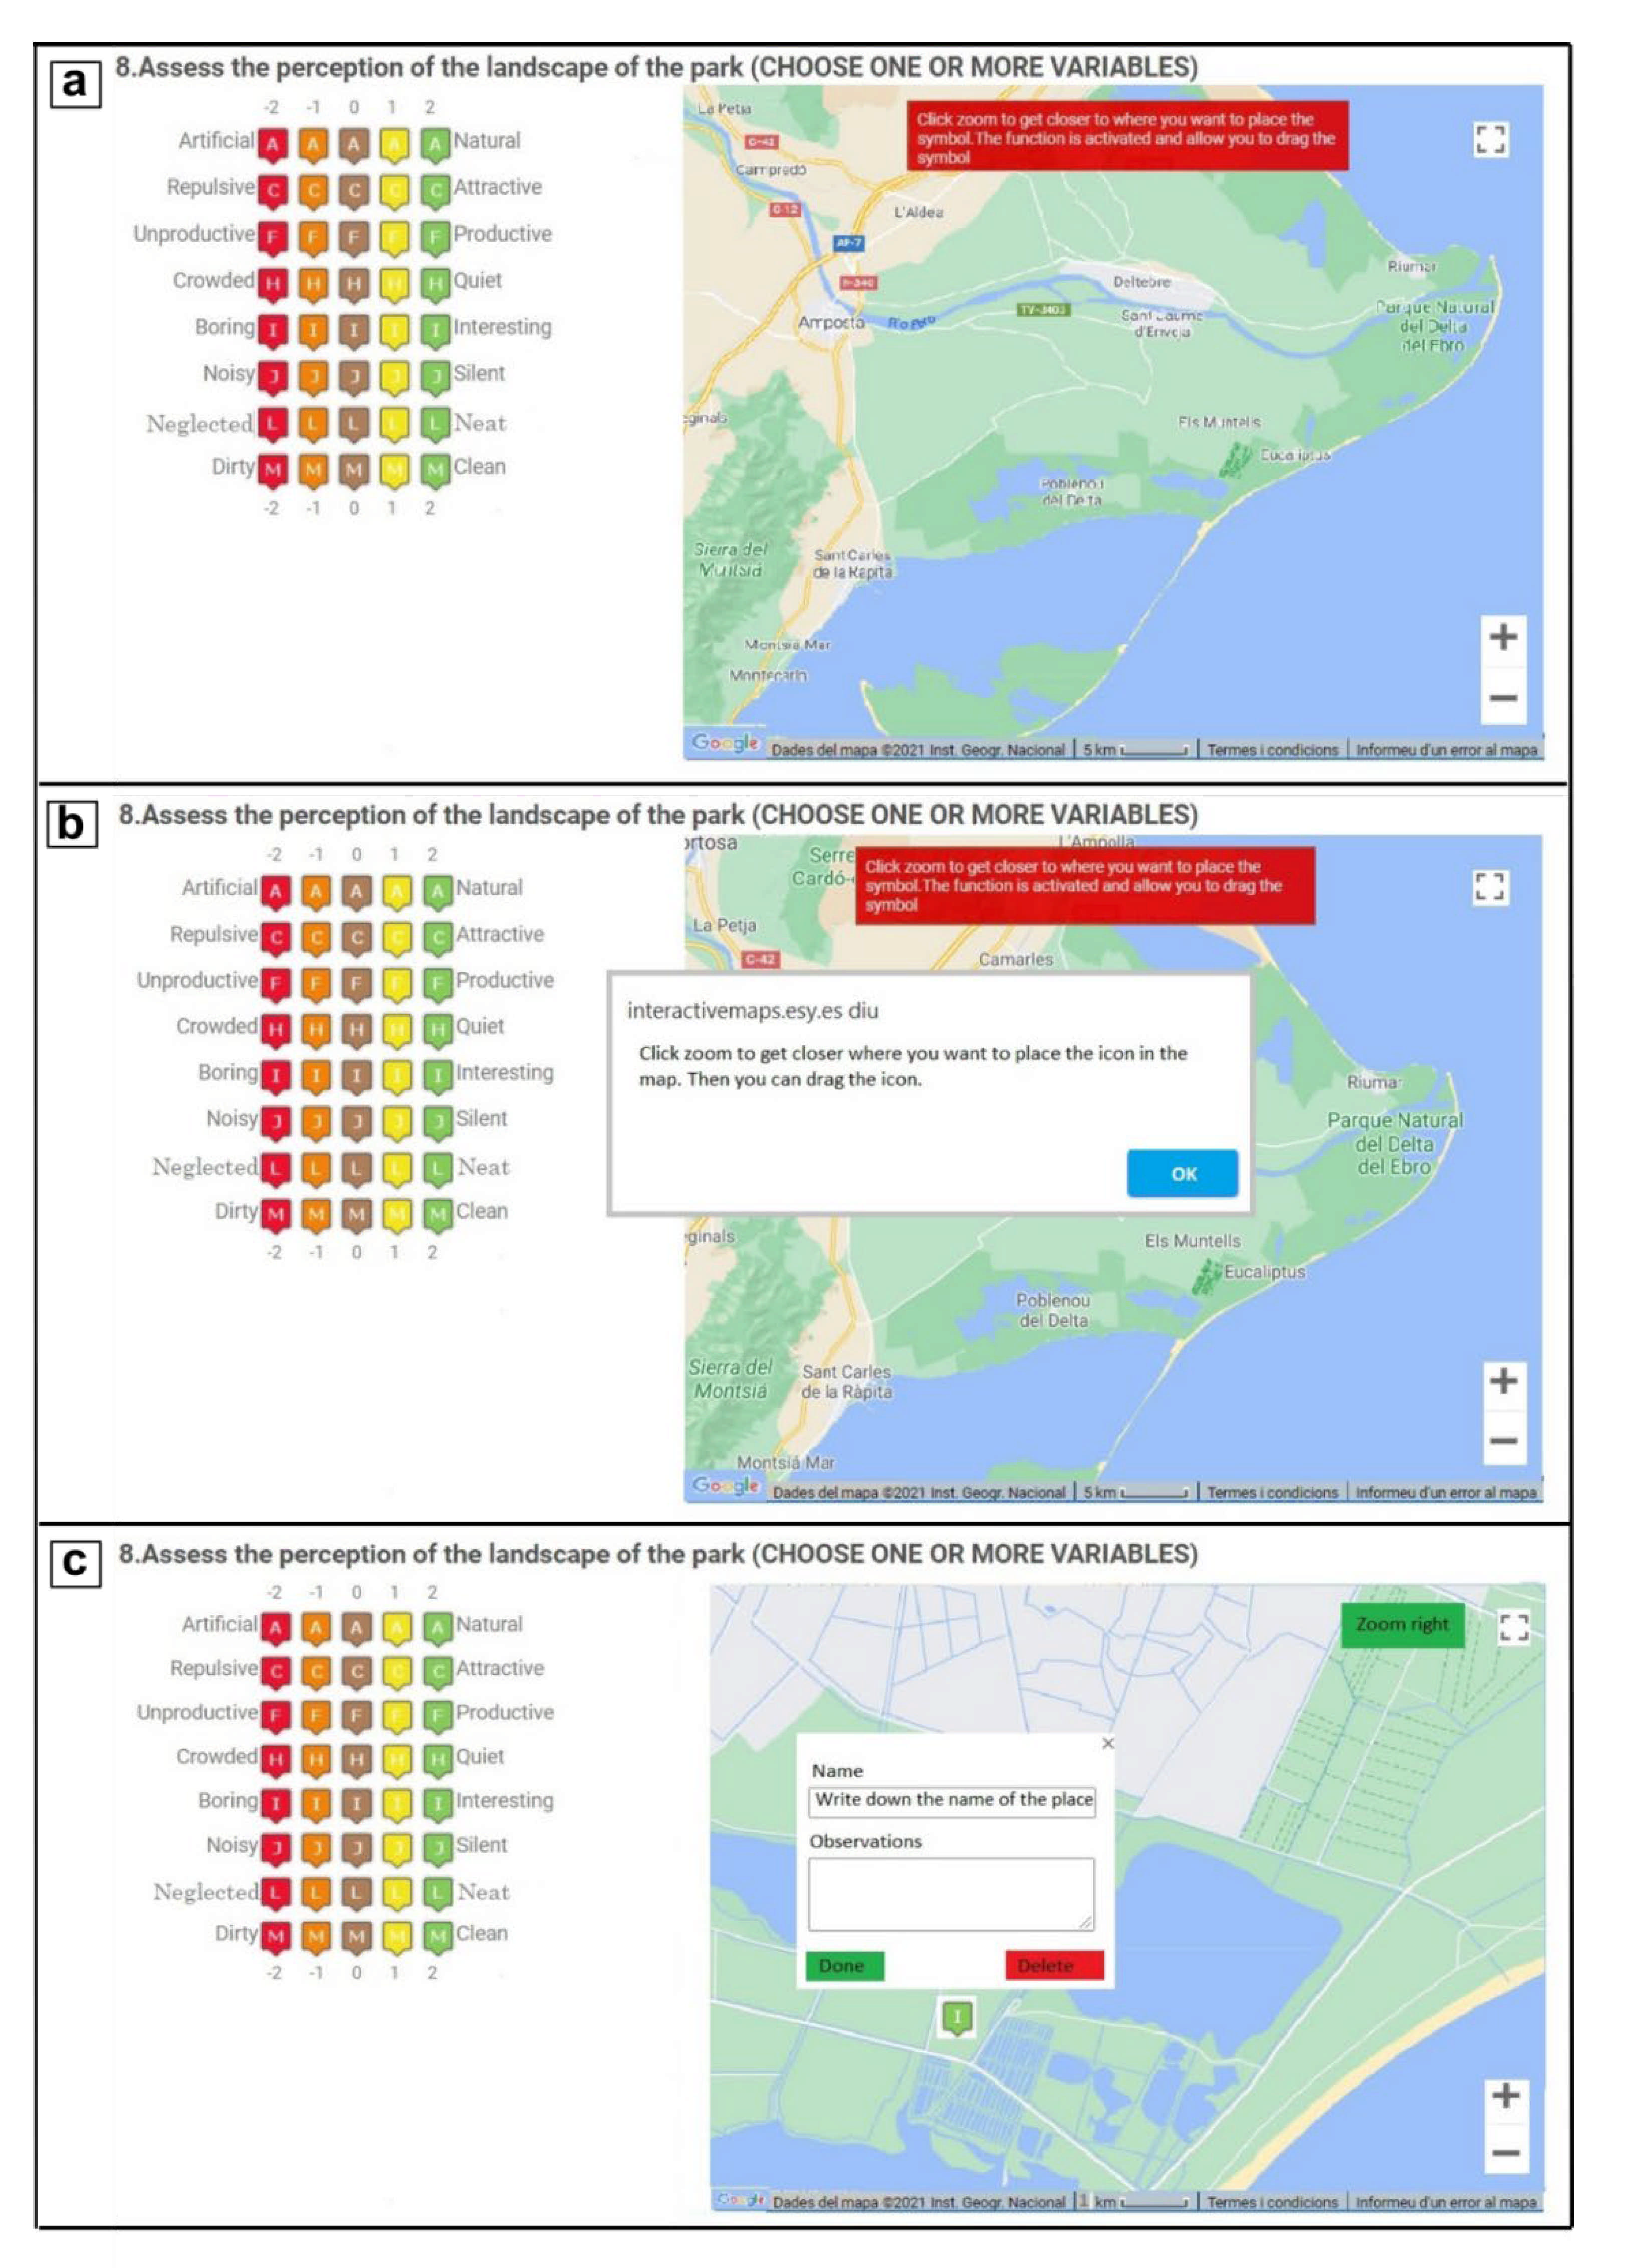
An online PPGIS questionnaire was designed using Google Maps as a reference base map [
32] and embedded in a webpage using hypertext markup language (HTML). Spatial information (latitude and longitude) was stored with JavaScript. Google Forms was used to collect data, Notepad++ was used to edit information, and Dropbox and Hostinger were used for hosting.
The first section of the questionnaire collected data about the respondents themselves. Six sociodemographic questions were posed to describe users: country and place of residence, age, occupation, last time they visited the studied area, and frequency of visits. The first 4 questions could be answered with a short text, while the last 2 were multiple choice to ensure that the questionnaire was standardized [
18]. The second section focused on landscape perception. Respondents were asked to rate the concepts listed in
Table 1 and locate them on a map. Information about each item was provided when the respondent used the cursor to hover over it. Respondents were not required to reply to all 8 adjective pairs, although they could if they wanted to. They were allowed to place items with different scores in different places as many times as they wanted. To do so, they simply dragged the score for a given adjective and dropped it on the desired site to express their opinion. Due to accuracy requirements, the application was only active when users zoomed in on the map. Google Maps’ interface is displayed at a scale of 5 km by default. In order for the questionnaire to be active, a scale of at least 1 km was needed. A warning message appeared when this requirement was not met. When a user placed an item on the map, a pop-up window appeared where they could leave comments or extra information about the concept or site in question. Users were able to view the base map in topographic layout or as an orthophotograph and had the option of viewing place name labels (
Figure 2).
A pilot version was tested with a panel of experts, including researchers at the Universitat Rovira i Virgili and the Université François Revelais and managers from the Ebro Delta Natural Park and the Loire-Anjou Touraine Regional Natural Park. The test questionnaire was also checked over 2 months (June and July) with volunteers and staff at the Universitat Rovira i Virgili and the Ebro Delta Natural Park; a copy sent out by email achieved a 30% response rate (n = 50). The results obtained helped us to redesign the final form of the questionnaire and were not used for the actual study. Final changes included clarifying the instructions for answering the questionnaire and simplifying the questions and items to answer. A final version of the questionnaire was written in Catalan, Spanish, French, and English in order to engage the highest number of participants, whether local or foreign.
Dissemination is considered to be a crucial stage [
32] in the PPGIS approach. An online link was sent out to numerous institutions and individuals, including the Ebro Delta Natural Park, local volunteers and charities, local town councils, travel agencies, tourism offices, community centers, secondary schools, and universities. Posters and leaflets were also used, and local press helped to publicize the questionnaire. The intended target was the adult population, but restrictions were not imposed on respondents under 18 years old. Despite the bulk mailing, the highest number of responses came from social media.
The online link remained active for over a year (August to July), and successive appeals were made to encourage participation. In order to increase motivation to take part in the study [
21], a raffle for a tablet was held among all respondents to the questionnaire.
2.4. Spatial Analysis
Data were spatially analyzed using the ArcMap 10.2 software suite. In the study, participants positioned and rated their perceptions directly on the map. The resulting spatial distribution covered the entire area under study. However, clusters of opinions appeared around the most visited places, the most iconic landmarks, and the most representative and meaningful sites. Thus, the spatial distribution of the judgments was not homogeneous. We conducted an interpolation analysis in order to create a smooth surface. The purpose of this analysis was to map people’s perceptions throughout the area under study even if they had not explicitly expressed their judgments on a given place. By conducting this spatial operation, participants’ opinions were inferred from sites that were judged and applied to sites that were not judged via spatial correlation. Opinions were also weighted via multi-criteria evaluation (MCE). The aim of this stage was to synthesize the items analyzed by integrating the newly created interpolation surfaces in a single file that summarized all the information.
The IDW algorithm was selected to interpolate the spatial data. The IDW algorithm is a deterministic interpolation procedure that has proved to be flexible and reliable to conduct spatial autocorrelation [
33]. This algorithm weights sample points according to their intrinsic meaning and spatial position, so inferred opinions are interpolated from other opinions in two ways: attributive value and geography. Influence is assumed to decrease as distance increases, as the name of the algorithm suggests [
33]. The result is a geographic interpolation that infers values from known sample points to estimated locations, yielding reliable information about spatial patterns. By using the IDW algorithm, perceptions were mapped where participants expressed their opinion, and it inferred on an attributive and spatial basis where they did not. The IDW is considered an accurate interpolation method at detailed scales and is less restrictive than other interpolation techniques, such as kriging [
26]. Other advantages of this algorithm are its resistance to outliers and its adjustment to maximum and minimum scores. To fit the IDW algorithm as best as possible to each situation, 6 trials were conducted to determine the minimum number of sample points needed to perform the interpolation. In the end, a minimum number of 18 sample points and a variable search radius for their spatial accuracy and thematic coherence were selected. This means that interpolated scores were deduced through 18 sample points collected in the vicinity of the area to be interpolated, and such vicinity was defined by a variable distance that could be larger if the sample points were scarce or smaller if they were abundant. All 8 concepts were connected by using MCE. This procedure should be understood as a means of synthesis, homogenizing the scores for each adjective according to their significance. Thus, a given score by a respondent could change its final value according to its contextual meaning. The reason for doing this is that all 8 landscape concepts did not have the same significance when assembled, because some had prevalence over the others. For instance, “cleanliness” and “neatness” had a greater likelihood of creating a given representation of the landscape than “productiveness” or “interest”. Therefore, places rated positively for one concept may not be for another concept. By performing EMC, a weighted agreement could be found. Weights were initially determined according to the number of responses recorded and then agreed on and verified by the panel of experts (
Table 2).
Surfaces resulting from the interpolation of bipolar adjectives were standardized to a common numeric range (1–5) using a linear rescaling technique:
where Xi is the score of factor I, xi is the original value of factor I, mini is the minimum of factor I, and maxi is the maximum of factor i.
Subsequently, these factors were aggregated according to the above-mentioned weighted linear combination, where each one was multiplied by a weight summarizing all values in the same pixel:
where wi is the weight assigned to factor I and Xi is the score of factor i.
For all spatial analyses, a 25 m2 cell resolution was chosen, which produces accurate outputs on a 1:50,000 cartographic scale.
3. Results
Landscape perception was assessed by characterizing the participants in the questionnaire, analyzing their opinions on each requested concept, and conducting spatial analysis.
3.1. General Overview
The PPGIS was completed by 276 respondents. All of the responses did not reach the desired quality standards, so a filter was applied to ensure that they met certain requisites. Questionnaires were accepted if they met all three of the following conditions: (1) the respondent answered at least one spatial question, (2) the answers referred to the Ebro Delta, and (3) the answers were spatially coherent, i.e., did not report redundant or misleading locations. The quality filters reduced the number of valid answers to 196 (71% of the responses received), providing 1593 georeferenced opinions, which is an average of 8.13 answers per respondent.
The largest respondent group (81.12%) was 15 to-34-year-olds, and the most numerous opinions were from 20 to-24-year-olds (30.10%). There were very few respondents over 44 years old and none older than 60. In terms of input, 75.46% of the opinions were given by respondents in the 15–34 age group. The greatest number of comments also came from the 20–24 age group (24.54%) (
Table 3). Less than 15% of respondents were local; non-local respondents for the most part were Spaniards, although there were also respondents from the United Kingdom, France, and other countries. Proportionally, slightly more opinions were given by non-locals (85.9%) than locals, outnumbering them by 1.84%.
Over half of the respondents (53.85%) said they visited the park a few times; 73.47% stated they had visited the area within the last year, and over one-third (36.22%) did so within the last month.
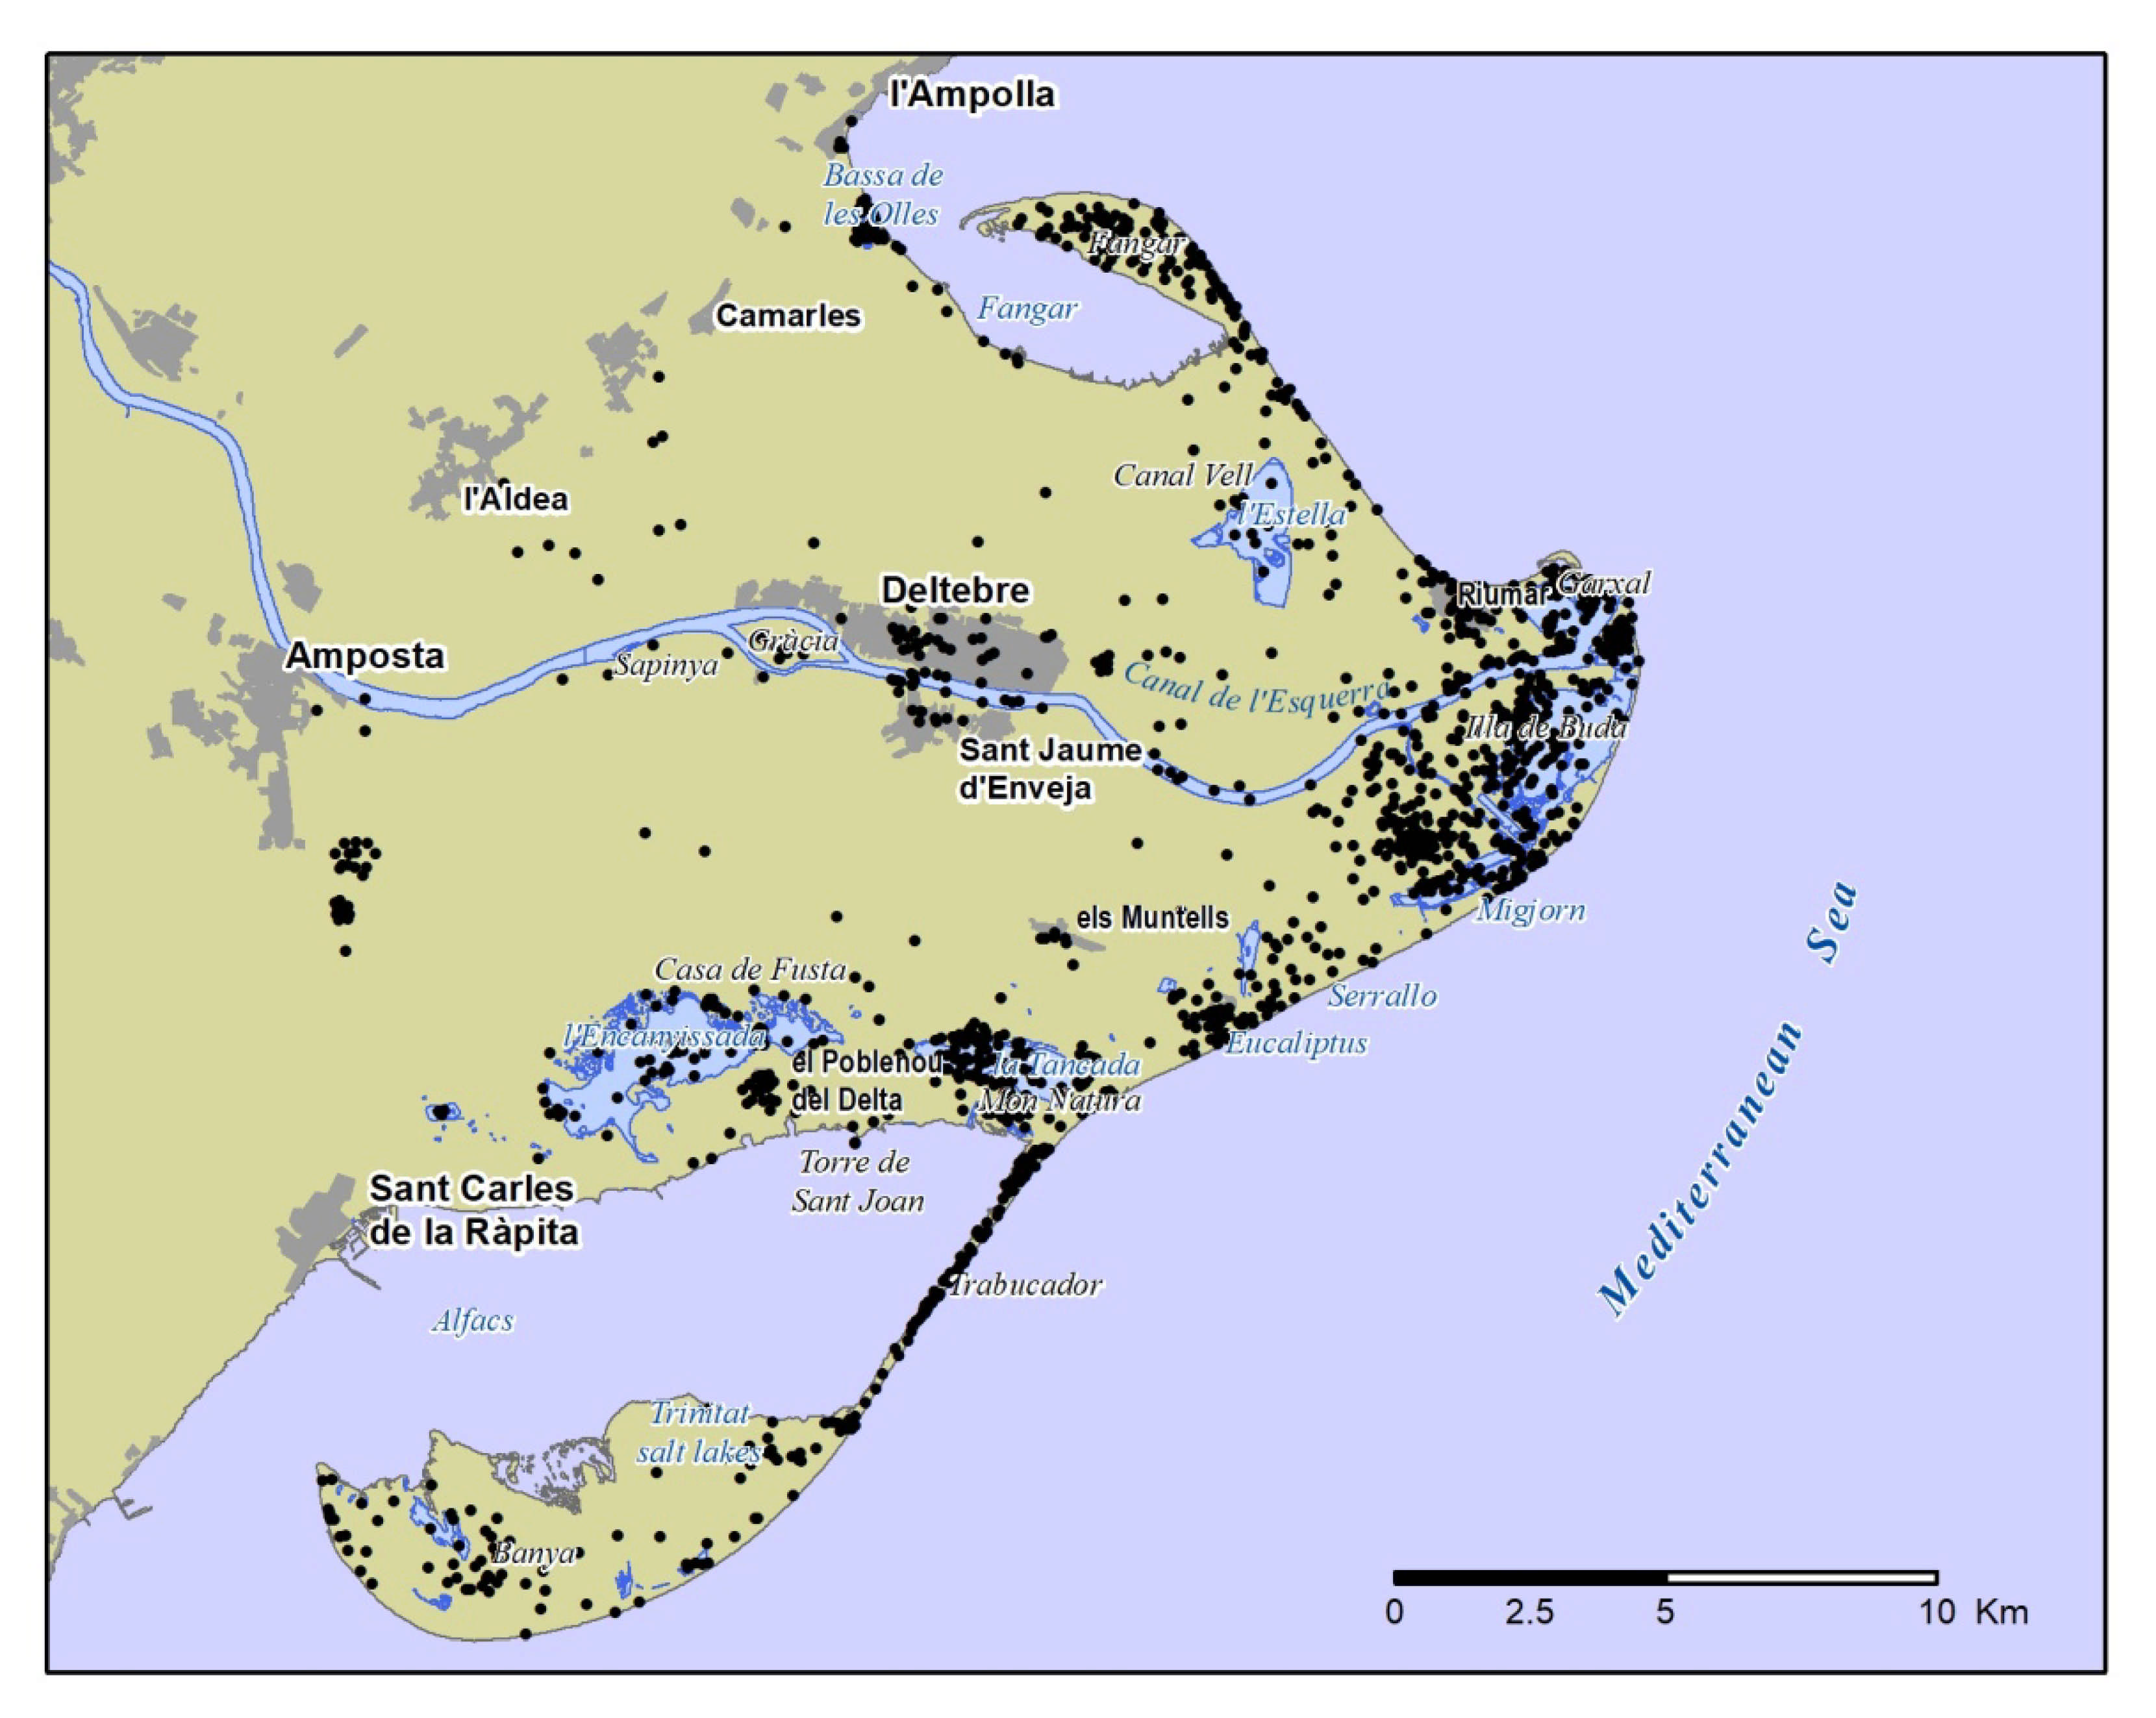
From a spatial perspective, almost all of the feedback was properly georeferenced in the area under study, and only 2.6% of the answers referred to locations outside the Ebro Delta. Nearly 40% of the opinions were about places within 500 m of the shoreline, and 57.56% were within 1 km. A density analysis revealed clusters of opinions regarding the mouth of the Ebro River, protected areas, and tourist attractions. By comparison, fewer answers were given in reference to towns and central areas (
Figure 3).
3.2. Landscape Perception
Respondents reported their opinions fairly heterogeneously, giving different feedback according to their interest in the question. The item with the most responses was “naturalness” (20.09%), while “productiveness” (5.96%) had the least (
Table 4); the number of answers per adjective pair was quite variable (µ = 181.5; σ = 71.45). Overall, answers were skewed toward positive appreciation (76.46%). The “very positive” category was more than 8 times larger than the “very negative” category (62.40% and 7.66%, respectively). Respondents also expressed their views with a variety of comments (n = 204). A number of them (22.06%) referred to “naturalness”, while others referred to “attractiveness” (16.67%) and “cleanliness” (17.16%) (
Table 4).
Two-fifths of the comments had negative connotations or conveyed negative opinions. However, a similar proportion (37.25%) indicated positive judgments. Some concepts drew mainly negative comments (e.g., cleanliness, 88.57%; neatness, 65.22%). Half of the comments for “productiveness”, “attractiveness”, and “interest” conveyed positive judgments. All comments referred to a particular site in the area under study, and 9.31% of them used place names to pinpoint their message. A word count analysis pointed to “beach” as being the most frequently used word (7.68%), followed by place names, including names of lagoons. Tourist resorts appeared in the 9th and 16th positions (2.88% for Riumar, 1.71% for Eucaliptus).
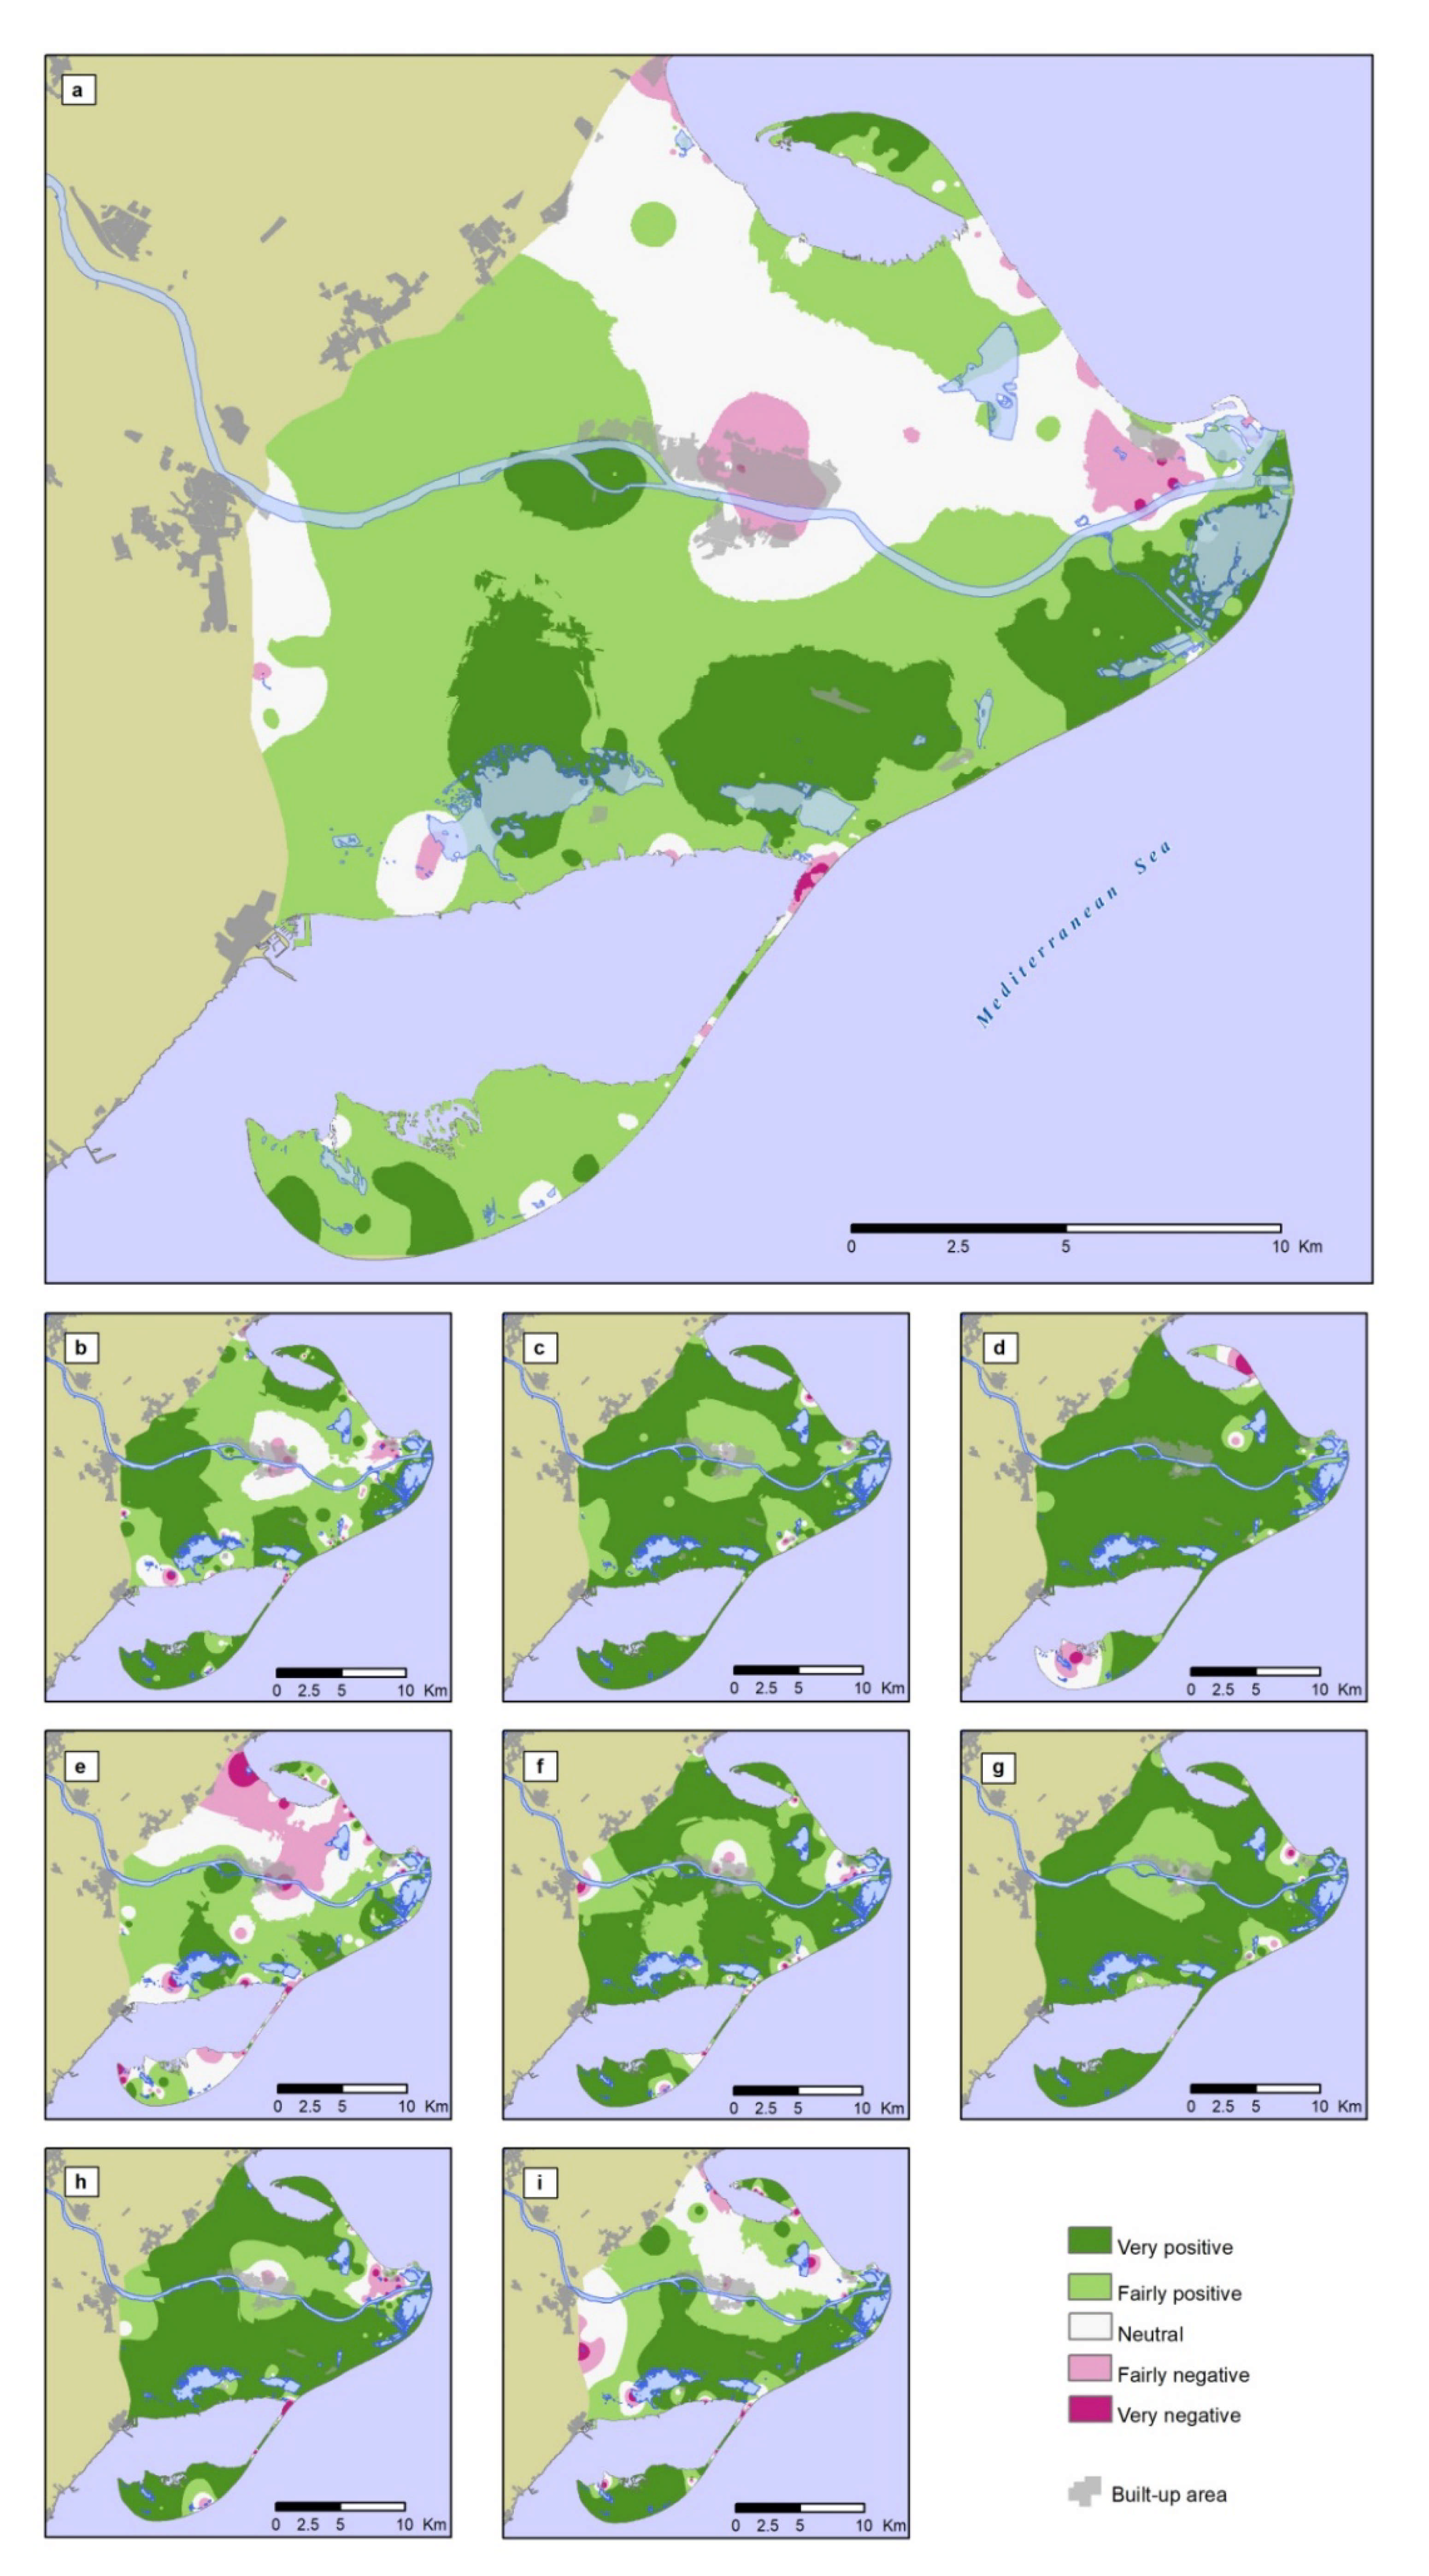
According to the IDW and MCE procedure, 70.92% of the area under study was rated positively, with half (163.36 km
2) considered “fairly positive”. Areas regarded as neutral accounted for one-quarter (24.91%) of the Ebro Delta, whereas negative judgments accounted for less than 4.2% (13.51 km
2). From a spatial point of view, areas judged positively were clustered toward the southern side of the area, especially around lagoons and protected sites, whereas areas regarded negatively were localized around towns, resorts, and tourist spots.
Table 5 shows the key data for the items, and
Figure 4 depicts their scope.
The areas rated positively were mainly the result of judgments of “productiveness”, “interest”, and “attractiveness” which were the concepts with the best scores (>93% of the area was rated positively for each item). Very positive judgments for “attractiveness” and “productiveness” were common and applied to numerous locations (71% and 61.1% of the opinions in 56.08% and 65.28% of the area). These were located somewhat more evenly than those for “interest” (70.4% and 53.64% of the area). For this reason, although this item has a lower weight, it is prevalent enough to define very positive areas that tend to cluster around protected sites. Fairly positive judgments covered most of the southern side of the Ebro Delta, principally because opinions on “attractiveness” and “productiveness” were homogeneously distributed. Other concepts, such as “peacefulness” and “silence”, were also important (>91% of the area rated positively), although their spatial distribution was less balanced, which makes them less prevalent.
Places were rated as neutral based on low- and mid-range scores for “cleanliness” and “neatness”, and mid-range scores for “peacefulness” and “silence”. These four concepts behaved differently from a spatial point of view. The former two covered a relatively large geographic expanse (both depicted an interpolated surface of 30% over the region) and accounted for the largest proportions of negative input (30.5% and 20.48%). The latter two concepts were spatially restricted and based on a reduced and homogeneous spatial distribution of opinions (7.31% and 6.07%, and 7.1% and 6.25% of the surface, respectively). This is reinforced by the fact that “cleanliness” and “neatness” had the highest MCE weighting. “Naturalness” was also considered neutral (18.75% of the surface was considered neutral), but the impact of this was marginal, as the inputs were scattered and mixed. “Cleanliness” and “neatness” received lower scores in areas rated positively for other items, while “peacefulness” and “silence” coincided, showing well-defined lower scores at sites such as towns and touristy spots.
Areas regarded negatively were mainly based on “cleanliness” or “neatness”, as indicated earlier. In particular, “cleanliness” accounted for the largest area identified as negative (50.3 km2, 15.5%). For the other concepts, negative judgments were fairly concentrated in well-delineated pockets, and overall, they came from clustered opinions. In some cases, factors such as “attractiveness” and “interest” (<1% of the surface) were highly concentrated in the form of clustered inputs in smaller areas, whereas others, such as “naturalness”, were also clustered but over somewhat larger areas (18% of inputs, 2.64% of the Ebro Delta).
5. Conclusions
Despite the popularity of landscape perception studies, the use of interpolation procedures and MCE to map cognitive approaches is still a novelty. This study bridges the gap between discrete landscape opinions and spatial interpolation. The main outcome is a map depicting prevalent perceptions and likely judgments where respondents did not provide specific input. This is significant, because it provides original insight into how perceptions can be zoned and therefore mapped. A spatial dataset on landscape perception is useful input for management and decision making. Potential applications include protected areas policies, land planning, and tourism management, and responsible bodies could consider this an additional and original tool to accomplish their duties. The area under study is mainly perceived positively: fairly positive judgements are prevalent all over the Ebro Delta, and very positive opinions are concentrated on the southern side. Overall, the area is interpreted as productive, interesting, attractive, and mainly quiet and peaceful, although it is seen as dirty in some parts.
Based on the cognitive rationale, judgments influence one another, and place-based opinions are the result of a variety of beliefs, some of which may overshadow others. People’s preconceptions play a similar role, as they can distort landscape perceptions, skewing them toward preconceived notions. Although this poses a problem in ascertaining particular judgments, it is an asset for depicting general trends approached holistically. Prevalent judgments can be zoned using spatial analysis techniques, and by means of interpolation and MCE, it is possible to infer opinions on sites that have not been directly judged. This approach is useful because it supports landscape perception mapping.
A caveat of this study is the respondents’ representativeness, so their input has to be understood as proxy data collected during a year that depicts people’s opinions. The PPGIS questionnaire being designed online brings the opportunity to conduct the study periodically and effortlessly in order to verify the prevalence of patterns over a series of years. A shortcoming is that the spatial dimension of the original data may be affected by the bias introduced by the respondents themselves. Therefore, a follow-up study should focus on gaining place-based insights through the interpolation of spatial ancillary data in order to maintain the cognitive approach, enhance the spatial dimension of data, and diminish spatial bias driven by respondents.


