
Assessing the Impacts of Rural Development Plan Measures on the Sustainability of Agricultural Holdings Using a PMP Model


Abstract
:1. Introduction
2. Materials and Methods
2.1. Rural Development Plan (RDP)
- Improving the competitiveness of agriculture and forestry.
- Improving the environment and countryside.
- Improving the quality of life in rural areas and diversification in the rural economy.
- modernizing of agricultural holdings; and
- improving their overall performance through better use of production factors, including the introduction of new technologies and innovation.
2.2. Impact Assessment (IA) Tools
2.3. The Positive Mathematical Programming (PMP) Model
x ≥ 0
- z is the objective value;
- x is the n × 1 vector of production activities;
- r is the n × 1 vector of activity revenues;
- c is the n × 1 vector of variable costs;
- A is the m × n matrix of the technical coefficients;
- b is the m × 1 vector of the upper bounds of the resources and the policy constraints;
- π is the m × 1 vector of the shadow prices of the resources and the policy constraints.
- x0 is the n × 1 vector of observed activity levels;
- ε is the n × 1 vector of small positive numbers; and
- λ is the n × 1 vector of dual values of the calibration constraints.
- d is the n × 1 vector of the parameter associated with the linear term, and
- Q is a symmetrical (n × n) positive semi-definite matrix of parameters associated with the quadratic terms.
2.4. Constraints and Indicators
3. Results
3.1. Sample, Data, and Study Area
3.2. Agricultural Land Change
3.3. Economic Indicators
3.4. Social Indicators
3.5. Environmental Indicators
4. Conclusions
Author Contributions
Funding
Data Availability Statement
Conflicts of Interest
References
- European Commission Impact Assessments. Available online: https://ec.europa.eu/info/law/law-making-process/planning-and-proposing-law/impact-assessments_en (accessed on 31 March 2021).
- Manos, B.; Bournaris, T.; Moulogianni, C.; Arampatzis, S. IA tools applied to impact assessment of EU policies in agriculture and environment. Int. J. Environ. Sustain. Dev. 2013, 12, 103–123. [Google Scholar] [CrossRef]
- Bazzani, G.M. A decision support for an integrated multi-scale analysis of irrigation: DSIRR. J. Environ. Manag. 2005, 77, 301–314. [Google Scholar] [CrossRef] [PubMed]
- Giupponi, C.; Vladimirova, I. Ag-PIE: A GIS-based screening model for assessing agricultural pressures and impacts on water quality on a European scale. Sci. Total Environ. 2006, 359, 57–75. [Google Scholar] [CrossRef]
- Bond, A.; Morrison-Saunders, A.; Pope, J. Sustainability assessment: The state of the art. Impact Assess. Proj. Apprais. 2012, 30, 53–62. [Google Scholar] [CrossRef]
- Bond, A.J.; Morrison-Saunders, A. Re-evaluating Sustainability Assessment: Aligning the vision and the practice. Environ. Impact Assess. Rev. 2011, 31, 1–7. [Google Scholar] [CrossRef] [Green Version]
- Wrzaszcz, W.; Zegar, J.S. Challenges for Sustainable Development of Agricultural Holdings. Econ. Environ. Stud. 2016, 16, 377–402. [Google Scholar]
- Toprak, Z. Brundtland Report. In Encyclopedia of Corporate Social Responsibility; Springer: Berlin/Heidelberg, Germany, 2013; pp. 222–228. [Google Scholar]
- World Commission on Environment and Development. Our Common Future; Oxford University Press: Oxford, UK, 1987. [Google Scholar]
- Solow, R.M. Sustainability: An Economist’s Perspective; Marine Policy Center: Falmouth, MA, USA, 1991. [Google Scholar]
- Purvis, B.; Mao, Y.; Robinson, D. Three pillars of sustainability: In search of conceptual origins. Sustain. Sci. 2019, 14, 681–695. [Google Scholar] [CrossRef] [Green Version]
- Guth, M.; Smędzik-Ambroży, K.; Czyżewski, B.; Stępień, S. The Economic Sustainability of Farms under Common Agricultural Policy in the European Union Countries. Agriculture 2020, 10, 34. [Google Scholar] [CrossRef] [Green Version]
- European Environment Agency Indicators of Sustainable Development: Framework and Methodologies. Available online: https://www.eea.europa.eu/data-and-maps/indicators/land-cover-distribution-and-change/indicators-of-sustainable-development-framework (accessed on 15 April 2021).
- United Nations. Indicators of Sustainable Development: Guidelines and Methodologies; UN: New York, NY, USA, 2007; ISBN 978-92-1-104577-2. [Google Scholar]
- OECD. Environmental Indicators for Agriculture Methods and Results Executive Summary 2001; OECD: Paris, France, 2000. [Google Scholar]
- Lotze-Campen, H. The role of modelling tools in Integrated Sustainability Assessment (ISA). Int. J. Innov. Sustain. Dev. 2008, 3, 70–92. [Google Scholar] [CrossRef]
- Belhouchette, H.; Louhichi, K.; Therond, O.; Mouratiadou, I.; Wery, J.; van Ittersum, M.; Flichman, G. Assessing the impact of the Nitrate Directive on farming systems using a bio-economic modelling Chain. Agric. Syst. 2011, 104, 135–145. [Google Scholar] [CrossRef]
- Bournaris, T.; Moulogianni, C.; Manos, B. A multicriteria model for the assessment of rural development plans in Greece. Land Use Policy 2014, 38, 1–8. [Google Scholar] [CrossRef]
- Manos, B.D.; Papathanasiou, J.; Bournaris, T.; Voudouris, K. A DSS for sustainable development and environmental protection of agricultural regions. Environ. Monit. Assess. 2010, 164, 43–52. [Google Scholar] [CrossRef]
- Sterk, B.; van Ittersum, M.K.; Leeuwis, C. How, when, and for what reasons does land use modelling contribute to societal problem solving? Environ. Model. Softw. 2011, 26, 310–316. [Google Scholar] [CrossRef]
- Kunkel, R.; Eisele, M.; Schäfer, W.; Tetzlaff, B.; Wendland, F. Planning and implementation of nitrogen reduction measures in catchment areas based on a determination and ranking of target areas. Desalination 2008, 226, 1–12. [Google Scholar] [CrossRef]
- Louhichi, K.; Kanellopoulos, A.; Janssen, S.; Flichman, G.; Blanco, M.; Hengsdijk, H.; Heckelei, T.; Berentsen, P.; Lansink, A.O.; Ittersum, M. Van FSSIM, a bio-economic farm model for simulating the response of EU farming systems to agricultural and environmental policies. Agric. Syst. 2010. [Google Scholar] [CrossRef] [Green Version]
- Manos, B.; Bournaris, T.; Kamruzzaman, M.; Begum, M.; Anjuman, A.; Papathanasiou, J. Regional impact of irrigation water pricing in Greece under alternative scenarios of European policy: A multicriteria analysis. Reg. Stud. 2006, 40. [Google Scholar] [CrossRef] [Green Version]
- Bournaris, T.; Papathanasiou, J.; Moulogianni, C.; Manos, B. A Fuzzy Multicriteria Mathematical Programming model for planning agricultural regions. New Medit. 2009, 8, 22–27. [Google Scholar]
- Viaggi, D.; Raggi, M.; Gomez Y Paloma, S. An integer programming dynamic farm-household model to evaluate the impact of agricultural policy reforms on farm investment behaviour. Eur. J. Oper. Res. 2010, 207, 1130–1139. [Google Scholar] [CrossRef]
- Thiel, A. The use of ex-ante modelling tools in European Impact Assessment: What role does land use play? Land Use Policy 2009, 26, 1138–1148. [Google Scholar] [CrossRef]
- Dijak, W.D.; Hanberry, B.B.; Fraser, J.S.; He, H.S.; Wang, W.J.; Thompson, F.R. Revision and application of the LINKAGES model to simulate forest growth in central hardwood landscapes in response to climate change. Landsc. Ecol. 2017, 32, 1365–1384. [Google Scholar] [CrossRef]
- Ministry of Rural Development and Food. Rural Development Plan 2014–2020; FAO: Rome, Italy, 2014. [Google Scholar]
- Finn, J.A.; Bartolini, F.; Bourke, D.; Kurz, I.; Viaggi, D. Ex post environmental evaluation of agri-environment schemes using experts’ judgements and multicriteria analysis. J. Environ. Plan. Manag. 2009, 52, 717–737. [Google Scholar] [CrossRef]
- Nilsson, M.; Jordan, A.; Turnpenny, J.; Hertin, J.; Nykvist, B.; Russel, D. The use and non-use of policy appraisal tools in public policy making: An analysis of three European countries and the European Union. Policy Sci. 2008, 41, 335–355. [Google Scholar] [CrossRef]
- Andreoli, M.; Tellarini, V. Farm sustainability evaluation: Methodology and practice. In Proceedings of the Agriculture, Ecosystems and Environment; Elsevier: Amsterdam, The Netherlands, 2000; Volume 77, pp. 43–52. [Google Scholar]
- Bina, O. A critical review of the dominant lines of argumentation on the need for strategic environmental assessment. Environ. Impact Assess. Rev. 2007, 27, 585–606. [Google Scholar] [CrossRef]
- Cashmore, M.; Bond, A.; Cobb, D. The role and functioning of environmental assessment: Theoretical reflections upon an empirical investigation of causation. J. Environ. Manag. 2008, 88, 1233–1248. [Google Scholar] [CrossRef]
- Nastis, S.A.; Michailidis, A.; Mattas, K. Crop biodiversity repercussions of subsidized organic farming. Land Use Policy 2013, 32, 23–26. [Google Scholar] [CrossRef]
- Ness, B.; Urbel-Piirsalu, E.; Anderberg, S.; Olsson, L. Categorising tools for sustainability assessment. Ecol. Econ. 2007, 60, 498–508. [Google Scholar] [CrossRef]
- Payraudeau, S.; Van Der Werf, H.M.G. Environmental impact assessment for a farming region: A review of methods. Agric. Ecosyst. Environ. 2005, 107, 1–19. [Google Scholar] [CrossRef]
- Botequim, B.; Bugalho, M.N.; Rodrigues, A.R.; Marques, S.; Marto, M.; Borges, J.G. Combining Tree Species Composition and Understory Coverage Indicators with Optimization Techniques to Address Concerns with Landscape-Level Biodiversity. Land 2021, 10, 126. [Google Scholar] [CrossRef]
- Howitt, R.E. Positive Mathematical Programming. Am. J. Agric. Econ. 1995, 77, 329–342. [Google Scholar] [CrossRef]
- Heckelei, T. Estimation of constrained optimisation models for agricultural supply analysis based on generalised maximum entropy. Eur. Rev. Agric. Econ. 2003, 30, 27–50. [Google Scholar] [CrossRef] [Green Version]
- Howitt, R.E. A calibration method for agricultural economic production models. J. Agric. Econ. 1995, 46, 147–159. [Google Scholar] [CrossRef]
- Röhm, O.; Dabbert, S. Integrating Agri-Environmental Programs into Regional Production Models: An Extension of Positive Mathematical Programming. Am. J. Agric. Econ. 2003, 85, 254–265. [Google Scholar] [CrossRef]
- De Sousa Fragoso, R.M.; da Silva Carvalho, M.L.; de Sousa Henriques, P.D. Assessing the prediction capacity of an agricultural supply positive mathematical programming model. Int. J. Sustain. Soc. 2011, 3, 209–220. [Google Scholar] [CrossRef]
- Kanellopoulos, A.; Reidsma, P.; Wolf, J.; van Ittersum, M.K. Assessing climate change and associated socio-economic scenarios for arable farming in the netherlands: An application of benchmarking and bio-economic farm modelling. Eur. J. Agron. 2014, 52, 69–80. [Google Scholar] [CrossRef]
- Janssen, S.; Louhichi, K.; Kanellopoulos, A.; Zander, P.; Flichman, G.; Hengsdijk, H.; Meuter, E.; Andersen, E.; Belhouchette, H.; Blanco, M.; et al. A generic bio-economic farm model for environmental and economic assessment of agricultural systems. Environ. Manag. 2010, 46, 862–877. [Google Scholar] [CrossRef] [PubMed] [Green Version]
- Bartolini, F.; Bazzani, G.M.; Gallerani, V.; Raggi, M.; Viaggi, D. The impact of water and agriculture policy scenarios on irrigated farming systems in Italy: An analysis based on farm level multi-attribute linear programming models. Agric. Syst. 2007, 93, 90–114. [Google Scholar] [CrossRef]
- Gómez-Limón, J.A.; Berbel, J. Multicriteria analysis of derived water demand functions: A Spanish case study. Agric. Syst. 2000, 63, 49–72. [Google Scholar] [CrossRef]
- Pujol, J.; Raggi, M.; Viaggi, D. The potential impact of markets for irrigation water in Italy and Spain: A comparison of two study areas. Aust. J. Agric. Resour. Econ. 2006, 50, 361–380. [Google Scholar] [CrossRef] [Green Version]
- Iglesias, E.; Garrido, A.; Gómez-Ramos, A. Evaluation of drought management in irrigated areas. Agric. Econ. 2003, 29, 211–229. [Google Scholar] [CrossRef]
- Solazzo, R.; Donati, M.; Arfini, F. Cap towards 2020 and the cost of political choices: The case of Emilia-romagna region. Land Use Policy 2015, 48, 575–587. [Google Scholar] [CrossRef]
- Cortignani, R.; Dono, G. Simulation of the impact of greening measures in an agricultural area of the southern Italy. Land Use Policy 2015, 48, 525–533. [Google Scholar] [CrossRef]
- Kanellopoulos, A.; Berentsen, P.; Heckelei, T.; Van Ittersum, M.; Lansink, A.O. Assessing the Forecasting Performance of a Generic Bio-Economic Farm Model Calibrated With Two Different PMP Variants. J. Agric. Econ. 2010, 61, 274–294. [Google Scholar] [CrossRef]
- Dantsis, T.; Douma, C.; Giourga, C.; Loumou, A.; Polychronaki, E.A. A methodological approach to assess and compare the sustainability level of agricultural plant production systems. Ecol. Indic. 2010, 10, 256–263. [Google Scholar] [CrossRef]
- Gómez-Limón, J.A.; Sanchez-Fernandez, G. Empirical evaluation of agricultural sustainability using composite indicators. Ecol. Econ. 2010, 69, 1062–1075. [Google Scholar] [CrossRef]
- Bournaris, T.; Manos, B. European Union agricultural policy scenarios’ impacts on social sustainability of agricultural holdings. Int. J. Sustain. Dev. World Ecol. 2012, 19, 426–432. [Google Scholar] [CrossRef]
- Bell, S.; Morse, S. Sustainability Indicators. Measuring the Immeasurable? Routledge: Abingdon, UK, 2008. [Google Scholar]
- Manos, B.; Bournaris, T.; Chatzinikolaou, P. Impact assessment of CAP policies on social sustainability in rural areas: An application in Northern Greece. Oper. Res. 2011, 11, 77–92. [Google Scholar] [CrossRef]
- Moulogianni, C.; Bournaris, T. Biomass production from crops residues: Ranking of agro-energy regions. Energies 2017, 10, 1061. [Google Scholar] [CrossRef] [Green Version]
- Manos, B.; Bournaris, T.; Moulogianni, C.; Kiomourtzi, F. Assessment of rural development plan measures in Greece. Int. J. Oper. Res. 2017, 28. [Google Scholar] [CrossRef]
- Aggelopoulos, S.; Arabatzis, G. European union young farmers program: A greek case study. New Medit. 2010, 9, 50–55. [Google Scholar]


| Indicators | Units | |
|---|---|---|
| Economic | Gross Revenue | € |
| Gross Margin | € | |
| Social | Labor Use | Hours |
| Annual Work Units | AWUs | |
| Seasonality | hours/month | |
| Environmental | Crop Diversity | Number of crops cultivated |
| Soil Coverage | % | |
| Water Use | m3 | |
| Nitrogen Use | Kg | |
| Electrical Power | MWh | |
| Thermal power | MWh |
| Existent | PMP Model | ||
|---|---|---|---|
| Values | % Deviation | ||
| Gross margin (€) | 15,699 | 16,398 | 4.5 |
| Fertilizers use (kg) | 6791 | 6801 | 0.1 |
| Labor use (hours) | 2715 | 2613 | −3.8 |
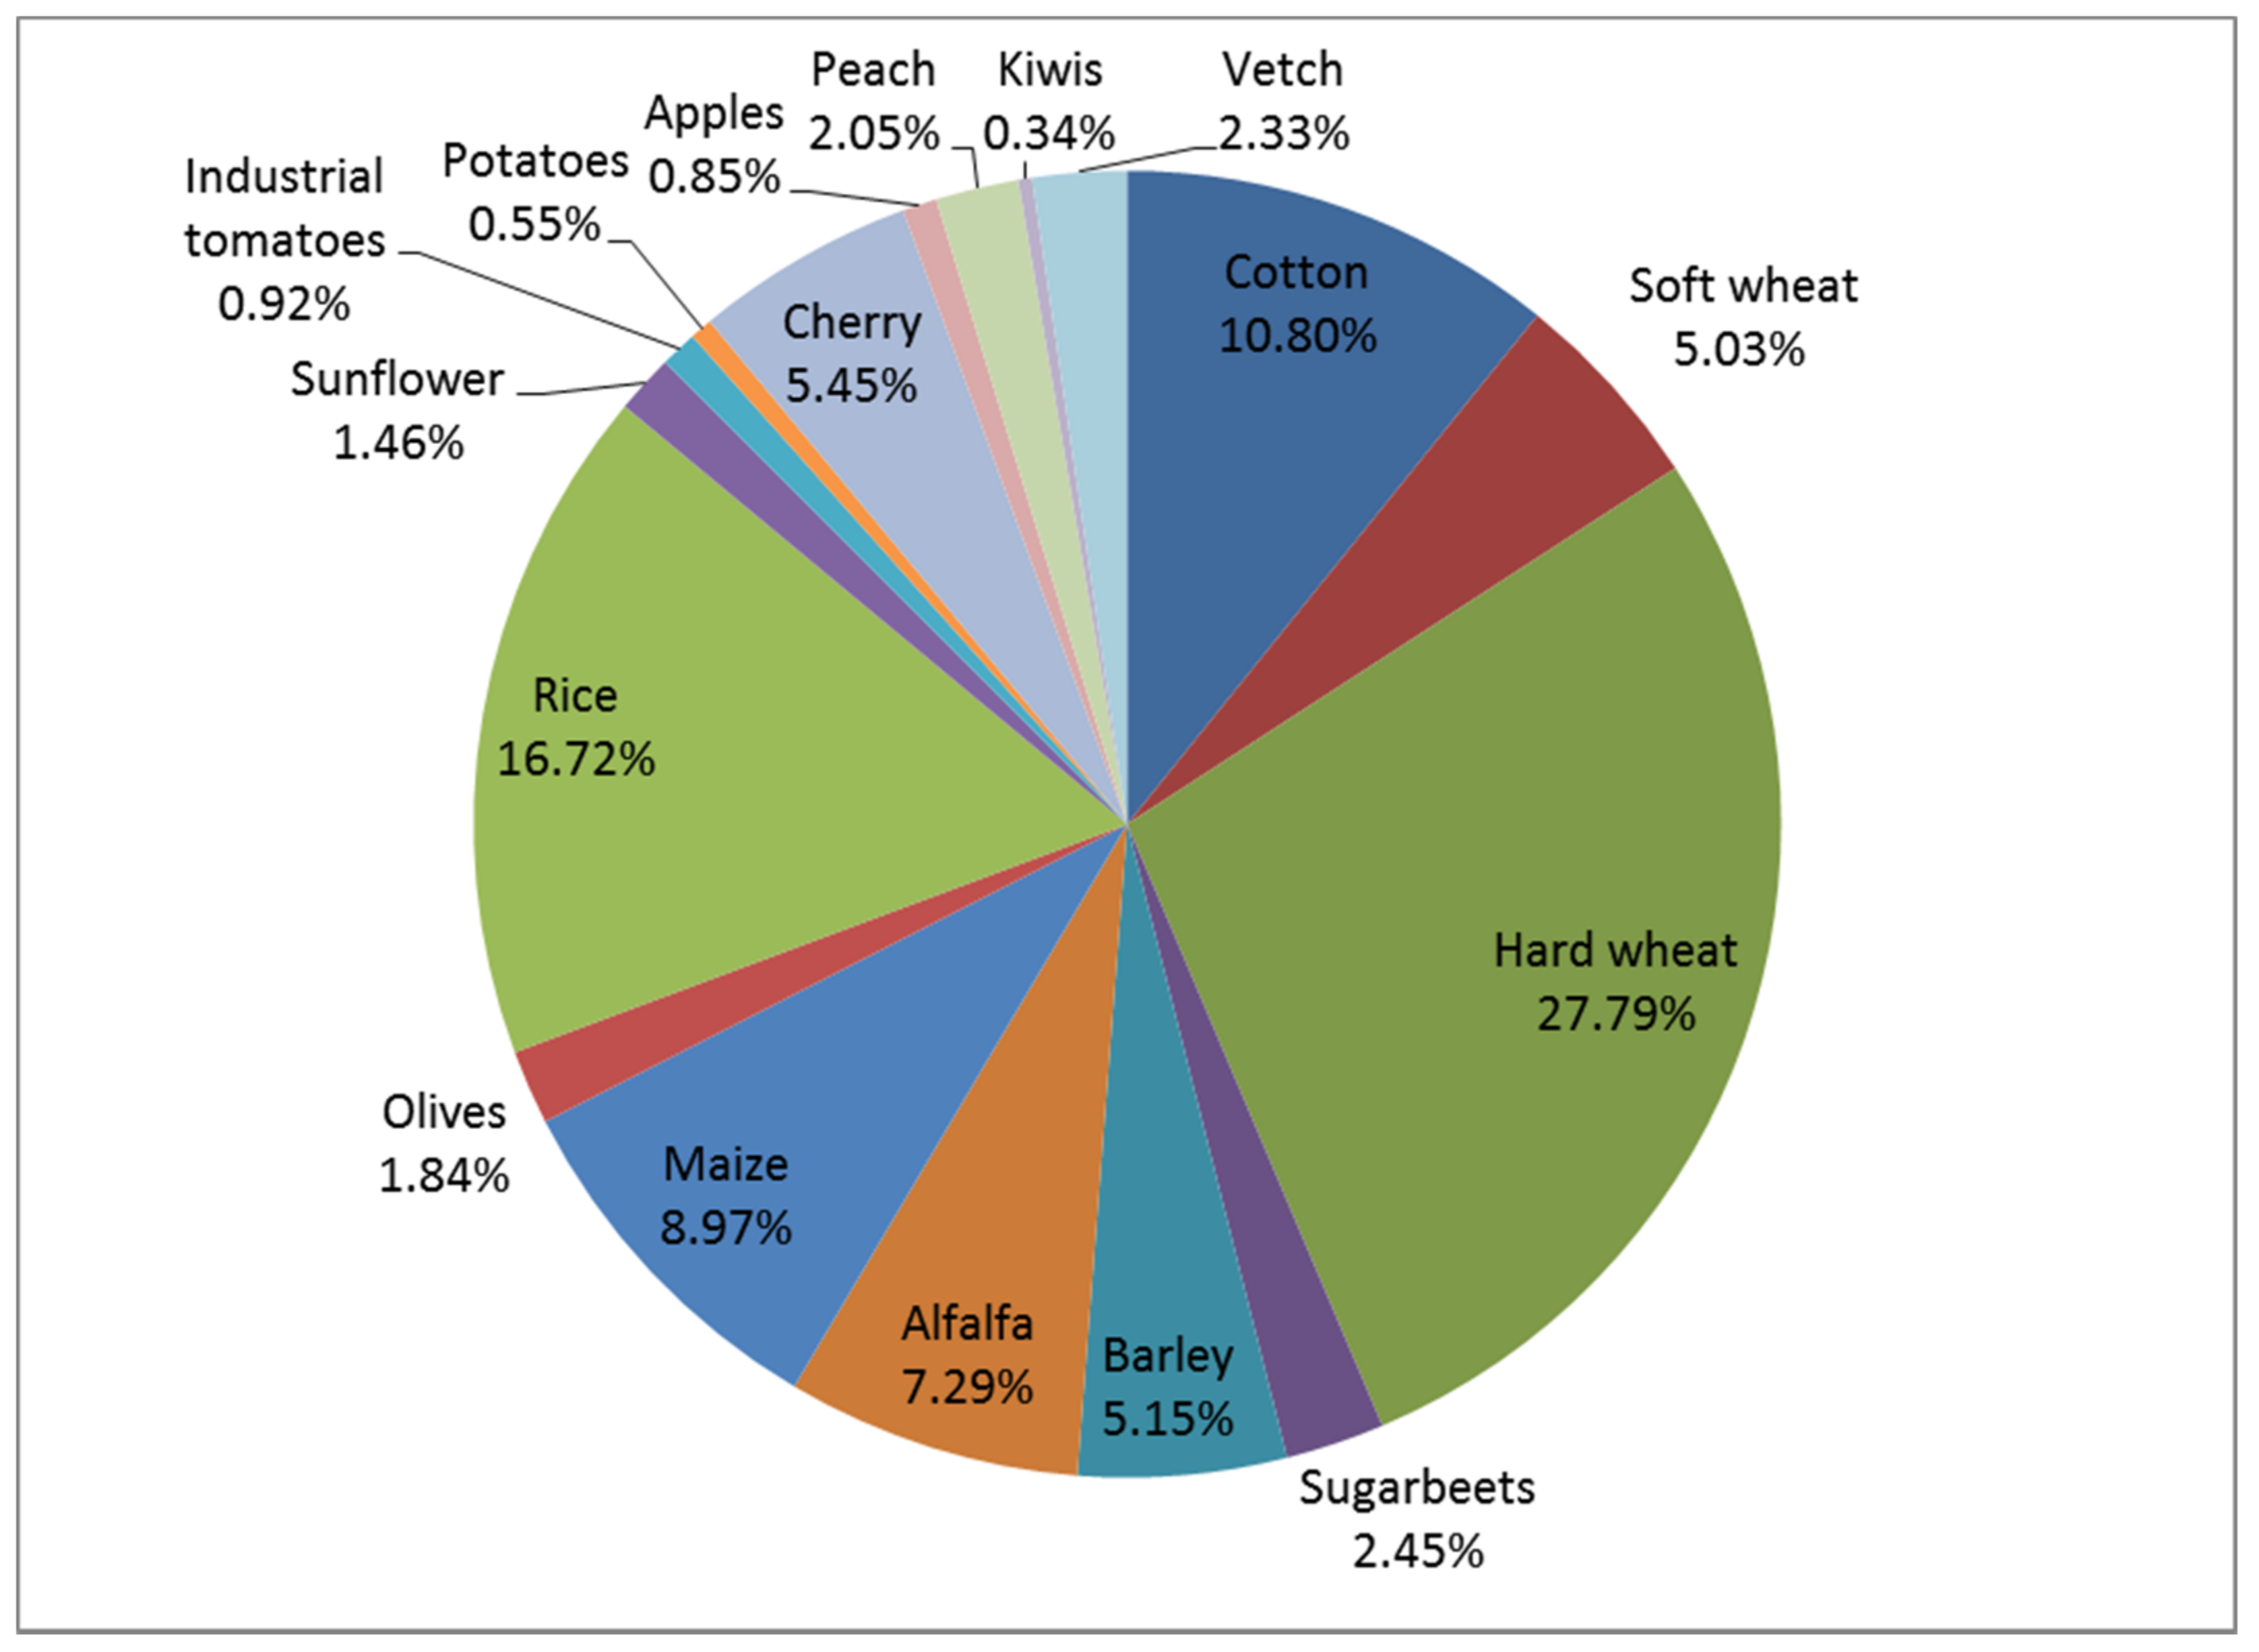
| Cotton | 10.80 | 4.00 | −62.9 |
| Soft wheat | 5.03 | 4.96 | −1.5 |
| Hard wheat | 27.79 | 32.48 | 16.9 |
| Sugarbeets | 2.45 | 0.00 | −100.0 |
| Barley | 5.15 | 6.12 | 18.7 |
| Alfalfa | 7.29 | 8.74 | 20.0 |
| Maize | 8.97 | 10.76 | 19.9 |
| Olive | 1.84 | 1.93 | 4.7 |
| Rice | 16.72 | 16.55 | −1.0 |
| Sunflower | 1.46 | 1.45 | −0.4 |
| Tomatoes | 0.92 | 0.92 | −0.2 |
| Potatoes | 0.55 | 0.67 | 20.8 |
| Cherries | 5.45 | 5.72 | 4.9 |
| Apples | 0.85 | 0.90 | 5.4 |
| Peaches | 2.05 | 2.15 | 4.8 |
| Kiwis | 0.34 | 0.36 | 4.9 |
| Vetch | 2.33 | 2.30 | −1.3 |
| Total | 100.0 | 100.0 | |
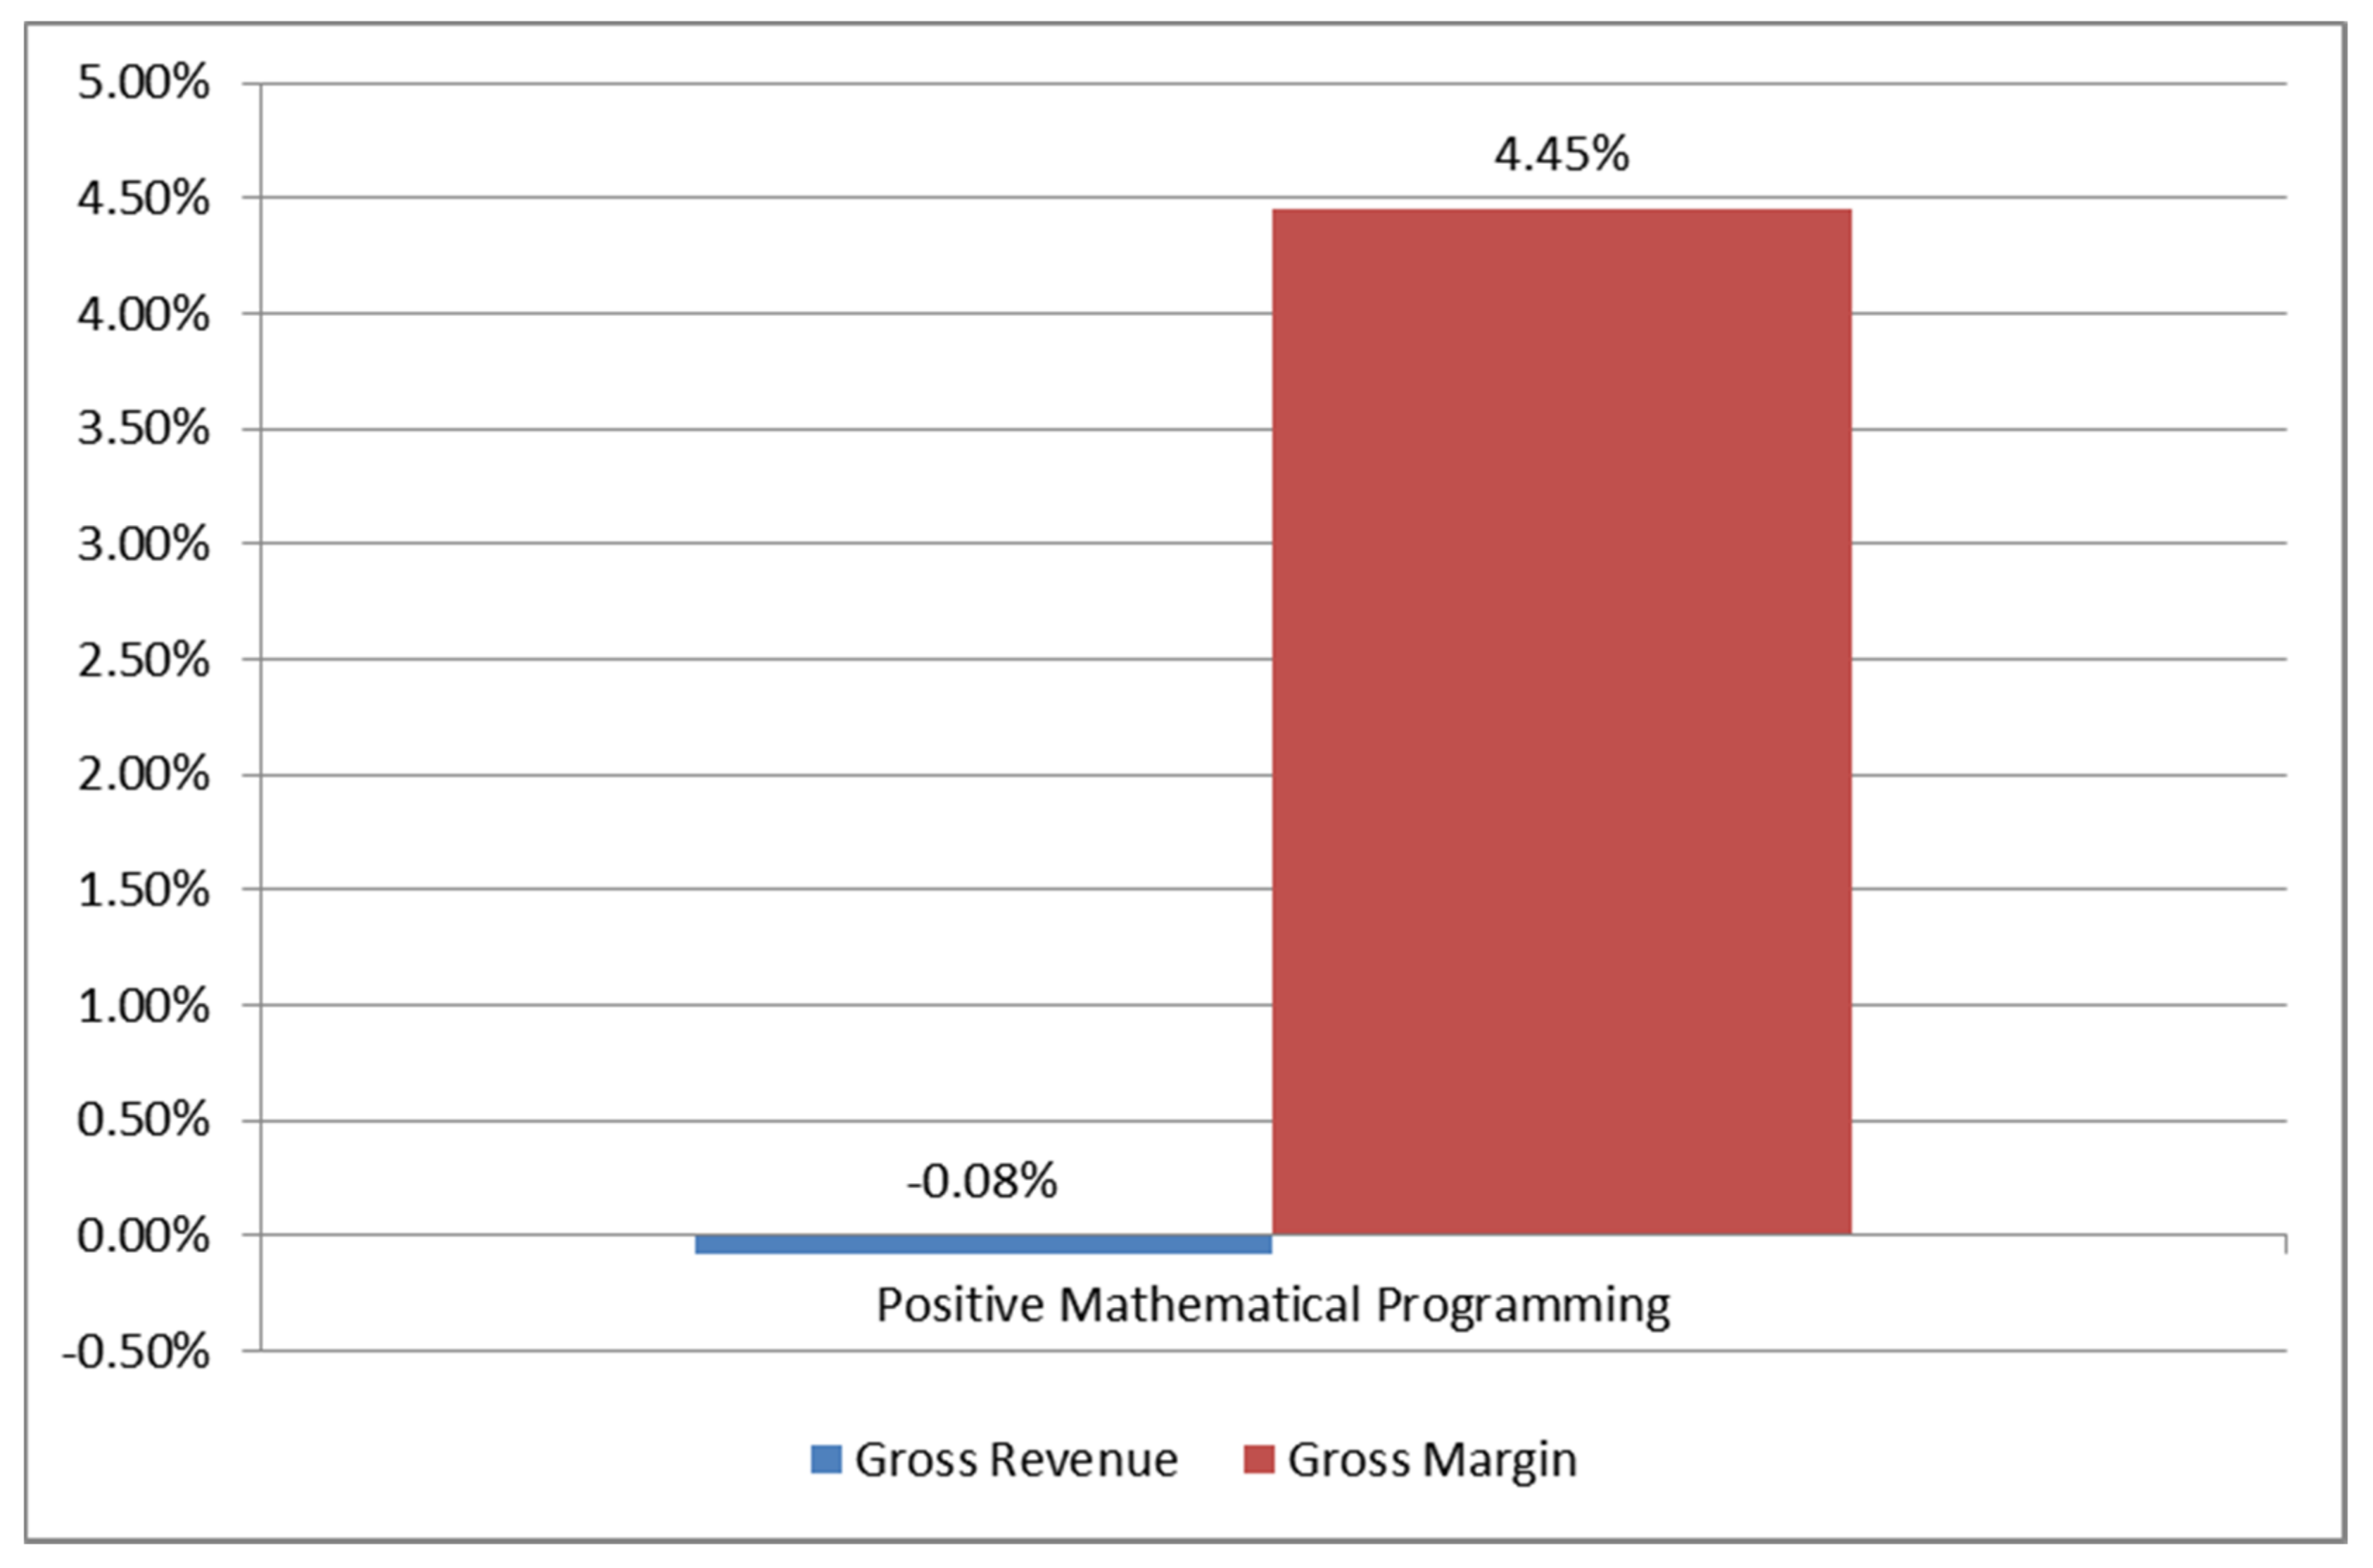
| Gross Revenue (€) | Gross Margin (€) | |
|---|---|---|
| Existent | 29,499.16 | 15,698.75 |
| PMP model | 29,474.66 | 16,398.07 |
| Deviation | −0.08% | 4.45% |
| Labor Use (h) | Annual Work Units (AWUs) | Seasonality (h/Month) | |
|---|---|---|---|
| Existent | 2714.98 | 1.55 | 226.25 |
| PMP model | 2612.72 | 1.49 | 217.73 |
| Deviation | −3.77% | −3.77% | −3.77% |
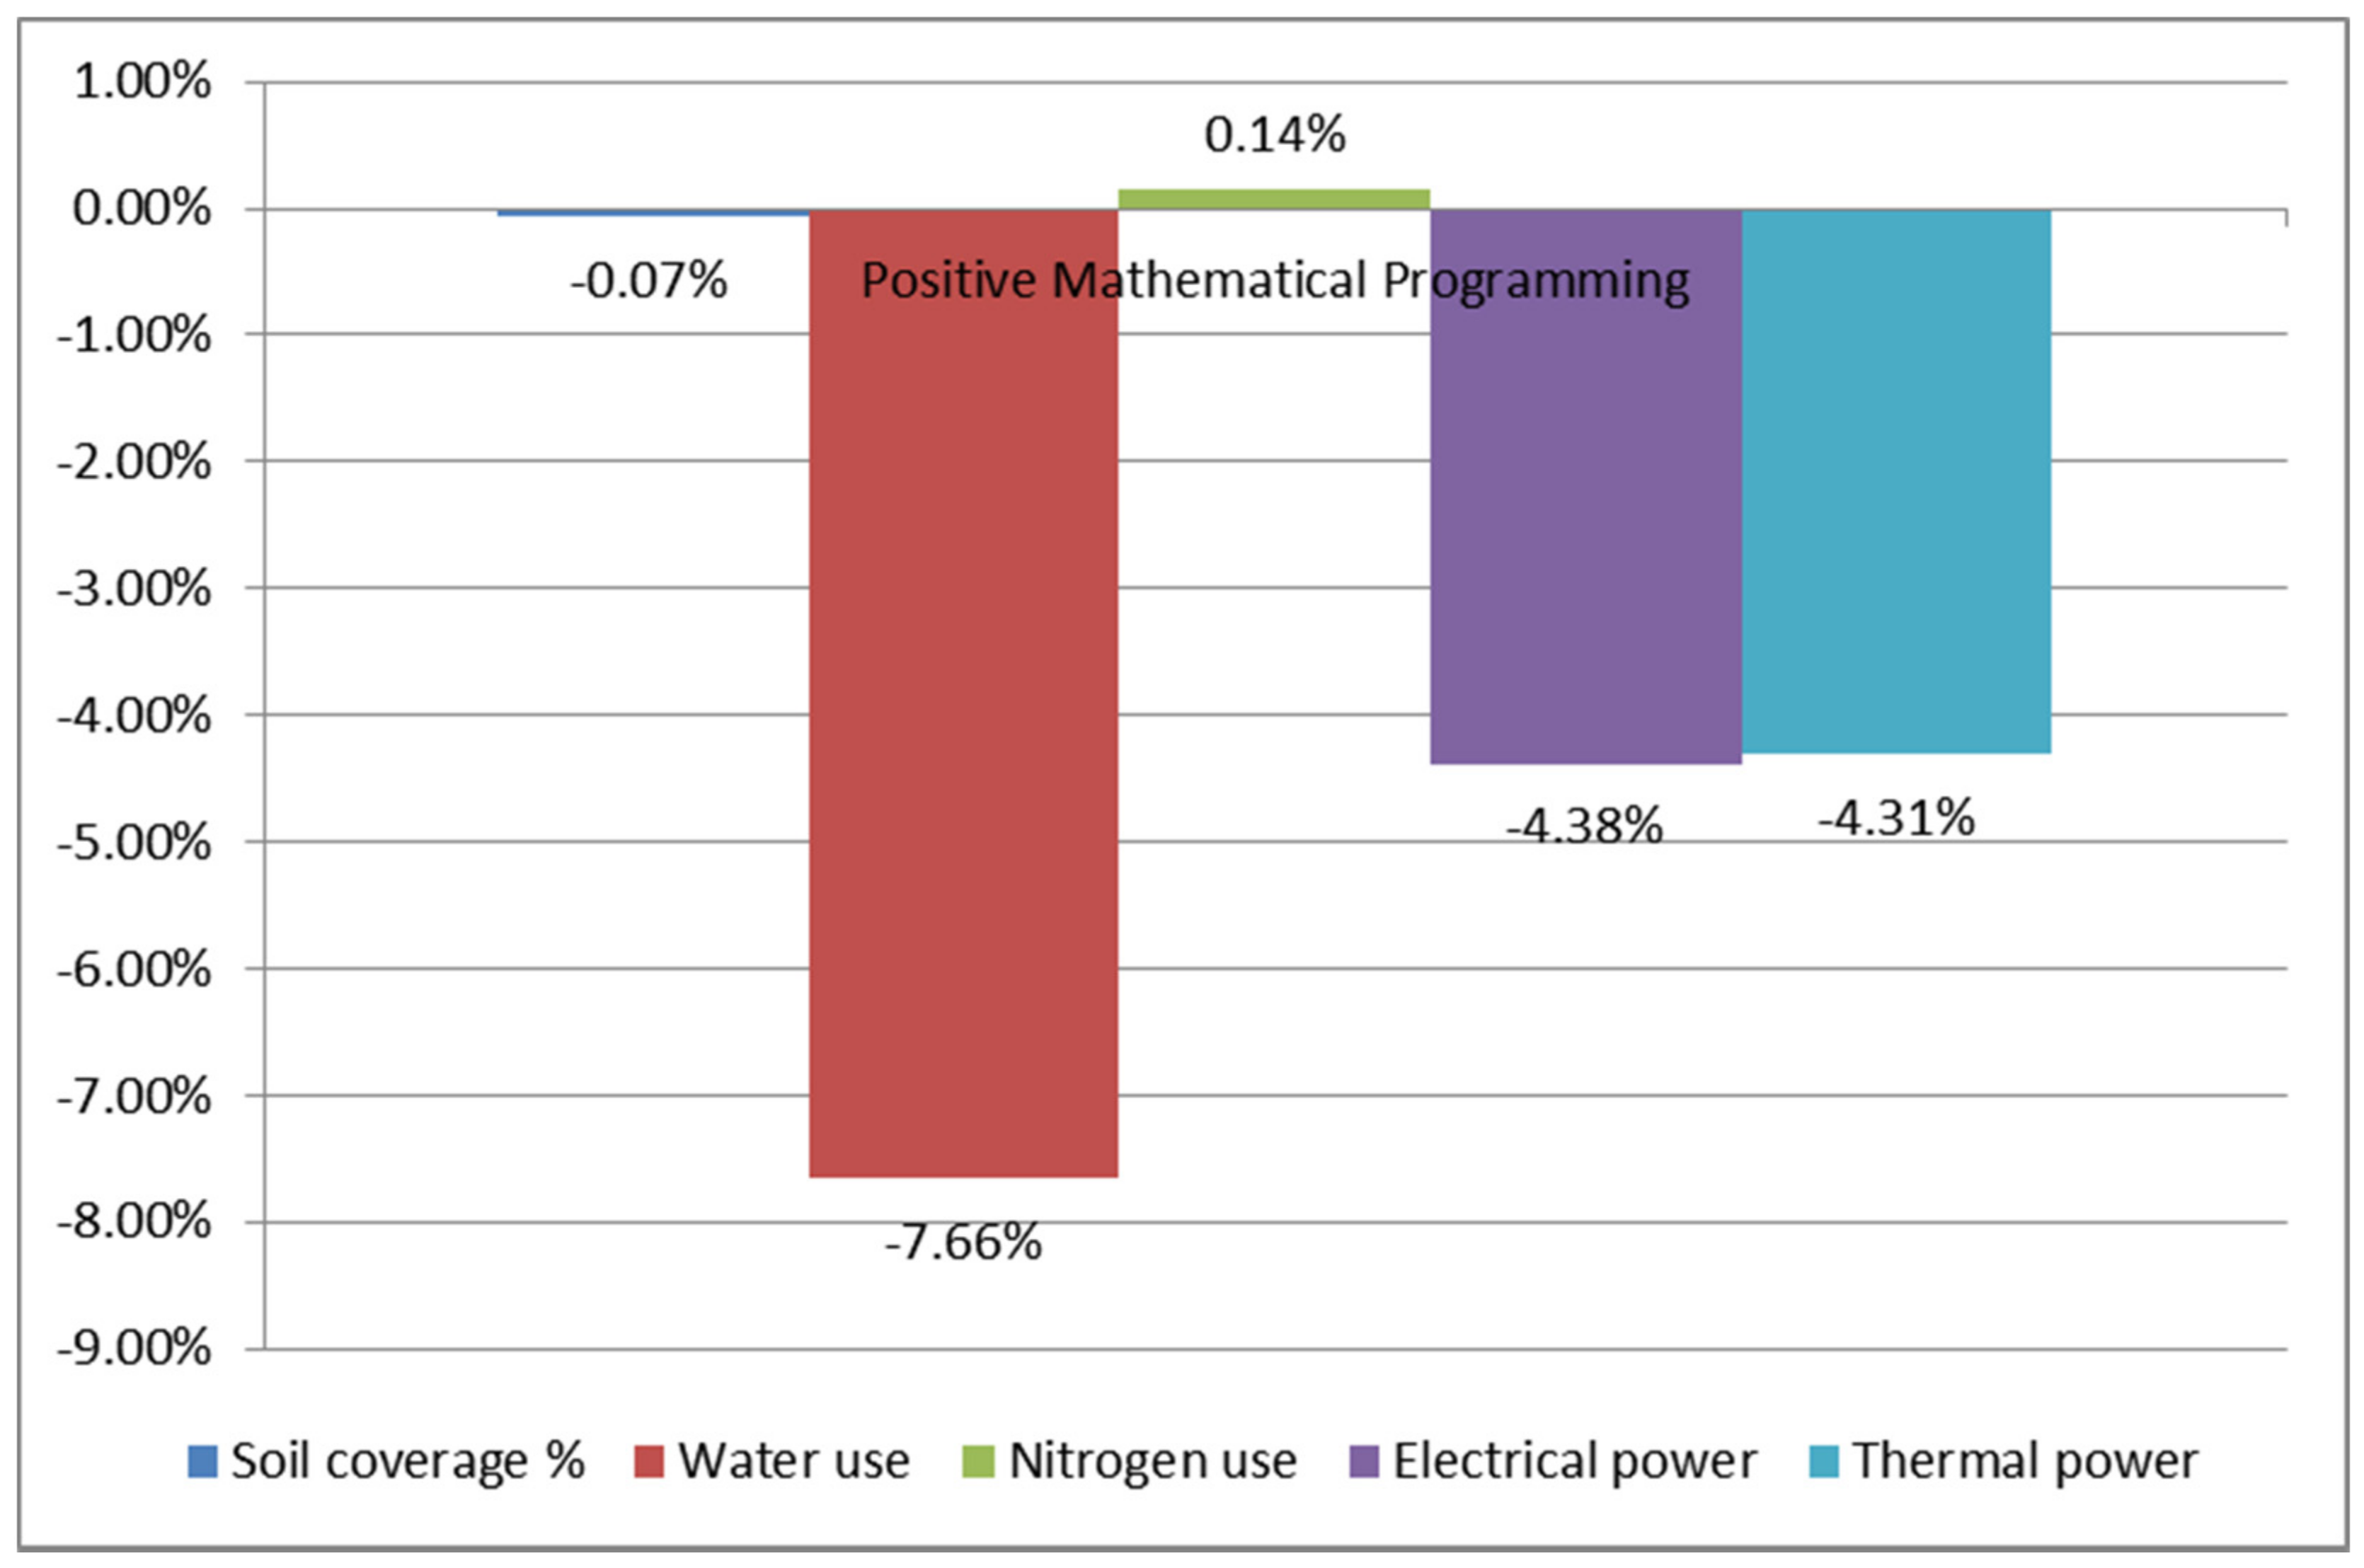
| Crop Diversity (Number of Crops Cultivated) | Soil Coverage (%) | Water Use (m3) | Nitrogen Use (kg) | Electrical Power (MWh) | Thermal Power (MWh) | |
|---|---|---|---|---|---|---|
| Existent | 17 | 74.84 | 38,435 | 6791.31 | 21.46 | 97.04 |
| PMP model | 16 | 74.79 | 35,491 | 6800.83 | 20.52 | 92.85 |
| Deviation | −1 | −0.07% | −7.66% | 0.14% | −4.38% | −4.31% |
Publisher’s Note: MDPI stays neutral with regard to jurisdictional claims in published maps and institutional affiliations. |
© 2021 by the authors. Licensee MDPI, Basel, Switzerland. This article is an open access article distributed under the terms and conditions of the Creative Commons Attribution (CC BY) license (https://creativecommons.org/licenses/by/4.0/).
Share and Cite
Moulogianni, C.; Bournaris, T. Assessing the Impacts of Rural Development Plan Measures on the Sustainability of Agricultural Holdings Using a PMP Model. Land 2021, 10, 446. https://doi.org/10.3390/land10050446
Moulogianni C, Bournaris T. Assessing the Impacts of Rural Development Plan Measures on the Sustainability of Agricultural Holdings Using a PMP Model. Land. 2021; 10(5):446. https://doi.org/10.3390/land10050446
Chicago/Turabian StyleMoulogianni, Christina, and Thomas Bournaris. 2021. "Assessing the Impacts of Rural Development Plan Measures on the Sustainability of Agricultural Holdings Using a PMP Model" Land 10, no. 5: 446. https://doi.org/10.3390/land10050446