Article

Could Air Quality Get Better during Epidemic Prevention and Control in China? An Analysis Based on Regression Discontinuity Design

School of Political Science and Public Administration, Shandong University, Qingdao 266237, China
*
Author to whom correspondence should be addressed.
Land 2021, 10(4), 373; https://doi.org/10.3390/land10040373
Submission received: 26 February 2021 / Revised: 28 March 2021 / Accepted: 31 March 2021 / Published: 4 April 2021
(This article belongs to the Special Issue Air Pollution in Urban Areas Impacts on Vegetation and Ecosystems)

Abstract

:
Though many scholars and practitioners are paying more attention to the health and life of the public after the COVID-19 outbreak, extant literature has so far failed to explore the variation of ambient air quality during this pandemic. The current study attempts to fill the gap by disentangling the causal effects of epidemic prevention on air quality in China, measured by the individual pollutant dimensionless index, from other confounding factors. Using the fixed effects model, this article finds that five air indicators, PM2.5, PM10, CO, NO2, and SO2, significantly improved during the shutdown period, with NO2 showing the most improvement. On the contrary, O3 shows an inverse pattern, that is, O3 gets worse unexpectedly. The positive impact of epidemic prevention on air quality, especially in terms of PM2.5, PM10, and NO2, become manifest five days after the resumption of labor, indicated by the result of a regression discontinuity design. These findings are still robust and consistent after the dataset of 2019 as a counterfactual sample is utilized. The findings of this paper make contributions to both environmental governance and pandemic prevention, with relevant guidelines regarding the health and life of the public and governmental behavioral management strategies discussed.

1. Introduction

At the end of 2019, an unexpected novel coronavirus, known as COVID-19, broke out and quickly spread around the world, both in developed and developing countries [1,2]. Its rapid infection rate has bestowed on the people of the world an enormous catastrophe. This is a new type of severe acute respiratory syndrome coronavirus, which is highly infectious and can spread rapidly. In the absence of adequate vaccination of the majority of the population, social distancing and lockdown of areas are deemed the only resultful solutions to contain the diffusion of COVID-19. In response to the threat caused by the pandemic, many countries have considered and implemented measures that restrict human mobility flow as their main means to prevent disease [3,4,5].
In order to stop the spread of COVID-19, the shutdown measures taken by the governments have had a serious impact on human activities and the economy [6]. The lockdown has been the strictest in time and space in the history of the world [7], compared with the temporary control measures taken during the meetings or major sports events in recent years. It has led to economic downturns and recessions [8], people’s purchase and consumption have been reduced, and isolation policies have led to a significant reduction in traffic travel. Therefore, emissions of environmental pollutants have reduced, and this seems to have led to cleaner air in cities and regions with polluted air, and scientists are trying to figure out why this is more evident in some places. Visually, the National Aeronautics and Space Administration (NASA) monitored the emissions of NO2 during two periods, one from January 1 to 20 and the other from February 10 to 25, and demonstrated that the air index was significantly reduced during the epidemic through simple comparative analysis, especially in China and northern Italy. These two countries were among the first to implement complete city closures due to COVID-19.
Empirical research conducted in the academic field, combined with satellite observations, found that global daily carbon dioxide emissions declined sharply and air pollution reduced during the pandemic and shutdown [9]. Xuelin Tian studied the changes in urban traffic volume and air pollutant concentration in Canada after the epidemic outbreak and found that both of them decreased simultaneously due to the lockdown policy, reaching the lowest level in April 2020 and rebounding in May 2020, but it still took a long time to recover to the level pre-pandemic [10]. To systematically study the extent to which strict lockdown period measures affect air quality is a unique opportunity. Hence, a growing number of researchers are trying to explore this topic, which was confirmed by other countries and territories, including Egypt [11], the US [12], India [13,14,15], Brazil [16], European counties [17,18,19], and other places [8] which have also confirmed changes in air pollution during the pandemic.
There has been research in the context of China where the change of air quality experienced a similar pattern. The Finnish Research Centre on Energy and Clean Air reported that measures taken in China to curb the spread of COVID-19 have resulted in a 25% reduction in CO2 emissions. Xu used air quality data from January to March 2017–2020 in three cities of China to examine the influences of epidemic prevention on the atmospheric environment, and found when the epidemic control initiatives were taken during February 2020, the concentrations of atmospheric PM2.5, PM10, SO2, CO, and NO2 were lower than that in February 2017–2019 [20]. The reduction in air pollutants is closely related to travel restrictions during the pandemic [21]. Le combined ground observation and satellite remote sensing data to study the changes in air quality during the epidemic period, and estimated that the reduction of pollutant concentration by control measures was up to 90% [22].
However, it is worth noting that the foregoing literature about the relationship between epidemic prevention and the environment has numerous drawbacks that need to be addressed. First of all, the Chinese mainland was the first major area where the outbreak of COVID-19, which began during the Chinese Lunar New Year, with two opposing mechanisms were formed to influence the quality of the atmosphere, increasing the complexity of environmental changes during epidemic prevention and control. Specifically, one is called the “holiday effect”, a reduction in pollutants emissions as a result of a plethora of factories getting closed and employees being on vacation during the Spring Festival [20]. However, according to Tan [23], China’s holiday is not alone in improving air quality during holidays, as Christmas also produces an analogous pattern of finer weather than during non-holidays [24]. The other is the “heating effect”, which generates unintended negative effects on ambient air quality. Drawing on an analysis of regression discontinuity design, Almond demonstrates that a collective heating plan adopted by northern cities increases the emission of suspended particulate matter [25]. It is further developed by the finding that the concentrations of air index in northern cities are higher than in southern cities [26].
Secondly, most conclusions that air quality could ameliorate during periods of containment of COVID-19 are presented in the form of a descriptive analysis of data, through a simple comparison of air indicators between the epidemic and non-epidemic period, but lacks empirical causal inference pursued by social science. Thirdly, some studies have shown that the variation in air quality can be explained by meteorological conditions of the corresponding day [27,28] and the air quality of the previous day, which needs further exploration.
In view of the various aspects of deficiencies in the extant literature, the current study utilizes the regulations of postponing the resumption of labor to February 10 for 24 provinces of China as an excellent opportunity to explore the effects of initiatives for preventing and controlling the epidemic on air quality at the national level, by the method of a regression discontinuity design, which is considered to be significant for causal inference. Specifically, February 10 is taken as the time discontinuity, and we construct two samples, namely, where those before that time-point are regarded as the control group, and those after that time-point as the experimental group, to tackle several questions: (1) Does a causal association exist between delaying the resumption of production and ambient air quality? (2) When can the positive impact of reducing air pollution become manifested? (3) What are the differences in magnitudes of the effects of epidemic prevention and control on improving different air indicators?

2. Materials and Methods

2.1. Data Collection

To ensure the accuracy and validity of the analysis, the dataset including relevant indicators of air quality used in this article comes from the World Air Quality Index Project (WAQIP) initiated and founded by several contributors from diversified fields comprising environmental science, systematic engineering, data science, and visual design in 2007, whose aim is to enhance air pollution awareness of global citizens and provide unified and world-wide air quality information for scholars, practitioners, and even the public. To date, this project supplies transparent air quality data for more than 100 countries, covering more than 30,000 stations in 1000 major cities via two websites. China owns 210 environmental monitoring stations that are included in this project. Additionally, WAQIP also provides an Open Data framework that comprises daily air monitoring data at the city level, which has been constantly updated since 2014.
The data on air quality are not the raw pollutant concentration, but are transformed into the Air Quality Index (AQI) of individual pollutant indicators through a specific computing method (Air Quality Historical Data Platform. https://aqicn.org/data-platform/register/, accessed on 25 February 2021). AQI is a nonlinear, dimensionless index that describes Air Quality quantitatively. The higher the value, the more serious the air pollution is, and the greater the harm to human health, so when we check the figures for PM2.5, they correspond to the PM2.5 individual AQI (noted as AQIPM2.5). Since the WAQIP only provides six air indicators without CO2, namely, PM2.5, PM10, NO2, SO2, CO, and O3, this paper also selects these six as the air quality measurement indicators. The time span of the historical air quality data available at the city level depends on the time of visiting the website. Daily urban air quality index data collected by this paper ranges from 1 January 2014 to 29 March 2020, covering 189 cities. Meteorological conditions of the corresponding day are also obtained as control variables from the weather posting website*, which are weather conditions mainly including minimum temperature, maximum temperature, windy weather, sunny and rainy conditions, and so forth. Because there are missing values in some cities, the number of air quality indicators is not consistent. The details are shown in Table 1.

2.2. Model Specification

The data used for the empirical analysis is in the form of a daily panel structure at the city level, to which the panel regression model should have been established. According to the Hausman test, the p-value is significant at the 1% level, which means the Fixed Effects model is more suitable when running panel data regression.
Considering the Fixed Effects model in panel regression:
Y i t = α i + ρ Y i , t 1 + β 1 shutdownperiod + β i X i t + ε i t ,
where i and t denote the city and year, respectively. Y i t is the dependent variable, representing the air quality index of multiple pollutants that comprise PM2.5, PM10, SO2, NO2, CO, and O3 of one city at time-point t. Since ambient air concentrations involve time correlation, to a certain degree, endogenous problems may arise. To avoid this, Y i , t 1 , the dependent variable with a lag of one day, should be included in the above equation, of which ρ is the coefficient needing to be estimated. The shutdown period is the core independent variable of interest in this paper, and β 1 is the estimated magnitude of the effect of postponing production on the air environment. The bold symbol X i t is a set of control variables, such as meteorological conditions, weekends, and holidays, while ε i t is the error term.
Although numerous variables that might impact air quality are controlled in the Fixed Effects model, there may still be problems with missing variables, such as pressure, due to limitations arising from data availability. In consideration of the fact that 24 provinces have set clear dates for resumption of work and the weather conditions within a few days before and after it, the time point is considered as having no significant difference, and the only difference is whether the production activities have taken place. Therefore, two periods before and after February 10 can be regarded as local randomization, and a regression discontinuity design can be utilized to identify the causality between the shutdown period and air quality.
The equation of regression discontinuity design is:
Y i t = α i + ρ Y i , t 1 + β 1 s d p e r i o d + γ 1 c u t i + γ 2 c u t i 2 + γ 3 c u t i 3 + β i X i + ε i t .
For one city whose subscript is i, the date of resumption of work is c u t i . The sdperiod (consistent with the shutdown period in the Fixed Effects model) is defined as the dummy variable; namely, if t c u t i , the sdperiod is coded as 0, and otherwise coded as 1. Binomials and trinomials corresponding to c u t i 2 and c u t i 3 in the above equation are further estimated, aiming to obtain a non-linear relationship. Other parts are in line with the fixed effects model.

2.3. Variables Specification

Air quality: In the current study, common indicators gauging air quality are collected, captured by particulate matter (including PM2.5 and PM10), carbon monoxide (CO), nitrogen dioxide (NO2), sulfur dioxide (SO2), and ozone (O3). The data form is not the original pollutant concentration, but the AQI of individual pollutants through a series of calculations. AQI is a dimensionless index, and its value ranges from 0 to 500 with the meaning that the bigger number represents the worse atmosphere quality. In the empirical analysis, we take the logarithm of AQI. For example, PM2.5 is marked as PM2.5(Log), as are other variables.
Shutdown period: We take February 10 prescribed by 24 provinces as time discontinuity (Seeing Figure 1 and Appendix A for details), to investigate whether there is a systematic difference in air quality within several days before and after that time-point. In China, the 30th day of the 12th month in the lunar calendar (24 January 2020) is viewed as the first day of the Spring Festival holiday, and so the time span ranging from January 24 to February 9 constructs the shutdown period influenced by the epidemic. As a result, the equilibrium sample in this paper, beginning from 7 January to 26 February 2020, is constructed for research needs. It includes 51 days for three periods, namely during the epidemic, before the shutdown, and after the resumption of work, comprising 17 days each, extracted from the original air quality data and meteorological data. The coding rule for the shutdown period variable is that the time period between January 24 and February 9 is assigned 1, and 0 for the remainder.
Meteorological conditions: Relevant indicators of weather conditions are collected as control variables, consisting of the daily minimum temperature, daily maximum temperature, windy weather, and sunny weather. Windy weather and sunny weather are dummy variables. Their coding rules are that the existence of wind on the corresponding day is coded as 1, otherwise coded as 0; sunny weather all day is coded as 1, otherwise coded as 0.
Other control variables: Primarily, the holiday effect and the weekend effect [29,30,31] are considered important predictors for variation in air quality as well. Aiming to disentangle the net effect of the shutdown period on air quality from other confounding factors that might derive from the above two effects, the paper constructs the holiday variable and weekend variable separately. Among them, in view of China’s State Council which extended the Spring Festival holiday, the period ranging from 24 January to 2 February is regarded as the Chinese Spring Festival holiday and coded as 1, while the remainder is coded 0. In addition, two holiday time-points, namely 8 and 14 February, which represent the Chinese Spring Lantern Festival and Valentine’s Day, respectively, are coded as 1, and the rest coded as 0. Due to the weekend effect, Saturday and Sunday are assigned as 1, and weekdays as 0. Frequencies and percentages for dummy variables, means, and standard deviations for continuous variables for the entire sample are reported in Table 1.

3. Results

3.1. Fixed Effects Regression Results

According to Table 2, there is a negative association between the shutdown period adopted by provincial governments and individual pollutant AQI except for O3, while controlling for the Chinese Spring Festival, meteorological conditions, and weekend and holiday effect, significant at the 0.01 level. To be more specific, each individual AQI confined to five pollutants except O3 in the shutdown period is lower than that in the non-shutdown period, meaning that the regulation of shutdown does have an important role in improving the air environment. From Models (1) to (5), there exists a positive impact of the initiative of shutdown on the air quality in terms of NO2, PM2.5, PM10, SO2, and CO, with the estimated coefficients of −0.178, −0.039, −0.103, −0.055, −0.037, respectively. In other words, compared with the non-shutdown period, the AQI of individual pollutants decreases by approximately 17.8%, 3.9%, 10.3%, 5.5%, and 3.7% during the shutdown period, respectively, with NO2 decreasing the most.
On the contrary, Model (6) reveals a counterintuitive phenomenon that O3 (ozone), a gaseous pollutant and major secondary photochemical oxidant, gets unexpectedly worse during the shutdown period; namely, the individual AQI of O3 increases by nearly 4.5%, which is in line with the empirical results from the research of Sicard et al. [32], who demonstrates that compared with the same period in 2017–2019, the average daily ozone concentration in the Nice, Rome, Turin, Valencia, and Wuhan urban stations increased by 24 percent, 14 percent, 27 percent, 2.4 percent, and 36 percent, respectively, in 2020 during the lockdown. O3 formation is a nonlinear function of nitrogen oxides (NOx) and the reactivity of gaseous organic molecules [33], which namely depends on the volatile organic carbon (VOC)-NOx ratio. The implementation of stringent lockdown measures reduced emissions of NOx more than VOCs, thereby increasing the VOCO-NOx ratio and thus increasing O3 production.
The negative influences of Spring Festival on air quality concentrate on four indicators of PM2.5, PM10, SO2, and O3 at a significant level of 0.01. Specifically, the individual AQI of PM2.5, PM10, SO2, and O3 increased by 9.2 percent, 3.5 percent, 3.7 percent, and 7.3 percent, respectively, which is attributed to the burning of fossil fuels for winter heating and where residents set off fireworks and firecrackers to celebrate Chinese New Year. In concordance with previous studies, various pollutants except for O3 significantly improve during vacations. Variation in air quality in terms of NO2, PM2.5, PM10, and CO between weekends and weekdays is quite predictable from the extant evidence. Moreover, there is a variation in pollutants’ AQI during windy weather, sunny weather, highest temperatures, and lowest temperatures on the significance level ranging from 0.1 to 0.01. Air pollutant indicators lagging behind by one day have a negative impact on the air quality of the corresponding day, holding other variables constant, with a significance level of 1%.

3.2. Regression Discontinuity Results
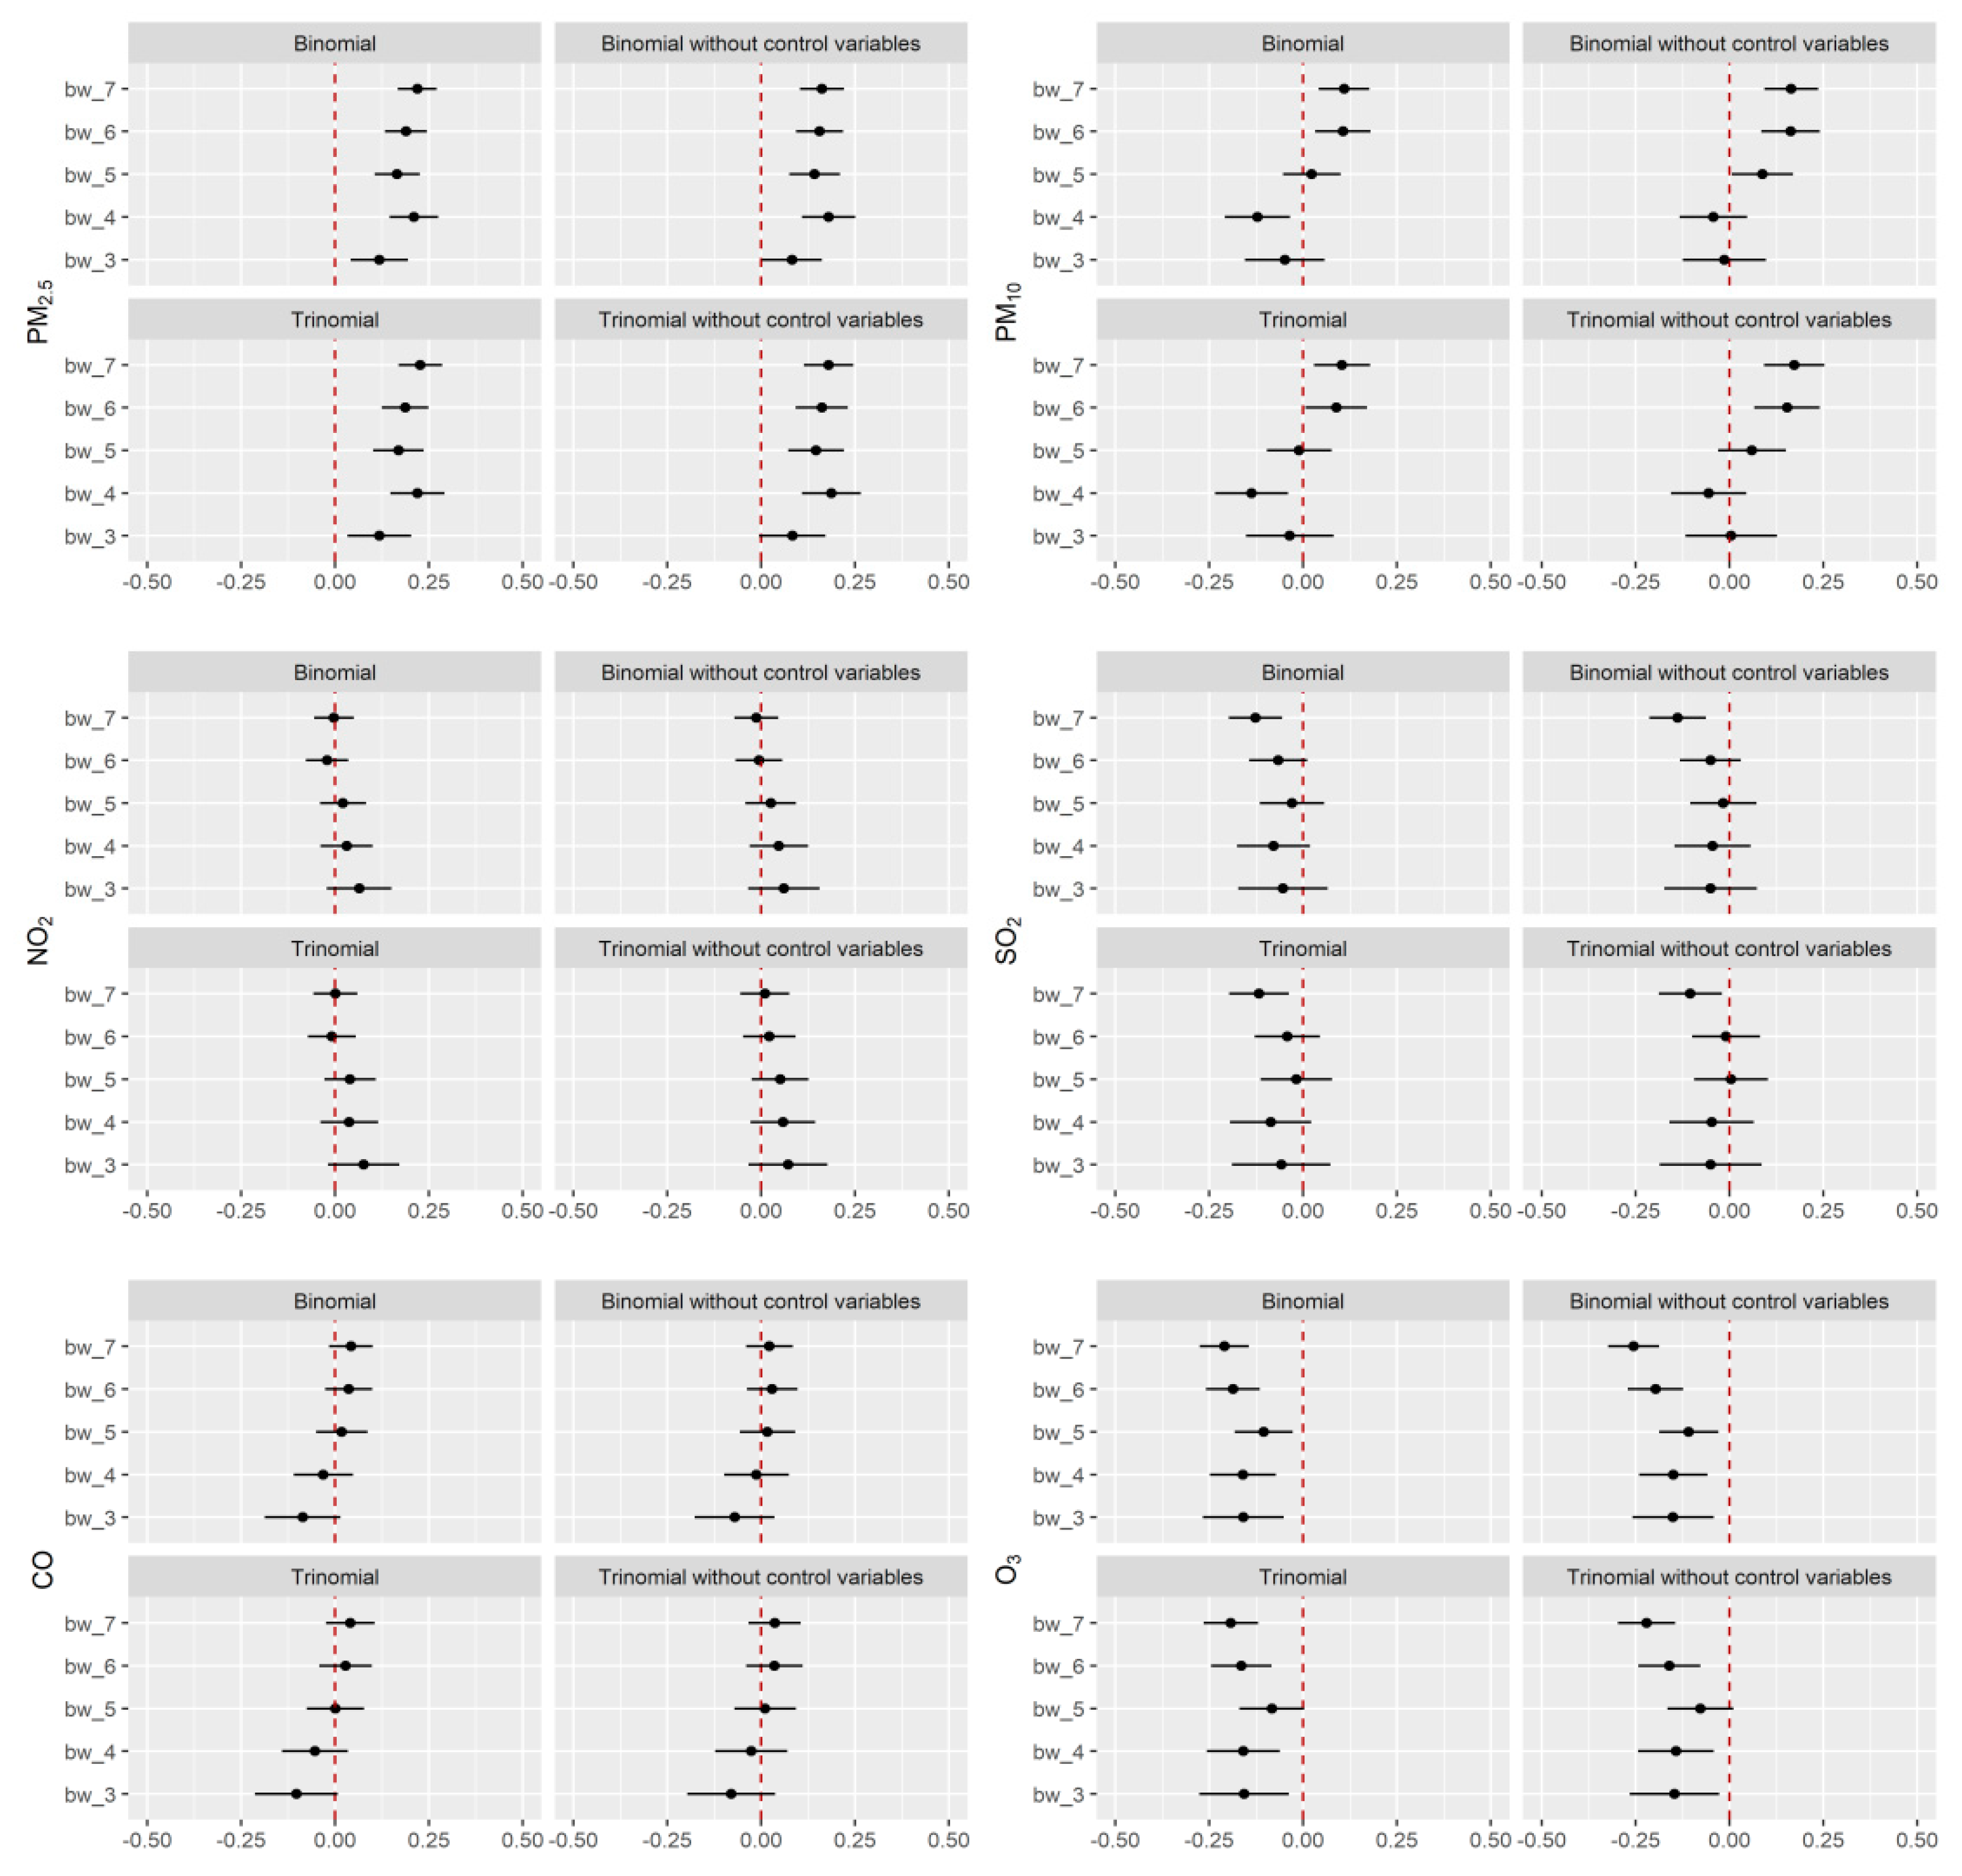
Regression discontinuity is designed based on the principle of local randomization, and this method generally utilizes the data near the discontinuity for analysis. For the sake of robustness, this research used three to seven days before and after the time-point of resumption of labor as the symmetric bandwidth, and then Fixed Effects models were estimated separately. When running a regression discontinuity design, a set of models are estimated based on various conditions that consist of binomials or trinomials, and include or exclude control variables to elicit every individual air indicator covering four different models. Results are shown in Table 3.
As is depicted in Table 3, when the bandwidth is three days, some pollutants, such as PM2.5, PM10, and NO2, improve, deriving from the shutdown period caused by epidemic prevention, with the evidence in Models (3), (4), (7), (8), and (11). Akin to the results of the Fixed Effects model, compared with the non-shutdown period, O3 is still deteriorating during the shutdown period, as revealed by Models (21) and (22). Furthermore, with the increment in the number of days of bandwidth, the effect of air improvement is beginning to manifest gradually, proved by some insignificant parameters becoming significant. Especially when the bandwidth is at least five days, all the models demonstrate that there is a positive association between the shutdown period and air quality in terms of PM2.5, PM10, and NO2, at the significance level of 0.01. Two other pollutant indicators, SO2 and CO, show a similar trend of improvement, with the results being not very robust. Moreover, O3 even appears to have conflicting coefficients in various models.

3.3. Robust Check

In order to obtain the robust parameter estimation, a robust check that acts as an important part in conducting regression discontinuity design was performed via applying the corresponding data of air quality and meteorological conditions for 2019. To be more precise, by utilizing the same regression discontinuity estimating method, the authors explored whether the positive effect of the shutdown period on air quality existed or not in 2019. If it did, the improvement of air quality during the shutdown period in 2020 was probably attributed to other complex factors, rather than delaying the resumption of work; otherwise, this effect is confirmed as robust and consistent. In consideration of the Spring Festival effect on atmospheric quality and the fact that Chinese citizens celebrate the Spring Festival according to the lunar calendar, we hence constructed a counterfactual sample of the same time-point, namely 21 February 2019 different from 10 February 2020, assumed as the date of resumption of work that did not occur, stipulated by 24 provinces in 2019 according to the Chinese lunar calendar, rather than the Gregorian calendar.
As depicted in Figure 2, the dots are estimated parameters, and the whiskers are 95% confidence intervals. The same bandwidth is selected from three to seven days, and estimates a set of models with or without control variables, conditional on binomials or trinomials. Overall, all six air pollutants displayed a substantially different changing trend in 2019, in contrast with 2020. Specifically, there is an inverse relationship between the individual AQI of PM2.5 and the shutdown period, meaning that PM2.5 gets worse during the supposed shutdown period in 2019. PM10 has also deteriorated, but this negative impact becomes manifest when the number of days for bandwidth is at least six days. Variation of NO2 and CO in 2019 seems not to be explained by the shutdown regulation from extant results. While SO2 begins to ameliorate only when the bandwidth is seven days, the changing trend of O3 is still a special phenomenon.

4. Discussion

This article expanded previous research on variations of air quality in shutdown periods by disentangling the causal effects between epidemic control and air quality from other confounding factors, including the holiday effect and winter heating, and so forth. Using the Fixed Effects model, the result indicates that air quality during the shutdown period improved significantly compared with the non-shutdown period, and the positive effects, especially for PM2.5, PM10, and NO2 become manifest gradually on the fifth day after the resumption of labor, which is revealed by regression discontinuity design. We also conducted a robust check underlying a counterfactual framework based on the data of 2019. The result was further confirmed and is still robust and consistent.
It is well-known that the generation of air pollutants is inseparable from human economic activities. Atmospheric particulate matter is a kind of mixture which includes PM2.5 and PM10 [20]. PM10 mainly comes from industrial exhaust emissions, fossil fuel combustion, and motor vehicle exhaust and dust entrainment [34]. In addition to natural causes, man-made SO2 stems from the burning of coal, oil, and chemical fuels [35]. Fueling combustion, automobile exhaust emissions, and other incomplete combustion activities are the main sources of CO [20]. NO2 mainly comes from high-temperature combustion of fossil fuels, thermal power generation, industrial emissions, and automobile exhaust gas [36]. Due to the rapid development of industries in recent decades, power plant emissions, industrial waste gas, fossil fuel combustion, and other indirect causes have increased environmental O3 pollution [37]. Hence, after city lockdowns came into effect, jurisdictional boundaries were closed, residents were confined to their homes, and non-essential travel in local urban areas was prohibited [6], and the reduction in human-related activities led to an improvement in air quality, which is the most meaningful conclusion of this paper. Of course, this finding is mirrored in many countries around the world [10,38], both in developed and developing countries, also including China, which causes this research result not only to have regional significance, but also global significance. In fact, the decline of human activity will not have an immediate impact on the environment; that is, there is a lag effect on the improvement of air quality, which is rarely discussed in existing studies. This paper found that improvements in PM2.5, PM10, and NO2 began to be highlighted after the fifth day, which enriches the relevant studies in the field of environment.
It should be pointed out that this study was conducted based on 24 provinces in China. Due to the vast territory of China, there is a great gap among provinces in terms of economic structure and development mode. Some coastal areas depend on frontier trade, while those inland tend to have more animal husbandry, mining, or smelting industries. Studies have demonstrated that the lockdown effect is more pronounced in areas with a higher degree of industrialization [39]. Regrettably, heterogeneity between provinces was not taken into account, which is necessary for the in-depth investigation of the relationship between epidemic prevention and control and the environment.
Research findings made in this paper have numerous implications for environmental protection, especially for air quality and shutdown periods, and even apply to other countries with similar institutional arrangements and cultural traditions around the world. First, the environmental condition has been greatly damaged due to an extensive mode of economic development. Therefore, governments in China now shift their focus from economic growth to paying more attention to serious environmental problems; for example, much capital, human resources, and equipment are invested into environmental governance. This regulation of postponing the date of resuming labor, on the one hand, reflects the decline in economic activities indirectly, while on the other hand, it provides an excellent opportunity for confirming the negative association between economic development and air quality, which is of great significance for the rational arrangement of the government’s attention. Second, poor air quality can threaten people’s life and health as COVID-19 does, and even takes more lives. Furthermore, there is a relationship to a certain degree between the environment and the spread of COVID-19. Considering these above-mentioned aspects, air quality ought to draw the attention of multiple levels of Chinese governments who cannot afford to ignore environmental problems while striving to curb the transmission of COVID-19. Third, environmental issues should be linked with epidemic prevention in China and other countries that are confronted with similar air pollution conditions. It is an important part of human rights, since everyone has the right to live in a healthy environment, which can be improved by governmental efforts.

5. Conclusions

While COVID-19 is creating much chaos for human socioeconomic activities and public health, for the environment we live in, especially the air quality, it is a reprieve. Facing confirmed cases and deaths increasing day by day, China, the early epicenter of the COVID-19 pandemic, has imposed a series of lockdown measures on a third of its cities in order to reduce the spread and impact of the virus [39]. Many air pollution studies show that human-related activities, such as industrial production [40], transportation, and so forth [41,42] are the main sources of air pollution, and extreme measures of complete or partial lockdown may bring these production and consumption activities to a near standstill. Hence, the reduction in human activities caused by the epidemic provides an opportunity to verify the impact of human activities on the environment.
This paper attempted to investigate whether the air quality will change significantly due to the regulation of postponing the date of resumption of production prescribed by 24 provinces, using various statistical models. The result of the fixed effects model concludes that shutdowns exerted a significant positive impact on the air quality, indicated by PM2.5, PM10, NO2, SO2, and CO levels, while O3 showed an inverse pattern in that this air indicator did not improve. Furthermore, the positive effects of postponing the date of resuming work began to show up five days later, especially for the three indicators of PM2.5, PM10, and NO2, revealed by regression discontinuity. The results of this article are still robust and consistent by using the data of 2019 to conduct a robust check. These findings call for policy action at a national and local level to enhance the degree of public health and life. For instance, the government should balance the relationship between curbing the epidemic, environmental protection, and improving public health. In addition, due to the complex relationship between O3 and other pollutants, effective treatment of O3 is also an important issue in the process of environmental governance.

Author Contributions

Conceptualization, X.Z. and Z.C.; methodology, X.Z.; software, X.Z.; validation, Z.C., C.J. and X.Z.; formal analysis, X.Z. and Z.C.; investigation, Z.C.; resources, Z.C.; data curation, X.Z.; writing—original draft preparation, X.Z.; writing—review and editing, Z.C.; visualization, X.Z.; supervision, Z.C.; project administration, X.Z., Z.C. and C.J. All authors have read and agreed to the published version of the manuscript.

Funding

This research received no external funding.

Institutional Review Board Statement

Not applicable.

Informed Consent Statement

Not applicable.

Data Availability Statement

The data presented in this study are available on request from World Air Quality Index Project and Tianqihoubao. Available online: http://www.tianqihoubao.com/ (accessed on 25 February 2021).

Acknowledgments

We express sincere thanks to the World Air Quality Index Project for the provision of the free and open datasets.

Conflicts of Interest

The authors declare no conflict of interest.

Appendix A

Circular of the General Office of the Chinese State Council on extending the 2020 Spring Festival holiday. Available online: http://www.gov.cn/zhengce/content/2020-01/27/content_5472352.htm (accessed on 25 May 2020).
Circular of the Government of Qinghai Province of China (No.6). Available online: http://www.qh.gov.cn/zwgk/system/2020/02/01/010350751.shtml (accessed on 25 May 2020).
Notice of Hainan Province on Delay of Enterprise Resuming to Work and School Opening. Available online: http://www.hainan.gov.cn/hainan/szfbgtwj/202002/5818f41129b54ea9a42c8a4a6d4cfb97.shtml (accessed on 25 May 2020).
Notice of Sichuan Province on Delay of Enterprise Resuming to Work and School Opening. Available online: http://www.sc.gov.cn/zcwj/xxgk/NewT.aspx?i=20200201185233-251329-00-000 (accessed on 25 May 2020).
Notice of Jiangsu Province on Delay of Work Resumption. Available online: http://www.jiangsu.gov.cn/art/2020/1/29/art_60095_8957083.html (accessed on 25 May 2020).
Notice of Shandong Province on Delay of Enterprise Resuming to Work and School Opening. Available online: http://hrss.shandong.gov.cn/articles/ch00422/202001/fa93f347-49e1-4299-81fb-fb3e24fe0df2.shtml (accessed on 25 May 2020).
Notice of Hebei Province on the postponement of the resumption of work and business of enterprises. Available online: http://www.hebei.gov.cn//hebei/11937442/10761139/14817722/index.html (accessed on 25 May 2020).
Notice of Shanxi Province on Delay of Enterprise Resuming to Work and School Opening. Available online: http://www.shanxi.gov.cn/sxszfxxgk/sxsrmzfzcbm/sxszfbgt/flfg_7203/bgtgfxwj_7206/202003/t20200320_780977.shtml (accessed on 25 May 2020).
Notice of Liaoning Province on Delay of Enterprise Resuming to Work and School Opening. Available online: http://www.ln.gov.cn/zfxx/jrln/wzxx2018/202001/t20200131_3731012.html. (accessed on 25 May 2020).
Notice of Jilin Province on Postponing the Resumption of Work of Enterprises, the Opening of Schools and the Implementation of Flexible Working System in Administrative Institutions. Available online: http://www.jl.gov.cn/szfzt/jlzxd/tzgg/sj/202002/t20200211_6835461.html. (accessed on 25 May 2020).
Notice of Heilongjiang Province Postpone the Resumption of Work until February 9. Available online: http://www.hlj.gov.cn/zwfb/system/2020/01/30/010918737.shtml (accessed on 25 May 2020).
Notice of Zhejiang Province on Delay of Enterprise Resuming to Work and School Opening. Available online: http://www.zj.gov.cn/art/2020/1/27/art_1554467_41858317.html (accessed on 25 May 2020).
Notice of Anhui Province on Delay of Enterprise Resuming to Work and School Opening. Available online: http://www.ah.gov.cn/public/1681/8257661.html (accessed on 25 May 2020).
Notice of Fujian Province on Delay of Enterprise Resuming to Work and School Opening. Available online: http://www.fujian.gov.cn/xw/fjyw/202001/t20200129_5186811.htm (accessed on 25 May 2020).
Notice of Jiangxi Province on the postponement of enterprise resumption of work. Available online: http://www.jiangxi.gov.cn/art/2020/1/30/art_393_1494174.html (accessed on 25 May 2020).
Notice of Resumption of work in Henan Province. Available online: https://www.henan.gov.cn/2020/01-31/1285868.html (accessed on 25 May 2020).
Notice of Hubei Province Headquarters for Prevention and Control of Novel Coronavirus Infection Pneumonia. Available online: http://www.hubei.gov.cn/zhuanti/2020/gzxxgzbd/qfqk/202002/t20200214_2027194.shtml (accessed on 25 May 2020).
Notice on the Delay of Enterprise Resumption and School Opening in Hunan Province. Available online: http://www.hunan.gov.cn/hnszf/xxgk/tzgg/swszf/202001/t20200131_11166850.html (accessed on 25 May 2020).
Notice of Guangdong Province on Delay of Enterprise Resuming to Work and School Opening. Available online: http://www.gd.gov.cn/gkmlpt/content/2/2879/post_2879851.html#43 (accessed on 25 May 2020).
Notice of Guizhou Province on Delay of Enterprise Resuming to Work. Available online: http://www.guizhou.gov.cn/xwdt/gzyw/202001/t20200131_46273051.html (accessed on 25 May 2020).
Notice on Delay of Enterprise Resumption and School Opening in Yunnan Province. Available online: http://www.yn.gov.cn/ztgg/yqfk/lflk/202001/t20200129_187777.html (accessed on 25 May 2020).
Notice of Shaanxi Province on Resuming Work. Available online: http://www.shaanxi.gov.cn/sxxw/sxyw/159959.htm (accessed on 25 May 2020).
Notice of Beijing Municipal People’s Government on Flexible Work Arrangement of Enterprises in Beijing during the Prevention and Control Period of Novel Coronavirus Infected Pneumonia. Available online: http://www.beijing.gov.cn/zhengce/zhengcefagui/202001/t20200131_1622070.html (accessed on 25 May 2020).
Notice of Tianjin Municipality on Delay of Enterprise Resuming to Work and School Opening. Available online: http://www.tj.gov.cn/wz/hygq/202002/t20200201_3668408.html (accessed on 25 May 2020).
Notice on the Delay of the Return of Enterprises to Work and the Opening of Schools in Shanghai Municipality. Available online: http://www.shanhai.gov.cn/nw2/nw2314/nw2319/nw12344/u26aw63451.html (accessed on 25 May 2020).
Notice of Chongqing Municipality on Delaying the Return of Work of Enterprises. Available online: http://www.cq.gov.cn/zwgk/fdzdgknr/lzyj/qtgw/202002/t20200219_5273467.html (accessed on 25 May 2020).
Notice of Inner Mongolia Autonomous Region on Delaying the Return of Work of Enterprises, the Opening of Schools and the Implementation of Flexible Work in Administrative Institutions. Available online: http://www.nmg.gov.cn/art/2020/1/30/art_4260_297868.html (accessed on 25 May 2020).
Notice of Delay the Opening of Schools and Resume Work of Enterprises in Guangxi Autonomous Region. Available online: http://www.gxzf.gov.cn/gxyw/20200201-793228.shtml (accessed on 25 May 2020).
Notice of Tianjin Ningxia Autonomous Region on Delay of Enterprise Resuming to Work and School Opening. Available online: http://www.nx.gov.cn/zwxx_11337/wztt/202002/t20200201_1938104.html (accessed on 25 May 2020).
Notice of Xinjiang Autonomous Region on Delay of Enterprise Resuming to Work and School Opening. Available online: http://www.xinjiang.gov.cn/xinjiang/c100225/202001/adfc27c5f8e0410ba53506ba958cd02d.shtml (accessed on 25 May 2020).

References

  1. Chan, J.F.-W.; Yuan, S.; Kok, K.-H.; To, K.K.-W.; Chu, H.; Yang, J.; Xing, F.; Liu, J.; Yip, C.C.-Y.; Poon, R.W.-S. A familial cluster of pneumonia associated with the 2019 novel coronavirus indicating person-to-person transmission: A study of a family cluster. Lancet 2020, 395, 514–523. [Google Scholar] [CrossRef] [Green Version]
  2. Gautam, S.; Hens, L. SARS-CoV-2 pandemic in India: What might we expect? Environ. Dev. Sustain. 2020, 1–3. [Google Scholar] [CrossRef] [PubMed] [Green Version]
  3. Bajardi, P.; Poletto, C.; Ramasco, J.J.; Tizzoni, M.; Colizza, V.; Vespignani, A. Human mobility networks, travel restrictions, and the global spread of 2009 H1N1 pandemic. PLoS ONE 2011, 6, e16591. [Google Scholar] [CrossRef] [Green Version]
  4. Charu, V.; Zeger, S.; Gog, J.; Bjørnstad, O.N.; Kissler, S.; Simonsen, L.; Grenfell, B.T.; Viboud, C. Human mobility and the spatial transmission of influenza in the United States. PLoS Comput. Biol. 2017, 13, e1005382. [Google Scholar] [CrossRef] [PubMed] [Green Version]
  5. Wang, Q.; Taylor, J.E. Patterns and limitations of urban human mobility resilience under the influence of multiple types of natural disaster. PLoS ONE 2016, 11, e0147299. [Google Scholar]
  6. Diffenbaugh, N.S.; Field, C.B.; Appel, E.A.; Azevedo, I.L.; Baldocchi, D.D.; Burke, M.; Burney, J.A.; Ciais, P.; Davis, S.J.; Fiore, A.M. The COVID-19 lockdowns: A window into the Earth System. Nat. Rev. Earth Environ. 2020, 1, 470–481. [Google Scholar] [CrossRef]
  7. Fang, H.; Wang, L.; Yang, Y. Human mobility restrictions and the spread of the novel coronavirus (2019-ncov) in China. J. Public Econ. 2020, 191, 104272. [Google Scholar] [CrossRef] [PubMed]
  8. Venter, Z.S.; Aunan, K.; Chowdhury, S.; Lelieveld, J. COVID-19 lockdowns cause global air pollution declines with implications for public health risk. medRxiv 2020, 117, 18984–18990. [Google Scholar] [CrossRef] [Green Version]
  9. Le Quéré, C.; Jackson, R.B.; Jones, M.W.; Smith, A.J.; Abernethy, S.; Andrew, R.M.; De-Gol, A.J.; Willis, D.R.; Shan, Y.; Canadell, J.G. Temporary reduction in daily global CO2 emissions during the COVID-19 forced confinement. Nat. Clim. Chang. 2020, 10, 647–653. [Google Scholar] [CrossRef]
  10. Tian, X.; An, C.; Chen, Z.; Tian, Z. Assessing the impact of COVID-19 pandemic on urban transportation and air quality in Canada. Sci. Total Environ. 2021, 765, 144270. [Google Scholar] [CrossRef] [PubMed]
  11. Mostafa, M.K.; Gamal, G.; Wafiq, A. The impact of COVID 19 on air pollution levels and other environmental indicators-A case study of Egypt. J. Environ. Manag. 2021, 277, 111496. [Google Scholar] [CrossRef] [PubMed]
  12. Liu, Q.; Harris, J.T.; Chiu, L.S.; Sun, D.; Houser, P.R.; Yu, M.; Duffy, D.Q.; Little, M.M.; Yang, C. Spatiotemporal impacts of COVID-19 on air pollution in California, USA. Sci. Total Environ. 2021, 750, 141592. [Google Scholar] [CrossRef] [PubMed]
  13. Sharma, S.; Zhang, M.; Gao, J.; Zhang, H.; Kota, S.H. Effect of restricted emissions during COVID-19 on air quality in India. Sci. Total Environ. 2020, 728, 138878. [Google Scholar] [CrossRef] [PubMed]
  14. Gautam, S. The influence of COVID-19 on air quality in India: A boon or inutile. Bull. Environ. Contam. Toxicol. 2020, 104, 724–726. [Google Scholar] [CrossRef] [PubMed]
  15. Gupta, N.; Tomar, A.; Kumar, V. The effect of COVID-19 lockdown on the air environment in India. Glob. J. Environ. Sci. Manag. 2020, 6, 31–40. [Google Scholar]
  16. Dantas, G.; Siciliano, B.; França, B.B.; da Silva, C.M.; Arbilla, G. The impact of COVID-19 partial lockdown on the air quality of the city of Rio de Janeiro, Brazil. Sci. Total Environ. 2020, 729, 139085. [Google Scholar] [CrossRef]
  17. Bassani, C.; Vichi, F.; Esposito, G.; Montagnoli, M.; Giusto, M.; Ianniello, A. Nitrogen dioxide reductions from satellite and surface observations during COVID-19 mitigation in Rome (Italy). Environ. Sci. Pollut. Res. 2021, 1–24. [Google Scholar] [CrossRef]
  18. Tobías, A.; Carnerero, C.; Reche, C.; Massagué, J.; Via, M.; Minguillón, M.C.; Alastuey, A.; Querol, X. Changes in air quality during the lockdown in Barcelona (Spain) one month into the SARS-CoV-2 epidemic. Sci. Total Environ. 2020, 726, 138540. [Google Scholar] [CrossRef]
  19. Gautam, S. COVID-19: Air pollution remains low as people stay at home. Air Qual. Atmos. Health 2020, 13, 853–857. [Google Scholar] [CrossRef]
  20. Xu, K.; Cui, K.; Young, L.-H.; Hsieh, Y.-K.; Wang, Y.-F.; Zhang, J.; Wan, S. Impact of the COVID-19 event on air quality in central China. Aerosol Air Qual. Res. 2020, 20, 915–929. [Google Scholar] [CrossRef] [Green Version]
  21. Bao, R.; Zhang, A. Does lockdown reduce air pollution? Evidence from 44 cities in northern China. Sci. Total Environ. 2020, 731, 139052. [Google Scholar] [CrossRef]
  22. Le, T.; Wang, Y.; Liu, L.; Yang, J.; Yung, Y.L.; Li, G.; Seinfeld, J.H. Unexpected air pollution with marked emission reductions during the COVID-19 outbreak in China. Science 2020, 369, 702–706. [Google Scholar] [CrossRef] [PubMed]
  23. Tan, P.-H.; Chou, C.; Liang, J.-Y.; Chou, C.C.-K.; Shiu, C.-J. Air pollution “holiday effect” resulting from the Chinese New Year. Atmos. Environ. 2009, 43, 2114–2124. [Google Scholar] [CrossRef]
  24. Latha, K.M.; Highwood, E. Studies on particulate matter (PM10) and its precursors over urban environment of Reading, UK. J. Quant. Spectrosc. Radiat. Transf. 2006, 101, 367–379. [Google Scholar] [CrossRef]
  25. Almond, D.; Chen, Y.; Greenstone, M.; Li, H. Winter heating or clean air? Unintended impacts of China’s Huai river policy. Am. Econ. Rev. 2009, 99, 184–190. [Google Scholar] [CrossRef] [Green Version]
  26. Zhou, M.; He, G.; Liu, Y.; Yin, P.; Li, Y.; Kan, H.; Fan, M.; Xue, A.; Fan, M. The associations between ambient air pollution and adult respiratory mortality in 32 major Chinese cities, 2006–2010. Environ. Res. 2015, 137, 278–286. [Google Scholar] [CrossRef] [PubMed]
  27. Zhao, Y.; Zhang, K.; Xu, X.; Shen, H.; Zhu, X.; Zhang, Y.; Hu, Y.; Shen, G. Substantial changes in nitrogen dioxide and ozone after excluding meteorological impacts during the COVID-19 outbreak in mainland China. Environ. Sci. Technol. Lett. 2020, 7, 402–408. [Google Scholar] [CrossRef]
  28. Xing, J.; Zhang, Y.; Wang, S.; Liu, X.; Cheng, S.; Zhang, Q.; Chen, Y.; Streets, D.G.; Jang, C.; Hao, J. Modeling study on the air quality impacts from emission reductions and atypical meteorological conditions during the 2008 Beijing Olympics. Atmos. Environ. 2011, 45, 1786–1798. [Google Scholar] [CrossRef]
  29. Braniš, M.; Řezáčová, P.; Domasová, M. The effect of outdoor air and indoor human activity on mass concentrations of PM10, PM2. 5, and PM1 in a classroom. Environ. Res. 2005, 99, 143–149. [Google Scholar] [CrossRef] [PubMed]
  30. Morawska, L.; Jayaratne, E.; Mengersen, K.; Jamriska, M.; Thomas, S. Differences in airborne particle and gaseous concentrations in urban air between weekdays and weekends. Atmos. Environ. 2002, 36, 4375–4383. [Google Scholar] [CrossRef] [Green Version]
  31. Riga-Karandinos, A.; Saitanis, C.; Arapis, G. Study of the weekday-weekend variation of air pollutants in a typical Mediterranean coastal town. Int. J. Environ. Pollut. 2006, 27, 300–312. [Google Scholar] [CrossRef]
  32. Sicard, P.; De Marco, A.; Agathokleous, E.; Feng, Z.; Xu, X.; Paoletti, E.; Rodriguez, J.J.D.; Calatayud, V. Amplified ozone pollution in cities during the COVID-19 lockdown. Sci. Total Environ. 2020, 735, 139542. [Google Scholar] [CrossRef] [PubMed]
  33. Pusede, S.; Cohen, R. On the observed response of ozone to NO x and VOC reactivity reductions in San Joaquin Valley California 1995–present. Atmos. Chem. Phys. 2012, 12, 8323–8339. [Google Scholar] [CrossRef] [Green Version]
  34. Kong, S.; Ji, Y.; Lu, B.; Chen, L.; Han, B.; Li, Z.; Bai, Z. Characterization of PM10 source profiles for fugitive dust in Fushun-a city famous for coal. Atmos. Environ. 2011, 45, 5351–5365. [Google Scholar] [CrossRef]
  35. Kato, S.; Shiobara, Y.; Uchiyama, K.; Miura, K.; Okochi, H.; Kobayashi, H.; Hatakeyama, S. Atmospheric CO, O3, and SO2 Measurements at the Summit of Mt. Fuji during the Summer of 2013. Aerosol Air Qual. Res. 2016, 16, 2368–2377. [Google Scholar] [CrossRef] [Green Version]
  36. Jaeglé, L.; Steinberger, L.; Martin, R.V.; Chance, K. Global partitioning of NOx sources using satellite observations: Relative roles of fossil fuel combustion, biomass burning and soil emissions. Faraday Discuss. 2005, 130, 407–423. [Google Scholar] [CrossRef]
  37. Ryerson, T.; Trainer, M.; Holloway, J.; Parrish, D.; Huey, L.; Sueper, D.; Frost, G.; Donnelly, S.; Schauffler, S.; Atlas, E. Observations of ozone formation in power plant plumes and implications for ozone control strategies. Science 2001, 292, 719–723. [Google Scholar] [CrossRef] [Green Version]
  38. Singh, V.; Singh, S.; Biswal, A.; Kesarkar, A.P.; Mor, S.; Ravindra, K. Diurnal and temporal changes in air pollution during COVID-19 strict lockdown over different regions of India. Environ. Pollut. 2020, 266, 115368. [Google Scholar] [CrossRef] [PubMed]
  39. He, G.; Pan, Y.; Tanaka, T. The short-term impacts of COVID-19 lockdown on urban air pollution in China. Nat. Sustain. 2020, 3, 1005–1011. [Google Scholar] [CrossRef]
  40. Cole, M.A.; Elliott, R.J.; Shimamoto, K. Industrial characteristics, environmental regulations and air pollution: An analysis of the UK manufacturing sector. J. Environ. Econ. Manag. 2005, 50, 121–143. [Google Scholar] [CrossRef]
  41. Chen, D.; Liu, X.; Lang, J.; Zhou, Y.; Wei, L.; Wang, X.; Guo, X. Estimating the contribution of regional transport to PM2. 5 air pollution in a rural area on the North China Plain. Sci. Total Environ. 2017, 583, 280–291. [Google Scholar] [CrossRef] [PubMed]
  42. Fu, S.; Gu, Y. Highway toll and air pollution: Evidence from Chinese cities. J. Environ. Econ. Manag. 2017, 83, 32–49. [Google Scholar] [CrossRef] [Green Version]
Figure 1. Resumption of labor in Chinese provinces.
Land 10 00373 g001
Figure 2. Robust check.
Land 10 00373 g002
Table 1. Variables description.
VariableNMeanSt. Dev.MinMax
PM2.5(Log)96174.7510.4792.0796.51
NO2(Log)96142.3770.69704.205
PM10(Log)95873.9460.5950.6936.477
SO2(Log)95761.6850.85104.234
CO(Log)87292.1310.52504.5
O3(Log)87773.420.38104.913
Shutdown period96210.3340.47201
Cut9621−9.02214.71−3416
Spring Festival96210.1960.39701
Windy weather96210.8330.37301
Sunny weather96210.2510.43301
Weekend96210.1570.36401
Holiday96210.0390.19401
High temperature96219.338.573−2032
Low temperature96210.4269.68−3323
PM2.5(Log) (lag 1)94284.740.4852.0796.51
NO2(Log) (lag 1)94272.3880.69904.205
PM10(Log) (lag 1)93993.9430.60.6936.477
SO2(Log) (lag 1)93891.6880.85204.234
CO(Log) (lag 1)85582.1390.52204.5
O3(Log) (lag 1)86093.4120.38504.913
Table 2. Fixed Effects model.
Dependent Variables
(1)(2)(3)(4)(5)(6)
NO2(Log)PM2.5(Log)PM10(Log)SO2(Log)CO(Log)O3(Log)
Shutdown period−0.178 ***−0.039 ***−0.103 ***−0.055 ***−0.037 ***0.045 ***
(0.012)(0.010)(0.012)(0.012)(0.011)(0.010)
Spring Festival−0.0140.092 ***0.035 ***0.037 ***0.0200.073 ***
(0.013)(0.011)(0.013)(0.014)(0.013)(0.011)
Weekend−0.072 ***−0.086 ***−0.062 ***0.004−0.057 ***0.064 ***
(0.010)(0.009)(0.011)(0.011)(0.010)(0.009)
Holiday−0.140 ***−0.112 ***−0.185 ***−0.080 ***−0.091 ***0.041 **
(0.019)(0.017)(0.020)(0.021)(0.018)(0.017)
Windy weather−0.083 ***−0.118 ***−0.044 **−0.013−0.069 ***0.039 **
(0.018)(0.017)(0.019)(0.020)(0.017)(0.016)
Sunny weather0.133 ***−0.032 ***0.073 ***0.089 ***0.056 ***0.076 ***
(0.009)(0.009)(0.010)(0.010)(0.010)(0.008)
High temperature−0.005 ***0.016 ***0.003 *0.004 ***−0.002 *0.014 ***
(0.001)(0.001)(0.001)(0.001)(0.001)(0.001)
Low temperature−0.015 ***−0.011 ***−0.016 ***−0.022 ***−0.005 ***−0.010 ***
(0.002)(0.001)(0.002)(0.002)(0.002)(0.001)
NO2(Log) (lag 1)0.675 ***
(0.007)
PM2.5(Log) (lag 1) 0.536 ***
(0.008)
PM10(Log) (lag 1) 0.574 ***
(0.009)
SO2(Log) (lag 1) 0.494 ***
(0.009)
CO(Log)(lag 1) 0.588 ***
(0.009)
O3(Log) (lag 1) 0.477 ***
(0.011)
Observations942096179373935585418583
R *0.5950.3470.3760.2990.3630.349
Adjusted R *0.5860.3330.3630.2840.3500.335
Note: * p < 0.1 ** p < 0.05 *** p < 0.01.
Table 3. Regression discontinuity design.
Dependent Variables
PM2.5(Log)PM10(Log)NO2(Log)
(1)(2)(3)(4)(5)(6)(7)(8)(9)(10)(11)(12)
Bandwidth 3
Sdperiod0.0003−0.008−0.079 **−0.069 **−0.001−0.032−0.100 **−0.068 *−0.0070.040−0.139 ***−0.061
(0.031)(0.030)(0.036)(0.034)(0.037)(0.035)(0.043)(0.040)(0.037)(0.035)(0.044)(0.040)
Bandwidth 4
Sdperiod−0.047 *−0.032−0.143 ***−0.125 ***−0.029−0.053−0.261 ***−0.238 ***−0.160 ***−0.075 **−0.337 ***−0.211 ***
(0.026)(0.025)(0.032)(0.029)(0.034)(0.034)(0.043)(0.041)(0.038)(0.035)(0.049)(0.044)
Bandwidth 5
Sdperiod−0.182 ***−0.071 ***−0.247 ***−0.152 ***−0.152 ***−0.114 ***−0.385 ***−0.278 ***−0.261 ***−0.114 ***−0.503 ***−0.274 ***
(0.026)(0.024)(0.034)(0.030)(0.031)(0.032)(0.044)(0.041)(0.036)(0.033)(0.050)(0.042)
Bandwidth 6
Sdperiod−0.328 ***−0.065 ***−0.348 ***−0.130 ***−0.195 ***−0.109 ***−0.419 ***−0.231 ***−0.308 ***−0.108 ***−0.555 ***−0.254 ***
(0.026)(0.024)(0.037)(0.030)(0.031)(0.032)(0.044)(0.040)(0.034)(0.032)(0.048)(0.040)
Bandwidth 7
Sdperiod−0.435 ***−0.071 ***−0.419 ***−0.083 ***−0.171 ***−0.086 ***−0.387 ***−0.188 ***−0.271 ***−0.064 **−0.474 ***−0.173 ***
(0.026)(0.025)(0.037)(0.030)(0.030)(0.033)(0.041)(0.039)(0.033)(0.033)(0.044)(0.038)
Polynomialbinomialbinomialtrinomialtrinomialbinomialbinomialtrinomialtrinomialbinomialbinomialtrinomialtrinomial
Control variablesexcludedincludedexcludedincludedexcludedincludedexcludedincludedexcludedincludedexcludedincluded
Lag order111111111111
SO2(Log)CO(Log)O3(Log)
(13)(14)(15)(16)(17)(18)(19)(20)(21)(22)(23)(24)
Bandwidth 3
Sdperiod0.0550.036−0.075−0.0450.0090.003−0.022−0.0100.089 ***0.072 **−0.005−0.004
(0.041)(0.042)(0.049)(0.049)(0.033)(0.032)(0.038)(0.036)(0.031)(0.032)(0.036)(0.036)
Bandwidth 4
Sdperiod−0.025−0.005−0.268 ***−0.188 ***−0.097 ***−0.084 ***−0.206 ***−0.173 ***0.0290.034−0.139 ***−0.111 ***
(0.039)(0.039)(0.050)(0.048)(0.034)(0.032)(0.042)(0.039)(0.028)(0.028)(0.036)(0.034)
Bandwidth 5
Sdperiod−0.0420.002−0.307 ***−0.177 ***−0.155 ***−0.073 **−0.339 ***−0.216 ***0.0360.066 **−0.114 ***−0.058 *
(0.037)(0.037)(0.048)(0.045)(0.032)(0.030)(0.043)(0.037)(0.026)(0.026)(0.033)(0.031)
Bandwidth 6
Sdperiod−0.0100.016−0.234 ***−0.113 ***−0.188 ***−0.040−0.386 ***−0.194 ***0.041 *0.080 ***−0.0450.005
(0.034)(0.035)(0.045)(0.042)(0.031)(0.029)(0.042)(0.035)(0.024)(0.025)(0.031)(0.030)
Bandwidth 7
Sdperiod0.0340.033−0.131 ***−0.033−0.200 ***−0.025−0.361 ***−0.111 ***0.046 **0.080 ***0.0320.055 **
(0.032)(0.033)(0.041)(0.039)(0.028)(0.028)(0.039)(0.033)(0.023)(0.023)(0.029)(0.028)
PolynomialbinomialbinomialtrinomialTrinomialbinomialbinomialtrinomialtrinomialbinomialbinomialtrinomialtrinomial
Control variablesexcludedincludedexcludedIncludedexcludedincludedexcludedincludedexcludedincludedexcludedincluded
Lag order111111111111
Note: * p < 0.1 ** p < 0.05 *** p < 0.01.
Publisher’s Note: MDPI stays neutral with regard to jurisdictional claims in published maps and institutional affiliations.

