Article

Predicting Shifts in Land Suitability for Maize Cultivation Worldwide Due to Climate Change: A Modeling Approach

1
Faculty of Geographical Science, Beijing Normal University, Beijing 100875, China
2
Key Laboratory of Environmental Change and Natural Disaster of Ministry of Education, Beijing Normal University, Beijing 100875, China
3
The Frederick S. Pardee Center for the Study of the Longer-Range Future, Boston University, Boston, MA 02215, USA
4
Academy of Plateau Science and Sustainability, Xining 810008, China
5
School of Geographic Science, Qinghai Normal University, Xining 810008, China
*
Author to whom correspondence should be addressed.
Land 2021, 10(3), 295; https://doi.org/10.3390/land10030295
Submission received: 10 February 2021 / Revised: 3 March 2021 / Accepted: 9 March 2021 / Published: 13 March 2021
(This article belongs to the Special Issue Land Use and Climate Change)

Abstract

:
Suitable land is an important prerequisite for crop cultivation and, given the prospect of climate change, it is essential to assess such suitability to minimize crop production risks and to ensure food security. Although a variety of methods to assess the suitability are available, a comprehensive, objective, and large-scale screening of environmental variables that influence the results—and therefore their accuracy—of these methods has rarely been explored. An approach to the selection of such variables is proposed and the criteria established for large-scale assessment of land, based on big data, for its suitability to maize (Zea mays L.) cultivation as a case study. The predicted suitability matched the past distribution of maize with an overall accuracy of 79% and a Kappa coefficient of 0.72. The land suitability for maize is likely to decrease markedly at low latitudes and even at mid latitudes. The total area suitable for maize globally and in most major maize-producing countries will decrease, the decrease being particularly steep in those regions optimally suited for maize at present. Compared with earlier research, the method proposed in the present paper is simple yet objective, comprehensive, and reliable for large-scale assessment. The findings of the study highlight the necessity of adopting relevant strategies to cope with the adverse impacts of climate change.

1. Introduction

The impact of climate change on land use is widely acknowledged: by changing the suitability of lands for different crops from the current pattern and thus the area under different crops, climate change poses a threat to food security [1,2,3]. Although the land suitability for crop cultivation (denoted as ‘suitability’) is projected to increase at higher altitudes in the northern hemisphere and to decrease mainly in the tropical regions [4], the academic community is yet to reach any consensus on the extent and pattern of global changes. The differences are partly because the current methods of assessment have proved inadequate, which makes it imperative to develop a method that can accurately predict the suitability globally—predictions that are vital to ensuring food security, adapting to climate change, and mitigating its adverse effects.
Land suitability is a measure of how well the properties of a given piece of land satisfy the requirements of a particular land use form [5]. At present, the methods applied to assess the suitability can be classified into two based on the approach, namely those based on the Food and Agriculture Organization (FAO) land-evaluation approach and those based on the species distribution modeling approach. Taking the limiting factor as a principle, the FAO approach [5], which is also the most widely used, seeks to assess suitability by matching land attributes or properties to the requirements of specific crops. This approach uses the evaluation criteria based on crop requirements as applicable to local conditions by means of empirical analyses [6], literature review [7,8], expert knowledge [9,10], etc. Technically, considering land suitability analysis as a problem of multicriterion evaluation with an explicit spatial dimension, geographic information systems integrated with multi-criteria analysis have been used extensively to improve the evaluation by making it more efficient and accurate and also by mapping the land to show its suitability to different crops [11,12,13]. Although the FAO approach has become the standard for land evaluation on local, national, or regional scales, the method requires explicit and predetermined evaluation criteria. However, the criteria obtained through the means mentioned above are generally applicable only locally and also subjective, making generalizations on a larger scale less dependable. For a global study, therefore, establishing appropriate criteria for assessing suitability poses a challenge.
As an alternative to the FAO approach, species distribution models (SDMs), originally used in ecology and conservation, have recently been applied to modeling the land suitability for agriculture [14]. Based on correlations between known geo-referenced crop locations and data on environmental variables, SDMs can characterize a given environment in terms of its fit with crop requirements and project such suitable conditions into environmental scenarios at different times to model current and future suitability [15]. The approach based on SDMs has been applied successfully in several assessments including those for maize [15,16,17] and wheat [18,19,20]. Nevertheless, the use of SDMs is considered inherently risky and limited [21], beset with such problems as appropriate selection of the environmental variables that serve as inputs for the models. More specifically, ensuring the functional relevance and completeness of the variables and dealing with correlated variables are some of the key steps in good modeling practice [22]. However, these problems have often been overlooked by the relevant studies, which have simply used the same influencing variables as revealed in earlier research. This choice not only affects the application of SDMs to large-scale studies but leads to overfitting and misrepresentation of the potential distribution of the crops in question [23].
Overall, one of the most critical shortcomings of research on this topic so far, regardless of the differences between the two approaches, is lack of rigor and objectivity in selecting the environmental variables either to establish the appropriate criteria as required by the FAO approach or to obtain the desired level of performance from the SDM approach—putting a question mark over the reliability of the assessment. The need for an alternative method thus becomes especially urgent for large-scale research, in which local knowledge of crop requirements is no longer sufficient.
In addition, it should be noted that in the context of climate change, existing studies mostly focus on climate-associated suitability, namely the potential for crop growth under given climatic conditions, but ignore the effects of nonclimatic factors [24,25]. However, soil quality and topographic characteristics are equally important in determining land suitability [26]. For example, on a regional scale, soil fertility can limit suitability even more than climate can, and incorporating soil-related parameters has made the modeling of suitability more reliable [27]. Generally, it is the combination of major environmental factors including climate, soil, and terrain that allows specific crops to be grown in a given area [28].
Therefore, it is particularly important to take into account both climatic and nonclimatic factors and select the critical ones objectively for a comprehensive and accurate assessment of suitability, especially on a global scale.
As one of the world’s most important staple foods, maize (Zea mays L.) sustains millions of people worldwide [29] and is equally susceptible to the effects of climate change. Taking maize as the test case, the present study sought to fill the aforementioned research gaps by proposing a simple yet effective approach to large-scale assessment of suitability and applying it to assess the suitability as affected by multiple climate scenarios comprehensively and on a global scale.

2. Materials and Methods

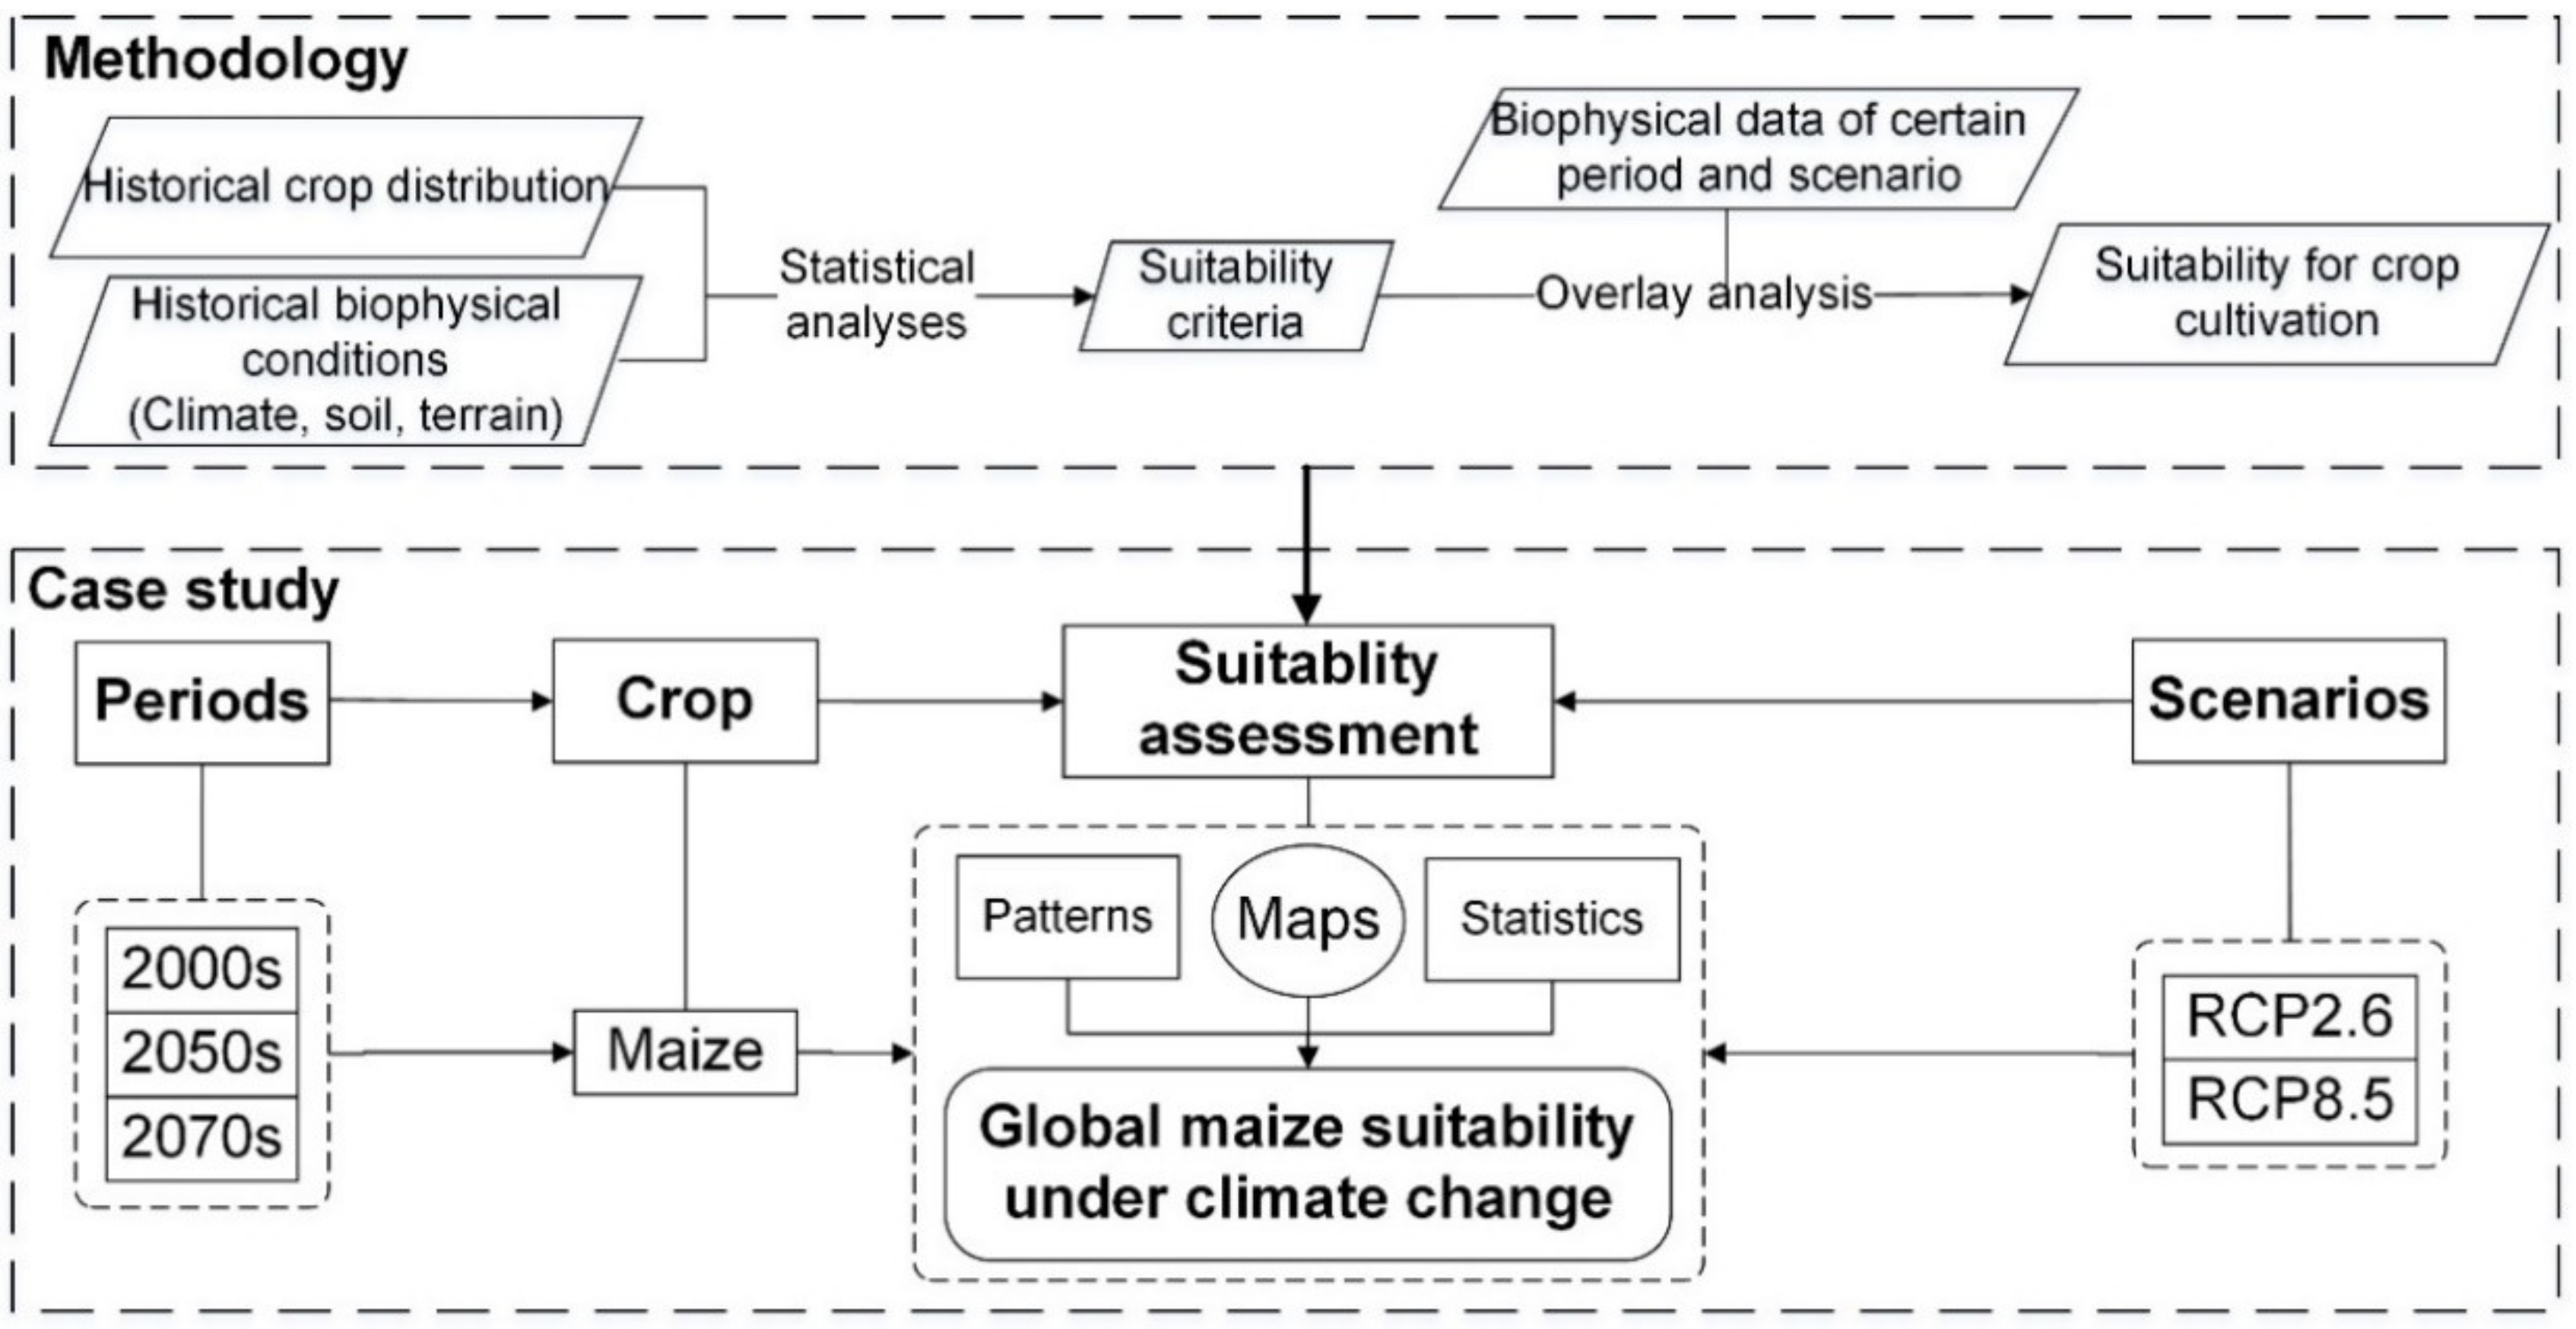
2.1. Basic Idea and Research Framework

As mentioned above, the core of any accurate and large-scale assessment of suitability is objective selection of influencing variables and further construction of appropriate assessment criteria. The suitability of a given site or parcel of land (a specific grid cell) for a given crop can then be assessed by matching such criteria with the environmental conditions at the given cell. To achieve this goal, four basic hypotheses are put forward.
Hypothesis 1.
Numeric methods can be applied to explore the relationships between existing environmental conditions and crop distribution and, in turn, to help in establishing suitable criteria.
Hypothesis 2.
A grid should be considered suitable for a crop only when every crucial environmental variable is favorable, and less suitable even if a single variable is unfavorable.
Hypothesis 3.
On a large scale, three types of environmental variables—climate, soil, and terrain—are adequate to determine suitability (only these variables are considered in the present study).
Hypothesis 4.
In developing and applying the criteria, regional differences in the physical requirements of various crop cultivars grown worldwide or potential changes in a crop’s requirements due to varietal improvement can be ignored.
Each of the four hypotheses are discussed in turn in the following paragraphs.
Hypothesis 1: Criteria for assessing suitability are in essence the characterization of corresponding relationships between influencing factors and the degree of suitability. On a large scale, alternative methods are required to design such criteria objectively instead of simply relying on empirical analyses or expert knowledge. We therefore hypothesize that numeric methods can be applied to explore the relationships between existing environmental conditions and crop distribution and, in turn, to help in establishing suitable criteria. This should be reasonable if the sample size is large enough, according to the large sample theory [30], and feasible, given the availability of high-resolution global datasets together with more sophisticated techniques of data analysis. In the present study, we use multiple crop distribution records and dozens of environmental variables. The construction of criteria is described in Section 2.3, which involves generating data on actual crop distribution (Section 2.3.1), selecting crucial influencing variables (Section 2.3.2), and setting appropriate thresholds for the chosen variables (Section 2.3.3).
Hypothesis 2: With the established criteria, the assessment becomes a question of finally determining the extent of suitability of a specific area or region as affected by the chosen environmental variables. Inspired by Liebig’s law of the minimum that emphasizes the decisive effect of the scarcest resource (limiting factor) on crop growth [31], we assume that a grid should be considered suitable for a crop only when every crucial environmental variable is favorable, and less suitable even if a single variable is unfavorable. The application of this principle to suitability assessment is described in Section 2.4.
Hypothesis 3: Suitability is influenced by both physical and socioeconomic factors [5]. However, on a large scale, it is the combination of environmental factors including the terrain, climate, and soil that allows specific crops to be cultivated in a given area. The majority of crops are grown on land with a moderate slope as well as favorable temperature, precipitation, and soil conditions [28]. Therefore, we hypothesize that on a large scale three types of environmental variables—climate, soil, and terrain—are adequate to determine suitability, and only these variables are considered in this study. The limitations of this assumption are discussed in Section 4.3.
Hypothesis 4: It should be noted that in this study we propose a single set of universal criteria for global and past-to-future assessment of suitability; in other words, in designing and applying the criteria (Section 2.3 and Section 2.4) we ignore regional differences in the physical requirements of various crop cultivars grown worldwide [32] or potential changes in a crop’s requirements due to varietal improvement [33,34]. Besides, when developing the criteria, we simply used maize distribution data and no use was made of yield data on maize. The reasons and limitations of doing so are discussed in Section 4.3.
With maize chosen for the case study, the suitability is assessed in two general steps: (1) establish the criteria for global assessment of suitability of maize based on statistical analyses of past data on the distribution of maize and environmental data, involving selection of critical variables and variable threshold setting (see Section 2.3 for details), and (2) assess the past and future suitability by combining these criteria with the data on the environmental variables during three chosen periods and under two scenarios based on representative concentration pathways (RCPs; see Section 2.4 for details). The research framework is shown in Figure 1.

2.2. Data Sources

Maize distribution. We used global data on fraction of maize-harvested area (FMHA) around the year of 2000 as provided by the Center for Sustainability and the Global Environment (SAGE) at the University of Wisconsin-Madison [35] to design criteria for maize suitability assessment. The data show the area from which maize is harvested as a fraction of each latitude-longitude grid measuring 5′ by 5′ (circa 10 km by 10 km). Data for validating past suitability assessment results were compiled from three sources, namely (1) past data on maize occurrence processed and provided by Ramirez-Cabral et al. [17] based on the Global Biodiversity Information Facility and literature resources; (2) data on the irrigated, rainfed and total maize harvested area for the year 2000 as provided by MIRCA2000 (global data set of monthly irrigated and rain-fed crop areas around the year 2000) of Goethe University, Frankfurt [36]; (3) productivity-based irrigated, rain-fed, and total data comprising maize physical and harvested area for the year 2005 as provided by the SPAM (Spatial Production Allocation Model) of MapSPAM [37].
Environmental data. We used past climate data (WorldClim, mean annual solar radiation, wind speed, water vapor pressure, and 19 bioclimatic variables) [38], terrain data (FAO, elevation and slope) [39], and soil data (WISE 1.2, 20 soil variables) [40] to construct the criteria for past and future maize suitability assessment and then to assess the past suitability. As a proxy for future data, we assumed that terrain and soil conditions would not change substantially over the study periods and combined the past data on terrain and soil with WorldClim future climate data [38] to assess future suitability.
The data sources are listed and described in detail in Table A1 and the definitions of environmental variables are provided in Table A2.

2.3. Development of Criteria for Evaluating Land Suitability for Maize Cultivation

The procedure for constructing the criteria for the assessment is outlined in Figure 2 and described step by step below.

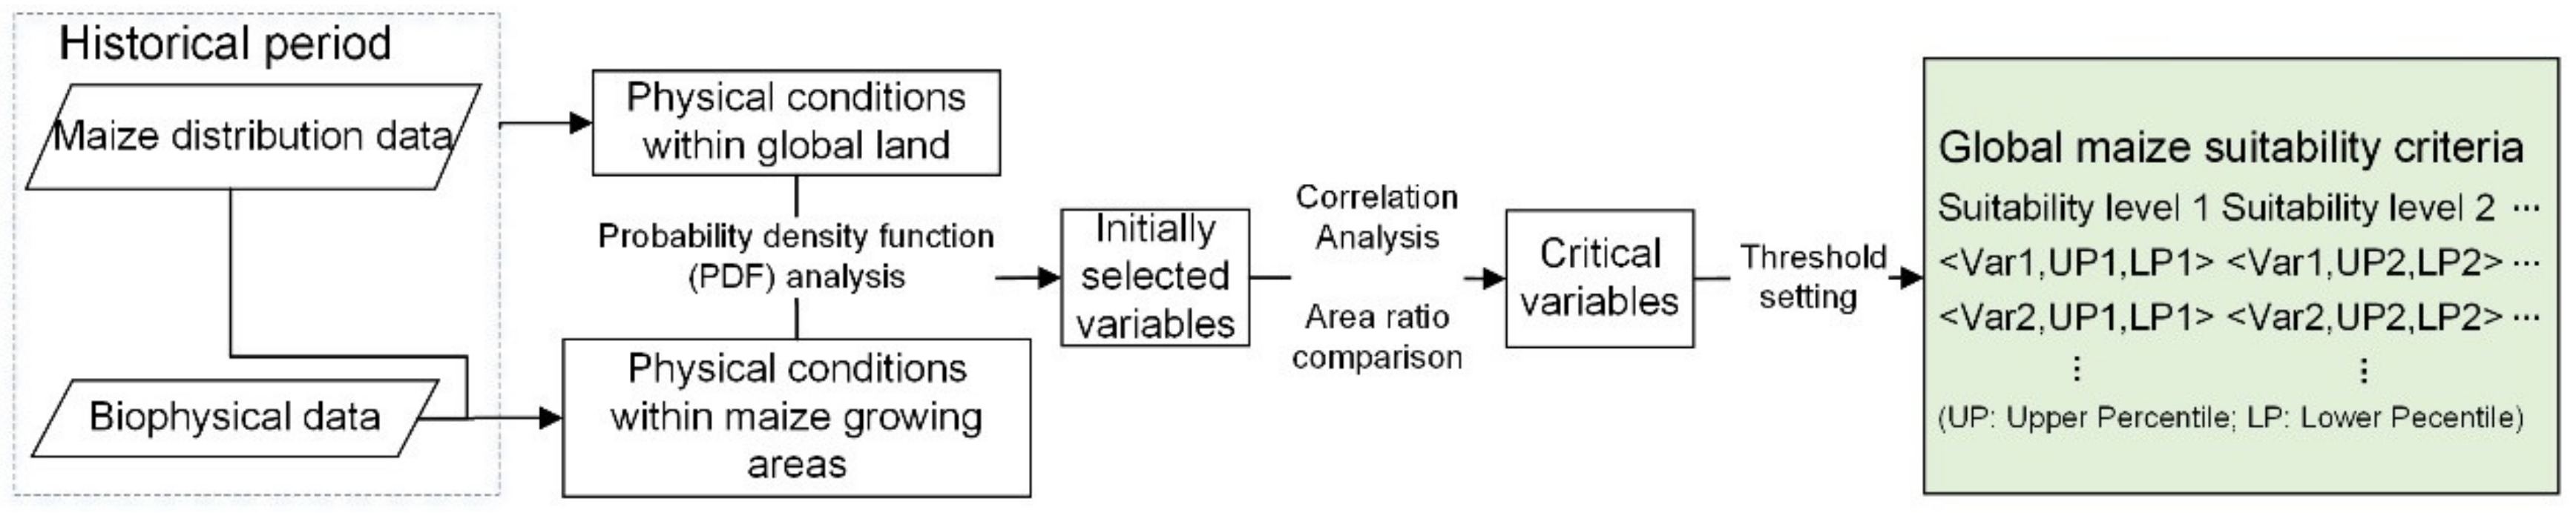
2.3.1. Generating Data on Actual Distribution of Maize

To strike the right balance between data reliability and data availability, based on the SAGE data, we chose those grid cells with FMHA no less than 1% [19] as the data on actual maize distribution.

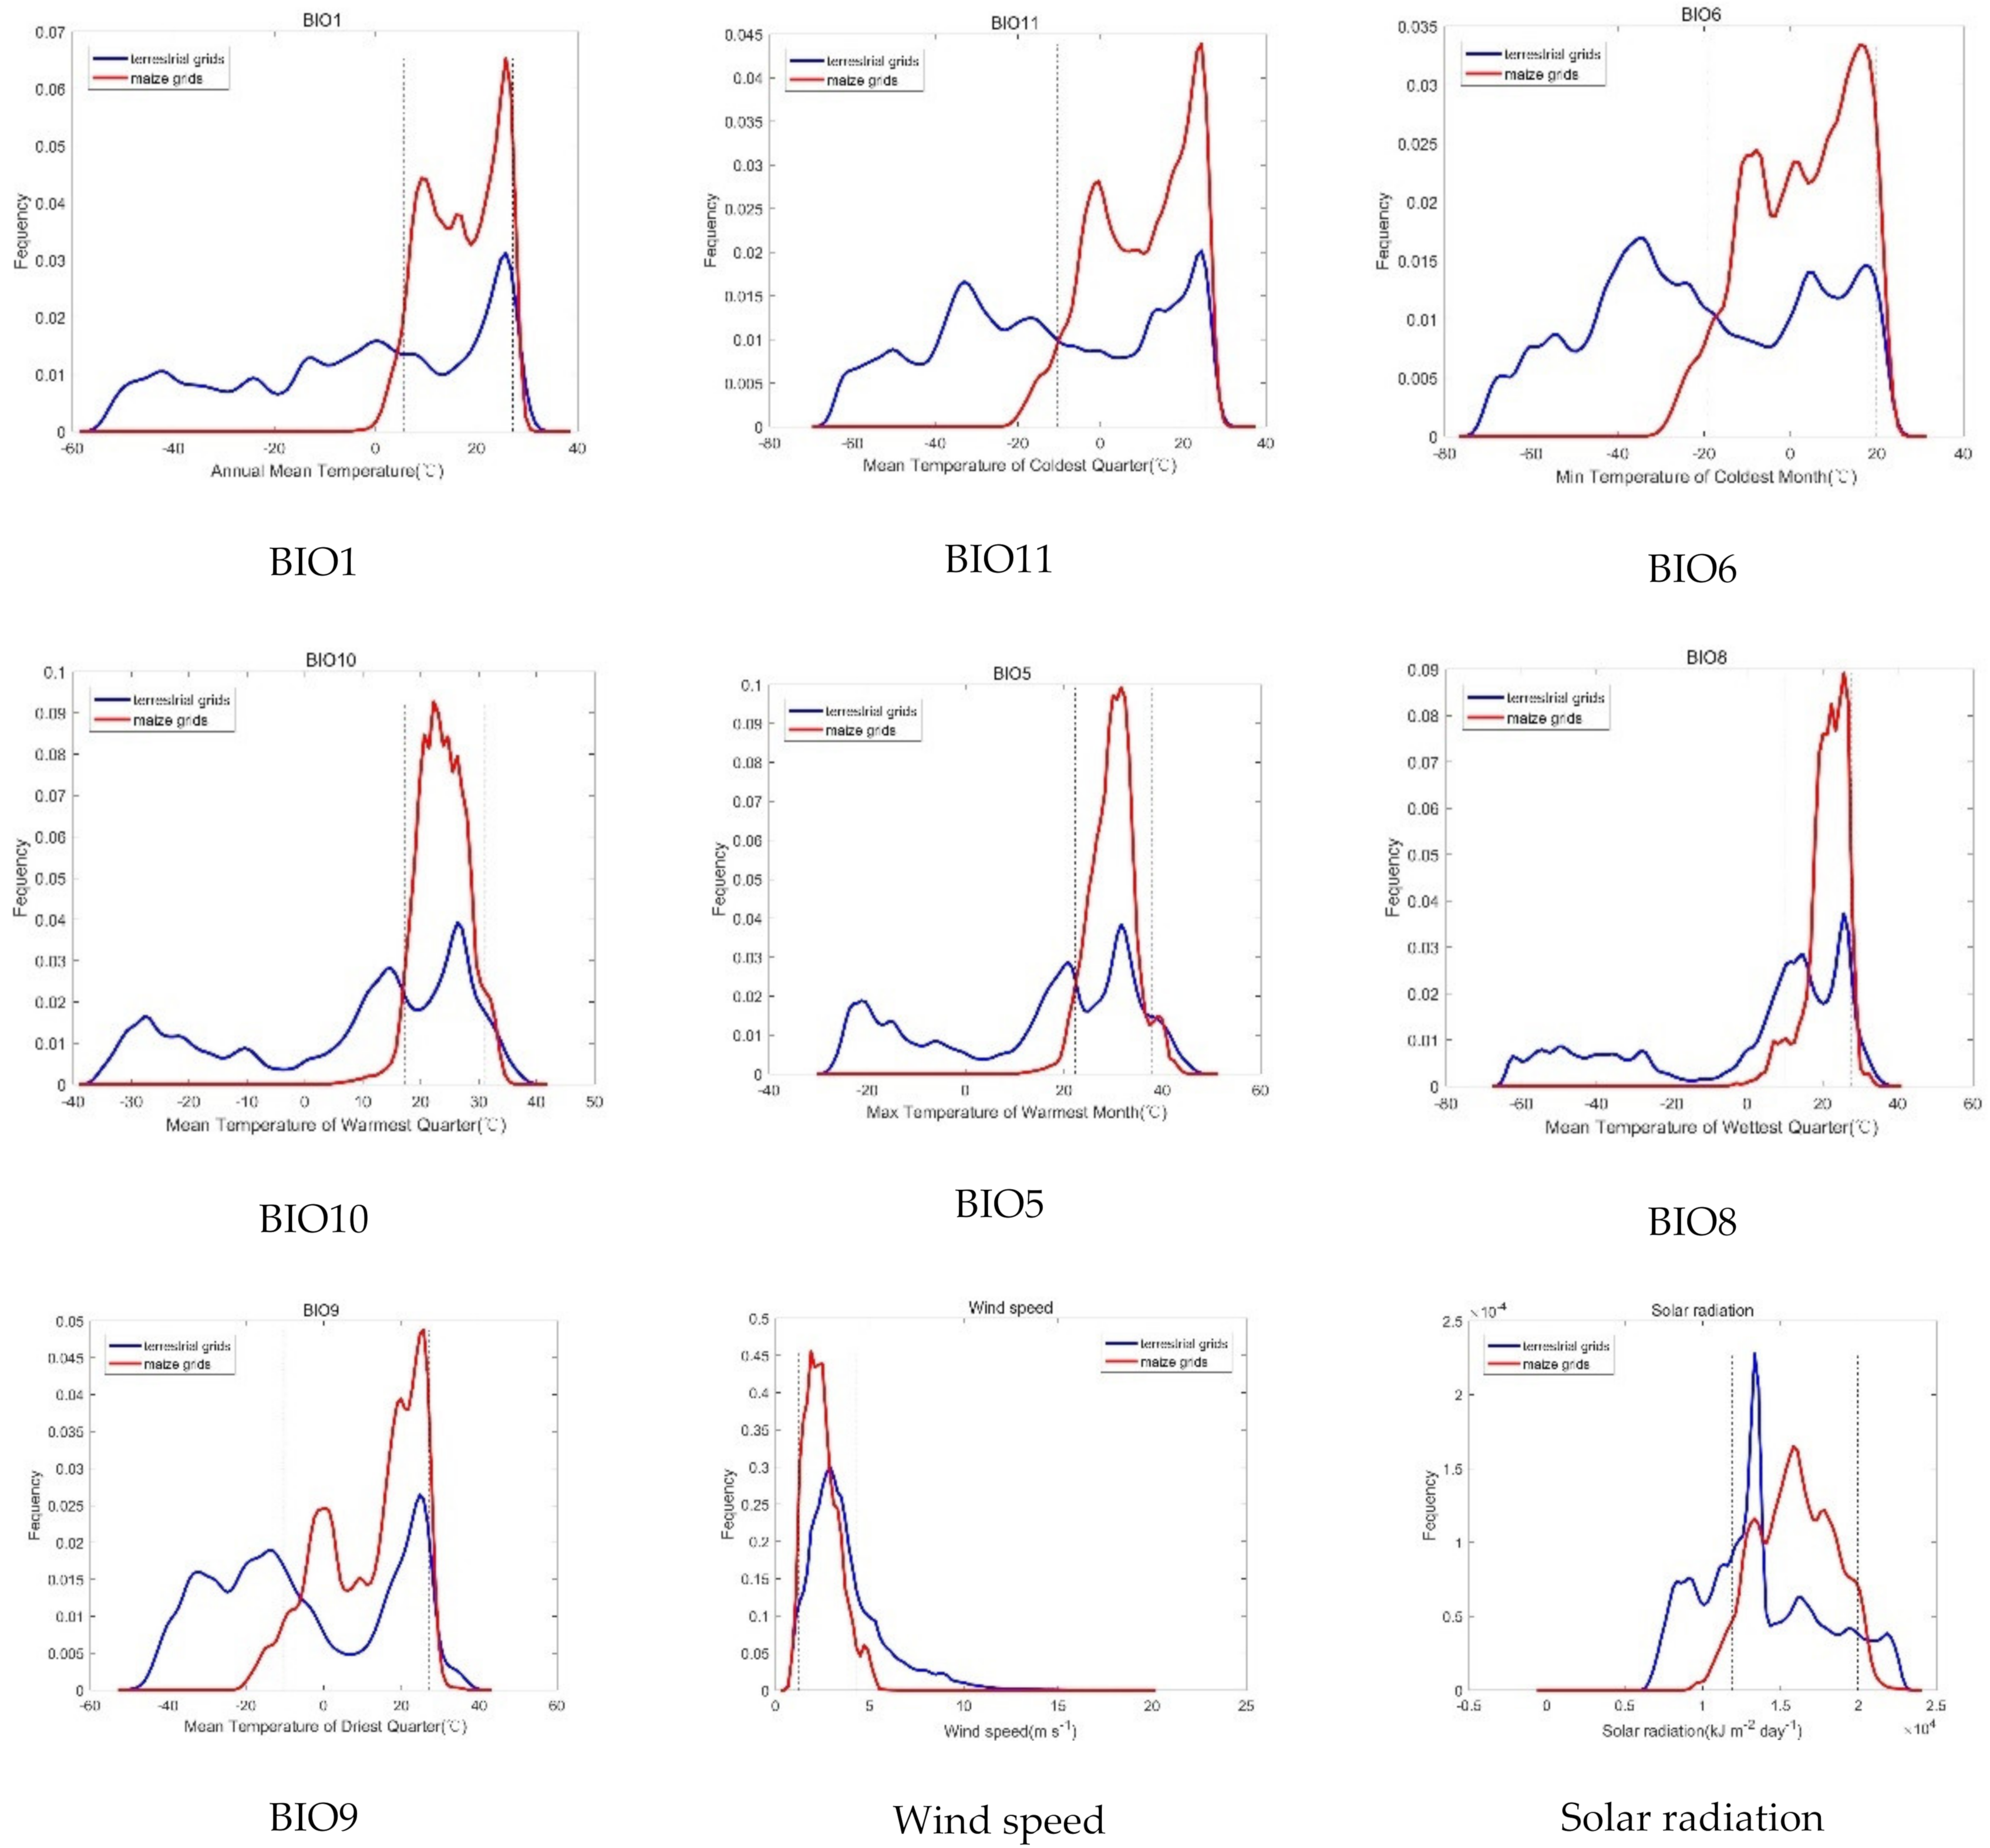
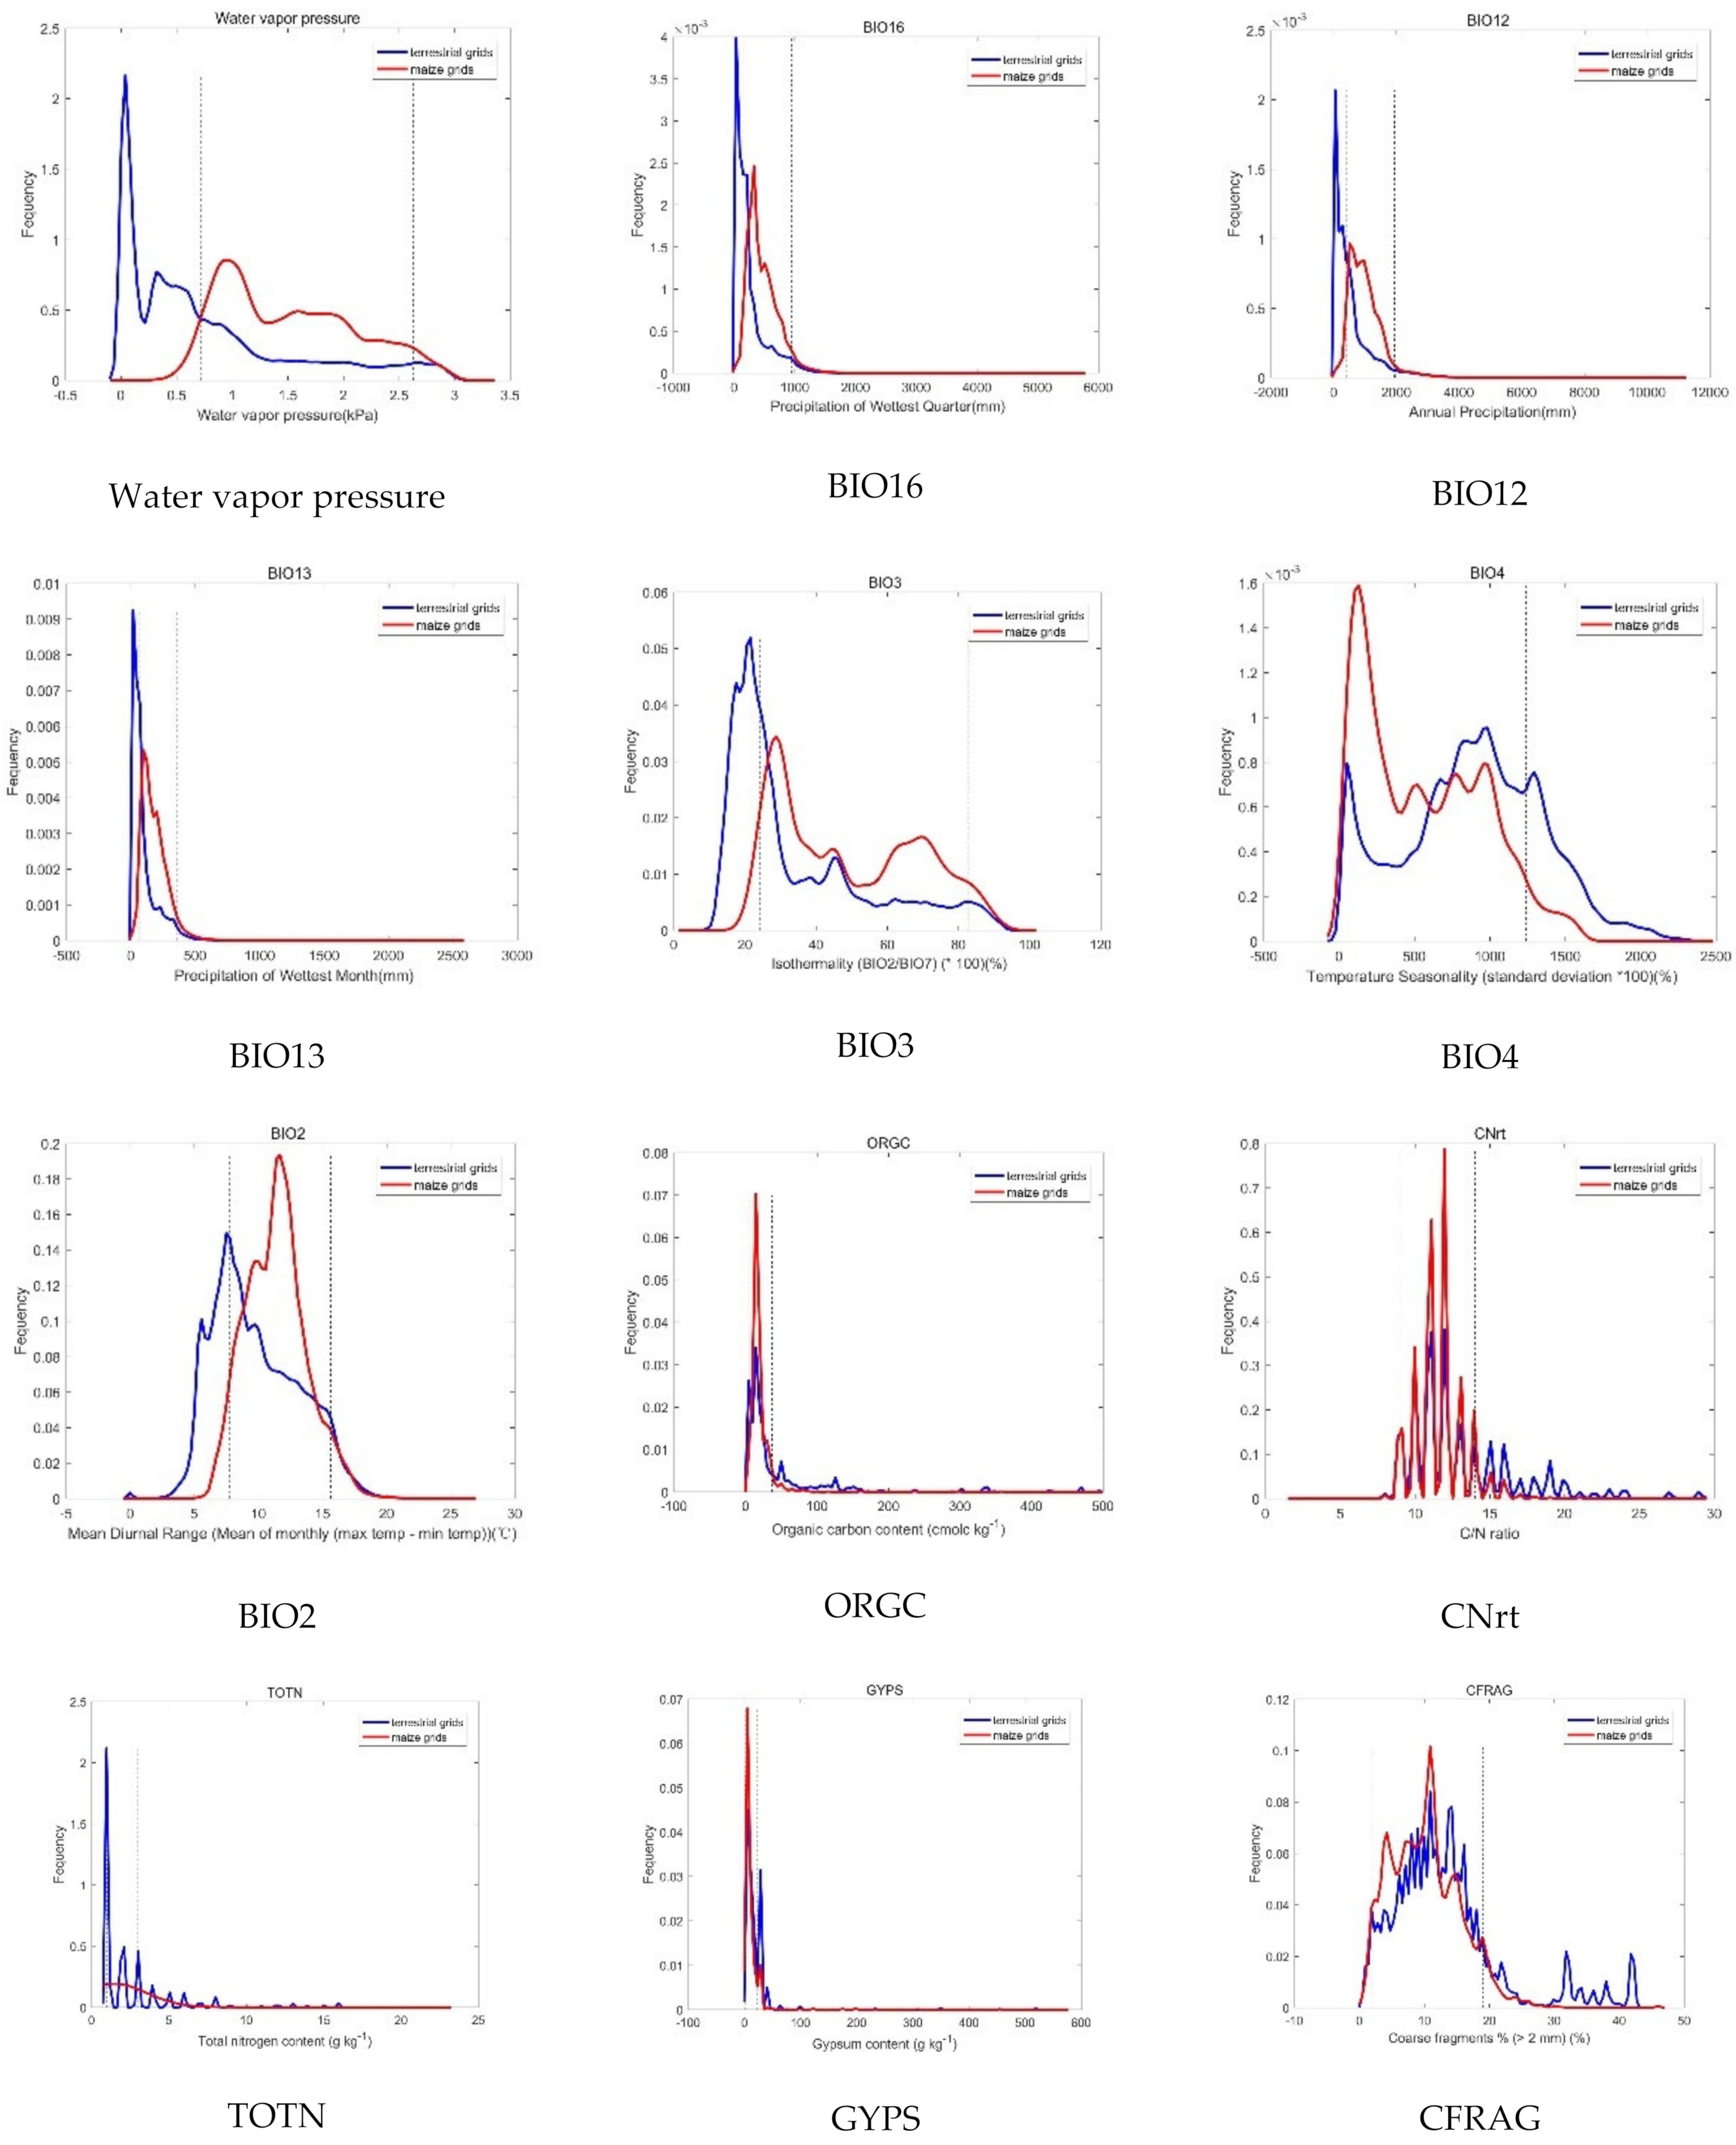
2.3.2. Selection of Crucial Variables

Given the many environmental variables available, choosing those really critical to crop growth and keeping the choice objective is difficult. Correlation analysis is commonly used for eliminating highly correlated variables and thus minimizing multicollinearity, avoiding overfitting, and ensuring more accurate predictions [16,41,42]. Nevertheless, prior knowledge, often locally applicable and possibly subjective, is still required, for example to choose from among those within the same correlation cluster [16].
We therefore used Kullback–Leibler (KL) divergence [43], a quantity developed in the field of information theory for measuring differences between two probability distributions, to help in selecting objectively the critical environmental variables. The idea was to calculate the probability distribution function (PDF) of each environmental variable within the global terrestrial grids and the crop grids and then calculate the KL divergence between the two distributions. The lower the divergence, the smaller the difference between the distributions and therefore the lower the importance of the variable for crop growth and, in turn, for suitability assessment, and vice versa.
In the case of maize, based on the data on past maize distribution and environmental variables, we first calculated two separate PDFs for each variable, except slope, related to climate, soil, and terrain: one PDF based on global terrestrial grids and the other PDF based on maize grids (Figure A1). It should be noted that slope is displayed as a categorical variable, and we used an alternative method (see below). Next, we calculated the KL divergence between the two PDFs of each variable (details in Table A3) using the following equation [43]:
D K L P Q = i X P i × l o g P i Q i
where DKL(P||Q) is the KL divergence between P and Q, which are the two PDFs of each environmental variable, one based on the global terrestrial grids and the other on the maize grids; X is the range of possible property values, noted as i, for each variable; P(i) and Q(i) are the probabilities of a specific value corresponding to P and Q, respectively.
To narrow the choice, we retained only those variables with a KL value not less than 1 (marked with asterisk in Table A2). We used alternative approaches to screen crucial variables for climate, soil, and terrain. As many climatic and soil variables are highly correlated, we calculated the Pearson correlation coefficient (r) matrix of the variables chosen initially (Table A4). In each pair of variables with a higher correlation coefficient (i.e., |r| 0.8) [42] (highlighted in pink in Table A4), we retained the variable that had a higher KL value.
Among the terrain variables, elevation was not included initially because it had a low KL value. As slope is a categorical variable, we calculated and compared the proportion of area under maize to the total global land area for each slope class, labeled f A i , and the distribution of area under maize in terms of each slope class, labeled f B i :
f A i = A r e a m a i z e i A r e a l a n d i
f B i = A r e a m a i z e i A r e a m a i z e
i = S l o p e _ c l a s s 1 , 2 , , 9
where A r e a m a i z e i and A r e a l a n d i denote the area under maize and land area within a specific slope class, respectively; A r e a m a i z e denotes the global maize harvested area; and i refers to a specific slope class.
As shown in Table A5, globally, maize is grown on each slope class, and f A i is not notably different from f B i in general, indicating that slope does not influence maize growth greatly. Therefore, we eliminated slope as a crucial variable.
The final choice of the crucial environmental variables is marked with two asterisks in Table A2.

2.3.3. Variable Threshold Setting

The thresholds for determining the extent of suitability can be obtained by calculating the percentile values for each environmental variable from the range of its values on a species’ presence locations [44]. We used the percentile method [45] to set the thresholds. Specifically, we defined five levels of suitability based on the percentiles: unsuitable, marginally suitable, moderately suitable, suitable, and optimal (Table 1). Based on these percentile criteria, we categorized the values of the selected crucial variables into different suitability classes.
Then, to better characterize the influencing mechanisms of the crucial variables on maize cultivation, we adjusted the specific suitability thresholds by simultaneously considering Rpct, a judgment parameter calculated based on the PDFs:
R p c t = P X < Q p c t Q X < Q p c t     p c t = 1 ,   2.5 , 5 , 10 P X > Q p c t Q X > Q p c t     p c t = 99 ,   97.5 , 95 , 90
where P and Q are the PDFs of each crucial environmental variable with respect to the global terrestrial grids and maize grids, respectively. X is the range of possible property values for a variable, and Qpct is the value of the variable corresponding to a specific percentile, namely pct, of Q. R p c t denotes the ratio of the probability of terrestrial grids with variable values fulfilling given conditions to that of maize grids.
For a specific pct, when the calculated Rpct is not less than 2, we adopted the corresponding Qpct as the threshold, otherwise we used the Qpct corresponding to the lower suitability class, namely, the smaller Qpct on the lower tail, or the bigger one on the upper. For example, for the variable BIO1, both R99 and R97.5 are more than 2, while both R95 and R90 are less than 2, so we adopted the Q97.5 value as the threshold between the Marginally suitable class and the Optimal class. That is to say, on the upper tail we did not distinguish the Moderately suitable class and the Suitable class, and a specific grid with BIO1 value less than the Q97.5, but no less than Q10 of BIO1 is considered optimal for maize growth in terms of BIO1.When each Rpct on one tail is less than 2, we adopted the smallest Qpct on the lower tail, or the biggest on the upper, as the threshold. Take an example, for the variable Wind speed, R1, R2.5, R5, R10 are all below 2, so we just used Q1 to divide the Unsuitable class and the Optimal class on the lower tail.
Through the above steps, we established the criteria for global-scale maize suitability assessment (see detail in Section 3.1).

2.4. Assessing on a Global Scale the Land Suitability for Growing Maize

For a specific terrestrial grid, we first matched its physical attributes to the established criteria to determine the level of its suitability for maize in terms of each crucial environmental variable. The lowest level was taken as the result for that grid, keeping in mind Liebig’s law of the minimum [31]:
S u i t a b i l i t y m a i z e = m i n S u i t a b i l i t y v a r i
where S u i t a b i l i t y m a i z e denotes the level to which the grid is suitable for growing maize and is the minimum of the set of S u i t a b i l i t y v a r i , which denotes the grid’s suitability for maize in terms of a given crucial environmental variable; in i = 1, 2, 3, … n, n represents the number of crucial variables.
We evaluated the global maize suitability during three periods (the 2000s (1970–2000), 2050s (2041–2060), 2070s (2061–2080)) and under two contrasting RCPs, namely RCP2.6 and RCP8.5, which, respectively, represent a mitigation scenario assuming a very low radiative forcing level of 2.1 W/m2 and a very high baseline emission scenario assuming radiative forcing of 8.5 W/m2 by 2100 [46]. Further, we analyzed the spatial–temporal patterns, statistical characteristics, and the dynamics of suitability under and between different combinations of the two scenarios and the three periods (Section 3.3).
It should be noted that before analyzing the suitability, we validated our results of historical maize suitability evaluation using data from multiple sources and compiled using multiple methods on past maize distribution to ensure the reliability of our methods and criteria (Section 3.2). Besides, for future climate scenarios, we used a multimodel ensemble approach to reduce uncertainty in the projected suitability levels. Thus, for a given grid cell, we adopted the suitability level most frequently obtained under the 13 general circulation models (GCMs) used in WorldClim projections.

3. Results

3.1. Variables and Criteria for Global Assessment of Land Suitability for Maize Cultivation

The criteria for assessing, on a global scale, the land suitability for growing maize comprised a total of 12 crucial environmental variables. The variables and their respective thresholds for different grades indicating the extent to which a given site is suitable for maize cultivation are shown in Table 2. Of the 12 environmental variables identified as critical to maize cultivation, eight were climatic and four were related to soil. This preponderance of climatic variables reflects the probable substantial impact of climate change on maize cultivation. Of the eight climatic variables, five were related to temperature: BIO1 (annual mean temperature), BIO2 (mean diurnal temperature range), BIO3 (isothermality), BIO8 (mean temperature of the wettest quarter), and BIO10 (mean temperature of the warmest quarter); the remaining three were precipitation (BIO16, precipitation in the wettest quarter), sunlight (solar radiation), and wind (wind speed). The four variables related to soil were CFRAG (percentage of coarse fragments, that is of diameter larger than 2 mm), CNrt (carbon-to-nitrogen ratio), GYPS (gypsum content), and ORGC (organic carbon content). These variables correspond well with the physical requirements of maize as reported in the literature. For example, climatically, as a summer crop, maize is known to prefer warm daytime temperatures, high light intensity, and cool nights and to require adequate moisture during the growing season, especially when close to the tasseling stage [47,48]. Strong winds can accelerate water loss from plants and make the plants prone to lodging and to shedding the kernels [47]. As for the soil conditions, maize grows best on soils with good drainage and aeration (that can be influenced by CFRAG) and needs sufficient nutrients—mainly organic carbon and nitrogen—in the right proportions (as reflected in the C/N ratio; [47,49]). Besides, as a soil amendment that has been used over a long time, gypsum confers many benefits such as providing calcium and sulphur for plant nutrition and making subsoil less acidic [50]. Thus, the environmental variables that we chose through statistical analyses can characterize the physiological requirements of maize adequately and are really critical to its growth.
For setting the threshold values for each variable, both percentile tails were chosen, which is generally in line with the existing knowledge that the growth and development of maize is affected adversely when the value of any of the environmental variables becomes too high or too low [51,52,53,54,55]. However, the variables differ greatly in this respect. For example, in the case of wind speed and the C/N ratio, the upper percentiles were more adopted than the lower ones, showing that higher values of these variables were more important. Carter and Hudelson [56] reported that lodging markedly influences maize growth and grain yield, and Yusuf et al. [57] reported that a high C:N ratio can immobilize the nitrogen in soil and thus lowers maize productivity. In contrast, the lower percentiles were more used for most of the climatic variables, such as BIO8, BIO16, and Solar radiation, indicating that maize prefers ample light, warmth, and water. This is also consistent with what we know of the physiological properties of maize [58]. The percentile settings we chose, based on statistics, thus accurately reflected the critical values of the factors that influence maize growth and development.
We therefore concluded that the criteria we established were scientifically reasonable.

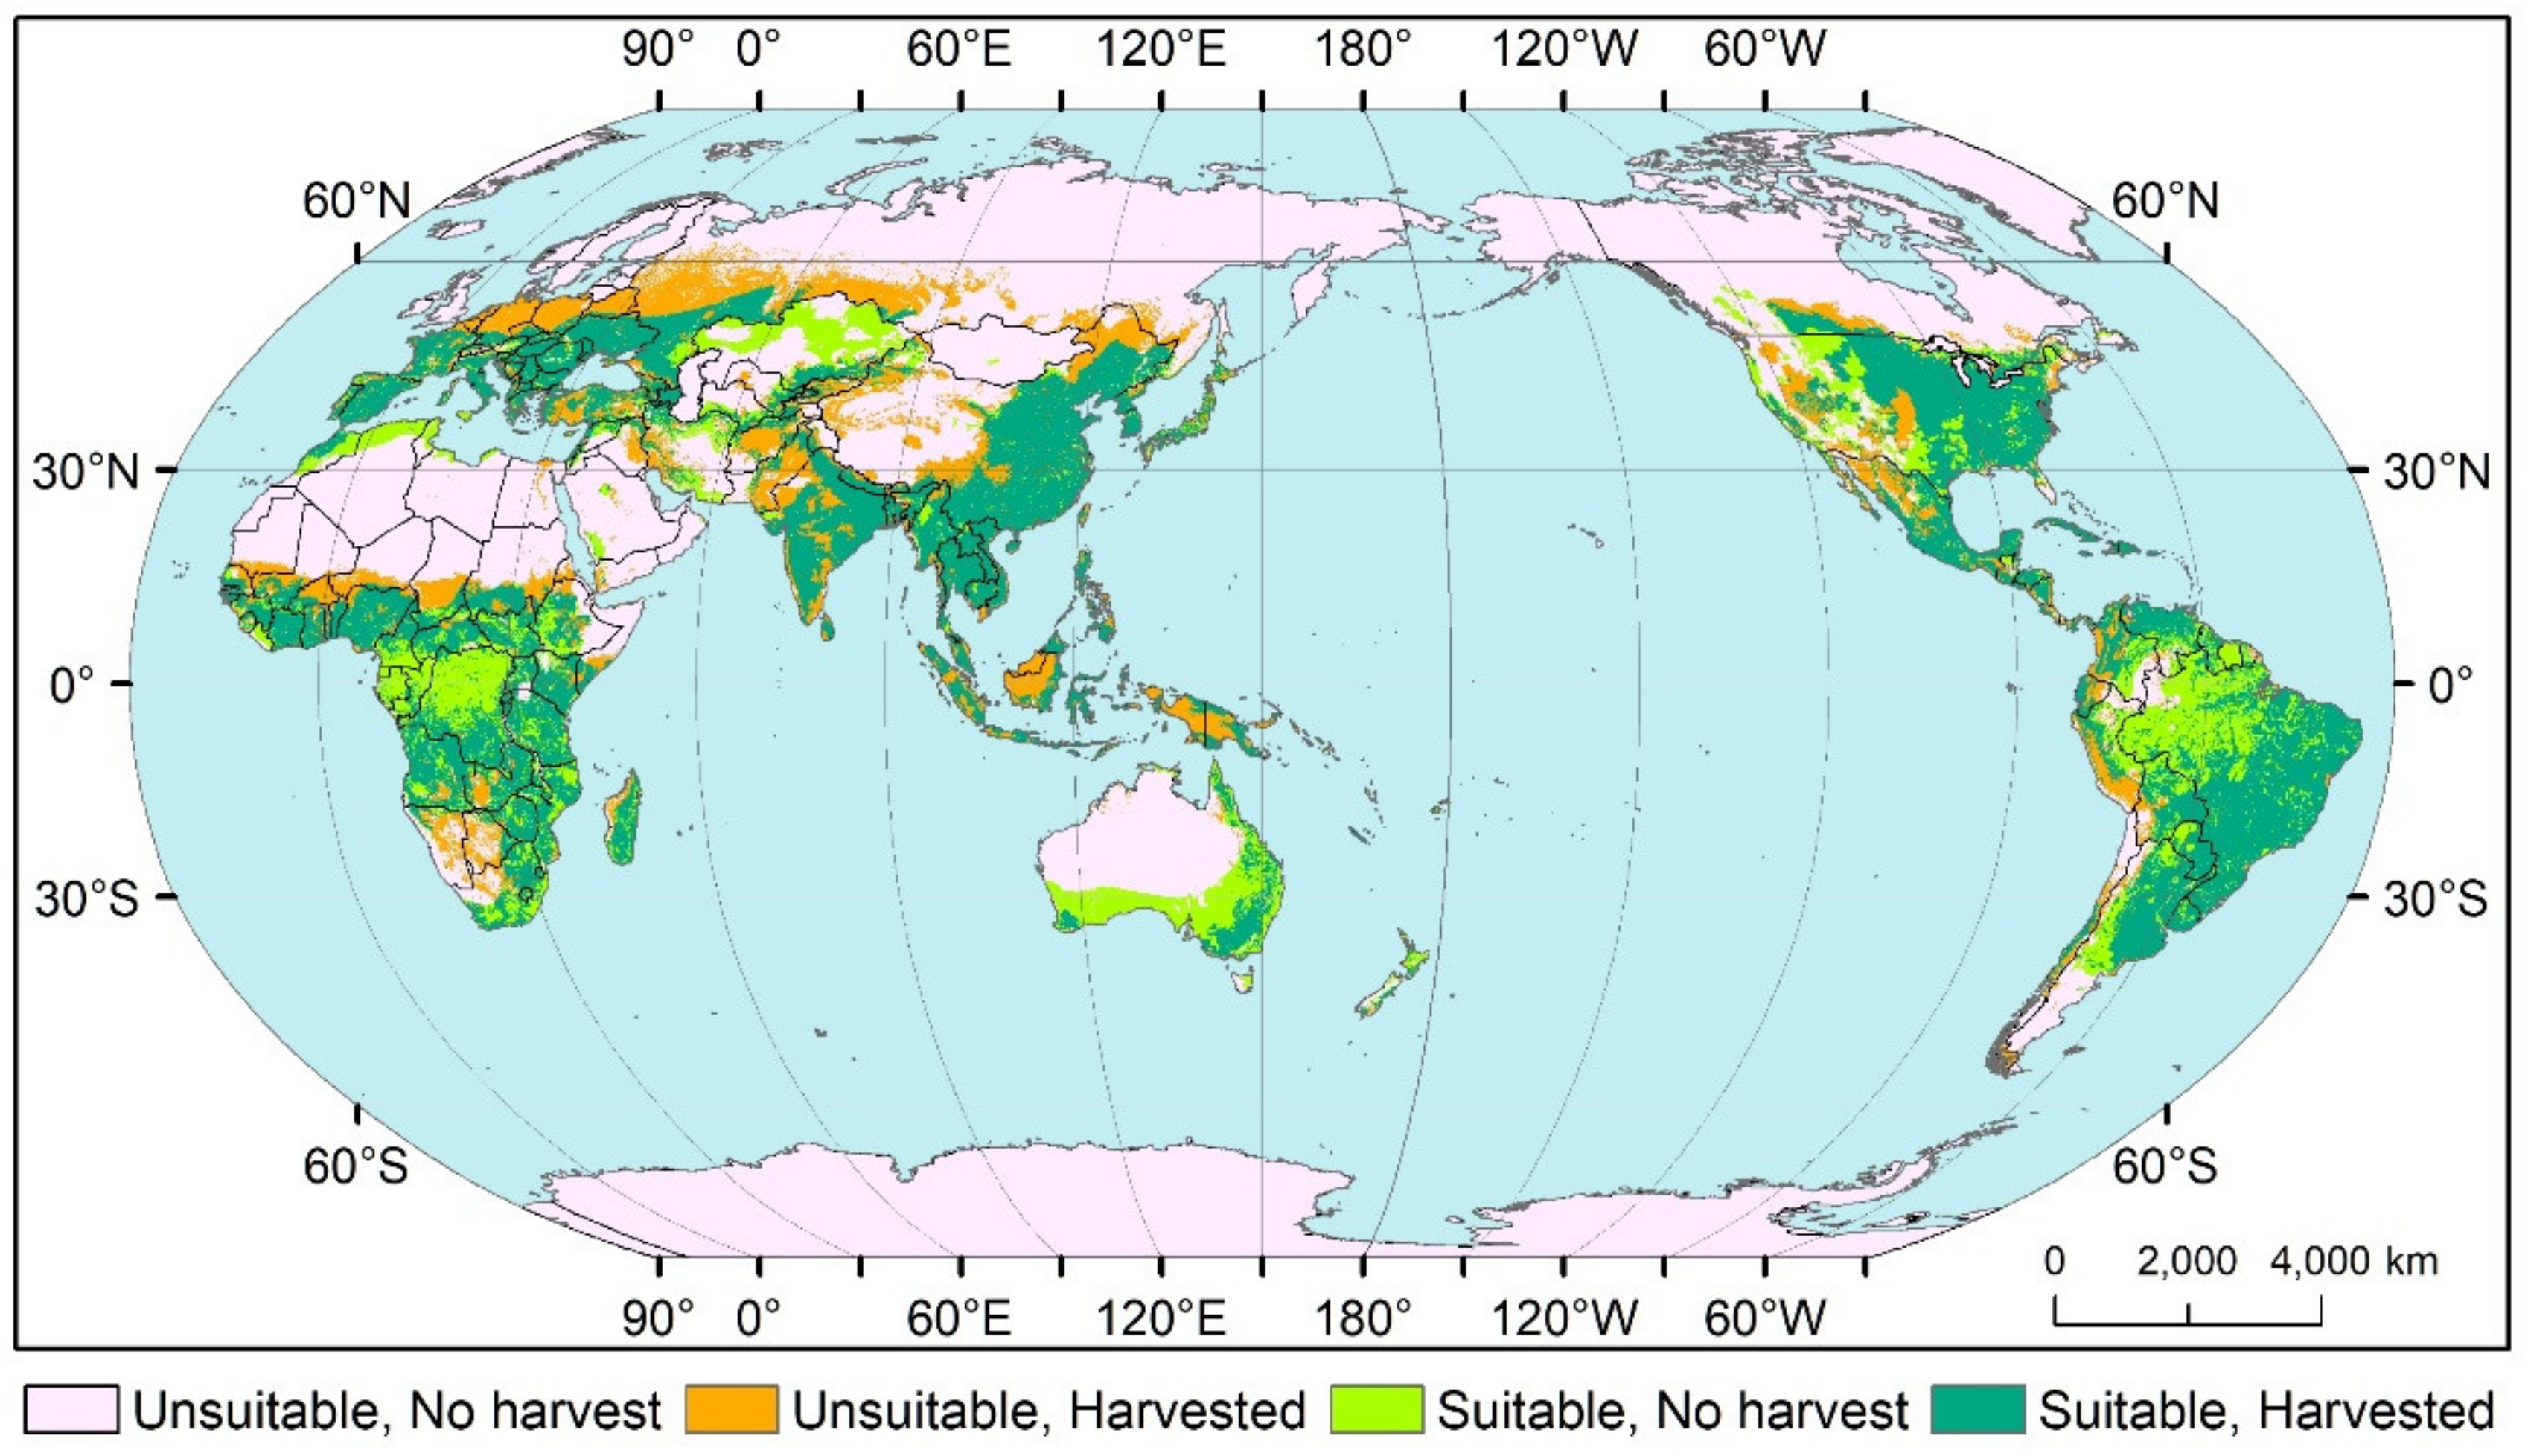
3.2. Accuracy of Evaluation of Land Suitability for Maize Cultivation

We examined the accuracy of our assessment by comparing the past suitability (during the 2000s)—in both qualitative and quantitative terms—with data on the distribution of maize during the same period from multiple sources and compiled using different methods. First, we used the data processed by Ramirez-Cabral et al. [17] for validation and found that 79% of the occurrence records were within the categories modeled as marginally to optimally suitable. Secondly, we used two sources of downscaled data on global maize production, namely SPAM and MIRCA2000, for cross validation using the method described by Stehman [59]: the overall accuracy was around 79% and the Kappa coefficient was about 0.72 (Table 3, Table 4a). Therefore, we consider our evaluation to be statistically accurate.
We also examined the spatial consistency (Figure 3) between the predicted suitability and a map showing the past area under maize (the SAGE historical map; [35]). The overlay analysis showed that of the area under maize, 71.35% was correctly predicted as suitable for maize, distributed mainly in China, India, some countries in Europe and Africa, the United States, Mexico, Brazil, and Argentina. In contrast, sites on which maize had been grown but were predicted as unsuitable accounted for 28.65% of the total area under maize, distributed sporadically in north-eastern, north-western, and south-western China, Pakistan, Iraq, Iran, Russia, Indonesia, parts of sub-Saharan Africa, western United States, Peru, etc. These areas are known for environmental factors (e.g., temperature and precipitation) that limit crop growth and have a mean FMHA of 0.7% according to SAGE data. These areas can be understandably regarded as unsuitable for maize cultivation, although measures such as irrigation and stress-tolerant cultivars may have played a role in overcoming environmental constraints and making maize cultivation possible [60,61,62].
On the other hand, maize was never grown on 28.77% of the sites predicted suitable for its cultivation, probably because of such factors as local land use forms and choice of the crop. For example, the Amazon basin and Congo basin are known to be covered by vast rainforests, and cropland has been abandoned on a large scale in northern Kazakhstan [63]. As a result, maize is not grown in these areas although they are physically suitable for it. These results also confirm our assessment to be spatially reasonable.
To sum up, our predictions of land suitability for maize in the past were in close agreement with the existing situation in terms of both statistical accuracy and spatial consistency, suggesting that the methods we used are reliable for large-scale assessment of maize suitability.

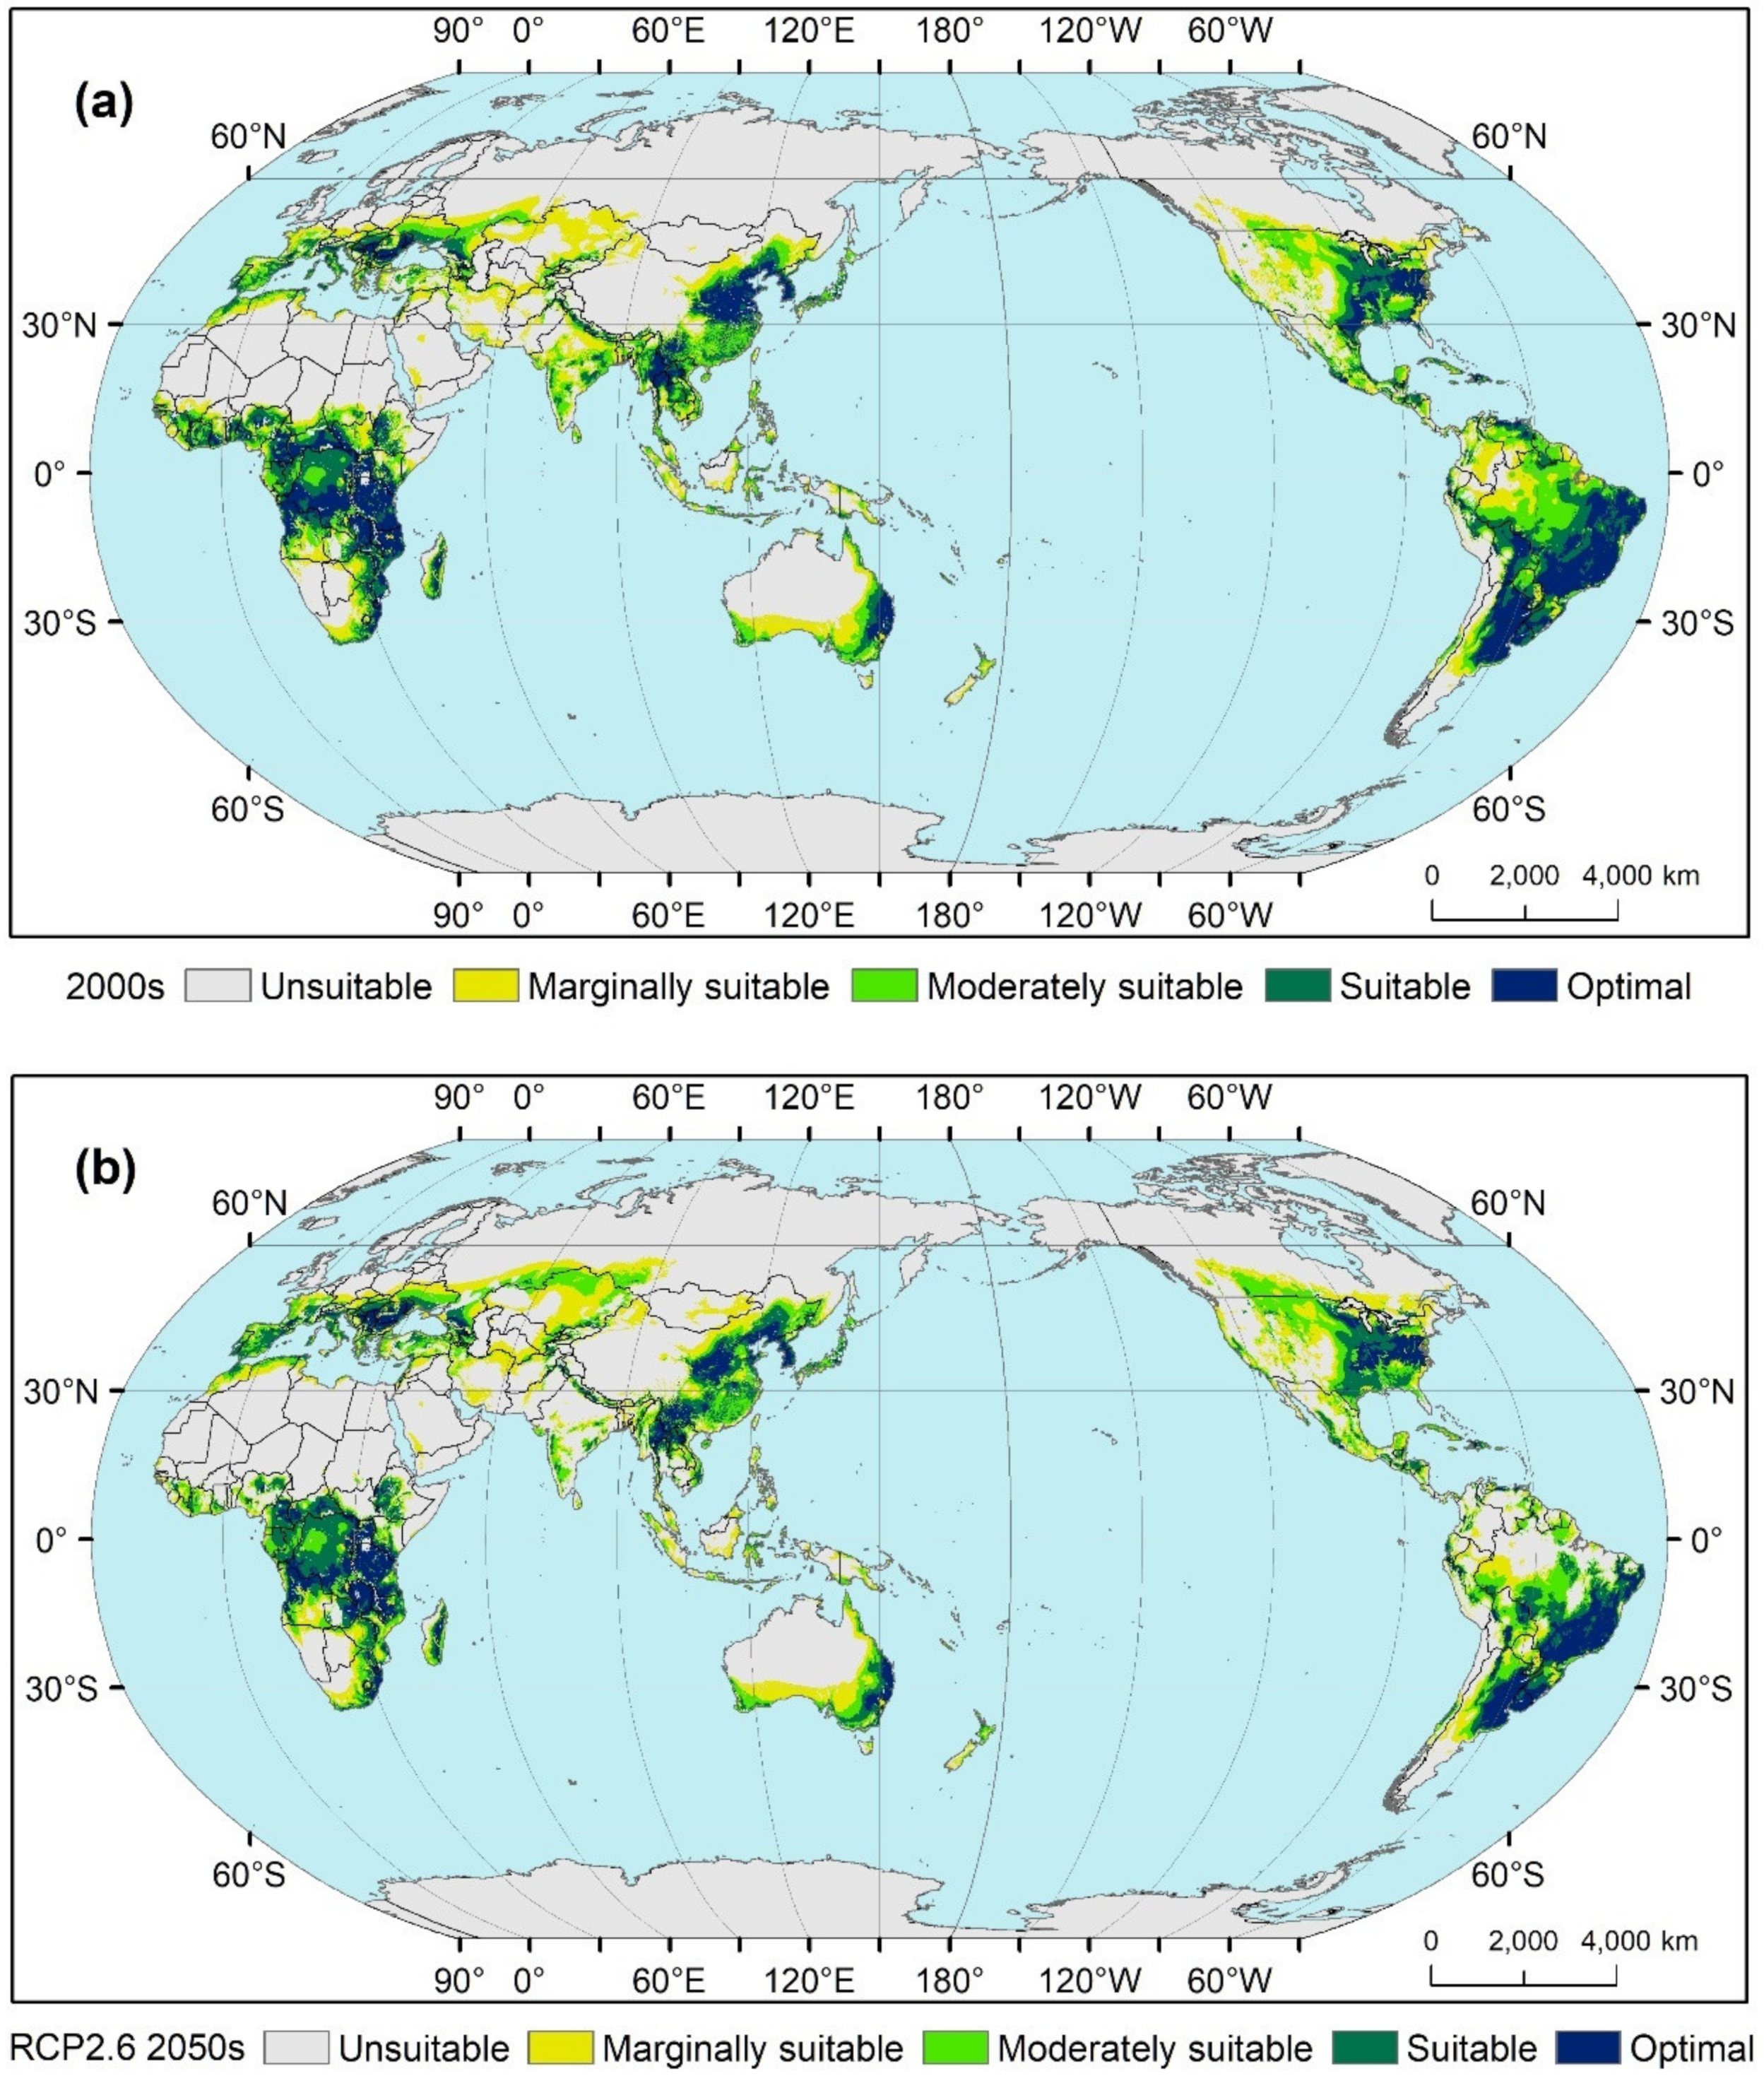
3.3. Worldwide Land Suitability for Maize during Three Periods and under Two RCPs

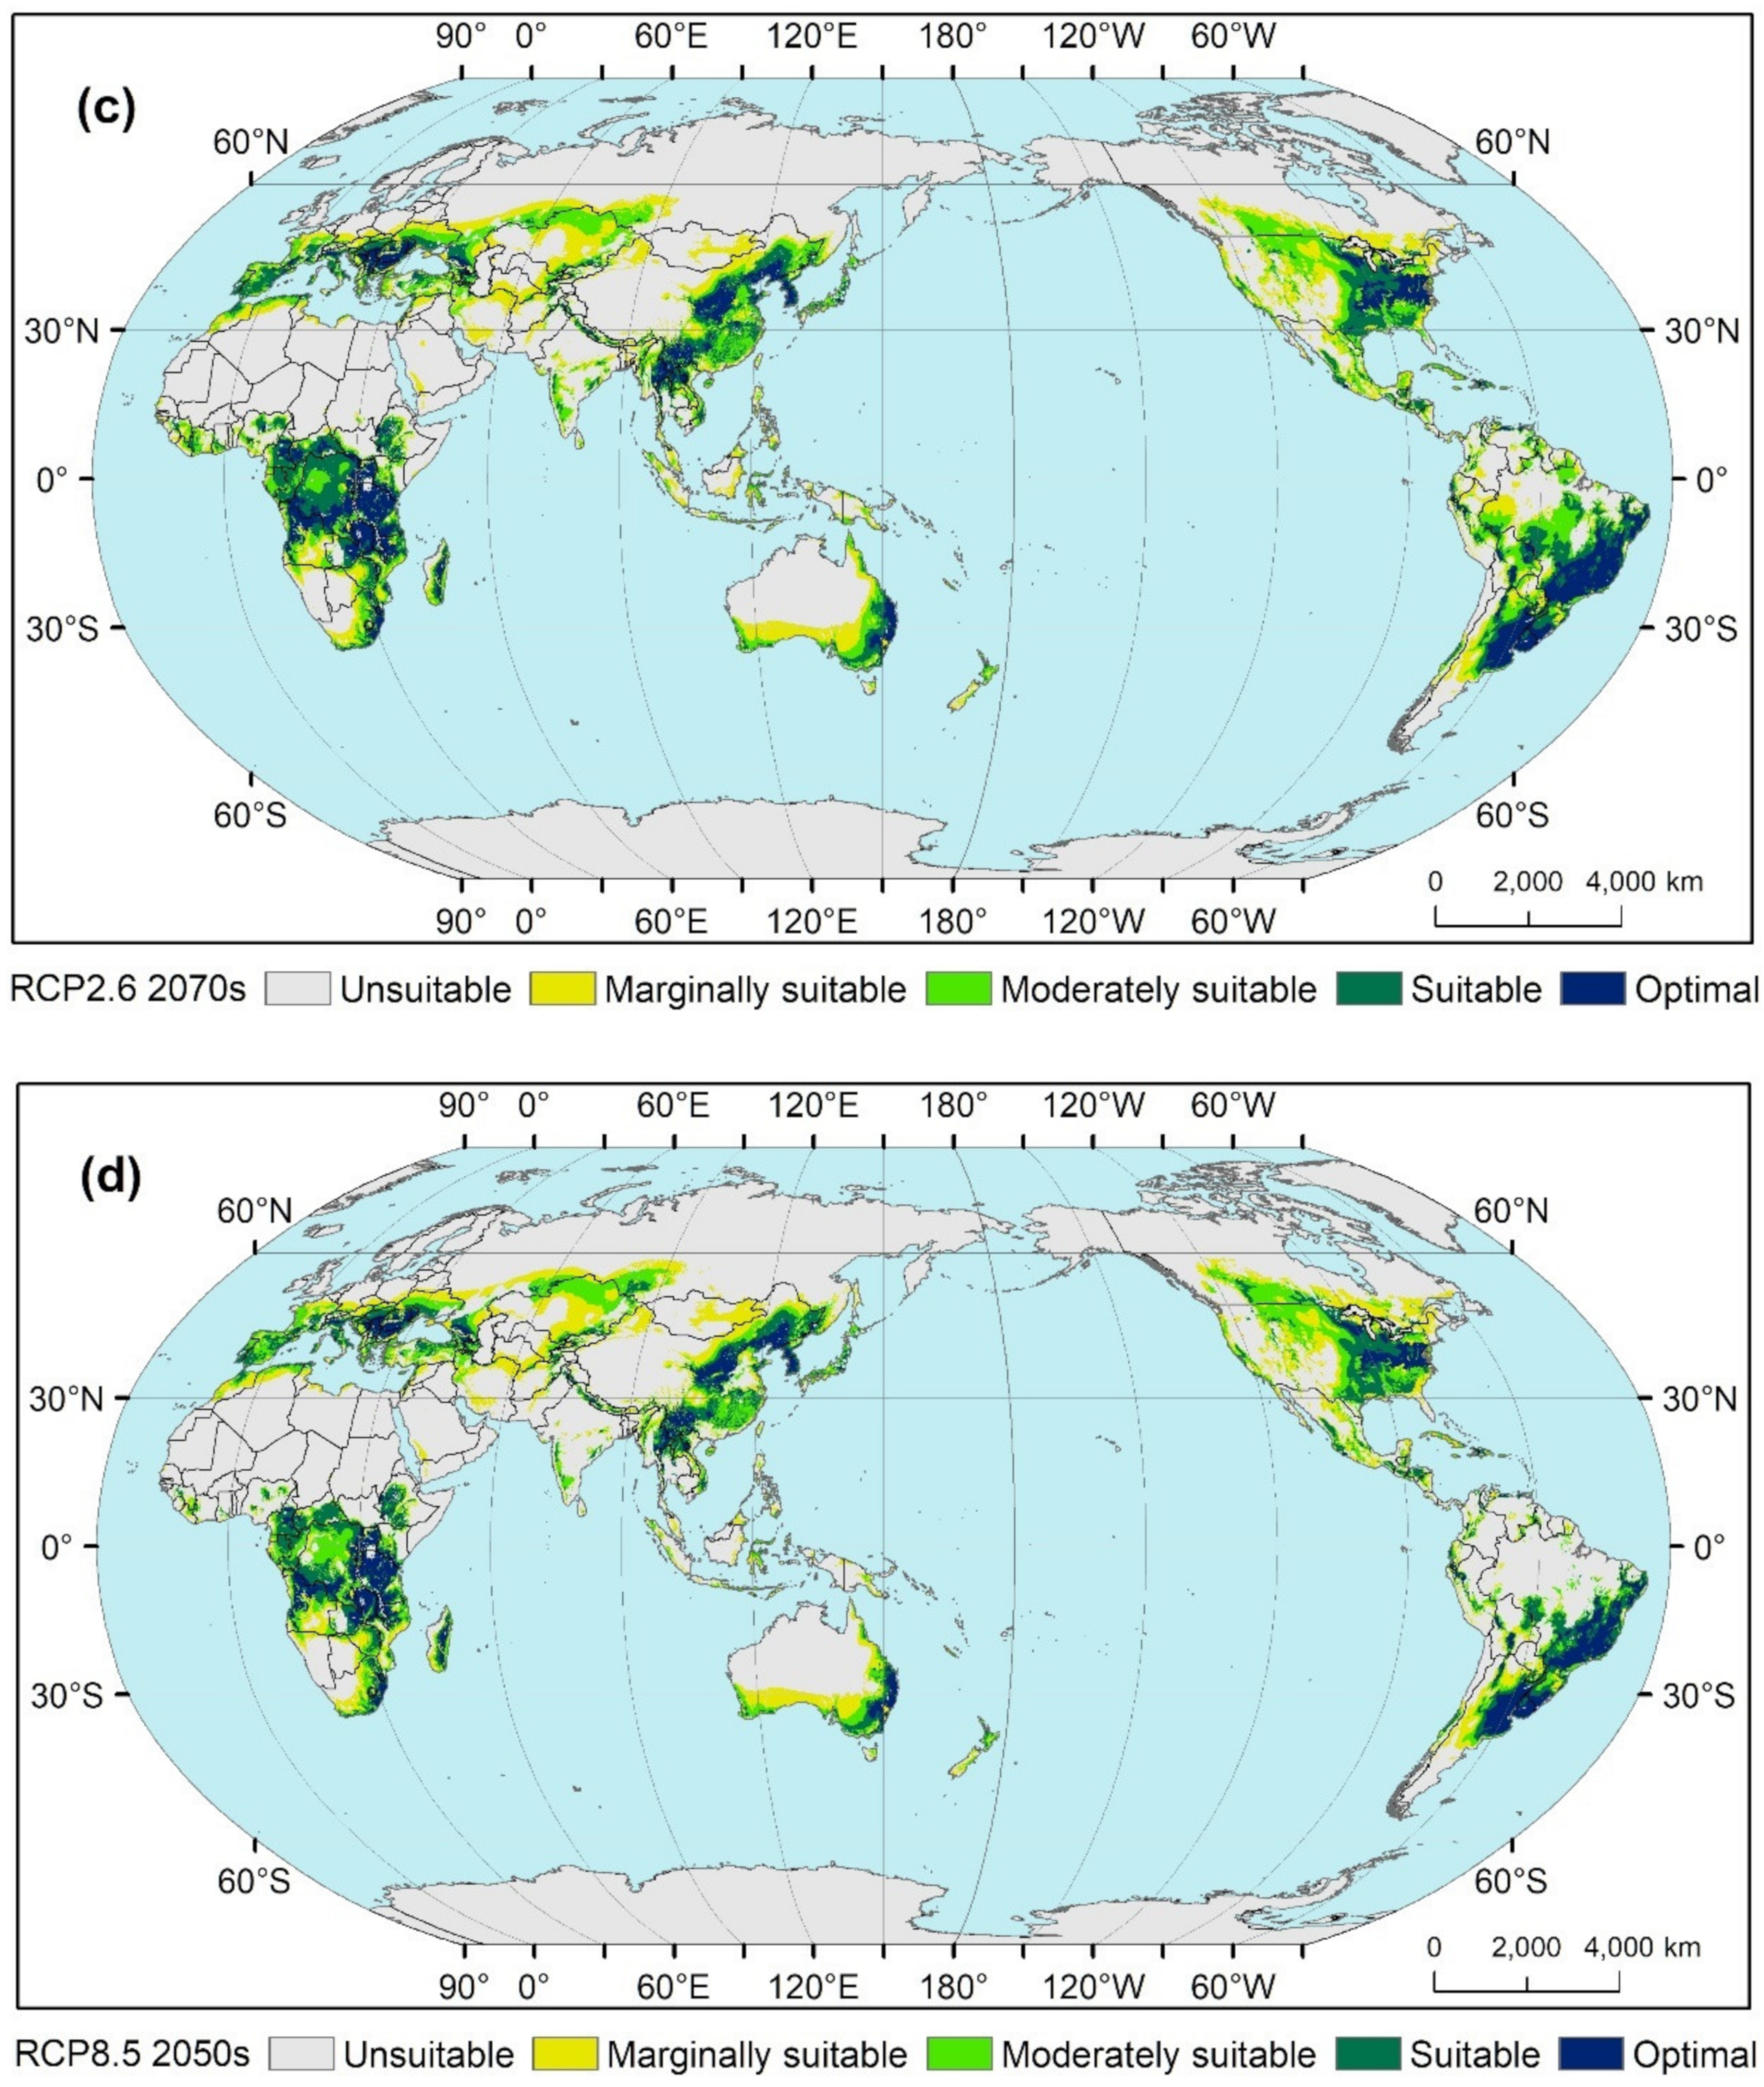
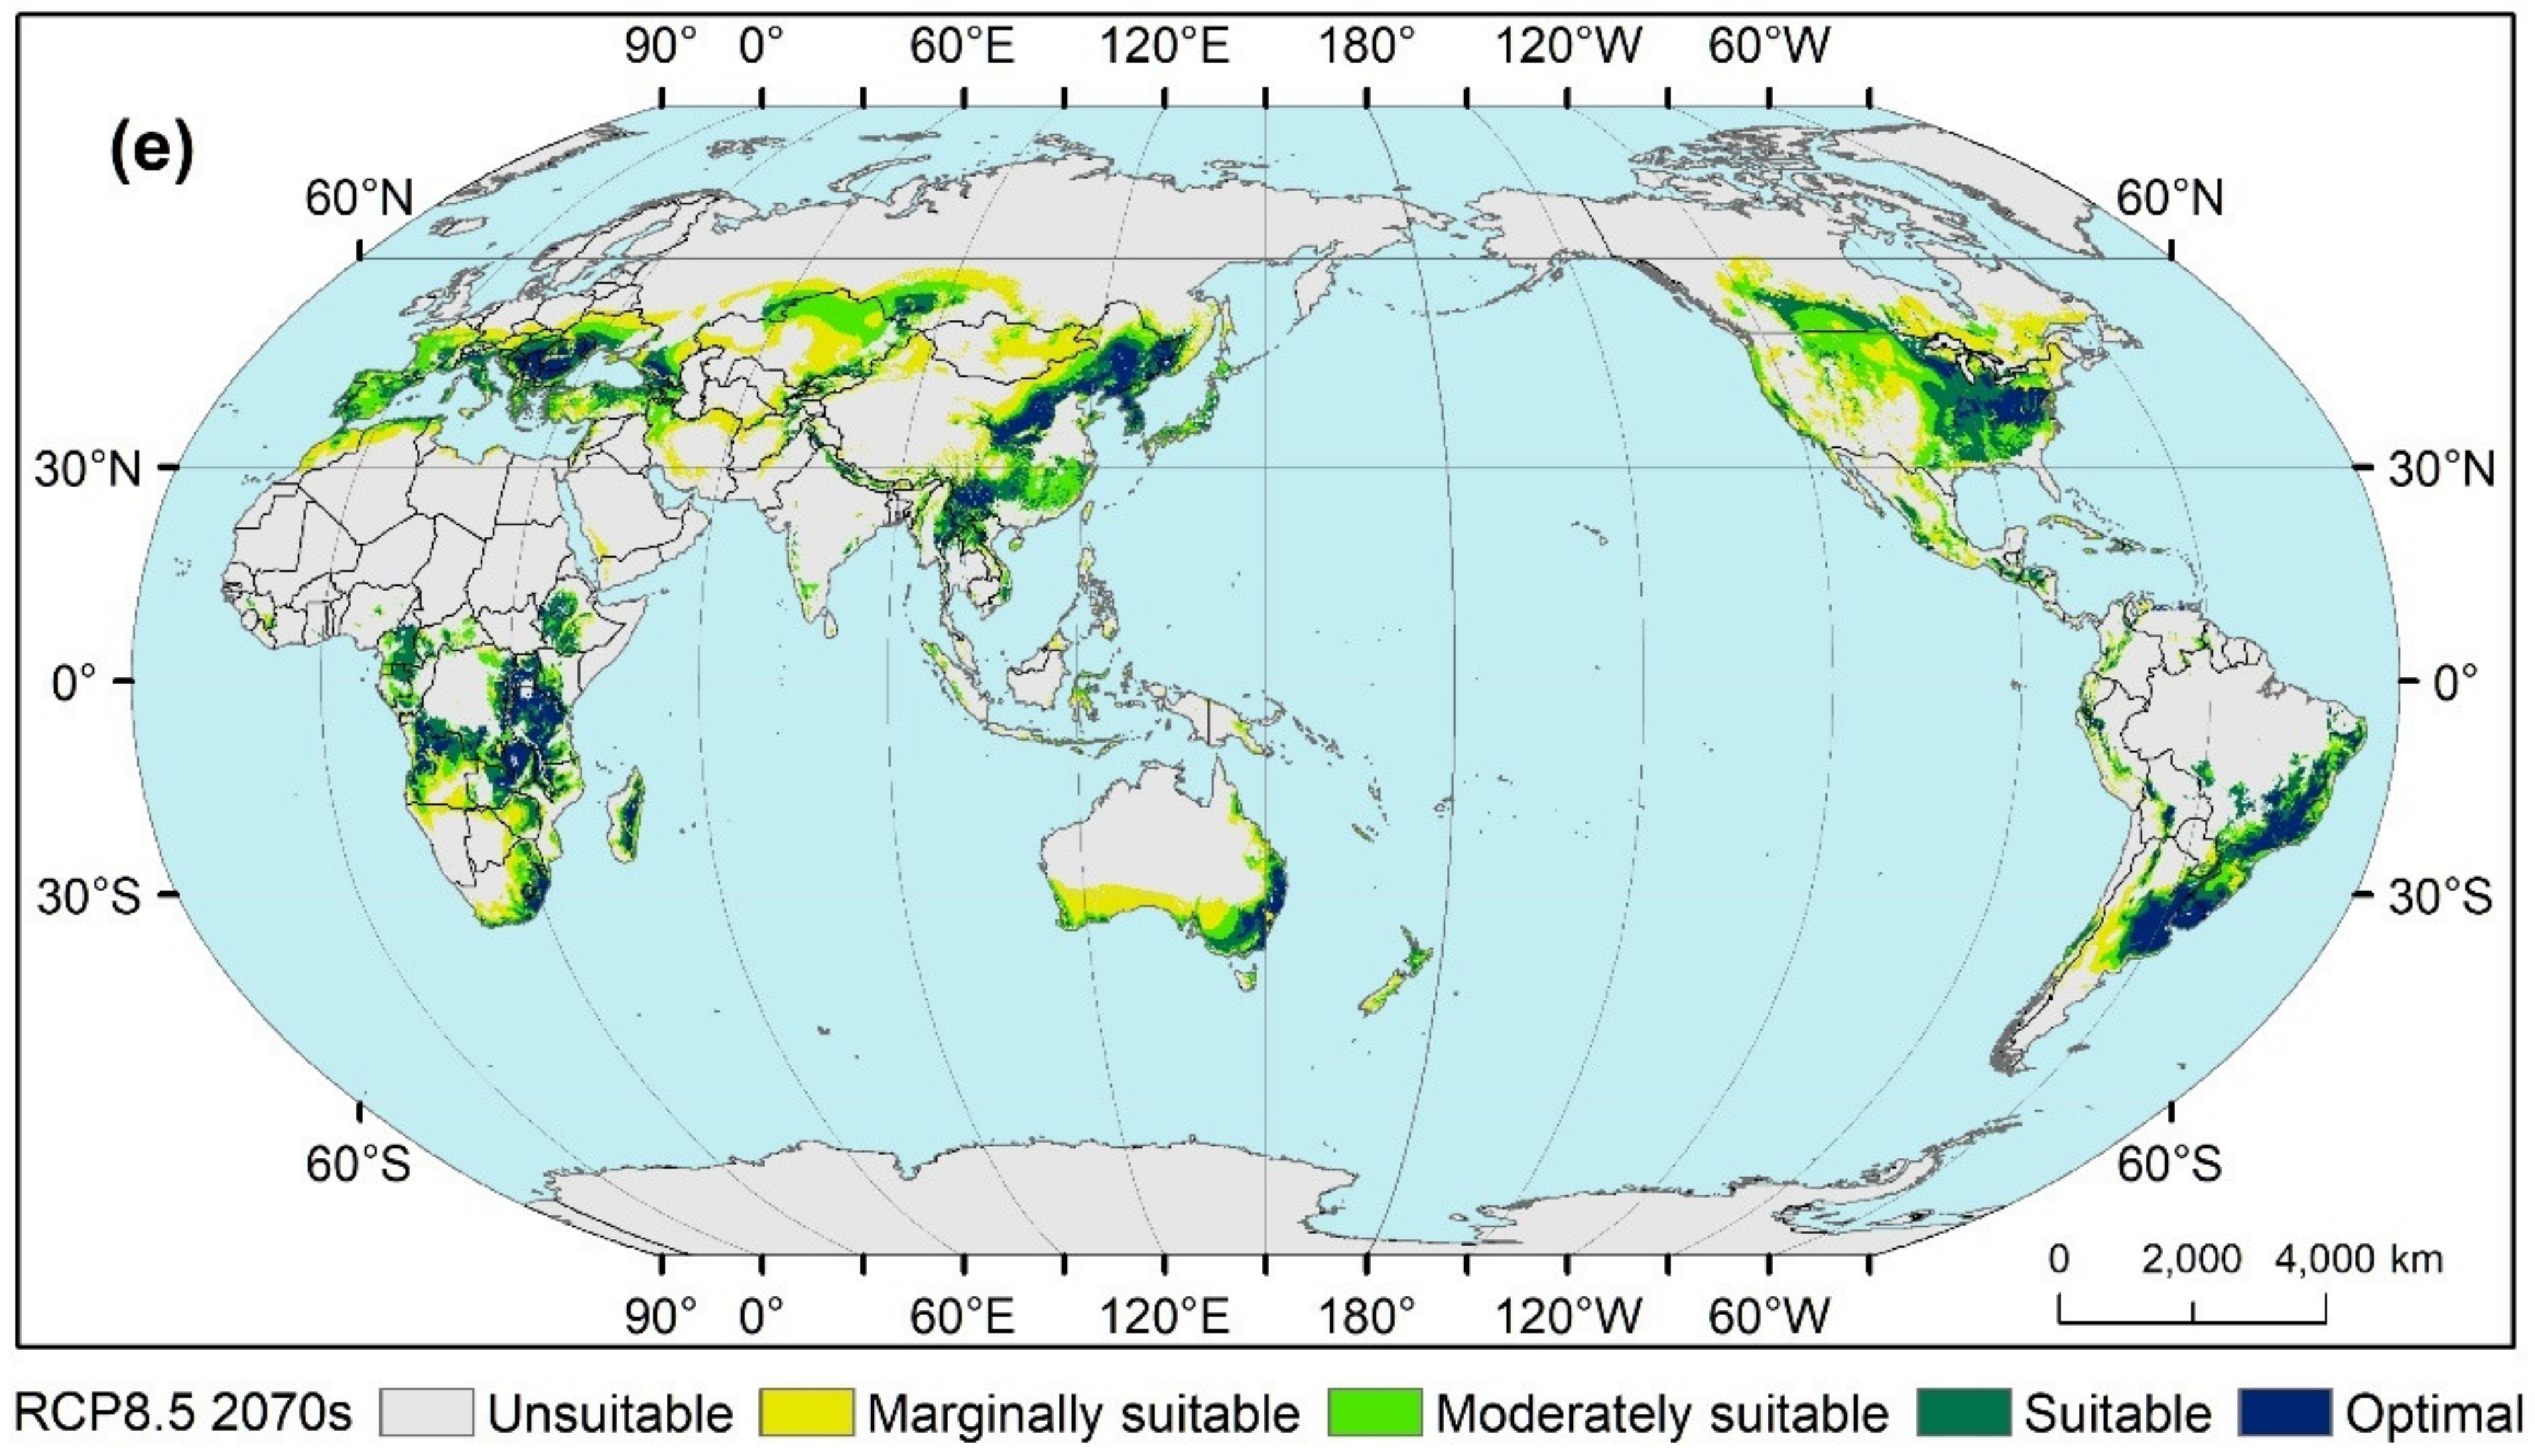
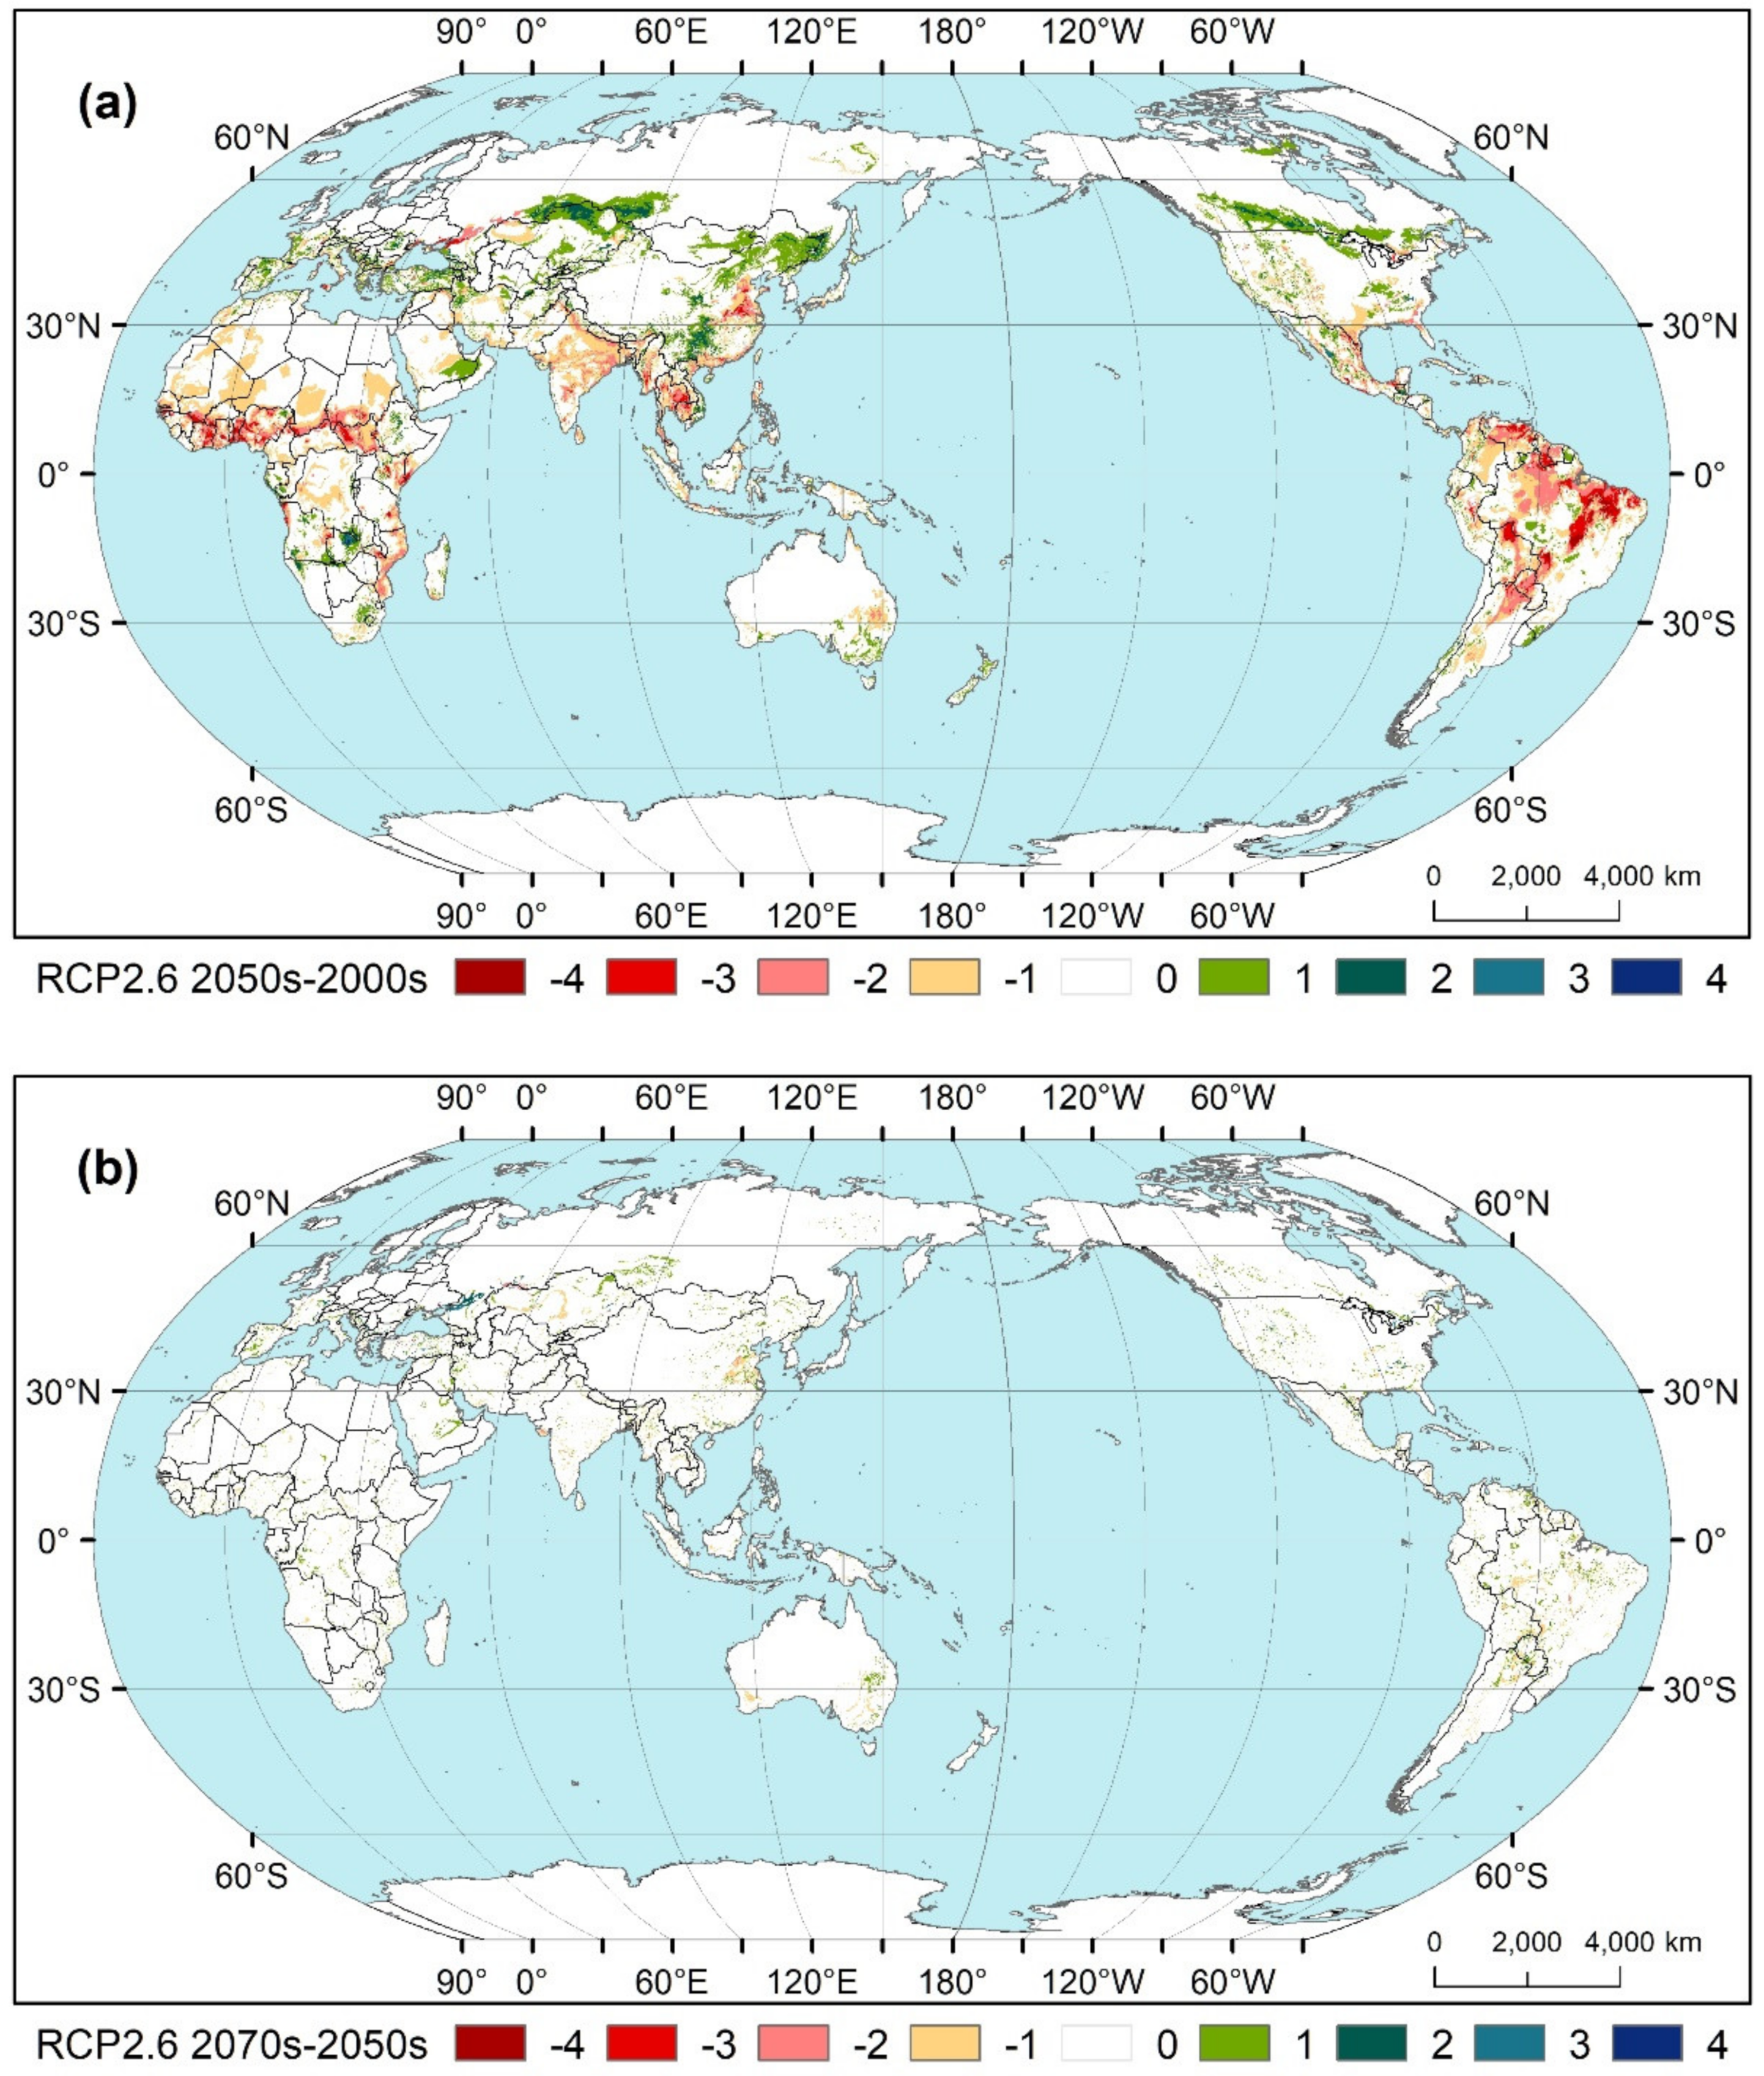
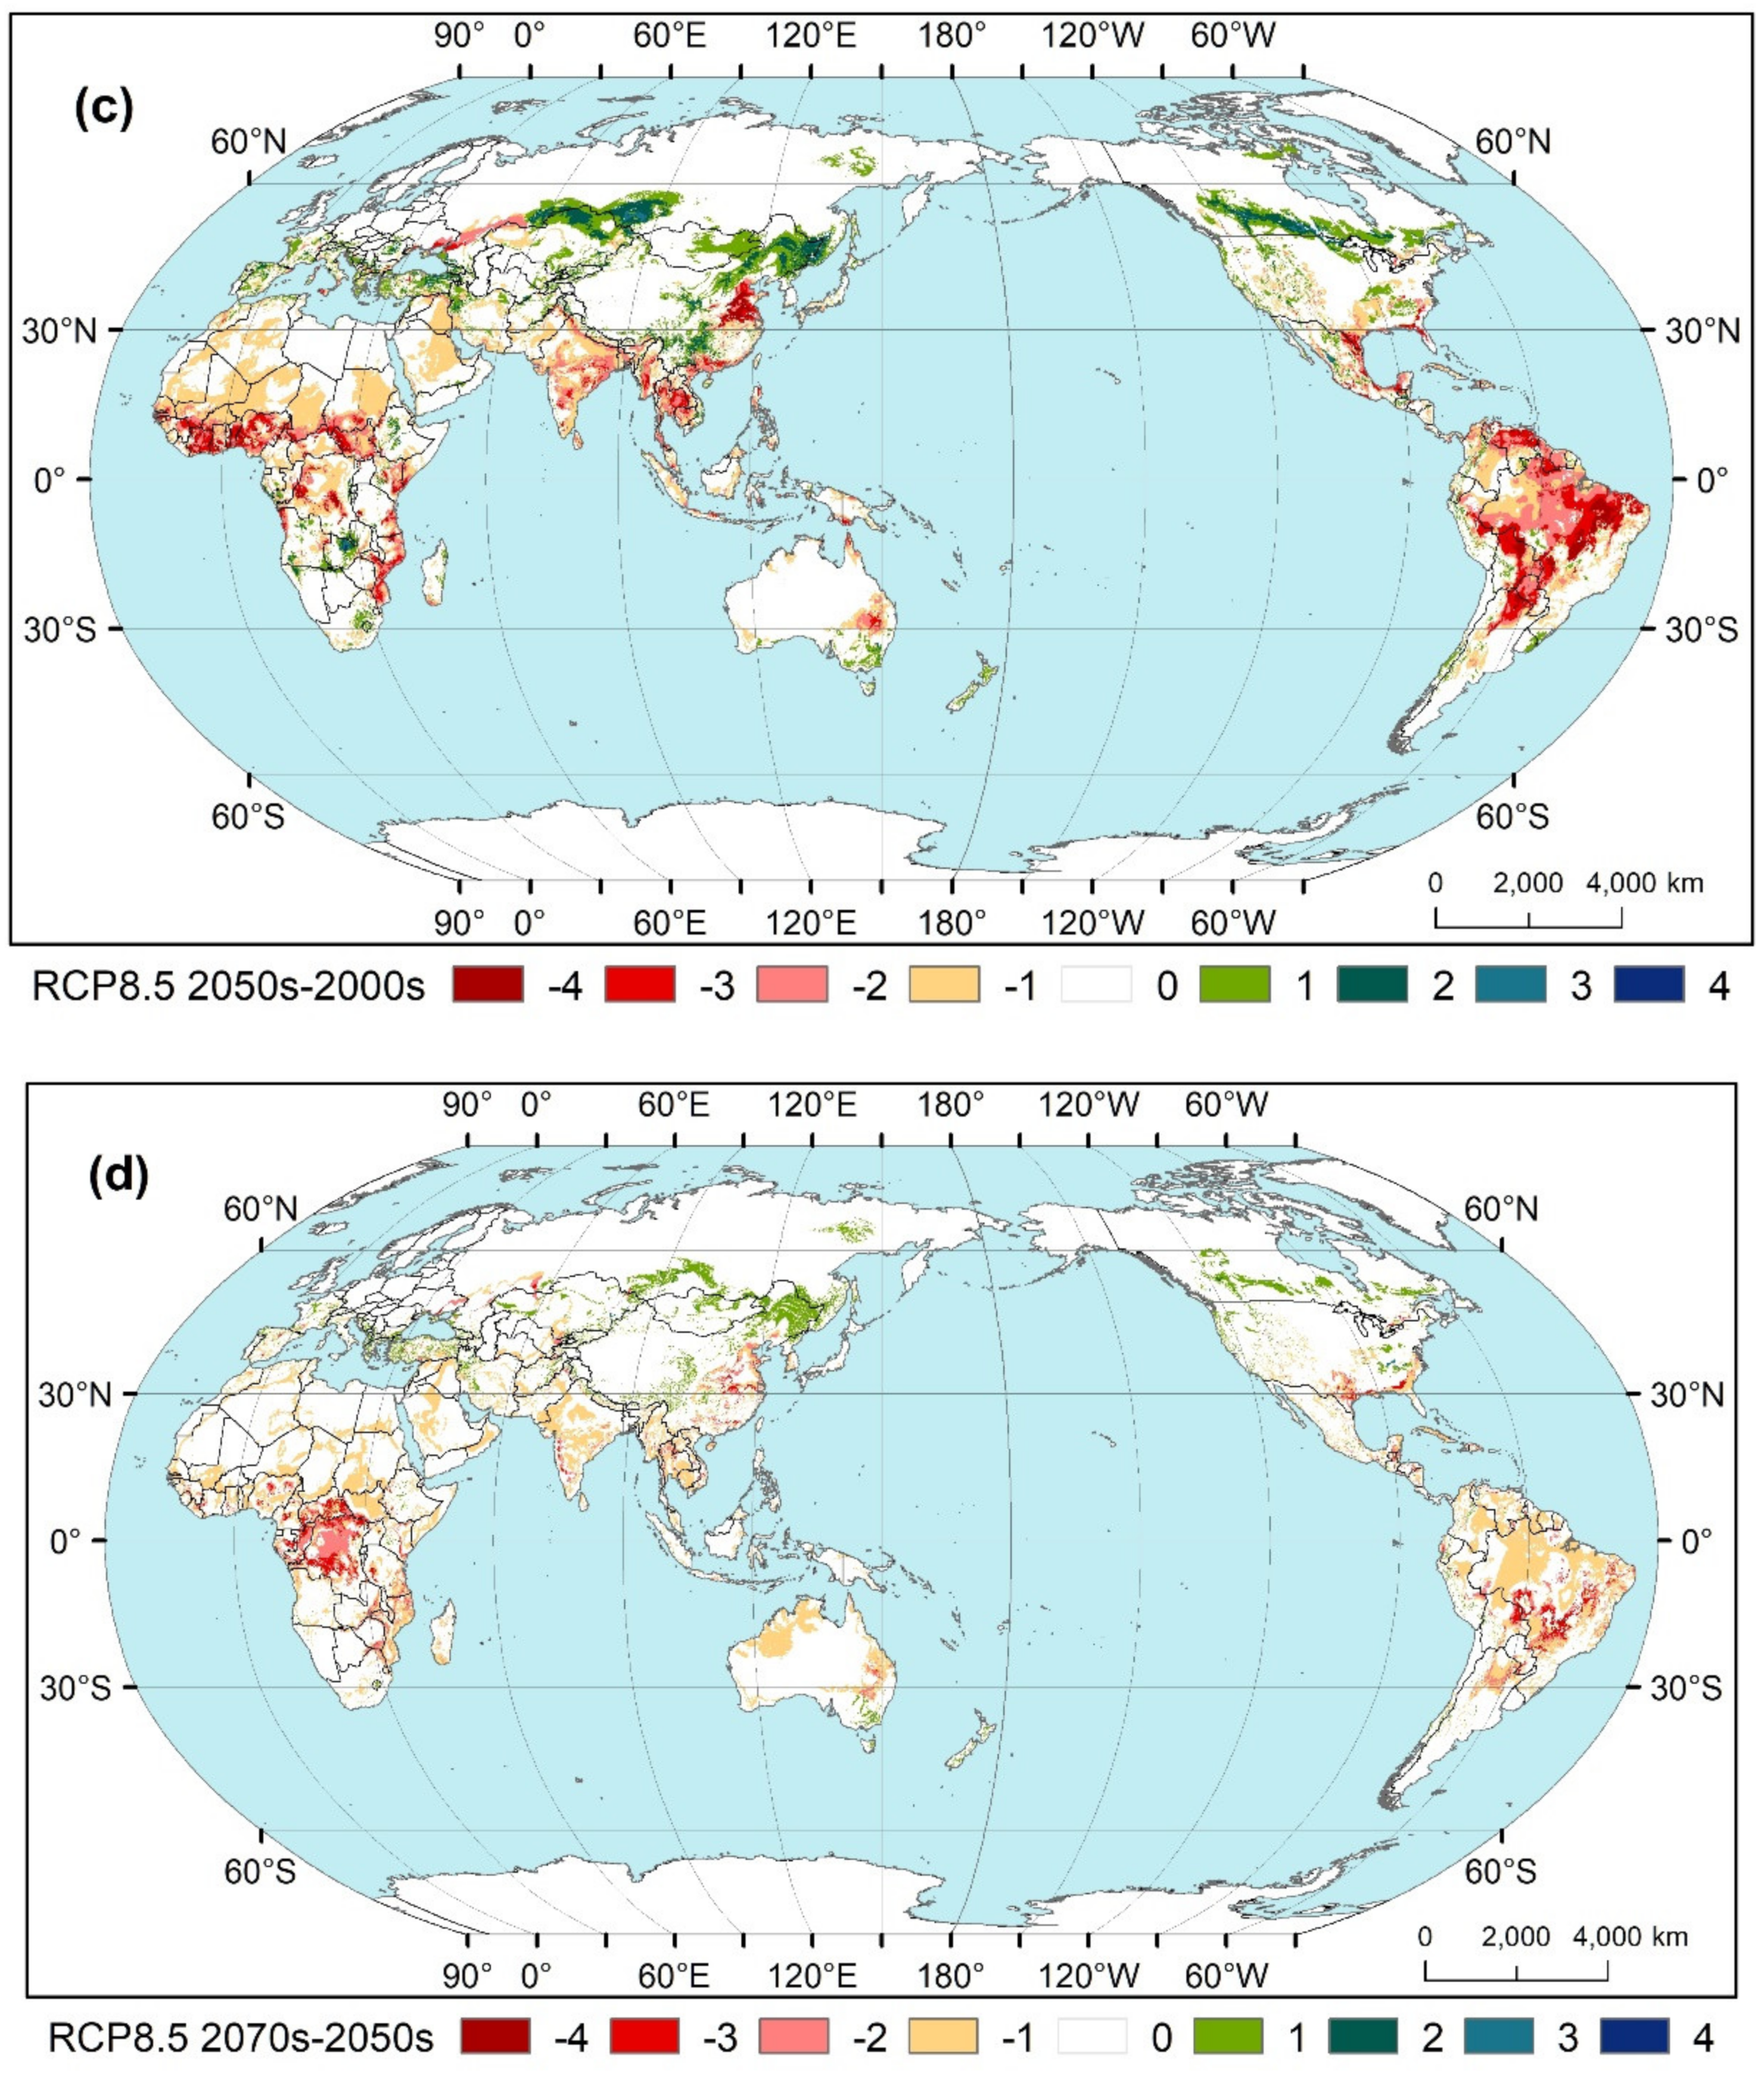
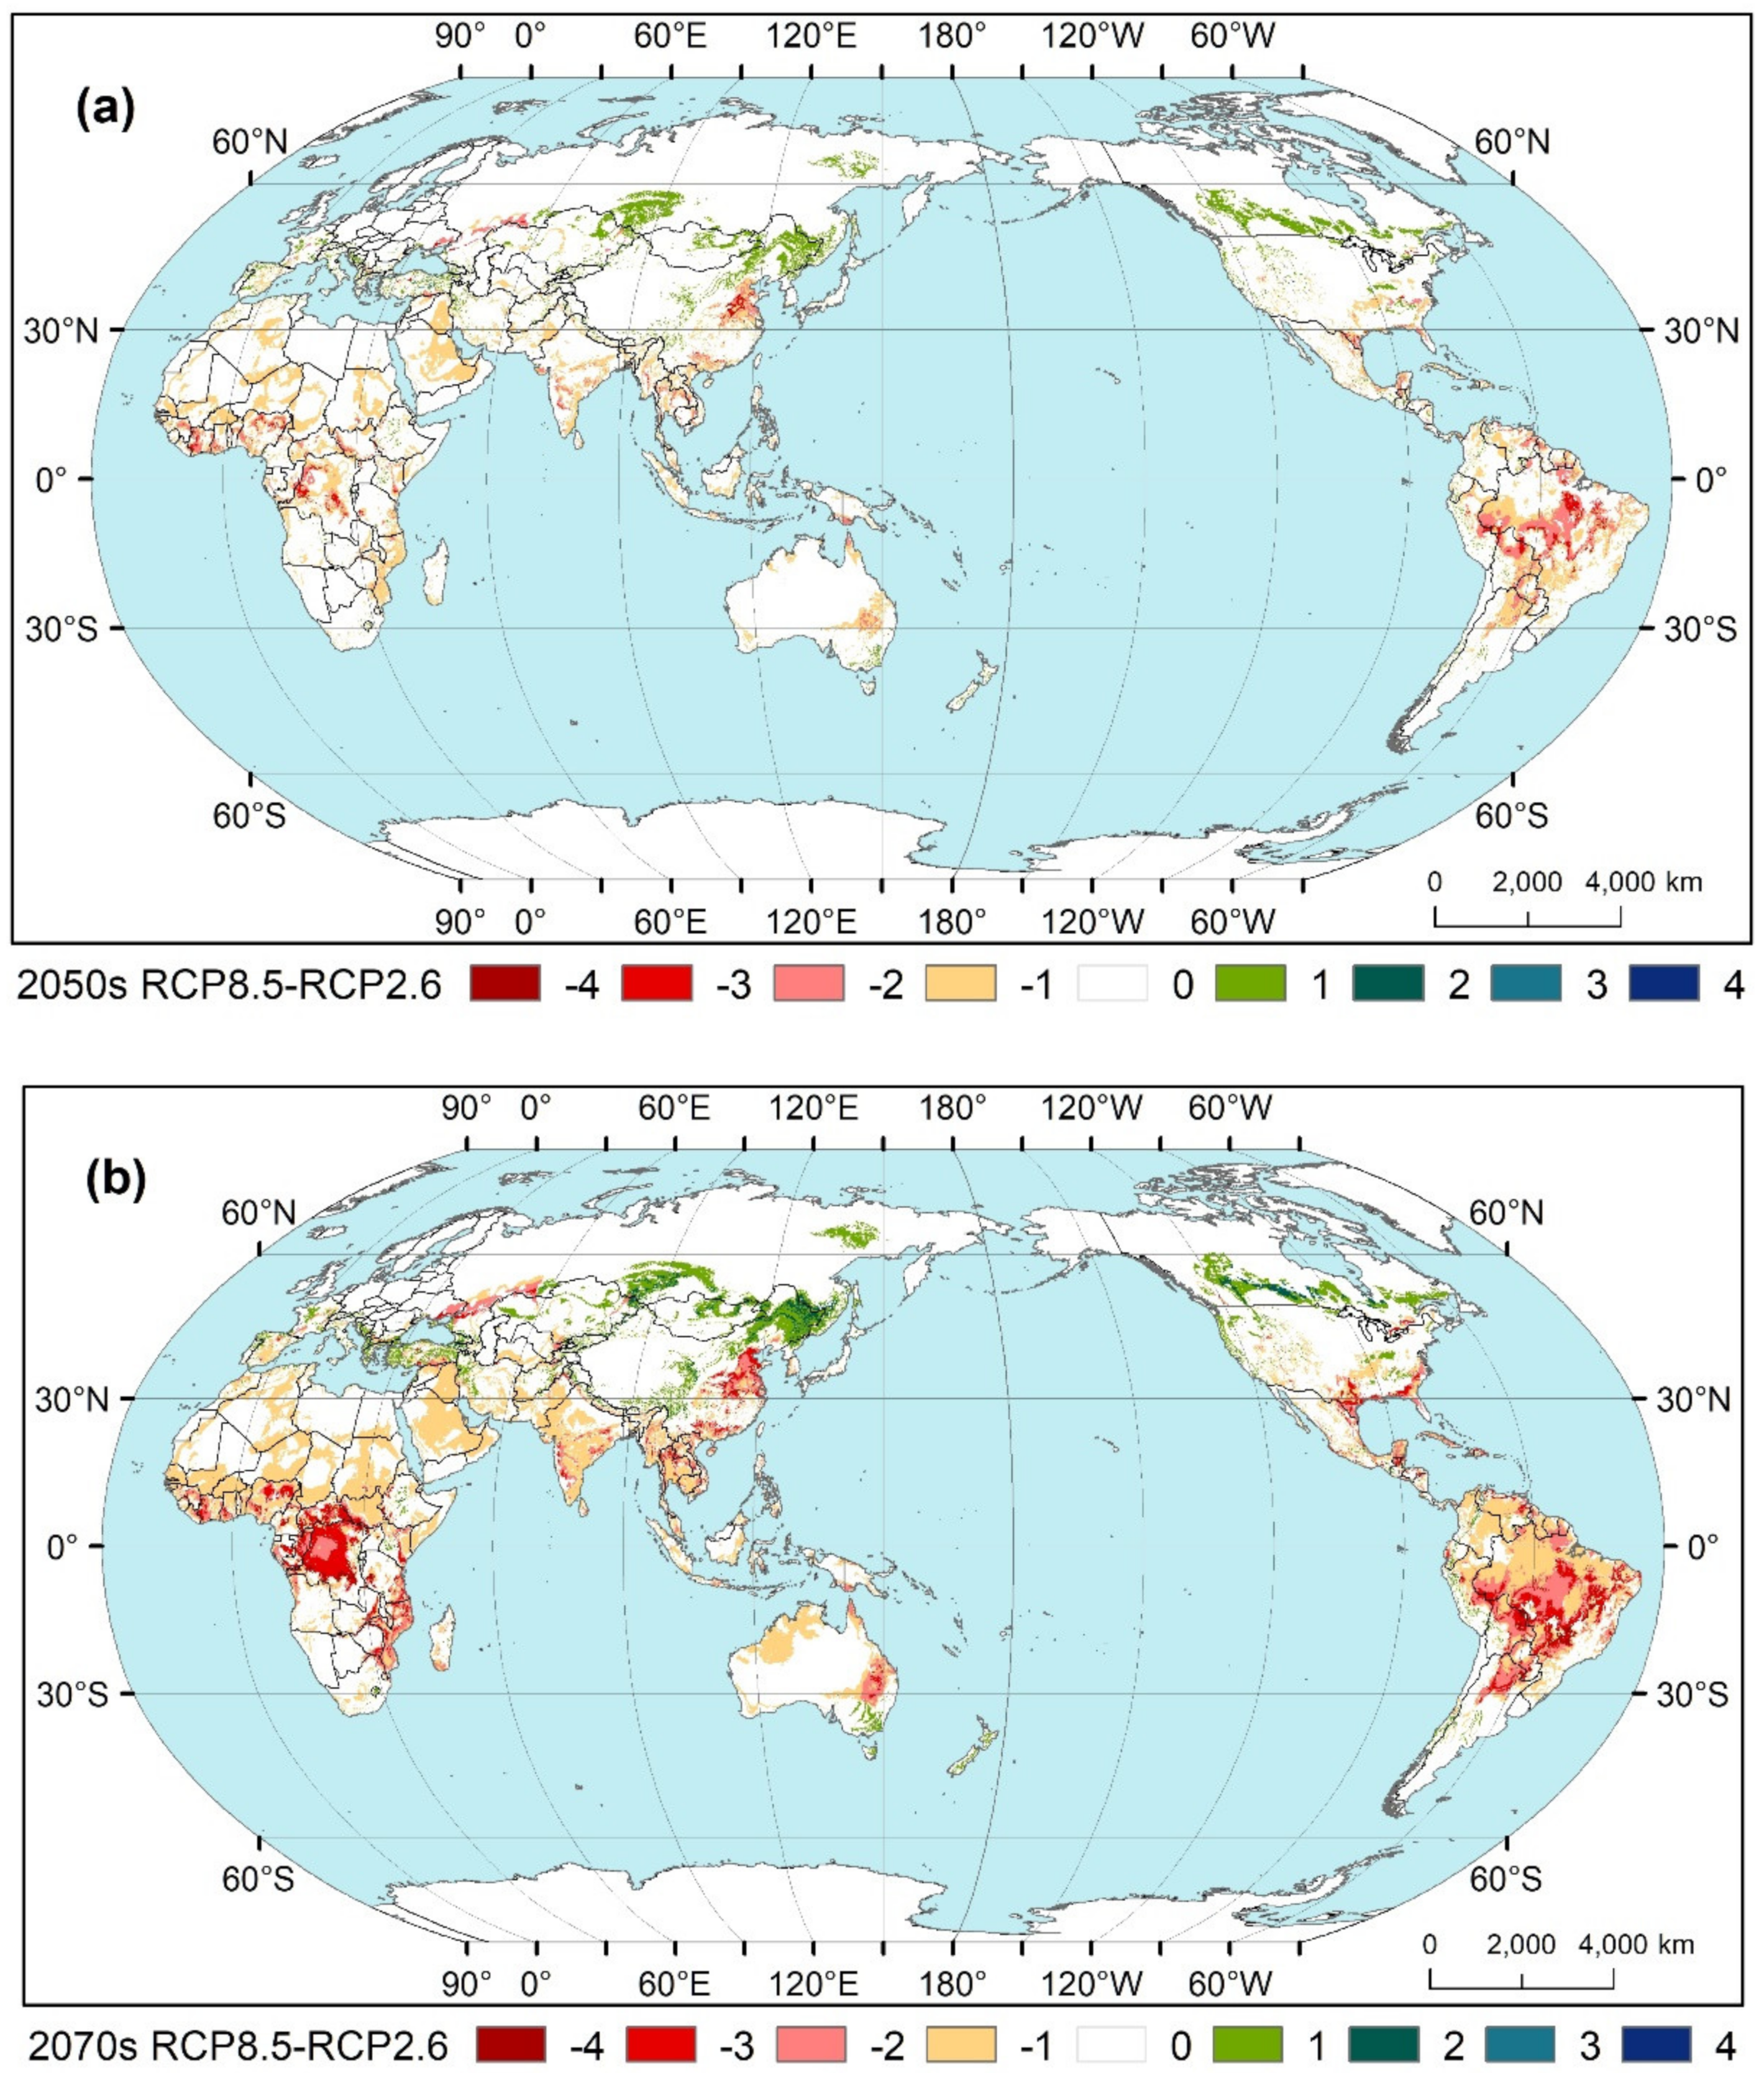
3.3.1. Spatial–Temporal Patterns

Worldwide distribution patterns of land suitability for maize during the three periods and under the two RCP scenarios are shown in Figure 4. It can be seen that in the past (Figure 4a) the areas more suitable for maize were mainly in north-eastern and northern China, South East Asia, eastern Australia, India, southern Europe, Central and East Africa, eastern United States, and south-eastern parts of South America. Under RCP2.6 (Figure 4b,c), this distribution will change substantially by the 2050s. Specifically, many areas currently considered highly suitable in Brazil, the Sahel, India, and South East Asia are projected to become unsuitable, whereas some areas earlier considered unsuitable in north-eastern China, eastern Mongolia, and southern Canada will become marginally suitable. The distribution in the 2070s will be mostly the same as that in the 2050s, marked by an overall decrease in highly suitable areas, mainly in South America, and slight increase in marginally suitable areas along the Russia–Kazakhstan border. Under RCP8.5 (Figure 4d,e), compared with the situation during the 2000s, most of India, South East Asia, the Sahel, inland Brazil, many areas of northern China, and costal Mexico are projected to become unsuitable for maize by the 2050s, whereas north-eastern China, Kazakhstan, Russia, and southern Canada will be more suitable. A similar trend, albeit with smaller changes, is projected for the 2070s, during which most of the Congo basin, northern China, and northern Argentina will also basically cease to be suitable for maize cultivation.
Changes in land suitability for maize between different periods under the same RCP scenarios are shown in Figure 5. It can be seen that under RCP2.6 (Figure 5a,b), compared with the situation during the 2000s, overall, areas at low altitudes will become less suitable for maize cultivation by the 2050s, whereas those higher latitudes will become markedly more suitable and those in some temperate regions will become slightly more suitable. The overall trend and regional differences seen in the 2050s will remain more or less the same in the 2070s, although the changes will be smaller and confined to fewer areas. Under RCP8.5 (Figure 5c,d), compared with the situation during the 2000s, by the 2050s land suitability for maize will increase mainly at higher latitudes in the northern hemisphere whereas those in the tropics and even at mid latitudes including the North China Plain will become markedly unsuitable. This pattern will remain broadly similar, albeit with relatively small changes, in the 2070s, although the Congo basin may see a marked decrease in land suitability for maize.
Differences in land suitability for maize cultivation under different RCP scenarios during a given period are shown in Figure 6. It can be seen that during the 2050s and the 2070s, the suitability for maize cultivation will be less at low and middle latitudes and more at high latitudes under RCP8.5 than that under RCP2.6; such differences can be much more dramatic and widespread during the 2070s, although their spatial distribution will be similar.

3.3.2. Statistical Characteristics

Areas worldwide suitable to different extent for maize cultivation at present and in the future and their proportions are shown in Table 4. The total area suitable for maize globally was 5901 mha during the 2000s and will decrease to about 5350 mha, or by approximately 9%, in the 2050s and in the 2070s under RCP2.6; under RCP8.5, the area will decrease further, to 4640 mha in the 2050s (a 21.37% decrease) and to 3953 mha in the 2070s (a 33.01% decrease). Of the total suitable area, the proportion of marginally suitable areas is projected to be the largest under various combinations of RCPs and periods, increasing slowly from 30.42% during the 2000s to 33.49% under RCP8.5 in the 2070s. The proportion of moderately suitable areas will always be approximately 27% and that of suitable areas, 22%, equivalent to an increase of about 1% and 2%, respectively, from the proportions during the 2000s to those under RCP8.5 in the 2070s. However, the proportion of the optimal area shows a marked decrease, from 21.78% during the 2000s to 15.81% under RCP8.5 in the 2070s. The areas under various suitability grades will also generally decrease under different combinations of RCPs and periods compared to those during the 2000s, but with significant differences in the extent of decease: the percentage changes in areas are similar for marginally suitable, moderately suitable, and suitable, being −5% under RCP2.6, −16% under RCP8.5 in the 2050s, and −28% under RCP8.5 in the 2070s, whereas the corresponding decreases in the area optimally suited for maize will be approximately −26%, −40%, and −50%.
In terms of the effects of the period and the RCP on the changes relative to the values during the 2000s, the decrease will be markedly greater under RCP8.5 than that under RCP2.6 both in the total suitable area and in the areas under different suitability grades, especially in the 2070s. The decrease will be slightly greater in the 2070s than that in the 2050s under RCP2.6 but markedly so under RCP8.5. However, the extent of decrease between the 2050s and the 2070s will be markedly smaller than that between the 2000s and the 2050s.

4. Discussion

4.1. Impacts of Climate Change on Global Land Suitability for Maize Cultivation

The results of the present study indicate that, under climate change, the global maize suitability would decrease in comparison with the 2000s, especially under higher emission scenario (RCP8.5) and (or) in the longer future (2070s) (Figure 4, Table 4). Spatially, the suitability is likely to substantially decrease in the low latitudes, even mid latitudes, which are historically overall highly suitable for maize, while only slightly increase in higher latitudes. Statistically, the total area of maize suitability will reduce under all the RCP-period combinations, featured by the remarkable reduction of areas with higher suitability.
These results match those obtained by Ramirez-Cabral et al. [17] and Zabel et al. [4], namely that as a result of climate change, the tropical regions will suffer the greatest losses in terms of maize suitability, while poleward regions may experience an increase. This again confirms latitudinal differences in the effects of climate change on land suitability for maize. However, the present study is different in that it predicts that not only the low latitudes, but also the mid latitudes are likely to suffer, as evident in the decrease in the land suitability for maize in northern China and northern Argentina in the 2070s under RCP8.5. Besides, our results also show that the areas more suited to maize, especially those that are ideal or optimal for maize cultivation, may experience a dramatic reduction. These disparities are probably due to the differences in the climate scenarios, in the GCMs, and in the modeling methods used, as well as due to the different periods for which the projections were made. Finally, our results were also in overall agreement with the climate-based distribution of maize as modeled by Ramirez-Cabral et al. [17], while ours revealed greater spatial heterogeneity. The difference was probably because we had used climatic as well as nonclimatic factors for assessing suitability, rather than using climatic factors alone—the pronounced zonality of the latter may have contributed to making the results more homogeneous.
Earlier studies have pointed out that the production of maize can be affected more by changes in its harvested area than by its yield [64], although substantial reductions are also predicted in average yields as a result of climate change [65]. Based on our results and earlier findings, we propose that with the decrease in total area suitable for maize, further the decrease in the area harvested, and the decrease in productivity of maize, world maize production is likely to decrease substantially. The decrease in area will be particularly marked in regions that are highly suited to maize, which account for the lion’s share in global maize production. Given the critical role of maize as a staple food, and the growing demand for it due to population growth and socioeconomic development [66], the above-mentioned changes have serious implications for global food production and threaten food security, livelihoods, social stability, and sustainable development, especially in the case of developing countries. Therefore, urgent measures are necessary to mitigate and adapt to the adverse impacts of climate change and to reduce the risk of failed crop production.
In addition, pairwise comparisons (Figure 5 and Figure 6, Table 4) show that declines in suitability for maize during the 2050s compared to the situation during the 2000s are remarkably more widespread and intense than those between the 2050s and the 2070s, and the declines under RCP8.5 are greater than those under RCP2.6. These observations further highlight the urgency of early adoption of measures to reduce emissions of greenhouse gases.

4.2. Impacts of Climate Change on Major Maize Producers

According to the FAO [67], the top five producers of maize, in the following order, are the United States of America, China, Brazil, Argentina, and Ukraine and account for 71% of the global production. Therefore, we chose these countries to explore the potential effects of climate change on land suitability for maize cultivation (Table A6). In the past, in most of these nations, the area suited to maize cultivation at least to some degree accounted for more than 50% of the total land area—for Ukraine and Brazil, the share was more than 90%. However, these figures can change markedly owing to climate change. Specifically, compared to the 2000s, the total area suitable for maize is likely to increase on average by 7.64% in China for all the combinations of RCPs and periods but decrease slightly in USA, Ukraine, and Argentina, the peak decrease, under RCP8.5 in the 2070s, being −10.11% in USA, −15.21% in Ukraine, and −23.13% in Argentina. The decrease in Brazil will be approximately −27% under RCP2.6 and as much as 63% under RCP8.5. These findings are consistent with the earlier ones, which also predict a decrease in Brazil and Argentina and a slight increase in China [17]. However, our findings for USA, namely a decrease up to 10%, differ from those of Ramirez-Cabral et al. [17], who predicted an increase of up to 16%. We attribute these differences to the differences in data, the methods used, and the study periods.
In terms of the levels of suitability, the changes relative to the 2000s can vary across the producers. However, the common thing is that all these nations are likely to see sharp decreases in the area considered optimal for maize cultivation, by 17.16–42.91% for USA, 7.46–16.38% for China, 31.6–71.47% for Brazil, 34.24–53.96% for Argentina, and 73.47–86.39% for Ukraine. Although these findings agree with the earlier ones, namely that the acreage optimally suited for maize will decrease in Argentina, Brazil, and USA [17], our findings differ in that we predict larger reductions in such acreage and in all the countries, the differences being attributable mainly to the methods. To be specific, we applied the law of the minimum (Section 2.4), which means that to qualify as optimally suitable, each variable for a given area has to be highly favorable for maize, an obviously more stringent criterion—and the one more likely to consider a given area as unsuitable because of an undesirable change even in a single variable.
It can thus be concluded that for the major producers, the total area suitable for maize will generally decrease in the future, especially at low latitudes, except China, which is likely to record a slight increase. The crucial insight is that the small gains in areas less suitable cannot compensate for the larger losses in areas more suitable. Particularly, areas optimally suited will be the most vulnerable and will lead to maximum adverse impact, whereas the increase in area less suitable means little because those areas are also low in productivity. Therefore, our analyses on the national scale point to a bleak future for maize cultivation and production.

4.3. Feasibility of Methods and Future Research

The earlier studies on suitability generally lacked a rigorous and objective selection of the influencing variables; as a result, the results of the assessments were less accurate especially with large-scale assessments, and were focused mostly on climatic variables, ignoring the effects of nonclimatic factors. Considering these research gaps, and based on four assumptions (Section 2.1), we proposed a method for assessing the land suitability for crop cultivation that was comprehensive as well as accurate even when used for large-scale assessments (Section 2.3). On the one hand, we included the critical environmental variables that affect cultivation through statistical analyses of large data sets—a more objective method—instead of relying on existing literature or expert opinion, which are often locally applicable and possibly subjective. On the other hand, we also included nonclimatic factors in addition to the commonly used climatic ones. We then applied the method to assess on a global scale the degree to which different areas were suited to maize cultivation and estimated changes in their extent as a result of climate change (Section 2.4). The criteria we established for maize suitability assessment proved scientifically reasonable, generally consistent with existing knowledge of physiological requirements of maize in terms of both critical environmental variables and their thresholds (Section 3.1). We further tested the accuracy of those predictions in terms of both overall accuracy and spatial consistency by matching the predictions with data on the distribution of maize obtained from multiple sources and by multiple methods (Section 3.2). Based on the extent to which the predictions fitted the data, we concluded that compared to the existing approaches to assessing suitability, including the FAO land-evaluation approach and the species distribution modeling approach, our method is more objective, comprehensive, efficient, and reliable. The rationality and usefulness of our method can be highlighted in the case of large-scale assessment of suitability for crops with wide geographical range and great regional differences in cultivars, such as maize.
Our projections of land suitability for maize, a staple food, have major implications (Section 3.3, Section 4.1 and Section 4.2) for global and regional food production as well as sustainable development. We also emphasize that for the first time, our research clarified the environmental variables crucial for global-scale maize cultivation. Our method, after appropriate revisions, can be extended to other crop species. Therefore, our study contributes to research on the assessment of suitability and food security in the context of climate change in terms of methods as well as data.
We are also aware that the present study has some limitations and can be improved. First of all, we employed a numerical (statistical) approach to develop key variables controlling land suitability for crop cultivation. This produced generally reasonable results of variables and criteria for maize suitability assessment, as well as reliable estimations of global-scale maize suitability. We realized that, however, as pure model work our method lacks consideration of actual crop growth. As a result, there is no explicit connection of the chosen variables to maize growth, and some of the resulting thresholds can be inconsistent with well-known determinants of maize growth. For example, the variable BIO10 (mean temperature of the warmest quarter) may be related to extremely high temperatures during anthesis and post-anthesis growth stages that can adversely affect seed set [68,69]. Additionally, a huge amount of precipitation in the wettest quarter (BIO16) may cause aeration or flooding problems, delay flowering and reduce grain yield [70,71]. Consideration of such effects is necessary to ensure the validity of the approach. That is to say, our research focuses on the data level and seeks to explore the relationships between physical conditions and crop distribution and further establish criteria for suitability assessment through data analyses. The method can contribute to the fast and generally reliable estimation of overall situations of land suitability for crops on a large scale. However, in future work it is vitally important to consider the chemical, biological, thermal, and hydrological processes by which crop productivity is determined, and clearly link the criteria to these processes, to facilitate more accurate assessments.
Secondly, as mentioned in Section 2.1, in screening the variables for assessment we ignored regional differences [32] or potential changes [34] in the physiological requirements of maize. This decision may introduce some uncertainties in the choice of variables, which, in turn, affects the results. Nevertheless, our choice can be justified on the following grounds.
(1)
Our research was aimed at proposing a simple yet effective method for large-scale assessment rather than focusing on a specific case study.
(2)
The core of our method is objective and rigorous selection of crucial environmental variables that influence large-scale assessment of suitability, not the characterization of regional differences and potential changes in the requirements of maize.
(3)
Currently no data are available on regional differences in the physiological requirements of maize, which have been neither fully expressed nor characterized. Similarly, despite the achievements of plant breeding, it is difficult to predict, in fine detail, what the climatic and other requirements of the newer varieties would be—or even if the requirements would be different at all. We do not know of any such global data product.
However, we agree that in future case studies both spatial differences and temporal changes in physiological requirements of crops should be considered so long as the required data are available. Incorporating local conditions in selecting the crucial variables and in assigning appropriate weightings to those variables will help in establishing the criteria for suitability assessment that are tailored to local conditions and are therefore likely to give more reliable results.
Thirdly, we used the maize distribution data (grid cells with FMHA no less than 1%) to establish criteria for maize suitability assessment based on the idea that such grids should be physically suited to maize cultivation at least to some degree. However, we realize that other data, such as maize yield can also be indicative for the suitability. Areas with high maize yields generally have favorable physical conditions for its growth. The single consideration of maize distribution and ignorance of differences in maize yield worldwide could possibly bias the development of suitability assessment criteria. Nevertheless, actual maize yield can be determined by various factors, including physical suitability, and socioeconomic conditions such as fertilization, irrigation, technology. Therefore, we argue that in future work yields should be considered but carefully used to provide further insight into physical requirements of maize, and promote the detection of suitability parameters.
Last but not least, we considered simply physical factors in designing the criteria for assessing suitability. These factors are sufficient to determine suitability on a large scale; however, ignored anthropogenic factors such as infrastructure, technology levels, crop production practices (tillage, crop rotation, etc.) can also influence the properties of soil and the effect of some environmental factors and thus affect suitability on a local scale [72,73,74,75]. Although taking such factors into account may make the assessment more accurate, it will be possible only if the data at sufficient temporal and spatial resolution are available and so long as their impacts are clear and quantified.

5. Conclusions

Accurately assessing the land suitability for cultivating a given crop can provide a scientific basis for ensuring food security and becomes urgent in the context of climate change. The present study proposed a simple yet reliable method for large-scale, objective, and comprehensive assessment of suitability and applied it to global cultivation of maize. The suitability was assessed in two steps: (1) developing the appropriate criteria and (2) assessing the suitability for three periods (the 2000s, the 2050s, and the 2070s) and under two RCP scenarios (RCP2.6 and RCP8.5).
As a result of climate change, the area suitable for maize will decline sharply at low latitudes and even at mid latitudes, although some high-latitude areas that are currently unsuitable will become more suitable. The total area considered suitable will keep shrinking, with a marked decrease in area particularly suited to maize cultivation. The current major maize-producing nations will generally experience significant reductions in the area suited to maize, such reductions being greater under RCP8.5 in the 2070s than under RCP2.6 in the 2050s. We therefore warn that climate change poses a serious threat to global maize production, and it is imperative to take actions to cope with that threat, including not only mitigation of climate change, but adaption measures such as variety breeding, shifting cultivated areas, and improved management practices.
The predictions were generally consistent with actual data on worldwide distribution of maize in the past and also with future projections on global and regional scales, proving the reliability of our method for large-scale assessment of suitability. However, incorporating regional differences and potential changes in the physiological requirements of crop varieties, as well as the influences of socioeconomic factors, will make such assessments even more accurate.

Author Contributions

Y.G. conducted the research, analyzed the data and wrote the paper; A.Z. processed the data; Y.Y. guided the research and did extensive updating of the manuscript; J.W. conceived the research and provided project support; P.S. helped process the data. All authors have read and agreed to the published version of the manuscript.

Funding

This research was funded by the National Key Research and Development Program of China, grant number 2016YFA0602402 and the China Scholarship Council, grant number 201806040148.

Data Availability Statement

All data and materials are available upon request.

Acknowledgments

We are grateful to the Pardee Center and the Department of Earth and Environment at Boston University for general support to Yuan Gao for conducting this research. We thank Nadiezhda Y. Z. Ramirez-Cabral for providing the historical maize occurrence data they processed. We also thank Qi Zhang for useful discussions and constructive comments on overall research design.

Conflicts of Interest

The authors declare no conflict of interest.

Abbreviations

RCPRepresentative concentration pathway
GCMgeneral circulation model
SDMspecies distribution model
SAGECenter for Sustainability and the Global Environment
FMHAfraction of maize-harvested area
SPAMSpatial Production Allocation Model
MIRCA2000The global data set of monthly irrigated and rainfed crop areas around the year 2000
PDFprobability density function
KL divergenceKullback–Leibler divergence

Appendix A

Table A1. List of data employed in this study.
CategoryName (Content)Source and ReferenceResolutionUnitUsage
Maize distribution
data
Maize harvested areaCenter for Sustainability and the Global Environment (SAGE), University of Wisconsin-Madison [35]5′ × 5′,
2000s
%Development of criteria for maize suitability assessment
Maize occurrence data[17]2014,
point
N/AValidation of historical maize suitability assessment results
Maize harvested area (irrigated, rainfed and total)The global data set of monthly irrigated and rainfed crop areas around the year 2000 (MIRCA2000), Institute of Physical Geography,
Goethe University Frankfurt [36]
5′ × 5′,
2000s
%
Maize physical and harvested area (irrigated, rainfed and total) based on productivity(Spatial Production Allocation Model) SPAM 2005 V2.0, MapSPAM
[37]
5′×5′,
2005
%
Environmental dataHistorical climate:
WorldClim 1.4 variables
Geospatial and Farming Systems Research Consortium (GFC)
[38]
5′ × 5′,
1970–2000
N/ADevelopment of criteria for maize suitability assessment;
historical maize suitability evaluation
Future climate:
WorldClim 1.4 downscaled (CMIP5) climate data
Geospatial and Farming Systems Research Consortium (GFC)
[38]
5′ × 5′,
2050s (2041–2060),
2070s (2061–2080); 13 climate models *
N/AFuture maize suitability evaluation
Soil:
WISE derived soil properties (V1.2)
International Soil Reference and Information Centre (ISRIC)
[40]
5′ × 5′,
2012
N/ADevelopment of criteria for maize suitability assessment;
Historical and future maize suitability evaluation
Terrain:
Global Median Elevation
Food and Agriculture Organization (FAO)
[39]
30″ × 30″,
2000
m
Terrain:
Global Terrain Slope
Food and Agriculture Organization (FAO)
[39]
5′ × 5′,
2000
N/A
* The 13 CMIP5 (Coupled Model Intercomparison Project 5) GCMs (general circulation models) used for future projections: ACCESS1-0; BCC-CSM1-1; CCSM4; CNRM-CM5; GFDL-CM3; INMCM4; IPSL-CM5A-LR; MIROC5; MIROC-ESM; MIROC-ESM-CHEM; MPI-ESM-LR; MRI-CGCM3; NorESM1-M.
Table A2. The original and selected environmental variables.
CategoryNameDefinition
ClimateBIO1 **Annual mean temperature
BIO2 **Mean diurnal range (mean of monthly (max temp-min temp))
BIO3 **Isothermality (BIO2/BIO7) (* 100)
BIO4 *Temperature seasonality (standard deviation * 100)
BIO5 *Max temperature of warmest month
BIO6 *Min temperature of coldest month
BIO7Temperature annual range (BIO5–BIO6)
BIO8 **Mean temperature of wettest quarter
BIO9 *Mean temperature of driest quarter
BIO10 **Mean temperature of warmest quarter
BIO11 *Mean temperature of coldest quarter
BIO12 *Annual precipitation
BIO13 *Precipitation of wettest month
BIO14Precipitation of driest month
BIO15Precipitation seasonality (coefficient of variation)
BIO16 **Precipitation of wettest quarter
BIO17Precipitation of driest quarter
BIO18Precipitation of warmest quarter
BIO19Precipitation of coldest quarter
Solar radiation **
Wind speed **
Water vapor pressure *
SoilALSAExchangeable aluminum percentage (% of ECEC)
BSATBase saturation (% of CECs)
BULKBulk density
CECCCation exchange capacity of clay fraction (corrected for organic C)
CECSCation exchange capacity
CFRAG **Coarse fragments % (>2 mm)
CLPCClay %
CNrt **C/N ratio
ECECEffective CEC
ELCOElectrical conductivity
ESPExchangeable Na percentage (as % of CECs)
GYPS **Gypsum content
ORGC **Organic carbon content
PHAQPH in water
SDTOSand%
STPCSilt%
TAWCVolumetric water content (−33 to −1500 kPa, cm m−1)
TCEQCarbonate content
TOTN *Total nitrogen content
TEBTotal exchangeable bases
TerrainElevation
Slope
Note: * denotes initially selected variables; ** denotes finally selected variables.
Table A3. KL values and rankings of all the environmental variables (except for slope).
RankingVariableKLRankingVariableKL
1BIO1111.71 22TAWC0.96
2BIO1172.32 23ESP0.91
3BIO651.45 24BIO70.82
4BIO1049.13 25BIO150.79
5BIO548.62 26CECS0.63
6BIO845.11 27CLPC0.57
7BIO919.64 28BIO180.48
8Wind speed18.06 29PHAQ0.35
9Solar radiation5.20 30TCEQ0.28
10Water vapor pressure4.98 31SDTO0.20
11ORGC3.97 32BIO190.19
12CNrt2.01 33BIO140.18
13TOTN1.85 34BULK0.17
14BIO161.74 35ECEC0.15
15BIO121.74 36ELCO0.15
16BIO131.68 37BIO170.13
17BIO31.64 38CECc0.12
18BIO41.46 39ALSA0.12
19GYPS1.34 40TEB0.10
20BIO21.17 41STPC0.09
21CFRAG1.13 42BSAT0.09
43Elevation0.09
Table A4. The absolute values of the correlation coefficients of initially selected environmental variables.
∣RHO∣Solar RadiationWater Vapor PressureWind SpeedBIO1BIO2BIO3BIO4BIO5BIO6BIO8BIO9BIO10BIO11BIO12BIO13BIO16CFRAGCNrtGYPSORGCTOTN
Solar radiation1.000.500.320.700.460.610.540.660.590.470.650.590.680.080.330.300.160.120.040.260.34
Water vapor pressure0.501.000.550.910.210.740.780.550.920.630.810.680.900.640.620.640.130.120.100.140.23
Wind speed0.320.551.000.570.10.460.530.30.510.360.520.370.560.40.510.510.140.120.020.130.23
BIO10.700.910.571.000.060.780.830.710.890.640.900.790.950.460.550.550.160.080.040.220.34
BIO20.460.210.10.061.000.150.040.390.120.080.050.130.030.350.180.190.040.120.090.180.19
BIO30.610.740.460.780.151.000.920.280.850.340.790.310.890.460.450.470.250.130.060.120.21
BIO40.540.780.530.830.040.921.000.240.830.300.820.310.900.520.480.510.250.200.070.110.22
BIO50.660.550.30.710.390.280.241.000.480.710.560.960.550.090.310.280.010.120.040.290.36
BIO60.590.920.510.890.120.850.830.481.000.580.840.590.960.530.580.590.170.110.080.140.23
BIO80.470.630.360.640.080.340.300.710.581.000.350.740.560.240.440.410.010.070.040.190.23
BIO90.650.810.520.900.050.790.820.560.840.351.000.630.910.430.470.480.190.110.030.170.29
BIO100.590.680.370.790.130.310.310.960.590.740.631.000.630.200.390.360.000.090.010.260.33
BIO110.680.900.560.950.030.890.900.550.960.560.910.631.000.500.570.580.190.130.070.170.29
BIO120.080.640.40.460.350.460.520.090.530.240.430.200.501.000.800.850.120.290.150.070.00
BIO130.330.620.510.550.180.450.480.310.580.440.470.390.570.801.000.980.140.180.100.040.13
BIO160.300.640.510.550.190.470.510.280.590.410.480.360.580.850.981.000.150.220.110.020.12
CFRAG0.160.130.140.160.040.250.250.010.170.010.190.000.190.120.140.151.000.200.090.060.02
CNrt0.120.120.120.080.120.130.200.120.110.070.110.090.130.290.180.220.201.000.120.410.30
GYPS0.040.100.020.040.090.060.070.040.080.040.030.010.070.150.100.110.090.121.000.070.07
ORGC0.260.140.130.220.180.120.110.290.140.190.170.260.170.070.040.020.060.410.071.000.88
TOTN0.340.230.230.340.190.210.220.360.230.230.290.330.290.000.130.120.020.300.070.881.00
Table A5. The distribution of global maize harvested area in terms of slope.
Slope Class (i) f A i f B i
13.8%1.4%
28.6%9.8%
312.3%24.2%
412.0%19.9%
511.7%19.4%
611.5%15.0%
712.1%7.4%
812.7%2.4%
92.9%0.4%
Note: f A i denotes the proportion of area under maize to the total global land area for each slope class, and f B i denotes the distribution of area under maize in terms of each slope class.
Figure A1. PDFs of initially selected environmental variables. Note: For each environmental variable, the blue line denotes its probability density function based on all of the global terrestrial grids and the red line is that based on the grids defined as the maize distribution area. The two vertical dotted lines are the 5th and 95th percentile lines, respectively.
Land 10 00295 g0a1aLand 10 00295 g0a1b
Table A6. Projected area (mha and percentage) suitable for maize in the top five producers: present and changes in the future.
ProducerMaize Suitability LevelArea (mha)
(Percentage of Total Suitable Area, %)
Percentage Change in Area (%)
under Future Climate Change
2000sRCP2.6RCP8.5RCP2.6RCP8.5
2050s2070s2050s2070s2050s2070s2050s2070s
USAMarginally suitable169.6 (30.35)155.25 (28.11)154.08 (27.7)154.69 (28.7)138.64 (27.6)−8.46−9.15−8.79−18.26
Moderately suitable165.68 (29.65)174.38 (31.58)175.68 (31.58)169.05 (31.37)166.74 (33.19)5.256.032.030.64
Suitable117.07 (20.95)135.43 (24.52)138.29 (24.86)148.13 (27.49)136.18 (27.11)15.6818.1226.5216.32
Optimal106.51 (19.06)87.17 (15.78)88.24 (15.86)67.03 (12.44)60.81 (12.11)−18.17−17.16−37.07−42.91
Total558.87552.23556.28538.90502.36−1.19−0.46−3.57−10.11
ChinaMarginally suitable112.93 (25.02)122.03 (24.54)123.2 (24.63)129.96 (26.84)121.08 (26.21)8.069.1015.087.22
Moderately suitable122.36 (27.11)134.66 (27.08)138.56 (27.7)121.24 (25.04)117.69 (25.48)10.0513.24−0.92−3.81
Suitable90.91 (20.14)134.28 (27)132.83 (26.56)128.23 (26.49)107.32 (23.23)47.7146.1141.0518.05
Optimal125.22 (27.74)106.36 (21.39)105.55 (21.1)104.71 (21.63)115.88 (25.08)−15.06−15.71−16.38−7.46
Total451.42497.34500.15484.13461.9710.1710.797.252.34
BrazilMarginally suitable103.82 (12.61)98.22 (16.19)82.2 (13.79)26.54 (7.27)16.92 (6.75)−5.39−20.83−74.44−83.70
Moderately suitable235.92 (28.66)159.78 (26.33)161.33 (27.07)76.42 (20.94)60.69 (24.21)−32.27−31.61−67.61−74.28
Suitable204.79 (24.88)158.12 (26.06)162.86 (27.33)127.11 (34.83)93.52 (37.31)−22.79−20.47−37.93−54.33
Optimal278.71 (33.86)190.64 (31.42)189.51 (31.8)134.85 (36.95)79.52 (31.73)−31.60−32.01−51.62−71.47
Total823.24606.77595.90364.92250.65−26.29−27.62−55.67−69.55
ArgentinaMarginally suitable31.67 (17.04)41.09 (22.61)43.62 (24)54.19 (31.88)42.64 (29.84)29.7537.7271.1134.62
Moderately suitable22.55 (12.13)40.93 (22.52)37.95 (20.88)26.9 (15.82)22.57 (15.79)81.5368.3319.310.09
Suitable29.46 (15.85)32.49 (17.88)34.45 (18.96)31.72 (18.66)30.64 (21.44)10.2616.937.654.00
Optimal102.21 (54.98)67.21 (36.99)65.69 (36.15)57.19 (33.64)47.05 (32.93)−34.24−35.73−44.05−53.96
Total185.89181.72181.71170.00142.90−2.24−2.25−8.55−23.13
UkraineMarginally suitable17.82 (32.29)19.88 (36.82)19.69 (35.67)20.03 (39.88)20 (42.73)11.5510.4812.3912.19
Moderately suitable23.41 (42.41)22.24 (41.19)22.69 (41.11)19.17 (38.16)16.78 (35.87)−4.97−3.05−18.10−28.29
Suitable12.84 (23.27)11.67 (21.61)12.52 (22.69)10.8 (21.5)9.86 (21.08)−9.15−2.50−15.94−23.20
Optimal1.12 (2.03)0.21 (0.39)0.3 (0.54)0.23 (0.46)0.15 (0.33)−81.43−73.47−79.43−86.39
Total55.1954.0055.2050.2346.80−2.160.02−9.00−15.21
Percentage changes relative to the values during the 2000s.

References

  1. Fischer, G.; Shah, M.; Tubiello, F.N.; Van Velhuizen, H. Socio-economic and climate change impacts on agriculture: An integrated assessment, 1990–2080. Philos. Trans. R. Soc. B Biol. Sci. 2005, 360, 2067–2083. [Google Scholar] [CrossRef]
  2. Manners, R.; Varela-Ortega, C.; Van Etten, J. Protein-rich legume and pseudo-cereal crop suitability under present and future European climates. Eur. J. Agron. 2020, 113, 125974. [Google Scholar] [CrossRef]
  3. Seifert, C.A.; Lobell, D.B. Response of double cropping suitability to climate change in the United States. Environ. Res. Lett. 2015, 10, 10. [Google Scholar] [CrossRef] [Green Version]
  4. Zabel, F.; Putzenlechner, B.; Mauser, W. Global Agricultural Land Resources–A High Resolution Suitability Evaluation and Its Perspectives until 2100 under Climate Change Conditions. PLoS ONE 2014, 9, e107522. [Google Scholar] [CrossRef] [Green Version]
  5. FAO. A Framework for Land Evaluation; FAO Soils Bulletin 32; FAO: Rome, Italy, 1976. [Google Scholar]
  6. Di Paola, A.; Caporaso, L.; Bombelli, A.; Vasenev, I.; Nesterova, O.; Castaldi, S.; Valentini, R.; Di Paola, F. The expansion of wheat thermal suitability of Russia in response to climate change. Land Use Policy 2018, 78, 70–77. [Google Scholar] [CrossRef]
  7. Rivas, A.I.M.; Alvarez, C.C.; Dorantes, G.R.; Diaz, J.D.G.; Garcia, C.G. Assessing current and potential rainfed maize suitability under climate change scenarios in Mexico. Atmosfera 2011, 24, 53–67. [Google Scholar]
  8. Moeletsi, M.E.; Walker, S. Agroclimatological suitability mapping for dryland maize production in Lesotho. Theor. Appl. Clim. 2013, 114, 227–236. [Google Scholar] [CrossRef]
  9. Jayathilaka, P.M.S.; Soni, P.; Perret, S.R.; Jayasuriya, H.P.W.; Salokhe, V.M. Spatial assessment of climate change effects on crop suitability for major plantation crops in Sri Lanka. Reg. Environ. Chang. 2011, 12, 55–68. [Google Scholar] [CrossRef]
  10. Mendas, A.; Delali, A. Integration of MultiCriteria Decision Analysis in GIS to develop land suitability for agriculture: Application to durum wheat cultivation in the region of Mleta in Algeria. Comput. Electron. Agric. 2012, 83, 117–126. [Google Scholar] [CrossRef]
  11. Pilevar, A.R.; Matinfar, H.R.; Sohrabi, A.; Sarmadian, F. Integrated fuzzy, AHP and GIS techniques for land suitability assessment in semi-arid regions for wheat and maize farming. Ecol. Indic. 2020, 110, 105887. [Google Scholar] [CrossRef]
  12. Ahamed, T.N.; Rao, K.G.; Murthy, J. GIS-based fuzzy membership model for crop-land suitability analysis. Agric. Syst. 2000, 63, 75–95. [Google Scholar] [CrossRef]
  13. Ceballos-Silva, A.; López-Blanco, J. Delineation of suitable areas for crops using a Multi-Criteria Evaluation approach and land use/cover mapping: A case study in Central Mexico. Agric. Syst. 2003, 77, 117–136. [Google Scholar] [CrossRef]
  14. Beck, J. Predicting climate change effects on agriculture from ecological niche modeling: Who profits, who loses? Clim. Chang. 2012, 116, 177–189. [Google Scholar] [CrossRef] [Green Version]
  15. Ureta, C.; Martínez-Meyer, E.; Perales, H.R.; Alvarez-Buylla, E.R. Projecting the effects of climate change on the distribution of maize races and their wild relatives in Mexico. Glob. Chang. Biol. 2011, 18, 1073–1082. [Google Scholar] [CrossRef]
  16. Kogo, B.K.; Kumar, L.; Koech, R.; Kariyawasam, C.S. Modelling Climate Suitability for Rainfed Maize Cultivation in Kenya Using a Maximum Entropy (MaxENT) Approach. Agronomy 2019, 9, 727. [Google Scholar] [CrossRef] [Green Version]
  17. Ramirez-Cabral, N.Y.Z.; Kumar, L.; Shabani, F. Global alterations in areas of suitability for maize production from climate change and using a mechanistic species distribution model (CLIMEX). Sci. Rep. 2017, 7, 5910. [Google Scholar] [CrossRef]
  18. Jing-Song, S.; Guang-Sheng, Z.; Xing-Hua, S. Climatic suitability of the distribution of the winter wheat cultivation zone in China. Eur. J. Agron. 2012, 43, 77–86. [Google Scholar] [CrossRef]
  19. Yue, Y.; Zhang, P.; Shang, Y. The potential global distribution and dynamics of wheat under multiple climate change scenarios. Sci. Total. Environ. 2019, 688, 1308–1318. [Google Scholar] [CrossRef]
  20. Shabani, F.; Kotey, B. Future distribution of cotton and wheat in Australia under potential climate change. J. Agric. Sci. 2015, 154, 175–185. [Google Scholar] [CrossRef]
  21. Araújo, M.B.; Guisan, A. Five (or so) challenges for species distribution modelling. J. Biogeogr. 2006, 33, 1677–1688. [Google Scholar] [CrossRef]
  22. Elith, J.; Leathwick, J.R. Species Distribution Models: Ecological Explanation and Prediction Across Space and Time. Annu. Rev. Ecol. Evol. Syst. 2009, 40, 677–697. [Google Scholar] [CrossRef]
  23. Beaumont, L.J.; Hughes, L.; Poulsen, M. Predicting species distributions: Use of climatic parameters in BIOCLIM and its impact on predictions of species’ current and future distributions. Ecol. Model. 2005, 186, 251–270. [Google Scholar] [CrossRef]
  24. Odgaard, M.V.; Bøcher, P.K.; Dalgaard, T.; Svenning, J.-C. Climatic and non-climatic drivers of spatiotemporal maize-area dynamics across the northern limit for maize production—A case study from Denmark. Agric. Ecosyst. Environ. 2011, 142, 291–302. [Google Scholar] [CrossRef]
  25. Skarbø, K.; VanderMolen, K. Maize migration: Key crop expands to higher altitudes under climate change in the Andes. Clim. Dev. 2015, 8, 245–255. [Google Scholar] [CrossRef] [Green Version]
  26. Walke, N.; Reddy, G.O.; Maji, A.; Thayalan, S. GIS-based multicriteria overlay analysis in soil-suitability evaluation for cotton (Gossypium spp.): A case study in the black soil region of Central India. Comput. Geosci. 2012, 41, 108–118. [Google Scholar] [CrossRef]
  27. Piikki, K.; Winowiecki, L.; Vågen, T.-G.; Ramirez-Villegas, J.; Söderström, M. Improvement of spatial modelling of crop suitability using a new digital soil map of Tanzania. South Afr. J. Plant Soil 2017, 34, 243–254. [Google Scholar] [CrossRef]
  28. Baker, N.T.; Capel, P.D. Environmental Factors that Influence the Location of Crop Agriculture in the Conterminous United States; U.S. Geological Survey: Reston, VA, USA, 2011.
  29. Ranum, P.; Peña-Rosas, J.P.; Garcia-Casal, M.N. Global maize production, utilization, and consumption. Ann. N. Y. Acad. Sci. 2014, 1312, 105–112. [Google Scholar] [CrossRef] [PubMed]
  30. Lehmann, E.L. Elements of Large-Sample Theory; Springer Science & Business Media: Berlin/Heidelberg, Germany, 2004. [Google Scholar]
  31. Van Der Ploeg, R.R.; Bohm, W.; Kirkham, M.B. On the Origin of the Theory of Mineral Nutrition of Plants and the Law of the Minimum. Soil Sci. Soc. Am. J. 1999, 63, 1055–1062. [Google Scholar] [CrossRef] [Green Version]
  32. Van Bussel, L.G.J.; Stehfest, E.; Siebert, S.; Müller, C.; Ewert, F. Simulation of the phenological development of wheat and maize at the global scale. Glob. Ecol. Biogeogr. 2015, 24, 1018–1029. [Google Scholar] [CrossRef]
  33. Cooper, M.; Gho, C.; Leafgren, R.; Tang, T.; Messina, C. Breeding drought-tolerant maize hybrids for the US corn-belt: Discovery to product. J. Exp. Bot. 2014, 65, 6191–6204. [Google Scholar] [CrossRef] [Green Version]
  34. Bänziger, M.; Setimela, P.S.; Hodson, D.; Vivek, B. Breeding for improved abiotic stress tolerance in maize adapted to southern Africa. Agric. Water Manag. 2006, 80, 212–224. [Google Scholar] [CrossRef]
  35. Monfreda, C.; Ramankutty, N.; Foley, J.A. Farming the planet: Geographic distribution of crop areas, yields, physiological types, and net primary production in the year. Glob. Biogeochem. Cycles 2008, 22, 1022. [Google Scholar] [CrossRef]
  36. Portmann, F.T.; Siebert, S.; Döll, P. MIRCA2000-Global monthly irrigated and rainfed crop areas around the year 2000: A new high-resolution data set for agricultural and hydrological modeling. Glob. Biogeochem. Cycles 2010, 24, 1011. [Google Scholar] [CrossRef]
  37. You, L.; Wood-Sichra, U.; Fritz, S.; Guo, Z.; See, L.; Koo, J. Spatial Production Allocation Model (SPAM) 2005 v2. Available online: http://mapspam.info2014 (accessed on 25 September 2020).
  38. Hijmans, R.J.; Cameron, S.E.; Parra, J.L.; Jones, P.G.; Jarvis, A. Very high resolution interpolated climate surfaces for global land areas. Int. J. Clim. 2005, 25, 1965–1978. [Google Scholar] [CrossRef]
  39. Fischer, G.; Nachtergaele, F.; Prieler, S.; Van Velthuizen, H.; Verelst, L.; Wiberg, D. Global Agro-Ecological Zones Assess-Ment for Agriculture (GAEZ 2008); IIASA: Laxenburg, Austria; FAO: Rome, Italy, 2008. [Google Scholar]
  40. Batjes, N. ISRIC-WISE Derived Soil Properties on a 5 by 5 Arc-Minutes Global Grid (ver. 1.2); ISRIC-World Soil Information: Wageningen, The Netherlands, 2012. [Google Scholar]
  41. Han, H.; Cho, S.; Song, J.; Seol, A.; Chung, H.; Kim, J.; Chung, J. Assessing the potential suitability of forest stands as Kirengeshoma koreana habitat using MaxEnt. Landsc. Ecol. Eng. 2013, 10, 339–348. [Google Scholar] [CrossRef]
  42. Evans, J.M.; Fletcher, R.J.; Alavalapati, J. Using species distribution models to identify suitable areas for biofuel feedstock production. GCB Bioenergy 2010, 2, 63–78. [Google Scholar] [CrossRef]
  43. Kullback, S.; Leibler, R.A. On Information and Sufficiency. Ann. Math. Stat. 2007, 22, 79–86. [Google Scholar] [CrossRef]
  44. Mezquida, E.T.; Rubio, A.; Sánchez-Palomares, O. Evaluation of the potential index model to predict habitat suitability of forest species: The potential distribution of mountain pine (Pinus uncinata) in the Iberian peninsula. Eur. J. For. Res. 2009, 129, 133–140. [Google Scholar] [CrossRef] [Green Version]
  45. Wang, R.; Jiang, Y.; Su, P.; Wang, J. Global Spatial Distributions of and Trends in Rice Exposure to High Temperature. Sustain. J. Rec. 2019, 11, 6271. [Google Scholar] [CrossRef] [Green Version]
  46. Van Vuuren, D.P.; Edmonds, J.; Kainuma, M.; Riahi, K.; Thomson, A.; Hibbard, K.; Hurtt, G.C.; Kram, T.; Krey, V.; Lamarque, J.-F.; et al. The representative concentration pathways: An overview. Clim. Chang. 2011, 109, 5–31. [Google Scholar] [CrossRef]
  47. Brewbaker, J. Corn Production in the Tropics: The Hawaii Experience; University of Hawaii: Honolulu, HI, USA, 2003. [Google Scholar]
  48. Neild, R.E.; Newman, J.E. Growing Season Characteristics and Requirements in the Corn Belt; Cooperative Extension Ser-vice; Purdue University: West Lafayette, IN, USA, 1987. [Google Scholar]
  49. Lou, Y.; Xu, M.; Chen, X.; He, X.; Zhao, K. Stratification of soil organic C, N and C:N ratio as affected by conservation tillage in two maize fields of China. Catena 2012, 95, 124–130. [Google Scholar] [CrossRef]
  50. Kost, D.; Ladwig, K.J.; Chen, L.; DeSutter, T.M.; Espinoza, L.; Norton, L.D.; Smeal, D.; Torbert, H.A.; Watts, D.B.; Wolkowski, R.P.; et al. Meta-Analysis of Gypsum Effects on Crop Yields and Chemistry of Soils, Plant Tissues, and Vadose Water at Various Research Sites in the USA. J. Environ. Qual. 2018, 47, 1284–1292. [Google Scholar] [CrossRef] [PubMed]
  51. Hatfield, J.L.; Boote, K.J.; Kimball, B.A.; Ziska, L.H.; Izaurralde, R.C.; Ort, D.; Thomson, A.M.; Wolfe, D. Climate Impacts on Agriculture: Implications for Crop Production. Agron. J. 2011, 103, 351–370. [Google Scholar] [CrossRef] [Green Version]
  52. Williamson, C.E.; Zepp, R.G.; Lucas, R.M.; Madronich, S.; Austin, A.T.; Ballaré, C.L.; Norval, M.; Sulzberger, B.; Bais, A.F.; McKenzie, R.L.; et al. Solar ultraviolet radiation in a changing climate. Nat. Clim. Chang. 2014, 4, 434–441. [Google Scholar] [CrossRef]
  53. Campillo, C.; Fortes, R.; Prieto, M.D.H. Solar Radiation Effect on Crop Production. Solar Radiation 2012, 1, 494. [Google Scholar]
  54. Guo, H.; Zhang, X.; Lian, F.; Gao, Y.; Lin, D.; Wang, J. Drought Risk Assessment Based on Vulnerability Surfaces: A Case Study of Maize. Sustain. J. Rec. 2016, 8, 813. [Google Scholar] [CrossRef] [Green Version]
  55. Liu, J.; You, L.; Amini, M.; Obersteiner, M.; Herrero, M.; Zehnder, A.J.B.; Yang, H. A high-resolution assessment on global nitrogen flows in cropland. Proc. Natl. Acad. Sci. USA 2010, 107, 8035–8040. [Google Scholar] [CrossRef] [Green Version]
  56. Carter, P.R.; Hudelson, K.D. Influence of Simulated Wind Lodging on Corn Growth and Grain Yield. J. Prod. Agric. 1988, 1, 295–299. [Google Scholar] [CrossRef]
  57. Yusuf, A.; Abaidoo, R.; Iwuafor, E.; Olufajo, O.; Sanginga, N. Rotation effects of grain legumes and fallow on maize yield, microbial biomass and chemical properties of an Alfisol in the Nigerian savanna. Agric. Ecosyst. Environ. 2009, 129, 325–331. [Google Scholar] [CrossRef]
  58. Steduto, P.; Hsiao, T.C.; Fereres, E.; Raes, D. Crop Yield Response to Water; FAO: Rome, Italy, 2012. [Google Scholar]
  59. Stehman, S.V. Selecting and interpreting measures of thematic classification accuracy. Remote. Sens. Environ. 1997, 62, 77–89. [Google Scholar] [CrossRef]
  60. Swastika, D.K.S.; Kasim, F.; Sudana, W.; Hendayana, R.; Suhariyanto, K.; Gerpacio, R.; Pingali, P. Maize in Indonesia: Production Systems, Constraints, and Research Priorities; CIMMYT (International Maize and Wheat Improvement Center): Texcoco, Mexico, 2004. [Google Scholar]
  61. Badu-Apraku, B.; Fakorede, M.A.B. Breeding Early and Extra-Early Maize for Resistance to Biotic and Abiotic Stresses in Sub-Saharan Africa. In Plant Breed. Rev.; Janick, J., Ed.; 123-John Wiley and Sons: Hoboken, NJ, USA, 2013; pp. 123–205. [Google Scholar]
  62. Zhang, G.; Liu, C.; Xiao, C.; Xie, R.; Ming, B.; Hou, P.; Liu, G.; Xu, W.; Shen, D.; Wang, K.; et al. Optimizing water use efficiency and economic return of super high yield spring maize under drip irrigation and plastic mulching in arid areas of China. Field Crop. Res. 2017, 211, 137–146. [Google Scholar] [CrossRef]
  63. Dara, A.; Baumann, M.; Kuemmerle, T.; Pflugmacher, D.; Rabe, A.; Griffiths, P.; Hölzel, N.; Kamp, J.; Freitag, M.; Hostert, P. Mapping the timing of cropland abandonment and recultivation in northern Kazakhstan using annual Landsat time series. Remote. Sens. Environ. 2018, 213, 49–60. [Google Scholar] [CrossRef]
  64. Leng, G.; Peng, J.; Huang, S. Recent changes in county-level maize production in the United States: Spatial-temporal patterns, climatic drivers and the implications for crop modelling. Sci. Total. Environ. 2019, 686, 819–827. [Google Scholar] [CrossRef]
  65. Deryng, D.; Conway, D.; Ramankutty, N.; Price, J.; Warren, R. Global crop yield response to extreme heat stress under multiple climate change futures. Environ. Res. Lett. 2014, 9, 034011. [Google Scholar] [CrossRef] [Green Version]
  66. Shiferaw, B.; Prasanna, B.M.; Hellin, J.; Bänziger, M. Crops that feed the world Past successes and future challenges to the role played by maize in global food security. Food Secur. 2011, 3, 307–327. [Google Scholar] [CrossRef] [Green Version]
  67. FAO. FAOSTAT. Available online: http://www.fao.org/faostat/en/#data/QC (accessed on 25 September 2020).
  68. Hatfield, J.L.; Prueger, J.H. Temperature extremes: Effect on plant growth and development. Weather. Clim. Extremes 2015, 10, 4–10. [Google Scholar] [CrossRef] [Green Version]
  69. Wang, Y.; Tao, H.; Zhang, P.; Hou, X.; Sheng, D.; Tian, B.; Wang, P.; Huang, S. Reduction in seed set upon exposure to high night temperature during flowering in maize. Physiol. Plant. 2020, 169, 73–82. [Google Scholar] [CrossRef] [PubMed]
  70. Li, Y.; Guan, K.; Schnitkey, G.D.; DeLucia, E.; Peng, B. Excessive rainfall leads to maize yield loss of a comparable magnitude to extreme drought in the United States. Glob. Chang. Biol. 2019, 25, 2325–2337. [Google Scholar] [CrossRef] [Green Version]
  71. Zaidi, P.H.; Rafique, S.; Rai, P.K.; Singh, N.N.; Srinivasan, G. Tolerance to excess moisture in maize (Zea mays L.): Susceptible crop stages and identification of tolerant genotypes. Field Crops Res. 2004, 90, 189–202. [Google Scholar] [CrossRef]
  72. Martens, D.A. Management and Crop Residue Influence Soil Aggregate Stability. J. Environ. Qual. 2000, 29, 723–727. [Google Scholar] [CrossRef] [Green Version]
  73. Van Eerd, L.L.; Congreves, K.A.; Hayes, A.; Verhallen, A.; Hooker, D.C. Long-term tillage and crop rotation effects on soil quality, organic carbon, and total nitrogen. Can. J. Soil Sci. 2014, 94, 303–315. [Google Scholar] [CrossRef]
  74. Morton, D.C.; Noojipady, P.; Macedo, M.M.; Gibbs, H.; Victoria, D.C.; Bolfe, E.L. Reevaluating suitability estimates based on dynamics of cropland expansion in the Brazilian Amazon. Glob. Environ. Chang. 2016, 37, 92–101. [Google Scholar] [CrossRef] [Green Version]
  75. Laker, M.C. Advances in soil erosion, soil conservation, land suitability evaluation and land use planning research in South Africa, 1978–2003. South Afr. J. Plant Soil 2004, 21, 345–368. [Google Scholar] [CrossRef]
Figure 1. Research framework.
Land 10 00295 g001
Figure 2. Designing the criteria for the assessment of land as suitable for growing maize.
Land 10 00295 g002
Figure 3. Spatial consistency between areas predicted to be suitable for maize and those on which maize had been grown during the 2000s.
Land 10 00295 g003
Figure 4. Areas worldwide suitable for maize: past and future (results from ensemble (CMIP5 GCMs) mode). (a) In the past (1970–2000); (b) in 2050s (2041–2060) under RCP2.6; (c) in 2070s (2061–2080) under RCP2.6; (d) in 2050s under RCP8.5; (e) in 2070s under RCP8.5. RCP: representative concentration pathway.
Land 10 00295 g004aLand 10 00295 g004bLand 10 00295 g004c
Figure 5. Changes in worldwide land suitability for maize cultivation between different periods under the same RCPs. (a) 2050s (2041–2060) relative to that in the past (1970–2000), under RCP2.6; (b) 2070s (2061–2080) relative to 2050s, under RCP2.6; (c) 2050s relative to the past, under RCP8.5; (d) 2070s relative to 2050s, under RCP8.5. RCP: representative concentration pathway. Note: The numbers indicate increases (positive) or decreases (negative) in the level of suitability.
Land 10 00295 g005aLand 10 00295 g005b
Figure 6. Differences in worldwide land suitability for maize cultivation under RCP8.5 relative to that under RCP2.6 during (a) 2050s (2041–2060) and (b) 2070s (2061–2080). RCP: representative concentration pathway. Note: The numbers indicate increases (positive) or decreases (negative) in the level of suitability.
Land 10 00295 g006
Table 1. Percentiles for grading land suitability for growing maize.
Suitability ClassPercentile Criteria
Both TailsLower TailUpper Tail
Unsuitable<1, >99 <1 >99
Marginally suitable1–2.5, 97.5–99 1–2.5 97.5–99
Moderately suitable2.5–5, 95–97.5 2.5–5 95–97.5
Suitable5–10, 90–95 5–10 90–95
Optimal≥10, ≤90 ≥10 ≤90
Table 2. Criteria designed for assessing the land suitability for maize cultivation globally.
VariablesUnsuitableMarginally SuitableModerately SuitableSuitableOptimalUnit
Solar radiation<10,681 or >20,71210,681–11,278 or 20,712–20,33011,278–11,892 11,892–12,68712,687–20,330kJ m−2 day−1
Wind speed>54.8–54.3–4.83.8–4.31–3.8m s−1
BIO1<2.4 or >28.12.4–3.8 or 27.6–28.13.8–5.55.5–7.37.3–27.6°C
BIO2<6.7 or >24.36.7–7.2 7.2–7.7 7.7–8.38.3–24.3°C
BIO3<21.5 or >96.721.5–23.123.1–24.324.3–26.126.1–96.7%
BIO8<4.5 or >29.74.5–7.1 or 28.7–29.77.1–9.79.7–14.414.4–28.7°C
BIO10<13.1 or >33.113.1–16.116.1–17.317.3–18.7 18.7–33.1°C
BIO16<84 or >549784–139139–167167–205205–5497mm
CFRAG<2 or>2421–2419–2117–192–17%
CNrt<9 or >1615–1614–15149–14%
GYPS<1 or >3129–3122–2918–221–18g kg−1
ORGC<3 or >663–5 or 49–6637–495–6 or 31–376–31cmolc kg−1
Table 3. Accuracy of evaluating land parcels as suitable for maize as judged by past data.
MIRCA_IRMIRCA_RFMIRCA_TOLSPAM_
HA-IR
SPAM_
HA-RF
SPAM_
HA-TOL
SPAM_PA-IRSPAM_
PA-RF
SPAM_
PA-TOL
Overall accuracy76.20%78.80%78.80%76.20%80.30%80.40%76.20%80.20%80.30%
Kappa coefficient0.880.60.550.910.670.640.920.680.64
Note: MIRCA, MIRCA2000 maize data set; IR, irrigated; RF, rain-fed, and TOL, total area. SPAM; SPAM 2005 ver. 2.0 maize data set; HA, harvested area; PA, physical area. Overall accuracy: the proportion of grid cells classified as suitable (or unsuitable) for maize cultivation and with (or without) actual maize cultivation. Kappa coefficient: a parameter to assess the extent to which the classification is superior to a random classification.
Table 4. Projected total area (mha and percentage) suitable for maize worldwide: present and changes in the future.
Area (mha)
(Percentage of Total Area, %)
Percentage Change in Area (%)
under Future Climate Change
Maize suitability2000sRCP2.6RCP8.5RCP2.6RCP8.5
2050s2070s2050s2070s2050s2070s2050s2070s
Marginally suitable1795
(30.42)
1718
(32.14)
1666
(31.26)
1502
(32.37)
1324
(33.49)
−4.29 −7.19 −16.32 −26.24
Moderately suitable1538
(26.06)
1482
(27.73)
1495
(28.05)
1286
(27.72)
1073
(27.14)
−3.64 −2.80 −16.38 −30.23
Suitable1283
(21.74)
1196
(22.38)
1214
(22.78)
1079
(23.25)
931
(23.55)
−6.78 −5.38 −15.90 −27.44
Optimal1285
(21.78)
949
(17.75)
955
(17.92)
773
(16.66)
625
(15.81)
−26.15 −25.68 −39.84 −51.36
Total59015345533046403953−9.42 −9.68 −21.37 −33.01
Percentage changes relative to the values during the 2000s.
Publisher’s Note: MDPI stays neutral with regard to jurisdictional claims in published maps and institutional affiliations.

