
Community Preparation and Vulnerability Indices for Floods in Pahang State of Malaysia

 ,
,  ,
,  and
and
Abstract
:1. Introduction
2. Materials and Methods
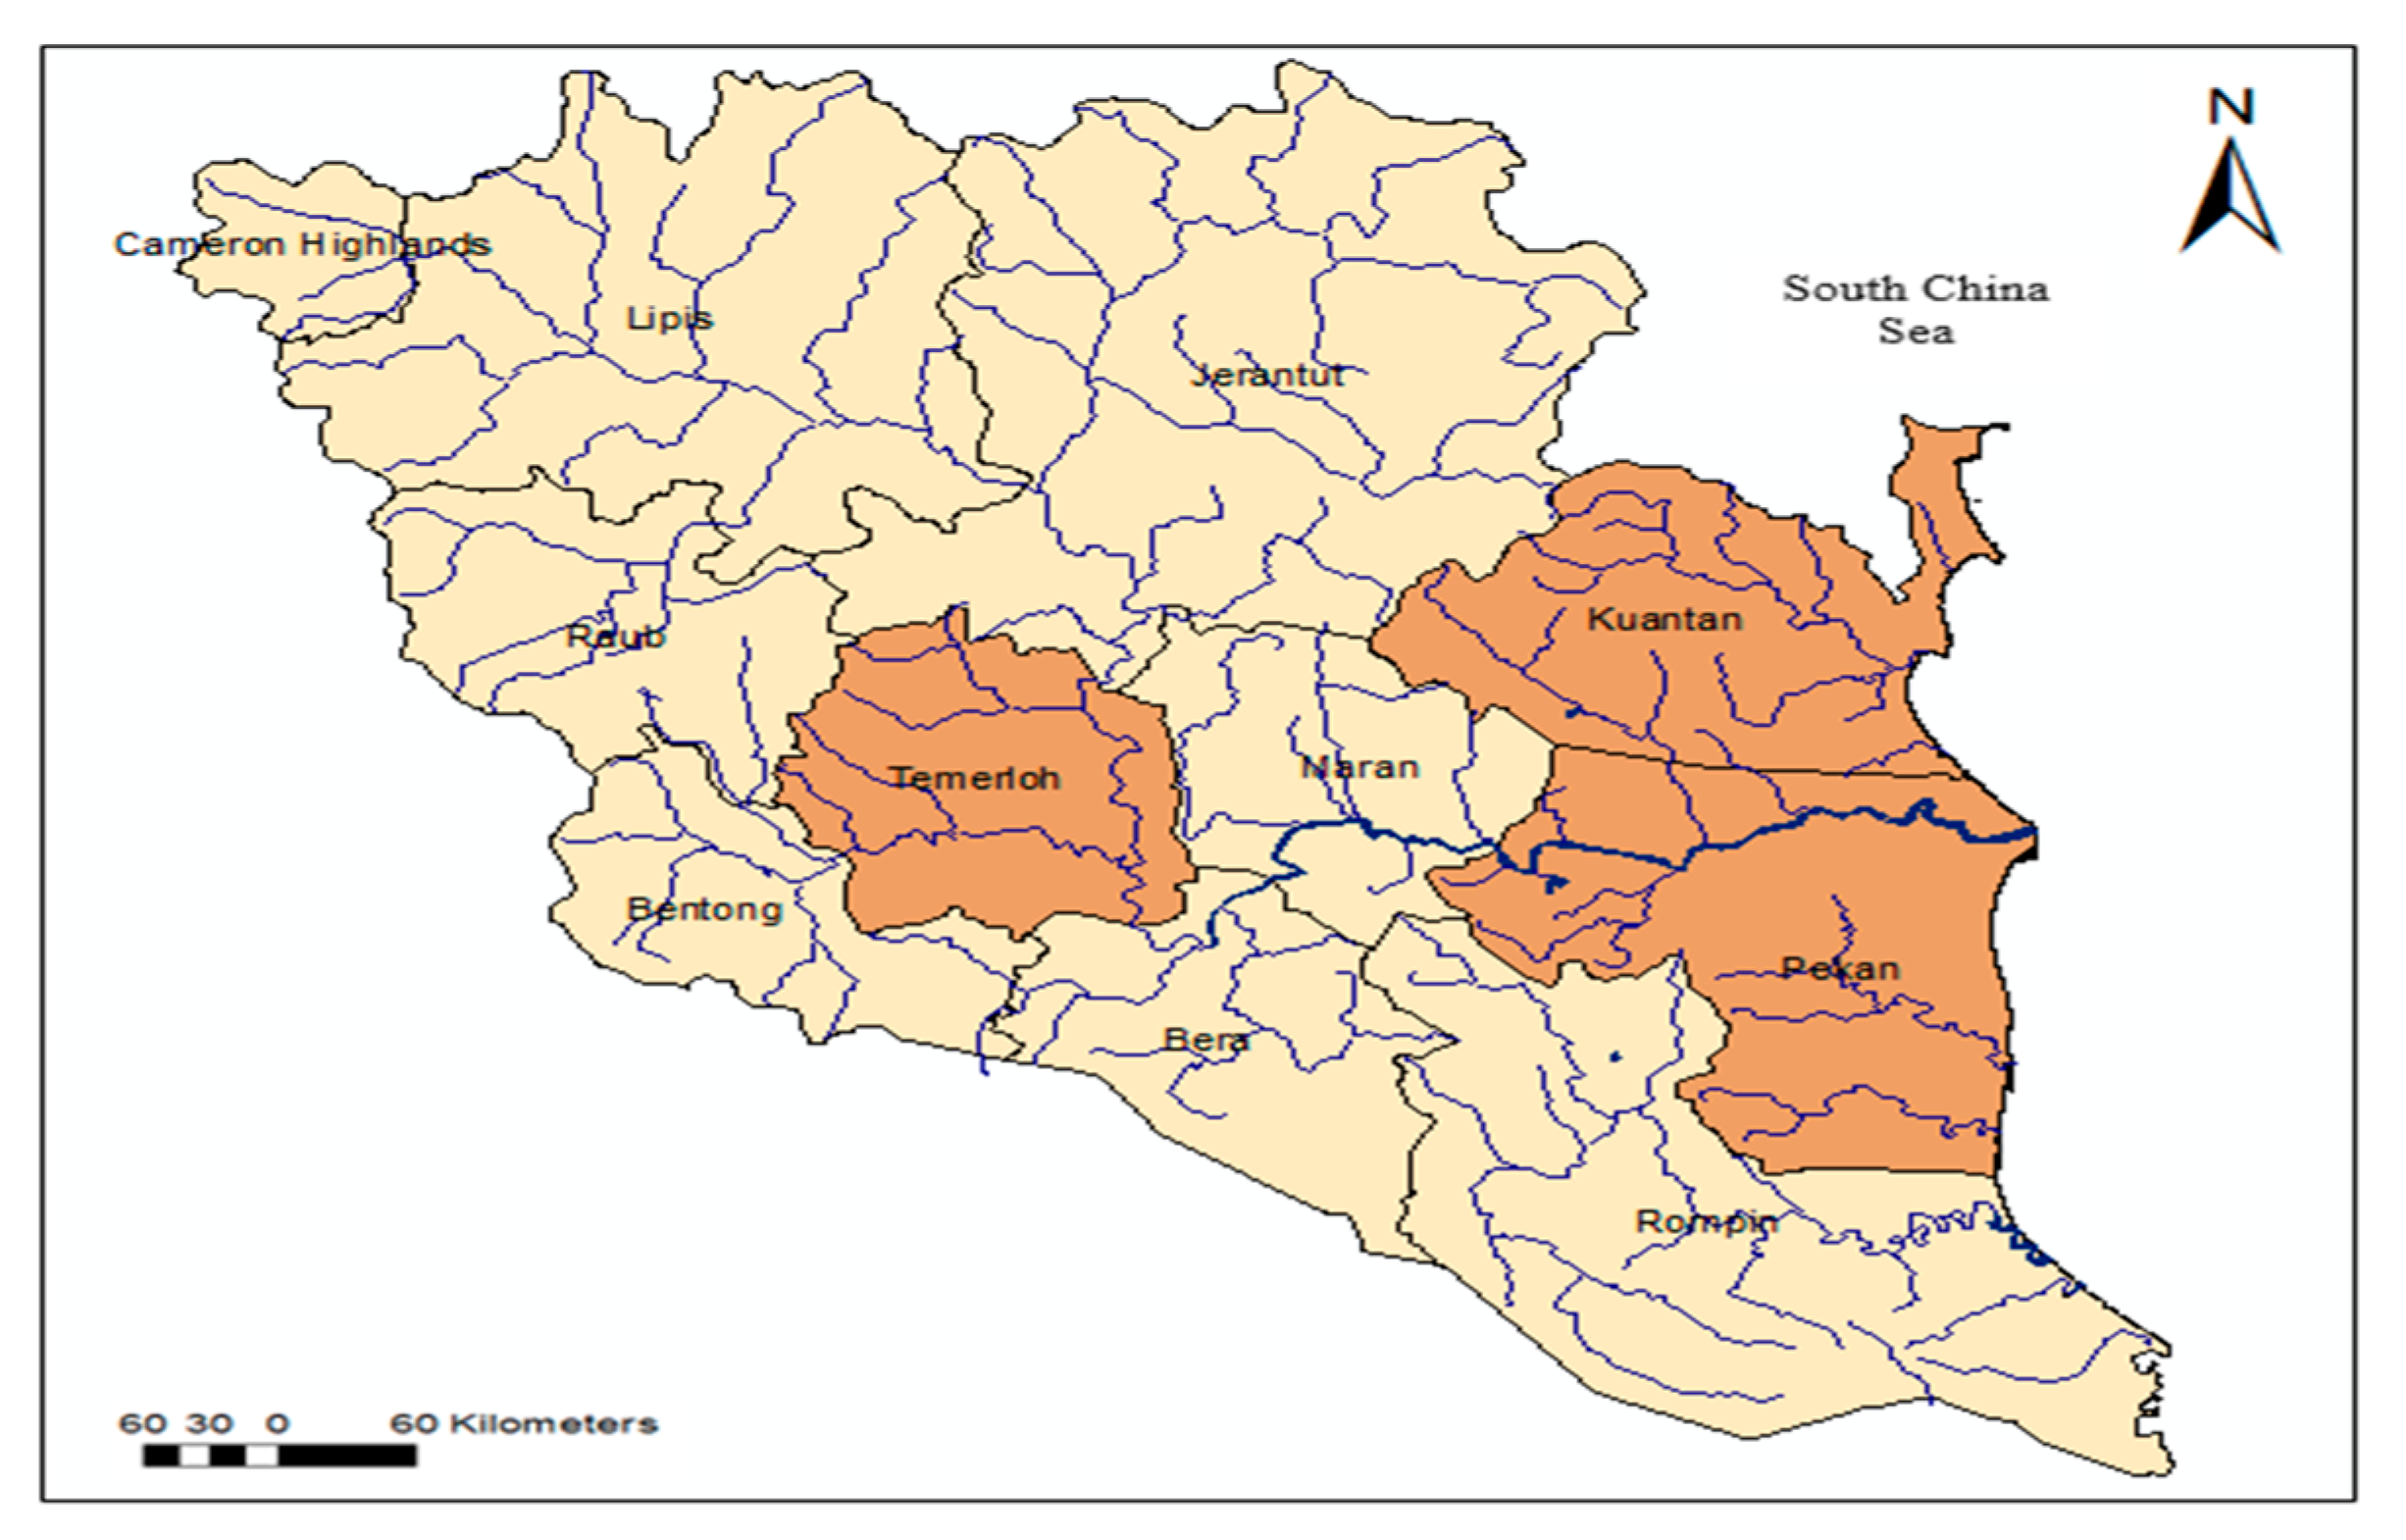
2.1. Study Area
2.2. Household Surveys
2.3. Data Analysis
2.3.1. Vulnerability Index for Livelihood (LVI)
2.3.2. LVI according to the IPCC approach
2.4. Limitation
3. Findings
4. Discussion
5. Recommendations and Policy Implications
6. Conclusions
Author Contributions
Funding
Data Availability Statement
Acknowledgments
Conflicts of Interest
Abbreviations
| A | Water |
| AdaCap | Adaptive Capacity |
| Exp | Exposure |
| Fi | Financial |
| F | Food |
| H | Health |
| Ho | House |
| L | Land |
| Sen | Sensitivity |
| IPCC | Intergovernmental Penal on Climate Change |
| LS | Livelihood Strategy |
| LVI | Livelihood Vulnerability Index |
| NDCV | Natural-Disaster and Climate Variability |
| PLI | Poverty-Line Income |
| SDP | Social Demographic Profile |
| SLA | Sustainable Livelihood Approach |
| SN | Social Network |
References
- Tang, K.H.D. Climate change in Malaysia: Trends, contributors, impacts, mitigation and adaptations. Sci. Total. Environ. 2019, 650, 1858–1871. [Google Scholar] [CrossRef]
- Yeganeh, N.; Sabri, S. Flood Vulnerability Assessment in Iskandar Malaysia Using Multi-criteria Evaluation and Fuzzy Logic. Res. J. Appl. Sci. Eng. Technol. 2014, 8, 1794–1806. [Google Scholar] [CrossRef]
- Apurv, T.; Mehrotra, R.; Sharma, A.; Goyal, M.K.; Dutta, S. Impact of climate change on floods in the Brahmaputra basin using CMIP5 decadal predictions. J. Hydrol. 2015, 527, 281–291. [Google Scholar] [CrossRef]
- Muhammad, N.S.; Abdullah, J.; Julien, P.Y. Characteristics of Rainfall in Peninsular Malaysia. J. Phys. Conf. Ser. 2020, 1529. [Google Scholar] [CrossRef]
- Chang, C.K.; Ghani, A.A.; Zakaria, N.A.; Puay, H.T. Sediment Transport in Sungai Pahang: Case Study of a Large Scale River Basin. J. Teknol. 2015, 72, 2180–3722. [Google Scholar]
- Khan, M.M.; Shaari, N.A.; Bahar, A.M.; Baten, M.A.; Nazaruddin, D.B. Flood Impact Assessment in Kota Bharu, Malaysia: A Statistical Analysis. World Appl. Sci. J. 2014, 32, 626–634. [Google Scholar] [CrossRef]
- Chambers, R.; Conway, G.R. Sustainable Rural Livelihoods: Practical Concepts for the 21st Century; IDS Discussion Paper, 296; Institute of Development Studies: Brighton, UK, 1992. [Google Scholar]
- DFID. Sustainable Livelihoods Guidance Sheets; DFID: London, UK, 1999.
- IPCC. Climate Change 2007: Impacts, adaptation and vulnerability. In Contribution Group II to the Fourth Assessment Report of the Intergovernmental Panel on Climate Change; Parry, M.L., Canziani, O.F., Palutikof, J.P., van der Linden, P.J., Hanson, C.E., Eds.; Cambridge University Press: Cambridge, UK, 2007. [Google Scholar]
- Turner, B.L.; Kasperson, R.E.; Matson, P.A.; McCarthy, J.J.; Corell, R.W.; Christensen, L.; Eckley, N.; Kasperson, J.X.; Luers, A.; Martello, M.L.; et al. A framework for vulnerability analysis in sustainability science. Proc. Natl. Acad. Sci. USA 2003, 100, 8074–8079. [Google Scholar] [CrossRef] [Green Version]
- Marin, G.; Modica, M. Socio-economic exposure to natural disasters. Environ. Impact Assess. Rev. 2017, 64, 57–66. [Google Scholar] [CrossRef]
- Eriksen, S.H.; Kelly, P.M. Developing Credible Vulnerability Indicators for Climate Adaptation Policy Assessment. Mitig. Adapt. Strat. Glob. Chang. 2007, 12, 495–524. [Google Scholar] [CrossRef]
- Pinto, M.M.S.C.; Marinho-Reis, P.; Almeida, A.; Pinto, E.; Neves, O.; Inácio, M.; Gerardo, B.; Freitas, S.; Simões, M.R.; Dinis, P.A.; et al. Links between Cognitive Status and Trace Element Levels in Hair for an Environmentally Exposed Population: A Case Study in the Surroundings of the Estarreja Industrial Area. Int. J. Environ. Res. Public Heal. 2019, 16, 4560. [Google Scholar] [CrossRef] [PubMed] [Green Version]
- Gbetibouo, G.A.; Ringler, C. Mapping South African farming sector vulnerability to climate change and variability. Nat. Resour. Forum 2010, 34, 175–187. [Google Scholar] [CrossRef]
- Preston, B.L.; Yuen, E.; Westaway, R.M. Putting vulnerability to climate change on the map: A review of approaches, benefits, and risks. Sustain. Sci. 2011, 6, 177–202. [Google Scholar] [CrossRef]
- Adger, W.N. Vulnerability. Glob. Environ. Chang. 2006, 16, 268–281. [Google Scholar] [CrossRef]
- Cabral Pinto, M.M.S.; Ferreira da Silva, E.A. Heavy Metals of Santiago Island (Cape Verde) alluvial deposits: Baseline value maps and human health risk assessment. Int. J. Environ. Res. Public Health 2019, 16, 2. [Google Scholar] [CrossRef] [Green Version]
- Cabral Pinto, M.M.S.; Marinho-Reis, A.P.; Almeida, A.; Freitas, S.; Simões, M.R.; Diniz, M.L.; Pinto, E.; Ramos, P.; Ferreira da Silva, E.; Moreira, P.I. Fingernail trace element content in environmentally exposed individuals and its influence on their cognitive status in ageing. Expo. Health 2019, 11, 181–194. [Google Scholar] [CrossRef]
- JICA. The Preparatory Survey for Integrated River Basin Management Incorporating Integrated Flood Management with Adaptation of Climate Change; JICA: Tokyo, Japan, 2011. [Google Scholar]
- Zad, S.N.M.; Diyana, Z.; Muharam, F.M. Satellite Rainfall (TRMM 3B42-V7) Performance Assessment and Adjustment over Pahang River Basin, Malaysia. Remote. Sens. 2018, 10, 388. [Google Scholar] [CrossRef] [Green Version]
- Ab Ghani, A.; Chang, C.K.; Leow, C.S.; Zakaria, N.A. Sungai Pahang digital flood mapping: 2007 flood. Int. J. River Basin Manag. 2012, 10, 139–148. [Google Scholar] [CrossRef]
- Toriman, M.E.; Mokhtar, M. Irrigation: Types, Sources and Problems in Malaysia. In Irrigation Systems and Practices in Challenging Environments; IntechOpen: London, UK, 2012. [Google Scholar]
- Hahn, M.B.; Riederer, A.M.; Foster, S.O. The Livelihood Vulnerability Index: A pragmatic approach to assessing risks from climate variability and change—A case study in Mozambique. Glob. Environ. Chang. 2009, 19, 74–88. [Google Scholar] [CrossRef]
- Tewari, H.R.; Bhowmick, P.K. Livelihood vulnerability index analysis: An approach to study vulnerability in the context of Bihar. Jàmbá J. Disaster Risk Stud. 2014, 6, 13. [Google Scholar] [CrossRef] [Green Version]
- Majid, N.A.; Nazi, N.M.; Diana, M.I.N.; Taha, M.R. GIS-Based Livelihood Vulnerability Index Mapping of the Socioeconomy of the Pekan Community. Sustainability 2019, 11, 6935. [Google Scholar] [CrossRef] [Green Version]
- Diana, M.I.N.; Chamburi, S.; Raihan, T.M.; Ashikin, A.N. Assessing local vulnerability to climate change by using Livelihood Vulnerability Index: Case study in Pahang region, Malaysia. IOP Conf. Ser. Mater. Sci. Eng. 2019, 506, 012059. [Google Scholar] [CrossRef]
- Panthi, J.; Aryal, S.; Dahal, P.; Bhandari, P.; Krakauer, N.Y.; Pandey, V.P. Livelihood vulnerability approach to assessing climate change impacts on mixed agro-livestock smallholders around the Gandaki River Basin in Nepal. Reg. Environ. Chang. 2016, 16, 1121–1132. [Google Scholar] [CrossRef]
- Etwire, P.M.; Al-Hassan, R.M.; Kuwornu, J.K.M.; Osei-Owusu, Y. Application of Livelihood Vulnerability Index in Assessing Vulnerability to Climate Change and Variability in Northern Ghana. J. Environ. Earth Sci. 2013, 3, 157–170. [Google Scholar]
- Adu, D.T.; Kuwornu, J.K.; Anim-Somuah, H.; Sasaki, N. Application of livelihood vulnerability index in assessing smallholder maize farming households’ vulnerability to climate change in Brong-Ahafo region of Ghana. Kasetsart J. Soc. Sci. 2018, 39, 22–32. [Google Scholar] [CrossRef]
- Alam, G.M.M.; Alam, K.; Mushtaq, S.; Clarke, M.L. Vulnerability to climatic change in riparian char and river-bank households in Bangladesh: Implication for policy, livelihoods and social development. Ecol. Indic. 2017, 72, 23–32. [Google Scholar] [CrossRef]
- Tjoe, Y. Measuring the livelihood vulnerability index of a dry region in Indonesia. World J. Sci. Technol. Sustain. Dev. 2016, 13, 250–274. [Google Scholar] [CrossRef] [Green Version]
- Koirala, S. Livelihood Vulnerability Assessment to the Impacts of Socio-Environmental Stressors in Raksirang VDC of Makwanpur District Nepal. Master’s Thesis, Norwegian University of Life Sciences, As, Norway, 2015. [Google Scholar] [CrossRef]
- Cutter, S.L.; Boruff, B.J.; Shirley, W.L. Social Vulnerability to Environmental Hazards*. Soc. Sci. Q. 2003, 84, 242–261. [Google Scholar] [CrossRef]
- Alim, A. Changes in villagers’ knowledge, perceptions, and attitudes concerning gender roles and relations in Bangladesh. Dev. Pr. 2009, 19, 300–310. [Google Scholar] [CrossRef]
- Ibrahim, A.Z.; Siwar, C. Kelestarian Penghidupan Petani Luar Bandar; Universiti Utara Malaysia: Sintok, Malaysa, 2017. [Google Scholar]
- Braun, B.; Aßheuer, T. Floods in megacity environments: Vulnerability and coping strategies of slum dwellers in Dhaka/Bangladesh. Nat. Hazards 2011, 58, 771–787. [Google Scholar] [CrossRef]
- Aliagha, U.G.; Jin, T.E.; Choong, W.W.; Jaafar, M.N.; Ali, H.M. Factors affecting flood insurance purchase in residential properties in Johor, Malaysia. Nat. Hazards Earth Syst. Sci. 2014, 14, 3297–3310. [Google Scholar] [CrossRef] [Green Version]
- O’Brien, L.; Ambrose-oji, B.; Morris, J.; Edwards, D.; Williams, R. Volunteers’ Contribution to Flood Resilience; Environment Agency: Bristol, UK, 2014; pp. 1–8. [Google Scholar]
- Few, R. Flooding, vulnerability and coping strategies: Local responses to a global threat. Prog. Dev. Stud. 2003, 3, 43–58. [Google Scholar] [CrossRef]
- Brouwer, R.; Akter, S.; Brander, L.; Haque, E. Socioeconomic Vulnerability and Adaptation to Environmental Risk: A Case Study of Climate Change and Flooding in Bangladesh. Risk Anal. 2007, 27, 313–326. [Google Scholar] [CrossRef] [Green Version]
- Paul, S.K.; Routray, J.K. Flood proneness and coping strategies: The experiences of two villages in Bangladesh. Disasters 2010, 34, 489–508. [Google Scholar] [CrossRef]
- Marfai, M.A.; Sekaranom, A.B.; Ward, P.J. Community responses and adaptation strategies toward flood hazard in Jakarta, Indonesia. Nat. Hazards 2015, 75, 1127–1144. [Google Scholar] [CrossRef]
- EPU. Perangkaan Pendapatan dan Kemiskinan isi Rumah Sepintas Lalu; EPU: Putrajaya, Malaysia, 2012. [Google Scholar]
- Abdullah, P.; Salleh, S.; Elfithri, R.; Mokhtar, M.; Toriman, M.E.; Embi, A.F.; Maulud, K.N.A.; Abdullah, M.; Heng, L.Y.; Halimshah, S.; et al. Stakeholders’ Response and Perspectives on Flood Disaster of Pahang River Basin. Malays. J. Geosci. 2017, 1, 43–49. [Google Scholar] [CrossRef]
- Shafiai, S. Flood Disaster Management in Malaysia: A Review of Issues of Flood Disaster Relief during and Post-Disaster. In Proceedings of the ISSC 2016 International Conference on Soft Science, Kedah, Malaysia, 11–13 April 2016; pp. 163–170. [Google Scholar]
- Aldrich, D.P.; Oum, S.; Sawada, Y. Resilience and Recovery in Asian Disasters; Springer: Berlin/Heidelberg, Germany, 2015; pp. 239–265. [Google Scholar] [CrossRef]
- Yusoff, I.M.; Ramli, A.; Alkasirah, N.A.M.; Nasir, N.M. Exploring the managing of flood disaster: A Malaysian perspective. Malays. J. Soc. Space 2018, 14, 24–36. [Google Scholar] [CrossRef]
- Baharuddin, K.A.; Wahab, S.F.A.; Rahman, N.H.N.A.; Mohamad, N.A.N.; Kamauzaman, T.H.T.; Yazid, M.N.A.; Majid, M.R.A. The record-setting flood of 2014 in kelantan: Challenges and recommendations from an emergen-cy medicine perspective and why the medical campus stood dry. Malays. J. Med Sci. 2015, 22, 1–7. [Google Scholar]
- Badri, S.A.; Asgary, A.; Eftekhari, A.; Levy, J. Post-disaster resettlement, development and change: A case study of the 1990 Manjil earthquake in Iran. Disasters 2006, 30, 451–468. [Google Scholar] [CrossRef]
- Hamin, Z.; Othman, M.B.; Elias, Z. Floating on a Legislative Framework in Flood Management in Malaysia: Lessons from the United Kingdom. Procedia Soc. Behav. Sci. 2013, 101, 277–283. [Google Scholar] [CrossRef] [Green Version]
- Roosli, R.; O’Brien, G. Social learning in managing disasters in Malaysia. Disaster Prev. Manag. Int. J. 2011, 20, 386–397. [Google Scholar] [CrossRef]


| Main Components | Subcomponents | Unit | Description | Sources |
|---|---|---|---|---|
| Social demographic | Dependency ratio | Ratio | The number of people under 15 and over 65 years of age to people between 19 and 64 years of age. | [23,24,25,26,27,28,29,30,31,32] |
| Percentage of female-headed households | % | The primary adult is a woman whose male head is away from home, for example more than six months a year. | [23,24,25,26,27,28,29,30] | |
| The average age of female-headed households | Count | Average age of female adult at the head of household. | [25,26,28,29] | |
| Percentage of families where the head of the household has not attended school | % | The head of the family unit reported that they never attended formal education. | [23,24,25,26,27,28,29,30,31,32] | |
| The average number of people in households | Count | Average of household members for each family. | [25,26,32] | |
| Percentage of homes with orphans | % | Houses with a minimum of one orphan in their family. The age of the orphan must be less than 18, and one or both of his/her parents must be dead | [23,25,28,29] | |
| Percentage of households of which a member has no formal or informal skills | % | Percentage of household members without any formal or informal skill. Formal skill such as operating engine vehicle which require license. Informal skill such as swimming, might be taught by family member | Adapted from [24] | |
| Percentage of poor households (income below RM490) | % | Percentage of households that are counted in the poor and hardcore poor categories according to poverty-line income (PLI) in Malaysia. | [25,26] | |
| Livelihood strategy | Where at least one member of the family works in another city | % | Households where at least one family member’s primary job is outside the local community. | [23,24,25,26,28,29] |
| Families depend primarily on agriculture as their primary source of income | % | Agriculture is the principal source of a household’s income. | [23,24,25,26,29,32] | |
| Diversification of average agriculture industry livelihoods | 1/# livelihood | The inverse of (number of farm livelihood activities + 1) recorded by a household. The formula is written below: | [23,24,25,26,28,29,30,31,32] | |
| Agricultural production proportion to total income | Ratio | Ratio total value of farm earnings from agriculture (e.g., crops and livestock) to total income. | Adapted from [30] | |
| Percentage of the household’s income with contribution from agricultural activity | % | Percentage of household’s income from agricultural work either completely or partially. | Author’s | |
| Percentage of households losing a job during flood season | % | Percentage of households in which family member lost his/her job due to the floods. | [25,26] | |
| Households finding new natural resources during times of flood | % | Percentage of households that use natural resources to survive during the floods. | [25,26] | |
| Percentage of households that catch fish during flood seasons | % | Percentage of households resorting to fishing during floods. | [25,26] | |
| Health | Households where at least one member has a health problem | % | Families who have at least one person in their family with a chronic illness. The respondents reported the illness themselves. | [23,24,25,26,27,28,29,30] |
| Percentage of households not able to store medicine during floods | % | Percentage of households not storing medicine for personal use during floods. | Author’s | |
| Percentage of households having access to a healthcare facility | % | A majority of identified households were unable to access the nearest healthcare centre. | Adapted from [24,32] | |
| Average time the nearby healthcare facility (with at least one qualified doctor) | % | Average time taken for households to get to a nearby healthcare facility. | [23,25,26,27,28,29,30,31,32] | |
| For the last two weeks, a percentage of households with a family member who had to miss work or school because of flood disease. | % | Due to illness at least one person in their family misses school or work in the last two weeks. | [23,25,26,27,28,29,30,31,32] | |
| The proportion of households with family members contracting a disease due to floods | % | A percentage of households indicated that at least one member of the family was sick due to flooding. | [25,26] | |
| Social network | Average borrowing and lending ratio of cash | Ratio | Households that lent money in recent months (if a house borrowed money but did not offer money, the ratio would be 2:1; if they lent money but did not borrow anything, the ratio would be 1:2 or 0.5. | [24,25,26,27,28,29] |
| Percentage of households receiving government and NGO assistance (during flood seasons) | % | Percentage of households receiving assistance from government and NGOs during the floods. | [25,32] | |
| Percentage of households remaining unaware of flood evacuation centre. | % | Percentage of households did not have information related to the flood evacuation centre. | Author’s | |
| Percent of households that did not know how to get information about the floods | % | Percentage of households did not know where and how they could get information related to floods. | Author’s | |
| Number of households that did not distribute flood-related details | % | Percentage of households not sharing their knowledge about floods with family, neighbours or friends, especially within the affected area. | Author’s | |
| Percentage of households that did not have access to telecommunications services | % | Percentage of households without access to telecommunications services (telephone, mobile phone, and email). | Adapted from [27] | |
| Percentage of households that participated as volunteers during floods | % | Percentage of households with at least one family member involved as a volunteer during the floods. | [25,26] | |
| Food | Percentage of households that did not store food during floods | % | Percentage of households not storing dry food (packaged or canned food) during floods. | [25,26] |
| Average crop diversity index | 1/# Crop | The inverse of (number of crops + 1) stated by a household. The formula is shown below: | [23,24,25,26,28,29,30,31,32] | |
| Average livestock diversity index | 1/# livestock | The inverse of (the number of animals + 1) reported by a household The formula is written below: | [23,24,25,26] | |
| Percentage of families that do not store crops | % | Households not saving crops as supplies when floods strike. | [23,24,25,28,29] | |
| The number of households without a vegetable garden | % | Percentage of households without a vegetable garden to augment food resources. | [30] | |
| Water | Percentage of households use natural water resources | % | Percentage of households reported using natural water (river and well) as their primary source. | [23,24,25,26,28,29,30,31,32] |
| Percentage of households that do not have daily sources of water | % | Percentage of household reporting that water is not consistently available at their primary water source for daily usage. | [23,24,25,26,28,29] | |
| Percentage of households have to go further to get water. | % | Percentage of households reporting they need to get water from somewhere else. | [24] | |
| Percentage of households storing water | % | Percentage of families that store water for daily usage. | [24] | |
| Average distance to water resources | Minutes | The average time taken by each household to travel to their primary water source. | [23,25,26,27,28,29,30,31,32] | |
| The opposite of the total amount of litres of water per household deposited | 1/# Litre | The opposite of (average number of litres of water store by each house + 1) The formula as below: | [23,25,26,28,29] | |
| House | Percentage of households whose house does not have a solid structure (wood/semi-wood) | % | Percentage of households with homes built from nonsolid materials (wood a semi-wood) and prone to damage by floods. | [25,26] |
| The number of houses not built above the ground to deter flooding | % | Percentage of families which did not build homes above ground level to prevent floods. | [25,26] | |
| Percentage of flood-affected households | % | Percentage of families affected by floods (more 30% damage). Respondent subjectively defined level of damage. | [25,26] | |
| Land | Families who are not owners of the land area remain on (landless) | % | Percentage of households that do not own the land they live on. | [24,25,26] |
| Percentage of households (0.1–0.5 ha) with a limited land area | % | Percentage of households owning only a small area of land. | [25,26] | |
| Percentage of the household without fertile land | % | Percentage of families that did not possess a good area for agricultural activity. | Adapted from [24] | |
| Finance and income | Households who are affected in their income due to floods | % | Percentage of households with affected incomes due to floods. | [25,26] |
| Percentage of households that fall under B40 category | % | Percentage of households with monthly income of RM3860 and less. | Author’s | |
| Percentage of households have the burden of loan | % | Percentage of households taking out a loan from individual or institution. | [24,25,26] | |
| No money was saved by a number of households | % | Proportion of households that did not save money for other expenses. | Author’s | |
| Natural Disaster and Climate variability | The total number of floods (range: 0–7) over the past seven years | Count | Comprehensive number of flooding cases recorded by households in the past seven years. | [23,24,25,26,28,29,30,31,32] |
| Percentage of households that were not provided early flood warnings | % | Early-warning information on flooding was not obtained by a percentage of households. | [23,24,25,26,28,29,30,31,32] | |
| Percentage of households with damage from flooding to property | % | Percentage of households suffering damage/loss of physical assets (agriculture and building structures) due to floods. | [25,26,32] | |
| Percentage of family members experiencing catastrophe accidents or deaths from floods in the last seven years | % | Percentage of households who registered injury or death to at least one family member in the last seven years due to extreme floods. | [23,24,25,26,28,29,30,31,32] | |
| Mean standard deviation monthly rainfall | Count | Average standard deviation value of monthly precipitation in 2014. | Adapted from [30,31,32] | |
| Mean standard deviation monsoon rainfall | Count | Average standard deviation value of 2014 monsoon precipitation. | Adapted from [30,32] |
| Scale | Ranges |
|---|---|
| Most Invulnerable | 0.000–0.250 |
| Invulnerable | 0.251–0.500 |
| Vulnerable | 0.501–0.750 |
| Most Vulnerable | 0.751–1.000 |
| Item | Temerloh (%) (n = 202) | Pekan (%) (n = 200) | Kuantan (%) (n = 200) | Item | Temerloh (%) (n = 202) | Pekan (%) (n = 200) | Kuantan (%) (n = 200) |
|---|---|---|---|---|---|---|---|
| Strata | Gender | ||||||
| Urban Rural | 36.6 63.4 | 25 75 | 72.5 27.5 | Male Female | 56.4 43.6 | 83.5 16.5 | 51.5 48.5 |
| Age | Marital Status | ||||||
| 19–40 41–65 >65 | 21.8 58.9 19.3 | 19.5 71.5 9 | 49.5 44 6.5 | Single Widow/widower Married | 9.4 17.3 73.3 | 2.5 19.5 78 | 3.5 6.5 90 |
| Age average | 51.2 | 50.2 | 42.6 | ||||
| Education Status | Occupational category | ||||||
| Degree Certificate STPM/Diploma SPM SRP/PMR Primary school Did not go to school | 4.5 0.5 5.4 39.1 18.8 30.7 1.0 | 2.0 - 3.0 43.0 22.0 27.0 3.0 | 11.5 1 9.5 40.5 16.5 16 5 | Government Private sector Self-employed Housewife Unemployed Others | 9.4 9.4 55 1 9.9 15.3 | 12 22.5 47 5.5 3 10 | 22 33.5 32 1 3 8.5 |
| Major Element | Major Element Index | ||
|---|---|---|---|
| T | P | K | |
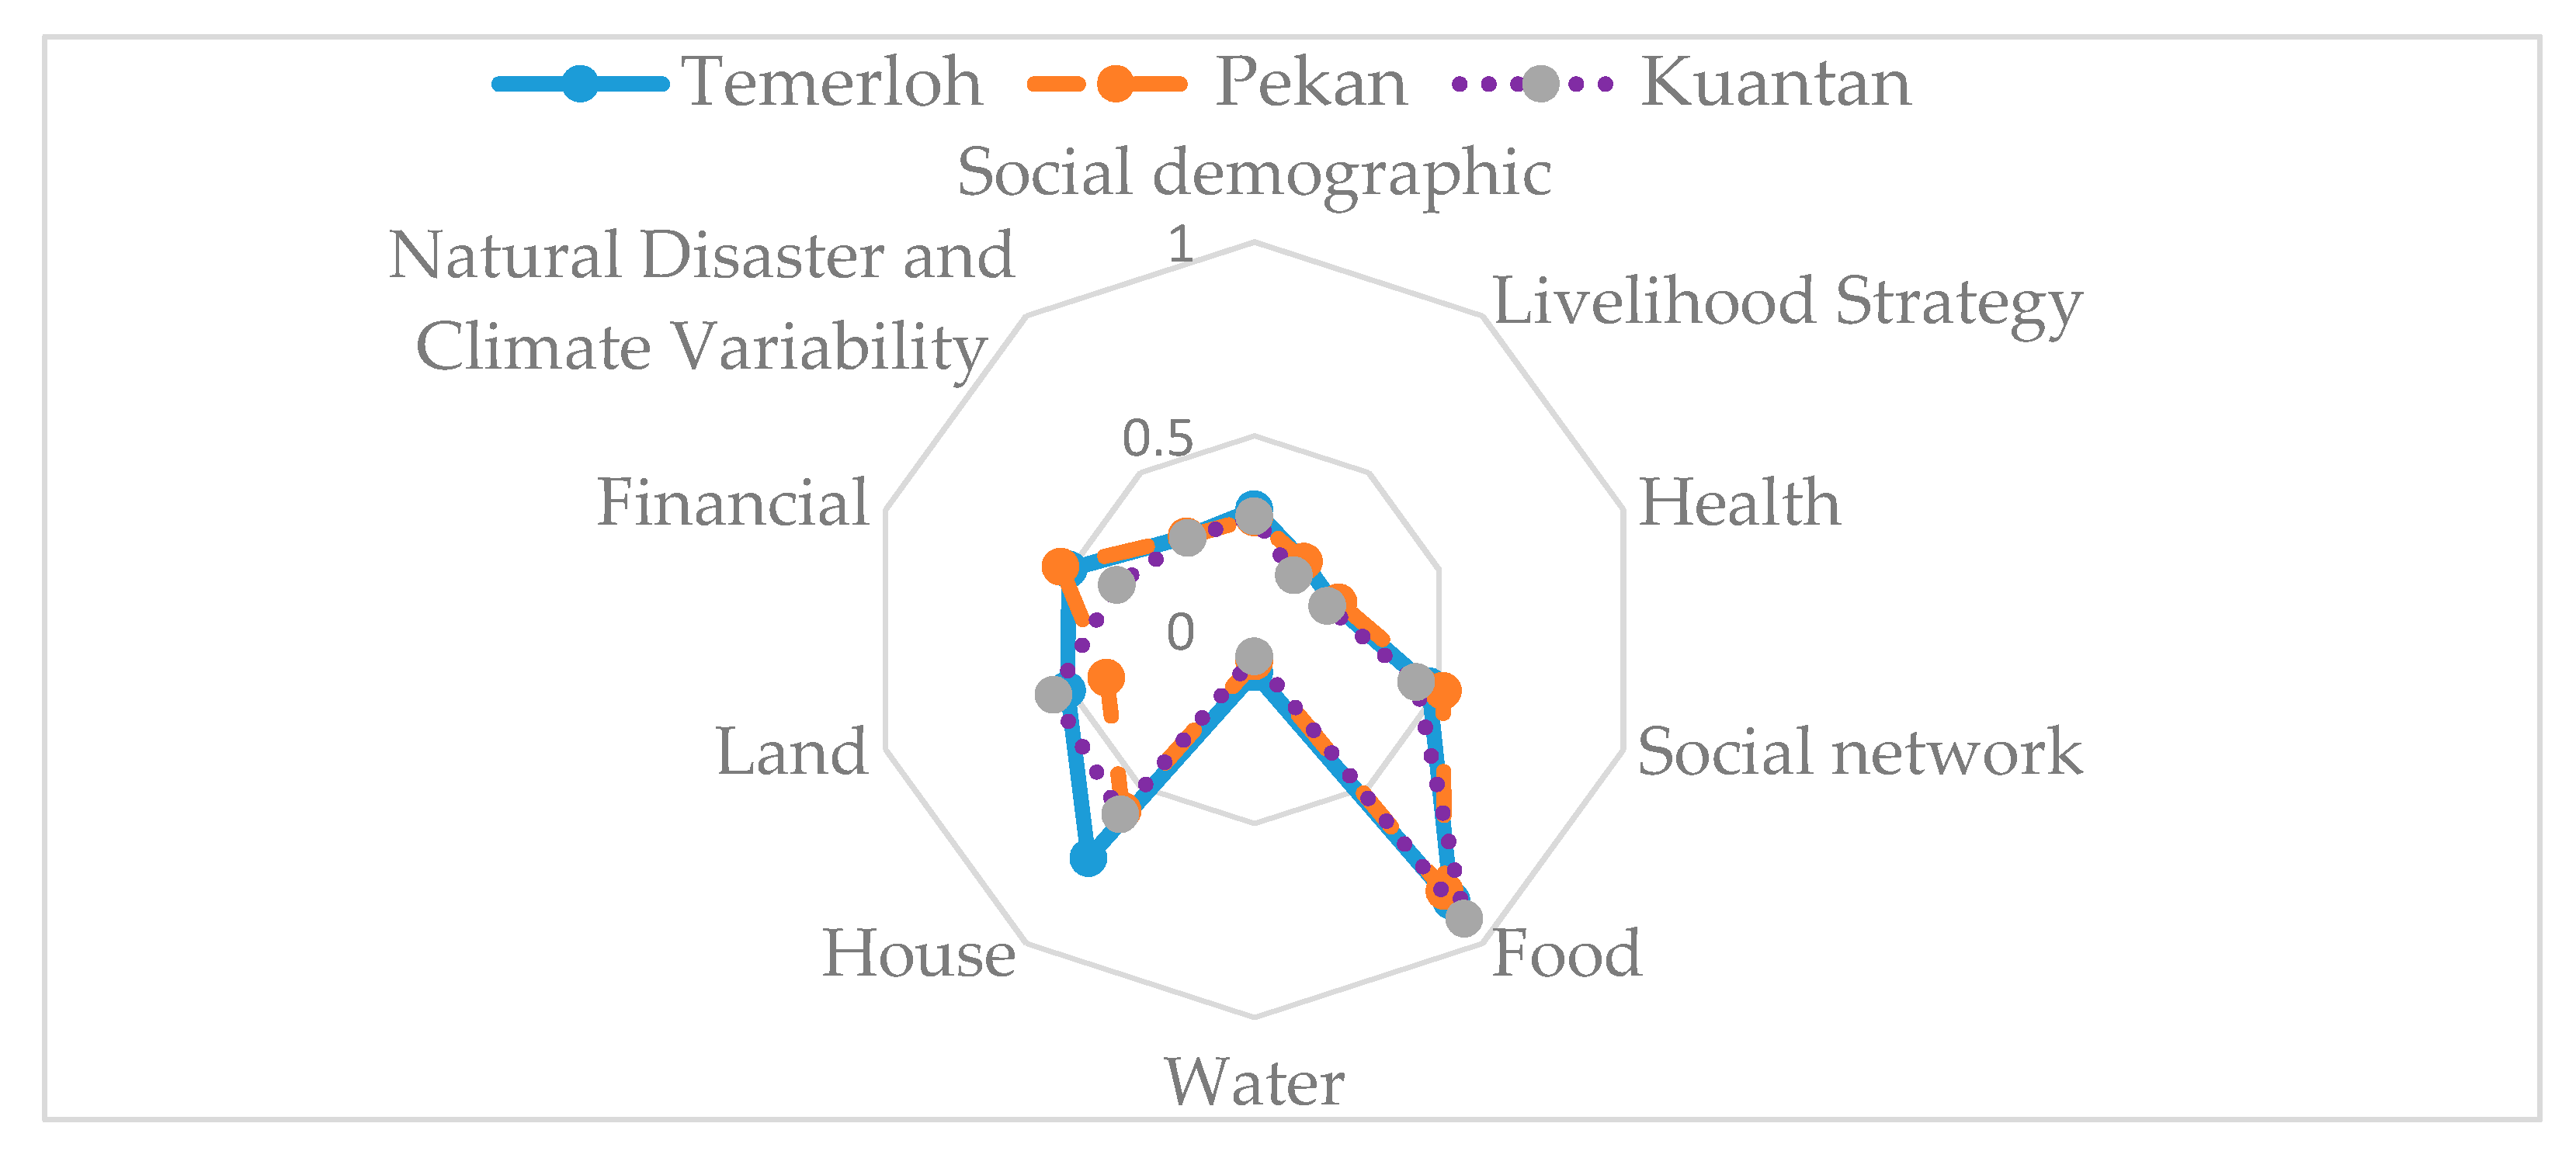
| Social demographic profile | 0.310 | 0.289 | 0.292 |
| Livelihood strategy | 0.217 | 0.217 | 0.173 |
| Health | 0.215 | 0.228 | 0.197 |
| Social network | 0.473 | 0.511 | 0.438 |
| Food | 0.864 | 0.834 | 0.921 |
| Water | 0.110 | 0.082 | 0.069 |
| House | 0.728 | 0.578 | 0.588 |
| Land | 0.600 | 0.455 | 0.621 |
| Finance | 0.503 | 0.525 | 0.373 |
| Natural disasters and climate variability | 0.297 | 0.297 | 0.292 |
| Livelihood vulnerability index (LVI) | 0.384 | 0.364 | 0.347 |
| Major Component | Major Component Index | ||
|---|---|---|---|
| T | P | K | |
| Social demographic profile | 0.3106 | 0.2897 | 0.2926 |
| Livelihood strategy | 0.2178 | 0.2179 | 0.1739 |
| Health | 0.2159 | 0.2288 | 0.1978 |
| Social network | 0.4735 | 0.5114 | 0.4384 |
| Food | 0.8641 | 0.8341 | 0.9211 |
| Water | 0.11010 | 0.08210 | 0.06910 |
| House | 0.7282 | 0.5782 | 0.5883 |
| Land | 0.6003 | 0.4555 | 0.6212 |
| Finance | 0.5034 | 0.5253 | 0.3735 |
| Natural disasters and climate variability | 0.2977 | 0.2976 | 0.2927 |
| Livelihood vulnerability index (LVI) | 0.384 | 0.364 | 0.347 |
| Major Element | Subcomponent | Subcomponent Index | Major Component Index | ||||
|---|---|---|---|---|---|---|---|
| T | P | K * | T | P | K * | ||
| Social demographic profile | Ratio of dependence | 0.098 | 0.129 | 0.105 | 0.310 | 0.289 | 0.292 |
| Percentage of female-headed families | 0.198 | 0.155 | 0.065 | ||||
| The average age of households led by women | 0.577 | 0.619 | 0.539 | ||||
| Families of heads of households that did not attend school | 0.010 | 0.030 | 0.045 | ||||
| The average number of members in families | 0.357 | 0.357 | 0.286 | ||||
| Percentage of families with orphans | 0.064 | 0.040 | 0.090 | ||||
| Percentage of households where a member did not have any formal or informal skills | 0.757 | 0.680 | 0.835 | ||||
| Percentage of poor households (income below RM490) | 0.415 | 0.300 | 0.371 | ||||
| Livelihood strategy | Households where a family member works in another community | 0.297 | 0.190 | 0.135 | 0.217 | 0.217 | 0.173 |
| Families solely dependent on agriculture as their primary income source | 0.050 | 0.070 | 0.015 | ||||
| Average agricultural livelihood diversification | 0.874 | 0.785 | 0.956 | ||||
| Agricultural work’s contribution to total income | 0.141 | 0.234 | 0.035 | ||||
| Percentage of household income with contributions from farming activities | 0.198 | 0.245 | 0.075 | ||||
| Percentage of households losing a job during flood season | 0.045 | 0.025 | 0.050 | ||||
| Percentage of households finding natural resources (during flood seasons) | 0.050 | 0.020 | 0.020 | ||||
| Percentage of fish-catching households (during flood seasons) | 0.079 | 0.170 | 0.100 | ||||
| Health | Percentage of family members with disease or illness | 0.035 | 0.060 | 0.060 | 0.215 | 0.228 | 0.197 |
| Percentage of households that do not keep medicines during flood seasons | 0.208 | 0.370 | 0.540 | ||||
| Percentage of households without access to a healthcare facility | 0.406 | 0.555 | 0.075 | ||||
| Average time to get to the nearest healthcare facility (at least one qualified doctor) | 0.217 | 0.283 | 0.183 | ||||
| For the last two weeks, percentage of family members that had to leave work or schooling due to flood-caused illness | 0.183 | 0.050 | 0.13 | ||||
| Percentage of households where family members had a disease or illness due to flooding | 0.243 | 0.050 | 0.195 | ||||
| Social network | Average money borrowing/ lending ratio | 0.933 | 1 | 0.300 | 0.473 | 0.511 | 0.438 |
| Number of households receiving government and NGO assistance (during flood seasons) | 0.96 | 0.890 | 0.705 | ||||
| Percentage of households with no access to telecommunications services | 0.178 | 0.070 | 0.195 | ||||
| Percentage of households not volunteering during flooding | 0.653 | 0.660 | 0.860 | ||||
| Percentage of households without information about flood evacuation centre | 0.054 | 0.105 | 0.190 | ||||
| Percentage of households that do not know how to get information related to floods | 0.005 | 0.060 | 0.235 | ||||
| Percentage of households not sharing information about the floods | 0.530 | 0.795 | 0.580 | ||||
| Food | Percentage of households that did not keep reserves of food during floods | 0.470 | 0.540 | 0.700 | 0.864 | 0.834 | 0.921 |
| Average crop diversity index | 0.899 | 0.823 | 0.976 | ||||
| Average livestock diversity index | 0.975 | 0.948 | 0.973 | ||||
| Percentage of households not storing crops | 1 | 0.945 | 0.985 | ||||
| Percentage of households without their own vegetable garden | 0.975 | 0.915 | 0.970 | ||||
| Water | Percentage of households using natural water resources | 0.020 | 0.020 | 0.020 | 0.110 | 0.082 | 0.069 |
| Percentage of households lacking a steady source of water | 0.015 | 0.030 | 0.005 | ||||
| Percentage of households that need to go far to get water | 0.015 | 0.015 | 0.035 | ||||
| Households that have stored water | 0.104 | 0.065 | 0.165 | ||||
| Average distance to water source | 0.500 | 0.333 | 0.186 | ||||
| The inverse of the average number of litres of water stored per household (range: 0–1) | 0.006 | 0.030 | 0 | ||||
| House | Percentage of households without a well-built house (wood/semi-wood) foundation | 0.545 | 0.560 | 0.250 | 0.728 | 0.578 | 0.588 |
| Percentage of houses not built high enough to avoid floods | 0.827 | 0.730 | 0.965 | ||||
| Percent of households affected by floods | 0.812 | 0.445 | 0.550 | ||||
| Land | Percentage of households not owning land on which they reside (landless) | 0.371 | 0.215 | 0.310 | 0.600 | 0.455 | 0.621 |
| Percentage of households with a strictly limited area of land (0.1–0.5 ha) | 0.702 | 0.545 | 0.865 | ||||
| Percentage of households without fertile land | 0.955 | 0.845 | 1 | ||||
| Finance | Households whose incomes are affected by floods | 0.248 | 0.150 | 0.100 | 0.503 | 0.525 | 0.373 |
| Percentage of households that fall under B40 category | 0.965 | 0.915 | 0.855 | ||||
| Households affected by the burden of a loan | 0.055 | 0.280 | 0.080 | ||||
| Percentage of households that did not save money | 0.743 | 0.755 | 0.455 | ||||
| Natural-disasters and climate variability | The total number of flood events over the previous seven years (range: 0–7) | 0.912 | 0.916 | 0.896 | 0.297 | 0.297 | 0.292 |
| Percentage of households that did not receive early flood warnings | 0.312 | 0.065 | 0.230 | ||||
| Percentage of households with physical assets damaged by flooding | 0.396 | 0.220 | 0.275 | ||||
| Percentage of family members who had accidents or died in the last seven years due to the floods | 0.040 | 0.110 | 0.010 | ||||
| Average annual rainfall | 0.077 | 0.155 | 0.157 | ||||
| Average monsoon rainfall | 0.045 | 0.318 | 0.185 | ||||
| Livelihood vulnerability index (LVI) | 0.384 | 0.364 | 0.347 | ||||
| Contributing Factors | Temerloh | Pekan | Kuantan |
|---|---|---|---|
| Adaptive Strategy | 0.327 | 0.332 | 0.295 |
| Sensitivity | 0.444 | 0.410 | 0.411 |
| Exposure | 0.297 | 0.297 | 0.292 |
| Overall LVI − IPCC | −0.013 | −0.014 | −0.001 |
Publisher’s Note: MDPI stays neutral with regard to jurisdictional claims in published maps and institutional affiliations. |
© 2021 by the authors. Licensee MDPI, Basel, Switzerland. This article is an open access article distributed under the terms and conditions of the Creative Commons Attribution (CC BY) license (http://creativecommons.org/licenses/by/4.0/).
Share and Cite
Nurul Ashikin, A.; Nor Diana, M.I.; Siwar, C.; Alam, M.M.; Yasar, M. Community Preparation and Vulnerability Indices for Floods in Pahang State of Malaysia. Land 2021, 10, 198. https://doi.org/10.3390/land10020198
Nurul Ashikin A, Nor Diana MI, Siwar C, Alam MM, Yasar M. Community Preparation and Vulnerability Indices for Floods in Pahang State of Malaysia. Land. 2021; 10(2):198. https://doi.org/10.3390/land10020198
Chicago/Turabian StyleNurul Ashikin, Alias, Mohd Idris Nor Diana, Chamhuri Siwar, Md. Mahmudul Alam, and Muhamad Yasar. 2021. "Community Preparation and Vulnerability Indices for Floods in Pahang State of Malaysia" Land 10, no. 2: 198. https://doi.org/10.3390/land10020198